supplemental material segmentifier: interactive refinement of clickstream … · 2019-04-22 ·...
TRANSCRIPT

Supplemental MaterialSegmentifier: Interactive Refinement of Clickstream Data
K. Dextras-Romagnino and T. Munzner
University of British Columbia, Canada
Abstract
Section S1 discusses the derived Action Hierarchy in detail, with Figure S1 showing a side-by-side comparison of the layout and coloring at each of the three levels. Subsequentsections contain only images with captions. Section S2 shows alternate modes of the Sequence Detail section. Section S3 provides a detailed explanation of the Operation Buildersfor ranges and actions, including the design of the operation glyphs. Sections S4 and S5 contain full screenshots of every step of Analysis #1 and Analysis #2 of the case study withour domain expert, to further clarify the visual encodings and linked-view interaction and document how the high-level Segmentifier model is concretely instantiated through ourinterface. Figures S5 to S16 describe Analysis #1 where 200,000 per-session sequences are loaded into the tool, each representing one user session. Figures S17 to S25 describeAnalysis #2 where 200,000 per-client sequences are loaded each representing all actions performed by that user.
S1 Action HierarchyNone of our abstract tasks require distinguishing between every single page on a site. Although websites can have hundreds or thousands of unique pages, the number ofaction types recorded in clickstream logs ranged from tens to hundreds in the clickstream datasets gathered by our interviewees. The types of page views that are trackedvaries across websites. The core actions tracked usually include the 4 important e-commerce actions of adding to cart, removing from cart, searching, and purchasing; and3 site functionality actions of loading, errors, and site-specific custom features. All three hierarchy levels include the full set of 7 e-commerce and site actions. The coarsestRoll-up level groups all page views together into a single aggregate action, the Mid-level has 6 types, and the Detailed level has page views grouped into 17 types. We derivedthese groupings manually based on inspecting multiple clickstream logs and observing consistent tracking patterns.
We chose to manually create the spatial layouts of the Action Transition Network, shown for all three levels in Figure S1. The action hierarchy does not change dynamically,and our primary goal was to test the utility of the derived action hierarchy data abstraction with a visual encoding that was well tuned to reveal its structure. The spatial layoutof the nodes emphasize the action hierarchy structure by providing spatial consistency between views, in order to help analysts spot patterns. The number of nodes in thenetwork is the same for each segment, and nodes are always placed at the same fixed positions at each hierarchy level. The data-driven aspect that changes for the selectedsegment are the edges: the transition counts serve as quantitative edge weights that control line thickness. Zero weight indicates that there is no transition between a pair ofactions in any of the sequences and the line is not drawn. The incoming and outgoing direction are computed separately, and edge drawing can be filtered by weight with themin visible link slider. All three layouts preserve the relative positions of the e-commerce actions at the bottom and site functionality actions at the top. The pageview regionin the middle has detailed-level actions positioned close to others within the same mid-level group, and preserves relative positions of the mid-level groups. The design targetshigh information density for maximum label legibility, with minimal edge crossings. The total chart size varies according to the hierarchy level.
Similarly, we chose to manually design a color palette that preserves visual consistency between levels. These colors are used consistently all elements representing actionsacross all Segmentifier views. We chose identical colors for the 7 actions that appear across all levels. We had competing goals of maximum distinguishability between the fullset of 24 colors that are visible simultaneously at the detailed level, and yet similarity between color families for the detailed-level actions that fall within the same mid-levelaction group (where the largest group has size 6).
1
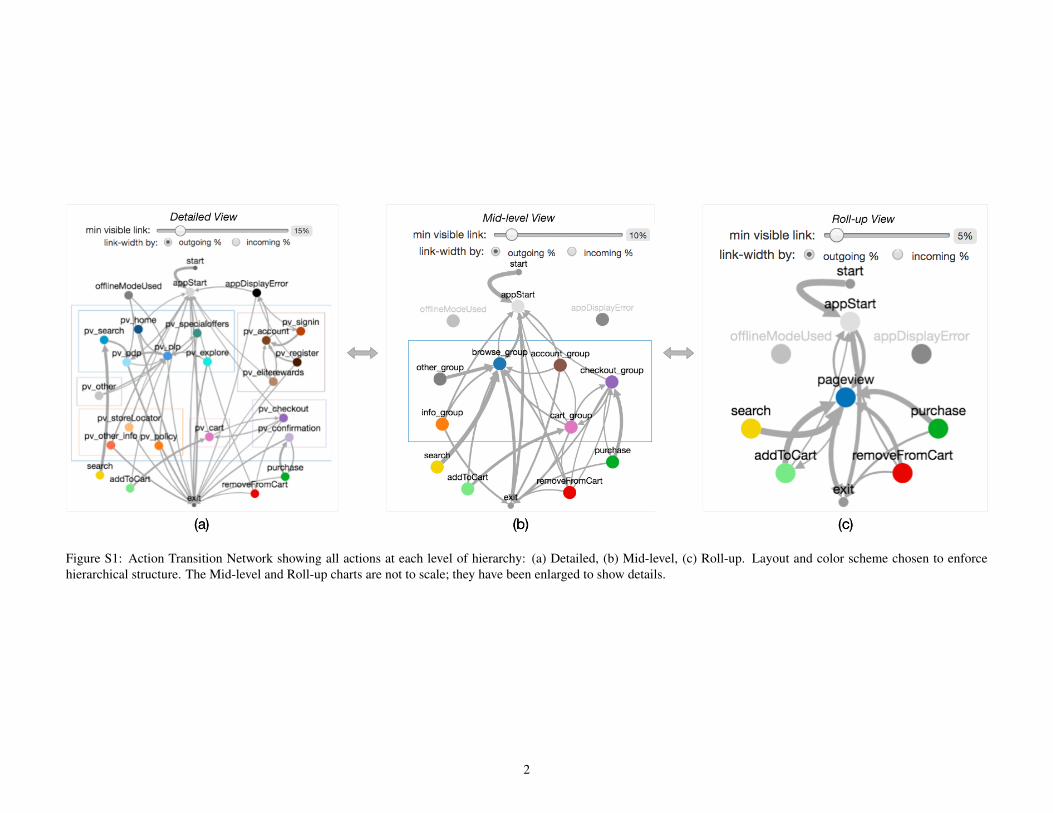
Figure S1: Action Transition Network showing all actions at each level of hierarchy: (a) Detailed, (b) Mid-level, (c) Roll-up. Layout and color scheme chosen to enforcehierarchical structure. The Mid-level and Roll-up charts are not to scale; they have been enlarged to show details.
2

S2 Sequence Details
Figure S2: Sequence Details. Sequence frequencies shown with labelled blue bars, with actions encoded by boxes with unique color and letters. (a) Full sequences. (b)Consecutive actions collapsed.
3

S3 Operation Builders
Figure S3: Examples of Ranges Operation Builders, with corresponding glyphs. The glyphs concisely show the type of operation and the attribute used through an icon on theleft: time-related attributes have a clock symbol and a unique letter indicating the specific chart, and attributes related to action counts have a hash sign within a circle coloredby the specific action. The main region of the glyph indicates selected values: when filtering the blue shaded portion of the rectangle shows the user-selected range comparedto the full range of values for the specified attribute, and when partitioning the position of the lines show the assigned value of the partitions compared to the full range. (a)Filtering down dates to the month of October using sliders. (b) The analyst uses the NOT option to select all values that are outside regular working hours. (c) The result ofselecting the purchase count chart and adding three partition bars at values 1, 2, and 8. (d) Adding only a single partition bar to compare sequences that lasted less versus morethan an hour.
4

Figure S4: Examples of Actions Operation Builders with corresponding operation glyphs. Colored circles represent the actions, touching to show consecutive links andseparated to show non-consecutive ones. (a) A non-consecutive action pattern filter at the Detailed action hierarchy level. (b) A consecutive action pattern NOT filter at theRoll-up level, with a dark grey background for both the builder and the glyph to signal the inversion.
5

S4 Case Study: Analysis #1
Figure S5: Case Study Analysis #1: The initial state of the interface when 200,000 sequences, each representing a user session, are loaded in. The initial segment includingthe 200,000 sequences is shown as a blue rectangle in the Analysis Paths view in the middle. The Segment Inspector view on the right shows information about the underlyingdata of the segment including ordinal and categorical segment attributes and the actual sequences. The analyst has thus far chosen to show only two per-action histograms, forAPPSTART and APPDISPLAYERROR.
6

Figure S6: The analyst first narrows down to purchasers by filtering segments that contain a PURCHASE action and from those they filter out segments that follow all fiveactions required to purchase an item and those that do not. They add the CHECKOUT chart to the Ranges section on the right, notice that 3 pages seem to be required toproperly check out from this page, and click on that chart to start creating a partition operation in the Ranges Operation Builder on the left. They build a partition operation todetermine which sequences had fewer than, equal to, or more than that expected number of checkout pages and apply it to the segment containing all five purchasing actions.The Operation Inspector view on the left shows that 15% of sessions contain fewer, 48% equal to, and 37% more.
7

Figure S7: The analyst decides to further analyze those who viewed more checkout pages than expected by determining those that viewed four and then five in a row. Theyused the Actions Operation Builder to specify that many consecutive actions, as we can tell from the glyphs in Operations Inspector in the upper left showing the path to theselected segment at the bottom of this analysis path. It contains only 289 sequences, and the raw sequences in the Sequence Detail view on the bottom right are quite long forthis uncommon behavior.
8

Figure S8: The analyst decides to go back up the tree to select the segment on the right side of the Analysis Paths view to check the number of sessions that include a purchaseaction but not all five actions of the purchasing funnel. The Operation Inspector shows them that 28% of users do not complete a purchase in one session but return in a latersession to do so.
9

Figure S9: The analyst continues their inquiry by investigating how many of the five actions in the purchasing funnel are completed in one session through multiple roundsof splits using the Actions Operation Builder to indicate which actions are not contained in the segment. They notice that 16% of users that make it to checkout must havereturned after a previous session, since they PURCHASE without having conducted the other required actions in this session.
10

Figure S10: The analyst decides to investigate a hypothesis that behavior changes depending on the time of day so they return to the root segment of the Analysis Paths tree tostart new analysis paths. They click on the Start Hour chart from the Ranges section of the Segment Inspector view in the upper right and select a two-hour segment from 7to 9am, which automatically populates the Filter tab of the Ranges Operation Builder accordingly, and they hit the Apply button to create that new segment. They then do thesame for the 7-9pm range, and they see there are more such sequences: around 31K at night vs. around 20K in the morning.
11

Figure S11: They first investigate the percentage of sequences that contain the full purchasing funnel with the hypothesis that users spend more time browsing and purchasingat night compared to the morning when users are usually commuting to work. However, using the Operation Inspector, they discover that the results are similar: although theabsolute counts differ, the relative proportion of around 2% of sessions is the same for both time ranges.
12

Figure S12: They then investigate the number of actions in the sequences with the similar hypothesis that users may have longer sessions at night after dinner than in themorning commute time slot. By building partition operations and applying them to both segments, using the Operation Inspector, they discover a similar disconfirmatoryresult that the size of the partitions are also similar between both times.
13

Figure S13: The analyst decides to investigate sequences that contain an ADDTOCART action. However, after inspecting the data through the Segment Inspector, they did notdiscover anything worth exploring further and they abandon this analysis path.
14

Figure S14: The analyst also decides to investigate sequences that contain a REMOVEFROMCART action. Using the Selected Action Adjacency View on the right, they noticethat 18% of the time this action results in the end of a session.
15

Figure S15: The analyst decides to analyze the purchasing funnel by building the pattern of five actions in the Actions Operation Builder on the left and clicking Apply asFunnel. The result is shown in the Analysis Paths View. After selecting the final resulting segment, the details of the dropout of each step is shown in the Operation Inspectoron the top left.
16

Figure S16: The analyst decides to investigate the sequences that got to the checkout part of the purchasing funnel but did not purchase. The Operation Inspector shows thatthis occurs 37% of the time. Using the previously found insight in Figure S9 that 16% of users that check out are returning from a previous session, the analyst hypothesizesthat about 21% of users that get to checkout never come back to purchase.
17

S5 Case Study: Analysis #2
Figure S17: Case Study Analysis #2: The initial state of the interface when 200,000 per-client sequences are first loaded, representing all actions performed by user over theentire dataset time window. The Duration histogram axis now extends to 30 days with sharp dropoff, in contrast to the Analysis #1 segments where this histogram was usuallycapped at between 15 and 20 minutes with a much more uniform distribution. The Action Level at the top right is set to the default of Roll-up.
18

Figure S18: The analyst switches to the Detailed Action Level to get further details about pages viewed. They investigate users that make it to the checkout but do not purchase.The Select Action Adjacency View on the right shows that 25% of those users that REMOVEFROMCART leave the site and never return.
19

Figure S19: The analyst scrolls down the Segment Inspector view on the right and notices in the Sequence Details view at the bottom that an APPSTART action representedby the gray glyph occurs often before the CART action represented by the pink glyph. They confirm their observation using the Selected Action Adjacency Chart which showsthat 84% of the time an APPSTART action is generated before entering the cart. Followup investigation determined a problem with the cart pages of the website.
20

Figure S20: The analyst wants to investigate the impact of a new awards account whose pages are stored in the ELITEREWARDS pageview action. They first look at thepercentage of purchasers who signed up and discover by looking at the Operation Inspector that it is 6% of users.
21

Figure S21: The analyst investigates at which point of the purchasing funnel the users accessed the awards account by building and filtering by patterns of actions in theActions Operation Builder with the awards account action inserted at three different parts of the funnel. They discover based on the sizes of the three resulting segments that itis accessed most frequently after ADDTOCART.
22

Figure S22: The analyst creates a new segment with sequences containing the ELITEREWARDS action and uses the Operation Inspector view to discover that 1% of users havesigned up for the awards account.
23

Figure S23: They investigate further by filtering sequences that contain a PURCHASE action and those that do not, discovering that 27% of users who access the rewardsaccount end up making a purchase.
24

Figure S24: The analyst switches to the Mid-level of the action hierarchy using the Action Level radio buttons at the top right corner to simplify the sequences. They notice inthe Operations Inspector that 83% of users access any ACCOUNT page before purchasing.
25

Figure S25: They investigate further to determine at what point of the purchasing funnel users access their account. They establish that it occurs most frequently beforeADDTOCART.
26