supplemental methods mice cre/+ lacz...
TRANSCRIPT

Supplement Material S1
Supplemental Methods
Mice
In order to generate double transgenic mice Tbx3Cre/+
, R26RlacZ
and Nppa::Cre3 mice were
crossed with Tbx18+/GFP
heterozygous mice. Genomic DNA prepared from amnion or toe
biopsies was used for genotyping by PCR. Following primers were used: Tbx18 wild type
allele (forward: GCG CGG AAA AGG GCT CGG and reverse: AGG AAG CTA CTG TCT
GGG G), Tbx18 mutant allele (forward: GAC AAC CAC TAC CTG AGC AC and reverse:
CCG GCT TTG GTG ATG ATC), Tbx3 wild type allele (forward: AGC GGA GCC AAG
CCA GCA and reverse: CCT TGG CCT CCA GGT GCA C), Tbx3 mutant allele (forward:
see wild type allele and reverse: see Cre reverse primer), EGFP (forward: CGA CGT AAA
CGG CCA CAA GTT and reverse: TTG ATG CCG TTC TTC TGC TTG T), Cre (forward:
GGT TCG CAA GAA CCT GAT GGA CAT and reverse: GCT AGA GCC TGT TTT GCA
CGT TCA) and lacZ (forward: CTG CGC TGC GGG ACG CGC GAA TTG AAT TAT and
reverse: GAC ACC AGA CCA ACT GGT AGC GAC).
Collection and preparation of embryos
For timed pregnancies, vaginal plugs were checked in the morning after mating, noon was
taken as embryonic day (E) 0.5. Embryos of developmental stages between E10.5 and 17.5
were isolated for analysis. They were dissected in PBS and fixed in 4% paraformaldehyde
overnight for in situ hybridization or immunohistochemistry (detection of GFP, cleaved
caspase-3, BrdU and TUNEL assay), respectively. Embryos used for beta-galactosidase
activity detection and immunohistochemistry (Hcn4, Connexin 40) were fixed in 4%
paraformaldehyde for 15 min on ice and then incubated in 10% sucrose overnight. Next day,
they were embedded in OCT Embedding medium and stored at -20°C.
Proliferation and apoptosis analysis
The proliferation (BrdU assay) and apoptosis (cleaved caspase-3 detection and TUNEL
assay) analyses were performed as described previously.1,2
ββββ-Galactosidase activity detection and immunohistochemistry
For detection of β-galactosidase activity 10 µm cryostat sections were fixed with 4%
paraformaldehyde for 10 minutes at room temperature, followed by X-gal staining. For
immunohistochemistry the following primary antibodies were used: rabbit polyclonal
antibodies against Hcn4 (1:250, Chemicon) and GFP (1:50, Santa Cruz Biotechnology) and
monoclonal antibodies against Cx40 (1:100, USBio) and MF20 (1:50, Hybridoma bank, Iowa
City, IA, USA). Immunohistochemical analysis of Hcn4 and Connexin 40 was performed on
10 µm cryostat sections. In order to block endogenous mouse IgG, sections used to detect
Cx40 were pre-incubation with an unconjugated Fab fragment goat anti-mouse IgG (H+L)
(1:10, Jackson ImmunoResearch Laboratories). Secondary antibodies were Alexa 568 goat
anti-rat, goat anti-rabbit (1:250, Molecular Probes) and Alexa 488 goat anti-mouse (1:400).
Nuclei were counterstained with SYTOX green / orange nucleic acid stain (Molecular
Probes) or DAPI (Molecular Probes), respectively. GFP expression was detected on 5 µm
paraplast sections. Non-fluorescent staining was performed using kits from Vector
Laboratories (ABC peroxidase kit (Rabbit IgG), DAB substrate kit).
Non-radioactive in situ hybridization
Non-radioactive in situ hybridization on sections was performed as described.3 RNA probes
were kindly provided for Nkx2-5 (R. Harvey, Victor Chang Cardiac Research Institute,
University of New South Wales), Hcn4 (B. Santoro, Center for Neurobiology and Behavior,
Supplement Material S2
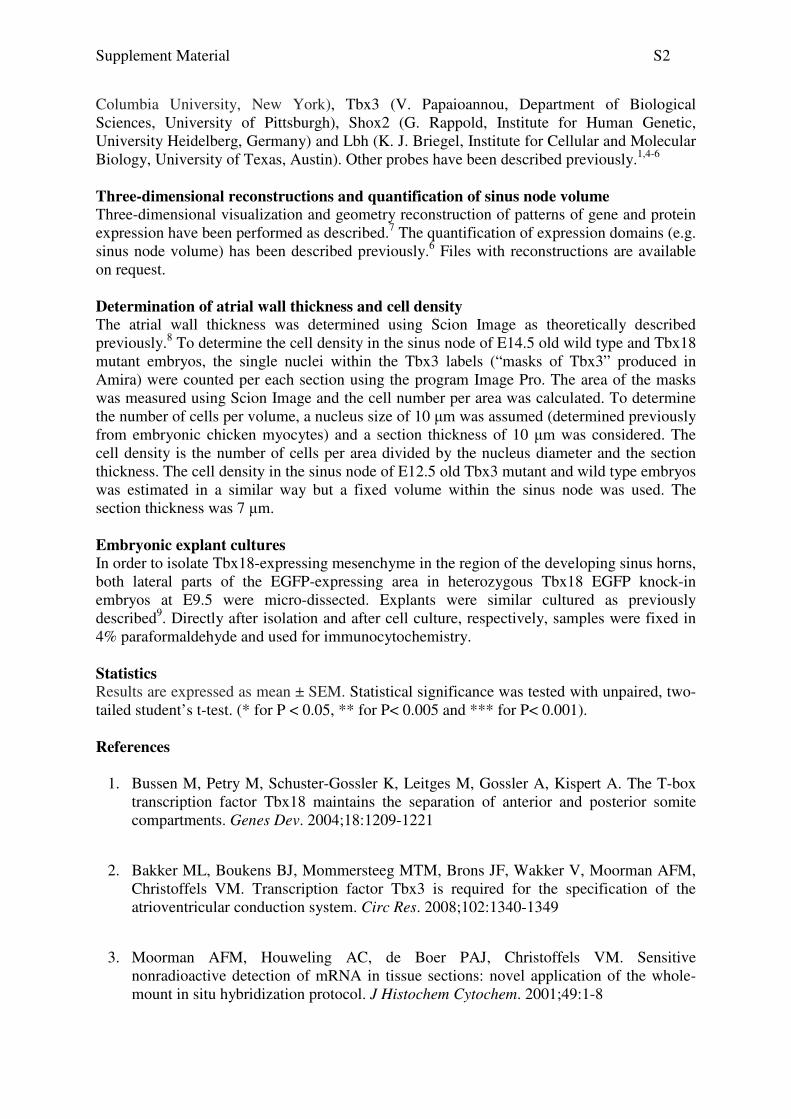
Columbia University, New York), Tbx3 (V. Papaioannou, Department of Biological
Sciences, University of Pittsburgh), Shox2 (G. Rappold, Institute for Human Genetic,
University Heidelberg, Germany) and Lbh (K. J. Briegel, Institute for Cellular and Molecular
Biology, University of Texas, Austin). Other probes have been described previously.1,4-6
Three-dimensional reconstructions and quantification of sinus node volume
Three-dimensional visualization and geometry reconstruction of patterns of gene and protein
expression have been performed as described.7 The quantification of expression domains (e.g.
sinus node volume) has been described previously.6 Files with reconstructions are available
on request.
Determination of atrial wall thickness and cell density
The atrial wall thickness was determined using Scion Image as theoretically described
previously.8 To determine the cell density in the sinus node of E14.5 old wild type and Tbx18
mutant embryos, the single nuclei within the Tbx3 labels (“masks of Tbx3” produced in
Amira) were counted per each section using the program Image Pro. The area of the masks
was measured using Scion Image and the cell number per area was calculated. To determine
the number of cells per volume, a nucleus size of 10 µm was assumed (determined previously
from embryonic chicken myocytes) and a section thickness of 10 µm was considered. The
cell density is the number of cells per area divided by the nucleus diameter and the section
thickness. The cell density in the sinus node of E12.5 old Tbx3 mutant and wild type embryos
was estimated in a similar way but a fixed volume within the sinus node was used. The
section thickness was 7 µm.
Embryonic explant cultures
In order to isolate Tbx18-expressing mesenchyme in the region of the developing sinus horns,
both lateral parts of the EGFP-expressing area in heterozygous Tbx18 EGFP knock-in
embryos at E9.5 were micro-dissected. Explants were similar cultured as previously
described9. Directly after isolation and after cell culture, respectively, samples were fixed in
4% paraformaldehyde and used for immunocytochemistry.
Statistics
Results are expressed as mean ± SEM. Statistical significance was tested with unpaired, two-
tailed student’s t-test. (* for P < 0.05, ** for P< 0.005 and *** for P< 0.001).
References
1. Bussen M, Petry M, Schuster-Gossler K, Leitges M, Gossler A, Kispert A. The T-box
transcription factor Tbx18 maintains the separation of anterior and posterior somite
compartments. Genes Dev. 2004;18:1209-1221
2. Bakker ML, Boukens BJ, Mommersteeg MTM, Brons JF, Wakker V, Moorman AFM,
Christoffels VM. Transcription factor Tbx3 is required for the specification of the
atrioventricular conduction system. Circ Res. 2008;102:1340-1349
3. Moorman AFM, Houweling AC, de Boer PAJ, Christoffels VM. Sensitive
nonradioactive detection of mRNA in tissue sections: novel application of the whole-
mount in situ hybridization protocol. J Histochem Cytochem. 2001;49:1-8

Supplement Material S3
4. Kraus F, Haenig B, Kispert A. Cloning and expression analysis of the mouse T-box
gene Tbx18. Mech Dev. 2001;100:83-86
5. Delorme B, Dahl E, Jarry-Guichard T, Marics I, Briand JP, Willecke K, Gros D,
Théveniau-Ruissy M. Developmental regulation of connexin40 gene expression in
mouse heart correlates with the differentiation of the conduction system. Dev Dyn.
1995;204:358-371
6. Hoogaars WMH, Tessari A, Moorman AFM, de Boer PAJ, Hagoort J, Soufan AT,
Campione M, Christoffels VM. The transcriptional repressor Tbx3 delineates the
developing central conduction system of the heart. Cardiovasc Res. 2004;62:489-499
7. Soufan AT, Ruijter JM, van den Hoff MJB, de Boer PAJ, Hagoort J, Moorman AFM.
Three-dimensional reconstruction of gene expression patterns during cardiac
development. Physiol Genomics. 2003;13:187-195
8. Howard CV, Reed MG. Unbiased Stereology. Three-dimensional Measurement in
microscopy, ed1, Liverpool, UK, Bios Scientific Publishers, 1998, pp pp 246
9. Zaffran S, Kelly RG, Meilhac SM, Buckingham ME, Brown NA. Right ventricular
myocardium derives from the anterior heart field. Circ Res. 2004;95:261-268
Supplement Material S4
Online Figure I
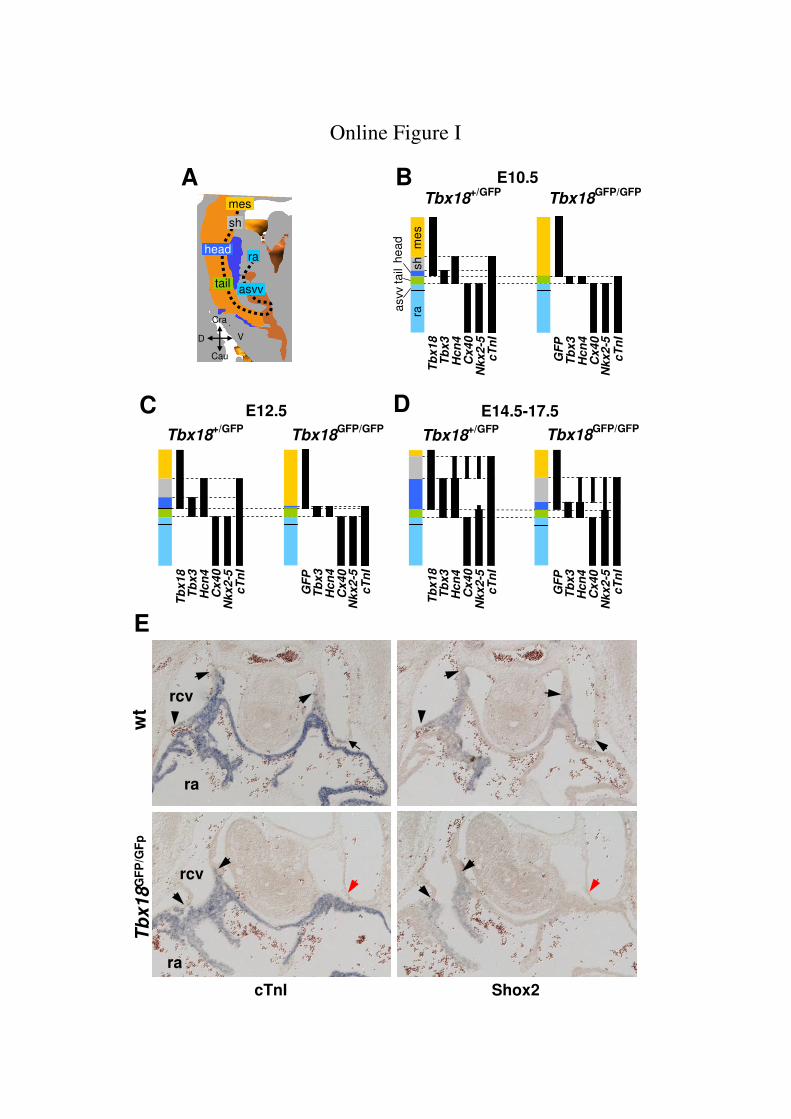
Gene expression patterns of the SAN and adjacent tissues in Tbx18-deficient and control
(wild-type or heterozygous) embryos at different developmental stages. A, Optical section
through the SAN region of the 3D reconstruction (description see figure legend 1). B, C and
D, linear representations of gene expression patterns in heterozygous and homozygous
Tbx18-mutant embryos at E10.5, E12.5 and E17.5, respectively. Description and color code
in the model correspond to the description shown in A. Black bars indicate specific gene
expression in the corresponding tissue. E, Analysis of Shox2 gene expression in Tbx18
mutant embryos (E11.5). Shown are in situ hybridizations on serial transversal sections using
probes for cardiac troponin I (cTnI) to label the myocardium and Shox2. The black arrows
indicate the myocardial border in wild type and Tbx18 mutant embryos and red arrows
demonstrate the absence of myocardium and Shox2 expression in the left superior caval vein
of Tbx18 mutant embryo. rsc, right superior caval vein; ra, right atrium.
Online Figure II
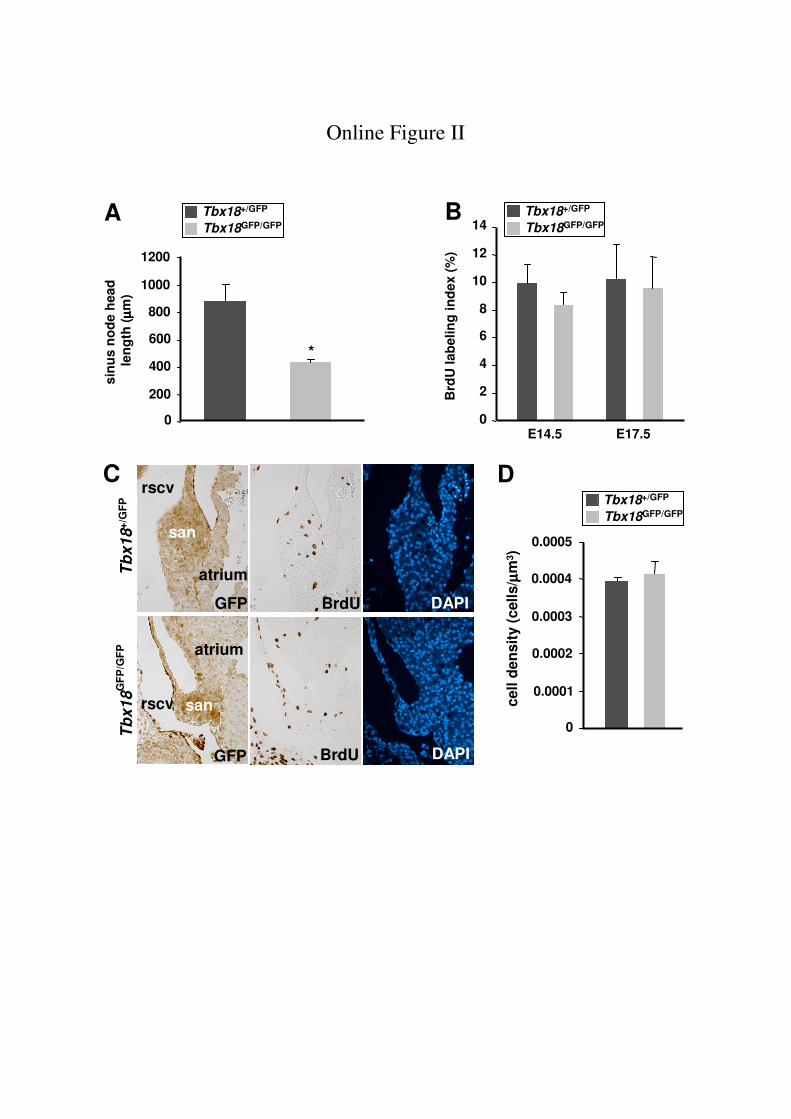
Characterization of the sinus node in Tbx18 mutant embryos. A, Determination of the length
(longitudinal axis along the rscv) of the sinus node head at E14.5. B, Determination of the
BrdU labeling index in the Tbx18/GFP-positive area of the sinus node at E14.5 and E17.5 in
Tbx18 mutant and heterozygous embryos (n=3 and 4, respectively). C,
Immunohistochemistry on E14.5 old heterozygous and Tbx18 homozygous mutant embryos
using GFP (Tbx18-positive cells), BrdU (proliferating cells) and DAPI (cell nuclei). D,
Determination of the cell density in the sinus node of E14.5 old wild type and Tbx18 mutant
embryos (n=3).
Online Figure III
Analysis of the function of Tbx3 in sinus node development. A, Determination of the sinus
node length (longitudinal axis along rscv) (E12.5, n=5 for wild type; n=3 for Tbx3Cre/Cre
). B
and C, Proliferation analysis using BrdU incorporation (E12.5), B, Quantification of the
BrdU labeling index in the sinus node head and the venous valve part of the sinus node
separately (n=4). C, Immunofluorescence staining showing BrdU (red) and nuclei (sytox
green, green). D, Determination of the cell density in the sinus node of E12.5 old Tbx3
mutant and wild type embryos (n=4).
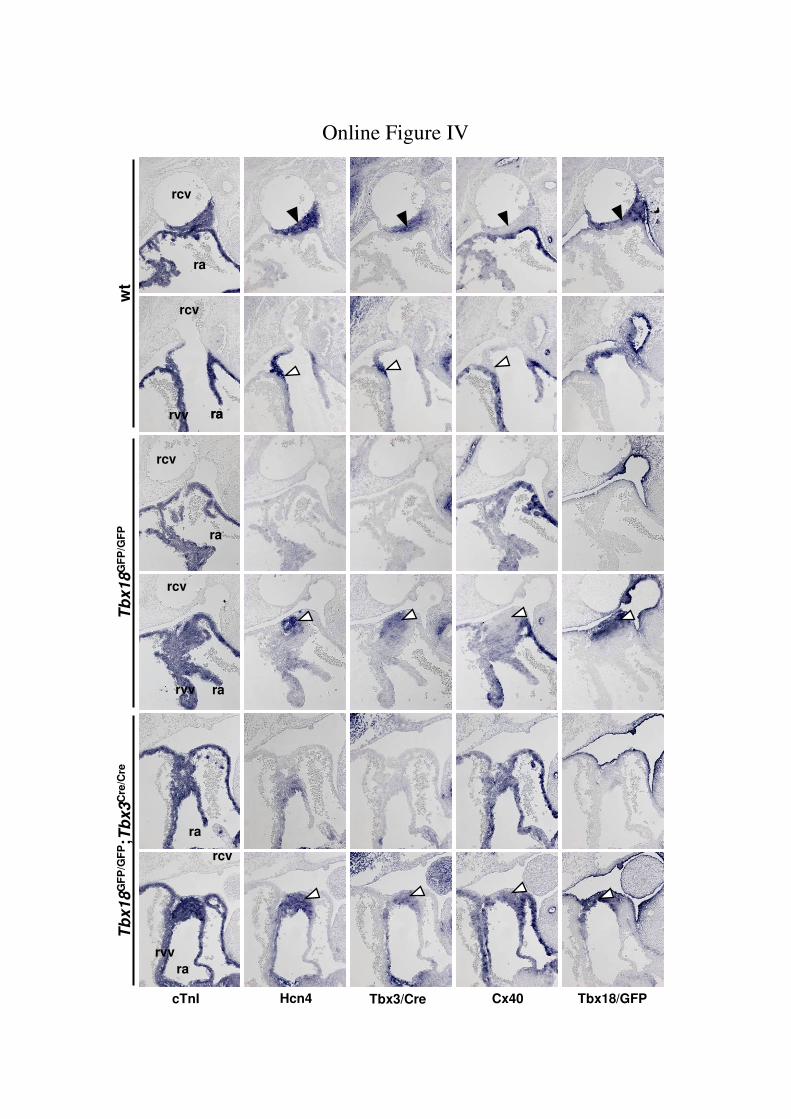
Online Figure IV
Analysis of the sinus node development in Tbx18-Tbx3 double homozygous embryos
(Tbx18+/GFP
;Tbx3+/Cre
) at E12.5. For description of the lower panel of each genotype see
Figure 7 description. Upper panel of each genotype shows the more distal part of the sinus
node head indicated by the black arrow. In Tbx18 mutant and Tbx18-Tbx3 double mutant
embryos the sinus node head (black arrow head in wild-type) is absent, whereas the tail
(white arrow head) is present.
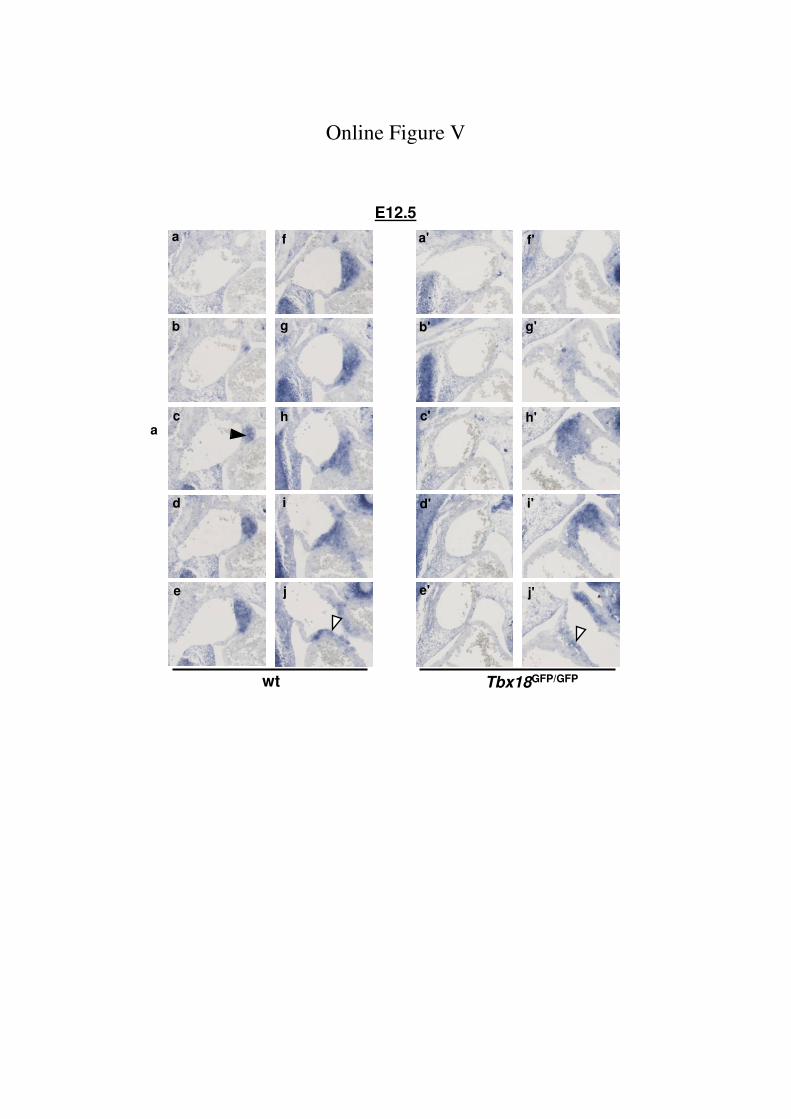
Online Figure V
Collection of 10 sections through the sinus node of a wild type and Tbx18 mutant embryo at
E12.5 used for 3D reconstructions shown in Figure 4A. a-k, in situ hybridizations of Tbx3 in
a wild type sinus node, a’-k’ in situ hybridizations of Tbx3 in a Tbx18 mutant sinus node.

Supplement Material S5
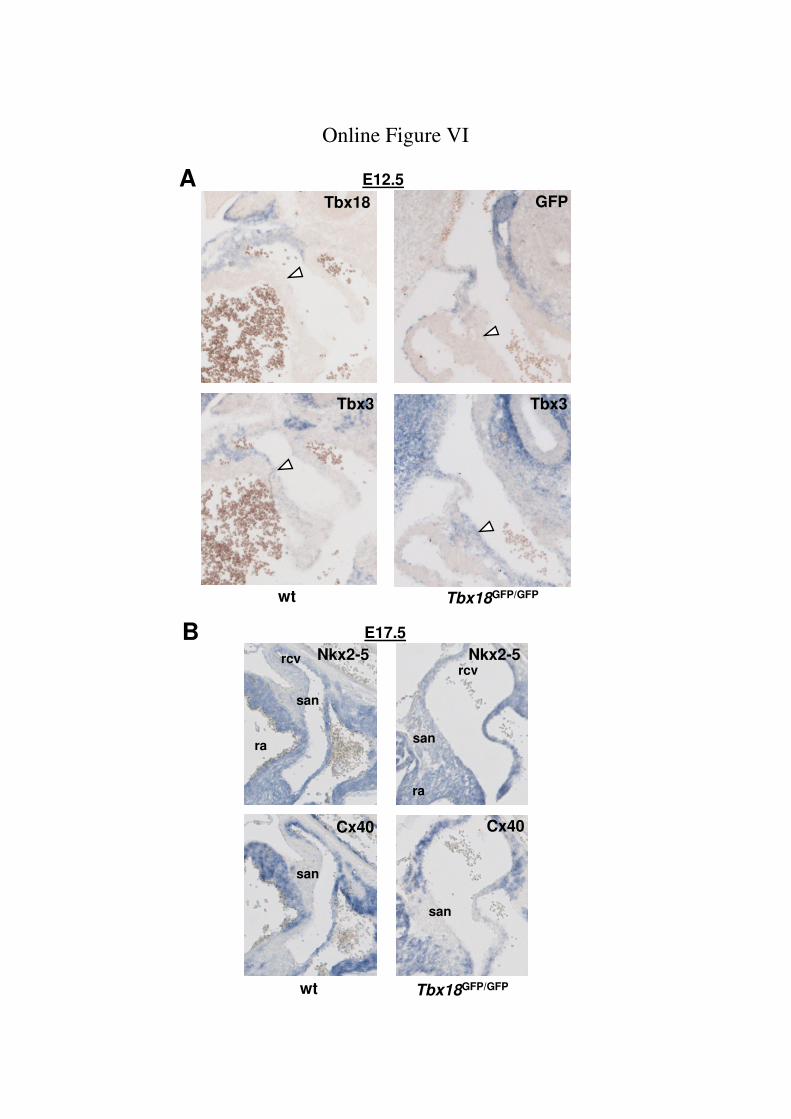
Online Figure VI
Characterization of the sinus node tail. A, The sinus node tail, which expresses Tbx3,
(indicated by a white arrow head) is negative for Tbx18 (wild type) and GFP (Tbx18 mutant
embryo), respectively. Shown is an E12.5 old embryo.
B, In the sinus node tail, which is negative for connexin 40 (Cx40), Nkx2-5 is gradually up-
regulated at E17.5 in wild type and Tbx18 mutant embryo.
cTnI Shox2
wt
Tb
x18
GF
P/G
Fp
ra
rcv
rcv
ra
Online Figure I
Tb
x1
8
Nk
x2
-5
Nk
x2
-5
Hc
n4
E12.5
Tb
x3
Hc
n4
Cx
40
cT
nI
Tb
x3
Cx
40
cT
nI
GF
P
he
ad
Tbx18+/GFP
rash
me
s
tail
asvv
E10.5
Tb
x3
Hc
n4
Cx
40
cT
nI
Tb
x1
8
Nk
x2
-5
B
Nk
x2
-5
Tb
x3
Hc
n4
Cx
40
cT
nI
GF
P
Tbx18GFP/GFP
A
V
Cra
Cau
D
ra
asvvtail
head
sh
mes
E14.5-17.5
Tb
x3
Hc
n4
Cx
40
cT
nI
Tb
x1
8
Nk
x2
-5
Nk
x2
-5
Tb
x3
Hc
n4
Cx
40
cT
nI
GF
P
CTbx18
+/GFPTbx18
GFP/GFP
DTbx18
+/GFPTbx18
GFP/GFP
E
A
0
200
400
600
800
1000
1200
sin
us n
od
e h
ead
len
gth
(µµ µµ
m)
*
Tbx18GFP/GFP
Tbx18+/GFP
C
rscv
atrium
GFP
BrdU
Tb
x1
8G
FP
/GF
PT
bx
18
+/G
FP
DAPI
san
rscv
GFP
BrdU DAPI
san
atrium
B
0
2
4
6
8
10
12
14
Brd
U lab
elin
g in
dex (
%)
E14.5 E17.5
Tbx18GFP/GFP
Tbx18+/GFP
D
0
0.0001
0.0002
0.0003
0.0004
0.0005
cell d
en
sit
y (
cells/ µµ µµ
m3)
Tbx18GFP/GFP
Tbx18+/GFP
Online Figure II

0
100
200
300
400
500
600
sin
us n
od
e
len
gth
(µµ µµ
m)
A
C
rscvrscv
rara
sansan
wt
BrdU/Sytox.BrdU/Sytox.
Tbx3Cre/Cre
0
2
4
6
8
10
12
14
16
18
Brd
U lab
elin
g in
dex (
%)
sinus node
head
venous
valve (tail)
B
**
wt
Tbx3Cre/Cre
D
0
0.0001
0.0002
0.0003
0.0004
0.0005
0.0006cell d
en
sit
y (
cells/ µµ µµ
m3)
wt
Tbx3Cre/Cre
wt
Tbx3Cre/Cre
Online Figure III
wt
Tb
x1
8G
FP
/GF
P;T
bx3
Cre
/Cre
Tb
x1
8G
FP
/GF
P
cTnI Hcn4 Tbx3/Cre Cx40 Tbx18/GFP
ra
ra
ra
ra
ra
ra
ra
rvv
rvv
rvv
rcv
rcv
rcv
rcv
rcv
Online Figure IV
Online Figure V
wt Tbx18GFP/GFP
E12.5
a
a
b
c
d
e
f
g
h
i
j
a'
b'
c'
d'
e'
f'
g'
h'
i'
j'
wt Tbx18GFP/GFP
E12.5
Online Figure VI
Tbx3 Tbx3
Tbx18 GFP
E17.5
wt Tbx18GFP/GFP
Nkx2-5 Nkx2-5
Cx40Cx40
B
A
ra
rcv
ra
rcv
san
san
san
san