supplemental nutrition assistance program education · pdf filesmart, live strong program...
TRANSCRIPT
Supplemental Nutrition Assistance Program Education and Evaluation Study (Wave II)
Michigan State University Extension’s Eat Smart, Live Strong Program
Volume I: Report
Nutrition Assistance Program Report December 2013 Food and Nutrition Service Office of Policy Support
Non-Discrimination Policy The U.S. Department of Agriculture (USDA) prohibits discrimination in all of its programs and activities on the basis of race, color, national origin, age, disability, and where applicable, sex (including gender identity and expression), marital status, familial status, parental status, religion, sexual orientation, political beliefs, genetic information, reprisal, or because all or part of an individual's income is derived from any public assistance program. (Not all prohibited bases apply to all programs.) Persons with disabilities who require alternative means for communication of program information (Braille, large print, audiotape, etc.) should contact USDA's TARGET Center at (202) 720-2600 (voice and TDD). To file a complaint of discrimination, write to USDA, Assistant Secretary for Civil Rights, Office of the Assistant Secretary for Civil Rights, 1400 Independence Avenue, S.W., Stop 9410, Washington, DC 20250-9410; or call toll-free at (866) 632-9992 (English) or (800) 877-8339 (TDD) or (866) 377-8642 (English Federal-relay) or (800) 845-6136 (Spanish Federal-relay). USDA is an equal opportunity provider and employer.
Supplemental Nutrition Assistance Program Education and Evaluation Study (Wave II)
Michigan State University Extension’s Eat Smart, Live Strong Program
Volume I: Report Authors: Valerie Long Sheryl Cates Jonathan Blitstein Julia Fantacone Katherine Kosa Loren Bell James Hersey Submitted by: Altarum Institute 2000 M Street N.W. Suite 400 Washington, DC 20036 Project Directors: Loren Bell Project Manager: Valerie Long
Submitted to: Office of Policy Support Food and Nutrition Service 3101 Park Center Drive Alexandria, VA 22302-1500 Project Officer: Anita Singh
This study was conducted under Contract number AG-3198-D-0096 with the Food and Nutrition Service, United States Department of Agriculture.
This report is available on the Food and Nutrition website: http://www.fns.usda.gov/research-and-analysis Suggested Citation: Long, V., Cates, S., Blitstein, J., Fantacone, J., Kosa, K., Bell, L. and Hersey, J. Supplemental Nutrition Assistance Program Education and Evaluation Study (Wave II): Michigan State University Extension’s Eat Smart, Live Strong Program. Volume I: Report. Prepared by Altarum Institute and RTI International for the U.S. Department of Agriculture, Food and Nutrition Service, December 2013
Food and Nutrition Service, Office of Policy Support December 2013

SNAP Education and Evaluation Wave II Case Study Report Michigan State University Extention’s ESLS Program i
This report was prepared by the Models of SNAP Education and Evaluation: Wave II project team at Altarum Institute and RTI International for the U.S. Department of Agriculture, Food and Nutrition Service (FNS), Office of Research and Analysis. Many individuals made important contributions to this report. From Altarum, the authors thank Gloria Aponte Clarke for her contributions to the development of the process data collection instruments. From RTI International, the authors thank Karen Morgan for her management of the impact data collection and Melanie Ball for her programming expertise. The authors also thank Deborah Finette, Debra Foulks and Stephen Gilberg from Altarum and Sharon Barrell from RTI International for preparing the report.
The authors would also like to thank the following individuals for their assistance in the study and development of this report.
● Department of Agriculture, Food and Nutrition Service Project officer, Anita Singh, who provided valuable advice and guidance throughout the study and in the planning and editing of this report.
● Department of Agriculture, Food and Nutrition Service Hoke Wilson, Sara Olson, and Carol Olander, who provided valuable advice and guidance throughout the planning phase of this study.
● Department of Agriculture, Food and Nutrition Service SNAP Program staff for their review of the draft reports: Danielle Berman, and Judy Wilson from the Office of Research and Analysis; as well as Usha Kalro and Gerry Howell from SNAP.
● Drs. Marilyn Townsend and Kathryn Sylva from the University of California-Davis for the use of the fruit and vegetable graphics for the participant surveys.
● Dawn Contreras, Olga Santiago, and Ben Chamberlain from Michigan State University Extension (MSUE) for their review of the draft report and sharing their insights and lessons learned about program planning, implementation and evaluation.
Finally, the authors would like to thank the many direct educators and senior center managers who answered our questions about their experiences with the MSUE program, and the seniors who completed the evaluation surveys and participated in focus group discussions. These individuals’ generous contribution of time and knowledge has helped create a valuable resource for the field.
SNAP Education and Evaluation Wave II Case Study Report Michigan State University Extention’s ESLS Program i
Table of Contents Executive Summary i
A. Background on SNAP-Ed ............................................................................................... i B. Overview of the ESLS Program ....................................................................................... ii C. Study Methodology ..................................................................................................... iii D. Process Evaluation Findings .......................................................................................... vi E. Impact Evaluation Findings .......................................................................................... vii F. Findings From the Assessment of MSUE’s Self-Evaluation ................................................ viii G. Recommendations ....................................................................................................... ix
Chapter I ● Introduction 1
A. Selection of Wave II Demonstration Projects ................................................................... 2 B. Overview of the ESLS Program ...................................................................................... 3 C. Organization of the Report ........................................................................................... 5
Chapter II ● Process Evaluation Methods and Results 6
A. Process Evaluation Methods .......................................................................................... 6 B. Program Development and Design ................................................................................. 9 C. How the ESLS Program Is Implemented ........................................................................ 11 D. Factors Affecting Program Implementation and Opportunities for Improvement ................... 24
Chapter III ● Impact Evaluation Methods and Results 32
A. Framework for the Impact Evaluation ........................................................................... 32 B. Methodology ............................................................................................................. 32 C. Impact Analysis Results .............................................................................................. 38
Chapter IV ● Assessment of MSUE’s Self-Evaluation 47
A. Methodology ............................................................................................................. 47 B. Description of MSUE’s Self-Evaluation ........................................................................... 48 C. Assessment of the Quality of MSUE’s Self-Evaluation ....................................................... 52 D. Comparison of Evaluation Methods and Results for the MSUE and Independent
Evaluations ............................................................................................................... 55 E. Lessons Learned ........................................................................................................ 59
Chapter V ● Conclusions and Discussion 62
A. Key Process Evaluation Findings: Factors Supporting Implementation ................................ 62 B. Key Process Evaluation Findings: Challenges to Implementation ....................................... 63 C. Key Impact Evaluation Findings .................................................................................... 64 D. Key Findings From the Assessment of MSUE’s Self-Evaluation........................................... 65 E. Recommendations ...................................................................................................... 65
SNAP Education and Evaluation Wave II Case Study Report Michigan State University Extention’s ESLS Program ii
List of Exhibits ● Figures ● Tables List of Exhibits
Exhibit I-1. Research Questions ............................................................................................................ 2
Exhibit I-2. Scoring Criteria Used for Demonstration Project Selection ....................................................... 3
Exhibit II-1. Data Collected for Framing the Process Evaluation of the MSUE Demonstration Project ............... 7
Exhibit II-2. MSUE Respondent Types, Data Collection Methods, and Number of Respondents ....................... 8
Exhibit II-3. Summary of ESLS Nutrition Education Messages and Planned Activities, by Lesson ................... 10
Exhibit II-4. Summary of MSUE Project Staff Roles and Responsibilities .................................................... 12
Exhibit II-5. Key Facilitators and Challenges to ESLS Implementation ....................................................... 25
Exhibit III-1. Primary and Secondary Outcome Measures for the ESLS Program Impact Evaluation ................ 34
Exhibit III-2. Summary of Instruments Used to Develop Impact Instruments for the ESLS Impact Evaluation ....................................................................................................................... 36
Exhibit IV-1. Description and Use of Data Sources for the Assessment of MSUE’s Self-Evaluation .................. 47
Exhibit IV-2. Objectives of the MSUE ESLS Program ................................................................................ 48
Exhibit IV-3. Summary of Strengths and Weaknesses of MSUE’s Self-Evaluation ......................................... 54
Exhibit IV-4. Comparison of Study Designs for the MSUE and Independent Evaluations ............................... 56
List of Figures
Figure ES-1. ESLS Program Components ................................................................................................. iii
Figure ES-2. Changes in Average Daily Consumption of Fruits and Vegetables Combined (increase of 0.52 cups, p < 0.01) ....................................................................................................... viii
Figure ES-3. Changes in Average Daily Consumption of Fruits (increase of 0.2 cups, p < 0.05) .................. viii
Figure ES-4. Changes in Average Daily Consumption of Vegetables (increase of 0.31 cups, p < 0.01) ........... viii
Figure ES-5. Add Fruits or Vegetables as Ingredients to Meals to Help Eat More Fruits or Vegetables (odds ratio = 1.93, p < 0.05) ..................................................................................................... viii
Figure II-1. How Participants Heard About ESLS Program ....................................................................... 15
Figure II-2. Number of Sessions Attended ............................................................................................ 17
Figure II-3. Reasons for Participation in ESLS Program .......................................................................... 18
Figure II-4. Reasons for Nonparticipation in ESLS Sessions ..................................................................... 19
Figure II-5. Number of Weekly Activity Sheets Completed ...................................................................... 20
Figure II-6. Level of Agreement With the Statement, “Filling out the activity sheets helped me to eat more fruits or vegetables” ................................................................................................. 20
Figure II-7. Level of Agreement With the Statement, “The information I learned at the sessions helped me to eat more fruits or vegetables” .................................................................................. 21
Figure II-8. Likelihood of Starting or Continuing to Eat More Fruits or Vegetables Each Day Since Finishing the Program ....................................................................................................... 22
Figure III-1. Baseline Distribution of Cups of Fruit Consumed by Participants in the ESLS Evaluation Study, by Condition .......................................................................................................... 41
Figure III-2. Baseline Distribution of Cups of Vegetables Consumed by Participants in the ESLS Evaluation Study, by Condition .......................................................................................................... 41
List of Tables
Table II-1. ESLS Program Reach ........................................................................................................ 16
Table II-2. Average Participant Exposure to ESLS Direct Education in Minutes ......................................... 17
Table II-3. Summary of MSUE Costs for Implementation of ESLS Program (FFY 2012) ................................ 23

SNAP Education and Evaluation Wave II Case Study Report Michigan State University Extention’s ESLS Program iii
Table III-1. Baseline Demographic Characteristics for Participants in the ESLS Evaluation, Participants Aged 60–80 ..................................................................................................................... 39
Table III-2. Dietary Intake: Primary Impacts for the Evaluation of the ESLS Program, Participants Aged 60–80 ............................................................................................................................. 43
Table III-3. Other Dietary Behaviors: Secondary Impacts for the Evaluation of the ESLS Program, Participants Aged 60–80 ................................................................................................... 44
Table III-4. Shopping and Food Preparation Behaviors: Secondary Impacts for the Evaluation of the ESLS Program, Participants Aged 60–80 .............................................................................. 45
Table III-5. Other Outcomes for the Evaluation of the ESLS Program, Participants Aged 60–80 ................... 46
Table IV-1. Number of Participants for the MSUE Self-Evaluation, by Age Group ....................................... 50
Table IV-2. Summary of MSUE Costs for Evaluation of ESLS (FFY 2012) .................................................. 52
Table IV-3. Assessment Scores for the MSUE Self-Evaluation ................................................................. 53
Table IV-4. Results for MSUE Self-Evaluation for GLM Models: Difference from Baseline to Follow-Up Between Intervention and Comparison Group With and Without Covariate Adjustment.............. 57
Table IV-5. Results for MSUE Self-Evaluation for Ordinary Least Squares Difference-in-Difference Regression Models: Difference From Baseline to Follow-Up Between Intervention and Comparison Group With and Without Covariate Adjustment ................................................... 57
Table IV-6. Comparison of Results for the Independent Evaluation and the MSUE Self-Evaluation, Participants Aged 60–80 ................................................................................................... 58
List of Appendices (available in Volume II at http://www.fns.usda.gov)
Appendix A. Process Evaluation Data Collection Instruments
Appendix B. Process Evaluation Data and Supplemental Information
Appendix C. Participant Survey Instruments
Appendix D. Participant Survey Supplemental Materials
Appendix E. Impact Evaluation Methodological Analyses
Appendix F. Instruments for Assessment of Demonstration Project’s Evaluation
Appendix G. Process Evaluation Methodology
Appendix H. Impact Evaluation Methodology
Appendix I. Methodology for Assessment of the Demonstration Project’s Evaluation
Appendix J. References
SNAP Education and Evaluation Wave II Case Study Report Michigan State University Extension’s Eat Smart, Live Strong Program i
Executive Summary This executive summary presents the background, methods and highlights key findings from one of three case study reports produced for the Models of SNAP Education and Evaluation, Wave II. This report is specific to the evaluation of the Michigan State University Extension (MSUE) Eat Smart, Live Strong (ESLS) Supplemental Nutrition Assistance Program-Education (SNAP-Ed) demonstration project. The evaluation, which was sponsored by the Food and Nutrition Service (FNS) of the U.S. Department of Agriculture (USDA), included three components: a process evaluation of the program’s implementation, an evaluation of the program’s impact on nutrition behaviors, and an assessment of the methods and results of MSUE’s own evaluation of its program.
The ESLS program is designed to improve fruit and vegetable consumption and physical activity among able-bodied 60- to 74-year-olds participating in or eligible for FNS nutrition assistance programs. The intervention is designed to help nutrition educators working with FNS programs and in communities deliver evidence-based nutrition education to low-income seniors. The intervention focuses on two key messages of the Dietary Guidelines for Americans and uses a variety of behavior-focused strategies to promote these behaviors: eat at least 3½ cups of fruits and vegetables each day, and participate in at least 30 minutes of moderate-intensity physical activity on most days of the week. ESLS lessons are designed to be conducted in senior centers, senior housing, or other community centers where seniors gather.
Based on an examination of changes over time between the intervention and comparison groups, the ESLS program had a statistically significant impact on participants’ average daily consumption of fruits and vegetables combined, as well as each separately. Similarly, the MSUE self-evaluation found an impact on average daily consumption of vegetables. Based on the analyses conducted by MSUE, the impact on fruit consumption was inconclusive. Together, the two evaluation studies suggest that the ESLS program is effective at encouraging seniors to eat more fruits and vegetables each day. The FNS evaluation was designed to measure fruit and vegetable intake and did not evaluate the impact of the program on participants’ physical activity.
The process evaluation revealed a high degree of satisfaction with the program by participants. Key informants attributed this to the quality of the curriculum content and design, the hands-on activities and practical program materials, and the commitment of the direct educators to program fidelity and quality through training and continuing education delivered by MSUE. However, they also noted the need to identify ways to better reach seniors, particularly those in the targeted age group of 60–74 years.
A. Background on SNAP-Ed Under subcontract agreements with State Supplemental Nutrition Assistance Program (SNAP) agencies, a variety of organizations partner to implement SNAP-Ed within States. The goal of these programs is to improve the likelihood that SNAP participants and persons eligible for SNAP nutrition assistance will make healthy food choices within a limited budget and choose physically active lifestyles. FNS’s SNAP-Ed Guiding Principles call for interventions that are evidence-based and behaviorally-focused. FNS also requests that States’ SNAP-Ed efforts be consistent with the current (2010) Dietary Guidelines for Americans, including the following:1
1 See the SNAP-Ed Plan Guidance at http://www.nal.usda.gov/fsn/Guidance/FY2012SNAP-EdGuidance.pdf and the
SNAP-Ed Connections Web site at http://snap.nal.usda.gov.

SNAP Education and Evaluation Wave II Case Study Report Michigan State University Extension’s Eat Smart, Live Strong Program ii
● Eat fruits and vegetables, whole grains, and fat-fee or low-fat milk products every day. ● Be physically active every day as part of a healthy lifestyle. ● Balance caloric intake from food and beverages with calories expended.
The SNAP-Ed Plan Guidance also encourages all States to include a component in their SNAP-Ed plans to evaluate the effectiveness of their SNAP-Ed interventions. These can include formative, process, outcome, and impact evaluations. In Federal Fiscal Year (FY) 2004, 74 percent of SNAP-Ed implementing agencies (IA) reported that they did conduct outcome evaluations on at least some aspects of services. However, based on interviews with 17 IAs, these evaluations were focused to a greater extent on process outcomes, such as program use, than they were on participant behavior change (USDA, 2004). As one of the largest Federal funding sources for nutrition education, FNS, States, and local IAs have a significant stake in ensuring that SNAP-Ed meets FNS’s goals.
To identify effective models of SNAP-Ed and evaluation and to collect information on the implementation and impacts of SNAP-Ed programs, FNS contracted with Altarum Institute and RTI International to conduct a rigorous independent evaluation of three competitively selected models of SNAP-Ed that show promise for behavior change. The goal of this study is to determine whether the selected projects can serve as good examples of SNAP-Ed delivery by meeting the following criteria:
▲ Positively affecting the nutrition and health behaviors of SNAP clients while adhering to FNS Guiding Principles,
▲ Exhibiting the potential to serve as models of effective nutrition intervention for large segments of the SNAP audience that can be replicated by other IAs, and
▲ Providing methodologically robust yet logistically practical examples of project-level SNAP-Ed evaluation efforts.
FNS also sought to understand the factors influencing the implementation of these nutrition education programs and lessons learned from these projects’ experiences. In early 2010, an FNS study review committee competitively selected three SNAP-Ed IAs to participate in the study, including MSUE’s ESLS program. Each of the three agencies implemented their demonstration programs between October and June of FY 2012 and conducted their own evaluations.
B. Overview of the ESLS Program The FNS ESLS program goal is to provide nutrition and physical activity education with the intent of increasing the likelihood that SNAP participants aged 60–74 will make healthy food choices consistent with the 2010 Dietary Guidelines for Americans and MyPyramid.2 The goal of ESLS is to increase fruit and vegetable consumption and physical activity among able-bodied 60- to 74-year-olds participating in or eligible for FNS nutrition assistance programs.3 The intervention focuses on two key messages of the Dietary Guidelines for Americans and utilizes a variety of behavior-focused strategies to promote these behaviors: eat at least 3½ cups of fruit and vegetable combined per day, and perform at least 30 minutes of moderate-intensity physical activity on most days of the week. ESLS consists of four interactive sessions, a leader’s guide, and supplementary material. Lessons include activities and self-assessment tools to assist participants in setting and achieving eating and physical activity goals, tracking progress, and more.
2 The USDA MyPyramid food guidance system was in place when the Models of SNAP-Ed and Evaluation, Wave II
demonstration projects were written. The USDA MyPlate food guidance system has replaced MyPyramid. 3 FNS. SNAP-Ed connection. Retrieved from http://snap.nal.usda.gov/resource-library/nutrition-education-materials-
fns/eat-smart-live-strong.
SNAP Education and Evaluation Wave II Case Study Report Michigan State University Extension’s Eat Smart, Live Strong Program iii
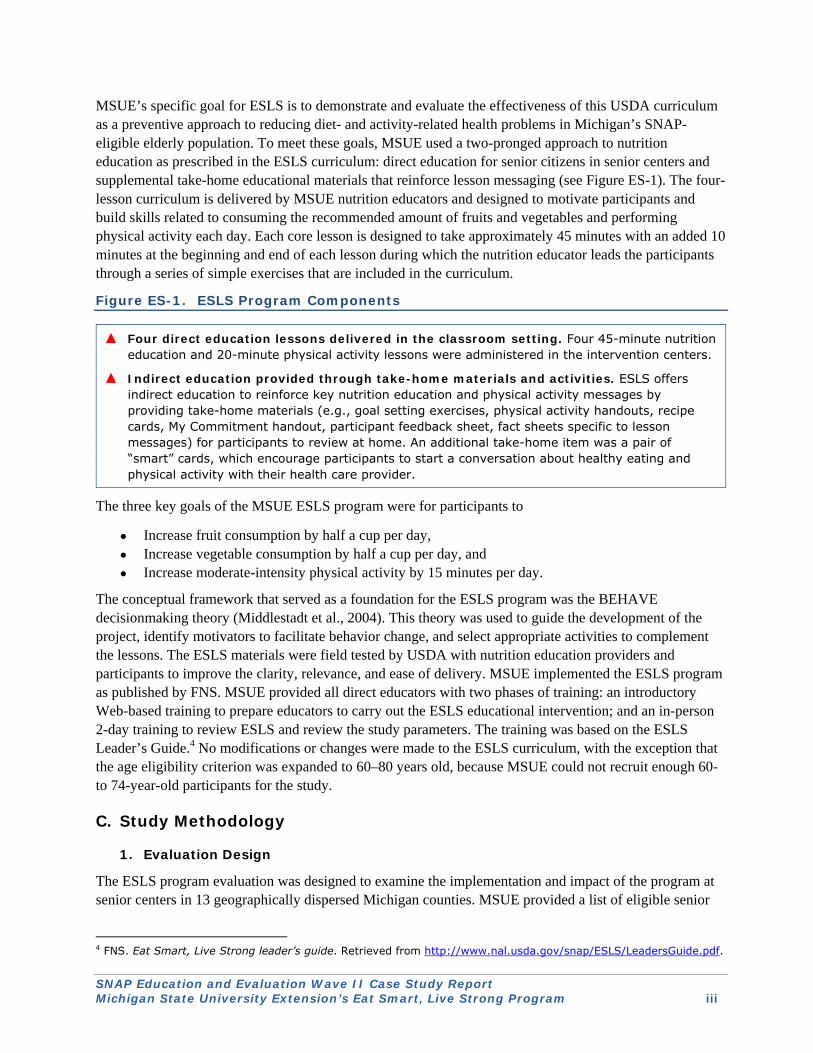
MSUE’s specific goal for ESLS is to demonstrate and evaluate the effectiveness of this USDA curriculum as a preventive approach to reducing diet- and activity-related health problems in Michigan’s SNAP-eligible elderly population. To meet these goals, MSUE used a two-pronged approach to nutrition education as prescribed in the ESLS curriculum: direct education for senior citizens in senior centers and supplemental take-home educational materials that reinforce lesson messaging (see Figure ES-1). The four-lesson curriculum is delivered by MSUE nutrition educators and designed to motivate participants and build skills related to consuming the recommended amount of fruits and vegetables and performing physical activity each day. Each core lesson is designed to take approximately 45 minutes with an added 10 minutes at the beginning and end of each lesson during which the nutrition educator leads the participants through a series of simple exercises that are included in the curriculum.
Figure ES-1. ESLS Program Components
▲ Four direct education lessons delivered in the classroom setting. Four 45-minute nutrition education and 20-minute physical activity lessons were administered in the intervention centers.
▲ Indirect education provided through take-home materials and activities. ESLS offers indirect education to reinforce key nutrition education and physical activity messages by providing take-home materials (e.g., goal setting exercises, physical activity handouts, recipe cards, My Commitment handout, participant feedback sheet, fact sheets specific to lesson messages) for participants to review at home. An additional take-home item was a pair of “smart” cards, which encourage participants to start a conversation about healthy eating and physical activity with their health care provider.
The three key goals of the MSUE ESLS program were for participants to
● Increase fruit consumption by half a cup per day, ● Increase vegetable consumption by half a cup per day, and ● Increase moderate-intensity physical activity by 15 minutes per day.
The conceptual framework that served as a foundation for the ESLS program was the BEHAVE decisionmaking theory (Middlestadt et al., 2004). This theory was used to guide the development of the project, identify motivators to facilitate behavior change, and select appropriate activities to complement the lessons. The ESLS materials were field tested by USDA with nutrition education providers and participants to improve the clarity, relevance, and ease of delivery. MSUE implemented the ESLS program as published by FNS. MSUE provided all direct educators with two phases of training: an introductory Web-based training to prepare educators to carry out the ESLS educational intervention; and an in-person 2-day training to review ESLS and review the study parameters. The training was based on the ESLS Leader’s Guide.4 No modifications or changes were made to the ESLS curriculum, with the exception that the age eligibility criterion was expanded to 60–80 years old, because MSUE could not recruit enough 60- to 74-year-old participants for the study.
C. Study Methodology
1. Evaluation Design
The ESLS program evaluation was designed to examine the implementation and impact of the program at senior centers in 13 geographically dispersed Michigan counties. MSUE provided a list of eligible senior
4 FNS. Eat Smart, Live Strong leader’s guide. Retrieved from http://www.nal.usda.gov/snap/ESLS/LeadersGuide.pdf.

SNAP Education and Evaluation Wave II Case Study Report Michigan State University Extension’s Eat Smart, Live Strong Program iv
centers that had indicated willingness to participate in the study. The research design specified the stratification of these centers based on geographic region and where feasible, stratification was also conducted within each region based on the number of meals provided by the center. Within each stratum, centers were randomly assigned by the independent evaluator to the intervention (n = 15) or control group (n = 15). Because of challenges faced by MSUE in scheduling the specified number of classes at each center and recruiting participants, it was decided that MSUE could abandon the experimental design and add additional classes at larger centers (without using random assignment) and additional centers (n = 3) within counties already included in the study to meet sample size goals. Thus, the final design was a quasi-experimental research design that included 17 intervention centers and 16 comparison centers. The seventeen centers received the ESLS program and were included in both the impact and process evaluations.5 The 16 centers in the comparison group did not receive the intervention until after the evaluation was completed. The intervention and evaluation was conducted from March through July 2012.
2. Process Evaluation Methods
The ESLS process evaluation began by creating a baseline description of the objectives, approach, and components of the design, administration, and implementation of the program. This information was obtained from interviews with program-level staff members and from secondary documents.6 Once the intervention was implemented, data collection and analysis of information on factors influencing the implementation and the lessons learned for program improvement and replicability began. This information was gained from in-person and telephone interviews with State program managers, educators who implemented the ESLS program, center directors, and other center staff. To supplement the interviews, onsite observations of direct education at five centers were conducted to assess how well direct educators followed the curriculum for the participant lessons, to observe participant engagement levels, and to document any factors that may have supported or impeded program implementation. Key-informant responses to each interview or questionnaire item were compiled into a master Microsoft Word 2007 document and organized by broad process evaluation research questions and process indicators. This approach helped to organize the extensive amount of information that was available and allowed for the identification of broad themes (e.g., implementation facilitators and challenges) and specific topics, as well as agreement and disagreement among respondents.
Another important component of the process evaluation was the assessment of the experience and satisfaction of the participants with the intervention. Information was collected on factors such as program accessibility for seniors, perceived goals of the program, ways in which the program helped them change their nutrition and physical activity behaviors, and potential barriers faced in trying to increase their fruit and vegetable intake. These data were collected through a follow-up participant survey and focus groups with a subset of participants at five intervention sites who attended the ESLS lessons.
Program administrative data were used to assess the program’s reach and estimate the amount of exposure that participants had to the ESLS program. The process evaluation findings also describe the resources and funding that MSUE needed to implement and evaluate the ESLS program and the cost per participant.
The analysis approach for the process evaluation was primarily qualitative, encompassing the triangulation of information collected from secondary data sources, interviews with key informants, and participant
5 MSUE conducted the intervention and evaluation study in one additional center in which the independent evaluator
did not collect data because it was added after the cutoff date for data collection. 6 Documents included MSUE’s application to FNS for this study, MSUE program reports, the ESLS curriculum, and
outlines used for training direct educators.
SNAP Education and Evaluation Wave II Case Study Report Michigan State University Extension’s Eat Smart, Live Strong Program v
focus groups. Quantitative analysis was conducted on program reach, dosage, cost, and participant follow-up survey responses.
3. Impact Evaluation Methods
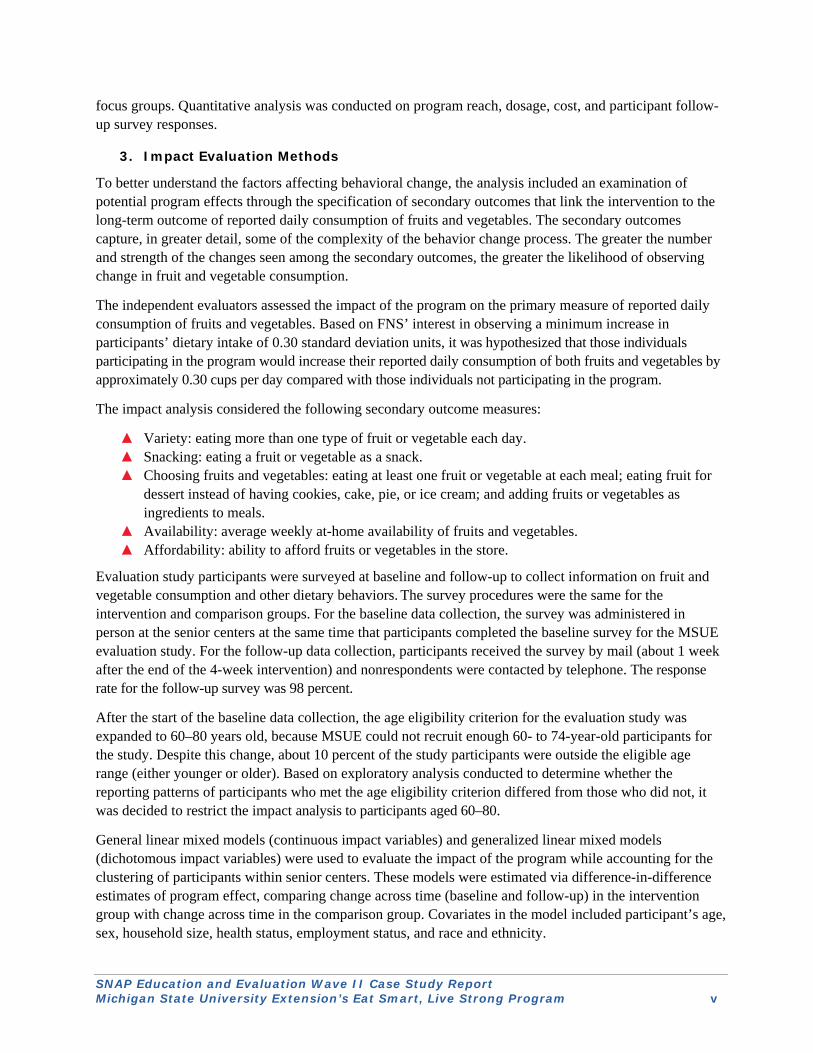
To better understand the factors affecting behavioral change, the analysis included an examination of potential program effects through the specification of secondary outcomes that link the intervention to the long-term outcome of reported daily consumption of fruits and vegetables. The secondary outcomes capture, in greater detail, some of the complexity of the behavior change process. The greater the number and strength of the changes seen among the secondary outcomes, the greater the likelihood of observing change in fruit and vegetable consumption.
The independent evaluators assessed the impact of the program on the primary measure of reported daily consumption of fruits and vegetables. Based on FNS’ interest in observing a minimum increase in participants’ dietary intake of 0.30 standard deviation units, it was hypothesized that those individuals participating in the program would increase their reported daily consumption of both fruits and vegetables by approximately 0.30 cups per day compared with those individuals not participating in the program.
The impact analysis considered the following secondary outcome measures:
▲ Variety: eating more than one type of fruit or vegetable each day. ▲ Snacking: eating a fruit or vegetable as a snack. ▲ Choosing fruits and vegetables: eating at least one fruit or vegetable at each meal; eating fruit for
dessert instead of having cookies, cake, pie, or ice cream; and adding fruits or vegetables as ingredients to meals.
▲ Availability: average weekly at-home availability of fruits and vegetables. ▲ Affordability: ability to afford fruits or vegetables in the store.
Evaluation study participants were surveyed at baseline and follow-up to collect information on fruit and vegetable consumption and other dietary behaviors. The survey procedures were the same for the intervention and comparison groups. For the baseline data collection, the survey was administered in person at the senior centers at the same time that participants completed the baseline survey for the MSUE evaluation study. For the follow-up data collection, participants received the survey by mail (about 1 week after the end of the 4-week intervention) and nonrespondents were contacted by telephone. The response rate for the follow-up survey was 98 percent.
After the start of the baseline data collection, the age eligibility criterion for the evaluation study was expanded to 60–80 years old, because MSUE could not recruit enough 60- to 74-year-old participants for the study. Despite this change, about 10 percent of the study participants were outside the eligible age range (either younger or older). Based on exploratory analysis conducted to determine whether the reporting patterns of participants who met the age eligibility criterion differed from those who did not, it was decided to restrict the impact analysis to participants aged 60–80.
General linear mixed models (continuous impact variables) and generalized linear mixed models (dichotomous impact variables) were used to evaluate the impact of the program while accounting for the clustering of participants within senior centers. These models were estimated via difference-in-difference estimates of program effect, comparing change across time (baseline and follow-up) in the intervention group with change across time in the comparison group. Covariates in the model included participant’s age, sex, household size, health status, employment status, and race and ethnicity.
SNAP Education and Evaluation Wave II Case Study Report Michigan State University Extension’s Eat Smart, Live Strong Program vi
4. Methods for the Assessment of MSUE’s Self-Evaluation
This study also examined the soundness of MSUE’s self-evaluation. This assessment included a detailed description of MSUE’s evaluation methodology, including the management, staffing, and costs of the evaluation; an assessment of the quality of MSUE’s evaluation; an identification of strengths, weaknesses, and areas for improvement; and a comparison of MSUE’s evaluation results with those of the independent impact evaluation.
D. Process Evaluation Findings In FY 2012, six full-time-equivalent direct nutrition educators implemented the ESLS demonstration project at 18 senior centers throughout Michigan. That year, the demonstration project reached 326 seniors. Based on the project’s reach and FY 2012 implementation costs, it cost approximately $133.19 per senior to implement the ESLS program. There were no planning and design costs for the ESLS program, because it was developed by FNS.
Understanding why participants decided to engage in an intervention is critical information for administrators and evaluation managers of the intervention. According to the participant survey results for the intervention group, respondents reported a variety of reasons for choosing to participate in the ESLS program.7 The majority of respondents (73 percent) reported that they wanted to eat healthier. Sixty-three percent wanted to improve their health. Thirty-nine percent believed that the ESLS program would help them learn to cook healthier for themselves and their families. Thirty-five percent hoped the program would help them exercise more. Twenty-six percent wanted to lose weight, and 23 percent wanted to manage their food budget more effectively. Five percent joined the program because they wanted to receive the incentive provided to participants as part of the research study ($10 at baseline and $15 at follow-up for the FNS evaluation study and $10 at baseline and $15 at follow-up for the MSUE evaluation study). A small percentage of participants were urged to join the ESLS program by a friend or relative (1 percent), or they wanted to learn more about health and nutrition in general (2 percent).
According to the participant survey results for the intervention group, 63 percent reported completing all four of the lesson activity sheets. Less than 10 percent of respondents reported that they completed only one sheet or did not complete any. Eighty-seven percent of respondents agreed or strongly agreed that the activity sheets were a facilitator in increasing their fruit or vegetable consumption. Eleven percent disagreed with the statement, while 2 percent strongly disagreed.
According to the participant survey results for the intervention group, those who signed up for the ESLS program but did not attend all of the sessions gave several reasons for nonparticipation. The primary reasons were being too busy with other things such as hobbies or family (42 percent) or not feeling well enough to attend (32 percent). Eight percent of respondents believed the sessions were too long or were not interesting. Other reasons for nonparticipation included forgetting about the sessions (5 percent), difficulty of the material (2 percent), or lack of usefulness of the material (2 percent).
1. Key-Informant Perspectives on Program Implementation
Overall, program managers, direct educators, and center staff involved with the ESLS demonstration project reported that many factors in the program’s design and the relevance of its materials and teaching methods for the selected target audience make it a most relevant and enjoyable program to implement. The
7 Respondents could choose more than one response in the survey, so sums are greater than 100 percent.
SNAP Education and Evaluation Wave II Case Study Report Michigan State University Extension’s Eat Smart, Live Strong Program vii
most commonly reported facilitators to program implementation were a relevant, well-designed curriculum; a high degree of participant satisfaction with the program and program materials; a mode of nutrition education delivery that was well-received by key stakeholders; and the direct educators being well-received by senior centers and participants.
At the same time, interviews with the program implementers and the independent evaluators’ observations of the ESLS lessons also identified several critical challenges to implementing this program. The most commonly reported challenges were recruitment of senior centers for the program, recruitment of age-eligible seniors for the program, maximization of participant engagement in take-home activities, and cost to participants of purchasing fruits and vegetables.
2. Participant Satisfaction and Use of Program Materials and Classes
Focus group discussions with seniors who participated in the ESLS program provided positive feedback about the ESLS program and take-home materials. They consistently said that they liked the messages in the program and found the materials useful in helping them eat healthier foods. Another component of the program enjoyed by seniors was the daily logs. Moreover, observations conducted at selected senior centers implementing ESLS clearly demonstrated seniors were engaged in the program by questions that they asked and input that they provided. Focus group discussions revealed that seniors enjoyed participating in the nutrition education and physical activity components of the program and that they were looking forward to another program of this nature if it were offered at their center.
E. Impact Evaluation Findings
1. Primary Impact Results
The baseline analysis included 614 respondents: 267 for the intervention group and 347 for the comparison group. At baseline, the comparison group was significantly more male and relatively less educated than the intervention group; however, these differences were taken into consideration by including these and other demographic variables in the impact models.
Based on the results of the impact analysis, the ESLS program had a statistically significant impact on participants’ average daily consumption of fruits and vegetables combined (see Figure ES-2) as well as participants’ average daily consumption of fruits and participants’ average daily consumption of vegetables (see Figures ES-3 and ES-4). The ESLS program increased participants’ average daily consumption of fruits and vegetables by a combined 0.52 cups (p < 0.001); this amount compares favorably to other evaluations of nutrition education programs (Ammerman, Lindquist, Lohr, & Hersey, 2002).

SNAP Education and Evaluation Wave II Case Study Report Michigan State University Extension’s Eat Smart, Live Strong Program viii
Figure ES-2. Changes in Average Daily Consumption of Fruits and Vegetables Combined (increase of 0.52 cups, p < 0.01)
Figure ES-3. Changes in Average Daily Consumption of Fruits (increase of 0.2 cups, p < 0.05)
Figure ES-4. Changes in Average Daily Consumption of Vegetables (increase of 0.31 cups, p < 0.01)
Figure ES-5. Add Fruits or Vegetables as Ingredients to Meals to Help Eat More Fruits or Vegetables (odds ratio = 1.93, p < 0.05)
2. Secondary Impact Results
For shopping and food preparation practices, improvements were noted for the intervention group between baseline and follow-up, with a statistically significant increase for the proportion of participants who agreed or strongly agreed that they add fruits or vegetables as ingredients during meal preparation to help them eat more fruits and vegetables (see Figure ES-5). At follow-up, ESLS participants were significantly more likely than participants in the comparison group to talk about eating fruits and vegetables with their health care provider and friends and family. The ESLS program did not have an impact on any of the other secondary outcomes included in the evaluation study.
F. Findings From the Assessment of MSUE’s Self-Evaluation MSUE conducted pre- and post-assessments with participants using the same intervention and comparison groups employed for the independent evaluation (with the exception of one additional intervention group). Strengths of MSUE’s evaluation included the use of a viable comparison strategy, the use of 24-hour food recalls for collecting fruit and vegetable intake, well-planned and -executed data collection procedures, and
‐
0.50
1.00
1.50
2.00
2.50
3.00
3.50
Baseline Follow‐Up Baseline Follow‐Up
Intervention Comparison
Num
ber of cup
s pe
r da
y (m
ean)
Condition and Time Period
‐
0.20
0.40
0.60
0.80
1.00
1.20
1.40
1.60
Baseline Follow‐Up Baseline Follow‐Up
Intervention Comparison
Number of cups per day (mean)
Condition and Time Period
‐
0.20
0.40
0.60
0.80
1.00
1.20
1.40
1.60
1.80
Baseline Follow‐Up Baseline Follow‐Up
Intervention Comparison
Number of cups per day (mean)
Condition and Time Period
70.00
72.00
74.00
76.00
78.00
80.00
82.00
84.00
86.00
88.00
90.00
Baseline Follow‐Up Baseline Follow‐Up
Intervention Comparison
Percent Agree(m
ean
)
Condition and Time Period

SNAP Education and Evaluation Wave II Case Study Report Michigan State University Extension’s Eat Smart, Live Strong Program ix
modest attrition and minimal missing data for the impact evaluation. The primary weakness of the MSUE evaluation was the difficulties experienced in enrolling the specified number of participants meeting the age eligibility criterion into the study, which required extending the study period to allow sufficient time to recruit the required number of participants into the study.
Based on the results of the MSUE evaluation, the program affected vegetable consumption (increase of 0.35 cups; p < 0.05). Based on the analyses conducted by MSUE, the impact on fruit consumption was inconclusive. Although physical activity was not an outcome of interest for the independent evaluation, the ESLS program placed an equal emphasis on physical activity and on nutrition. MSUE found that there were not statistically significant differences from baseline to follow-up in the amount of moderate physical activity in the intervention or comparison group.
G. Recommendations Based on the findings from the independent evaluation, the ESLS intervention resulted in a measurable increase on average daily consumption of fruits and vegetables combined, as well separately. Secondary impacts included improvements in shopping and food preparation practices related to the addition of fruits and vegetables as ingredients during meal preparation for the intervention group between baseline and follow-up. Furthermore, program participants were prompted to talk about eating fruits and vegetables with their health care provider, family, and friends. Program managers, direct educators, and senior center staff reported that the ESLS program implementation is not burdensome on senior centers and is relatively easy to implement. These results indicate that the ESLS program exhibits the potential to serve as a national model of effective nutrition education for seniors who are SNAP participants or eligibles.
▲ Key Areas for Program Improvement
Overall, input from program staff, senior center staff, and participants suggests that revisions could further enhance the effectiveness of the ESLS program implementation in reaching its target audiences. The process evaluation findings suggest the following recommendations for improving program implementation:
● Strengthen partnerships with senior centers and senior housing to facilitate participation in ESLS. Establishing strong relationships with partners is essential to the success of ESLS program implementation. Key steps in the development of partnerships include clarity of purpose, ownership, identification of the right people with which to work, development and maintenance of a level of trust, and development of roles and working arrangements. Taking the time to help partners understand the mutual benefits of partnering, establishing clear channels of communication, and developing an understanding of respective roles can help provide the foundation for strong partnerships.
● Maximize use of senior center staff to recruit age-appropriate seniors for ESLS. Direct educators should capitalize on center staff to assist with recruitment for the ESLS program and follow up with potential participants. The focus group respondents believed that the personal interaction between center staff and potential participants helped them make a decision about coming to the ESLS lessons.
● Reinforce the use of a variety of forms of fruits and vegetables to address concerns about the cost of fresh fruits and vegetables. Although the ESLS lessons and other take-home materials include information on how to plan and shop for meals with fruits and vegetables on a limited budget, focus group input clearly highlights that more could be done to address participant
SNAP Education and Evaluation Wave II Case Study Report Michigan State University Extension’s Eat Smart, Live Strong Program x
concerns about the cost of purchasing fruits and vegetables. Additional discussion and reinforcement for buying a variety of forms of fruits and vegetables would help seniors to consider the cost savings and nutritional value of these of these alternatives to fresh produce. Seniors indicated that they assumed the promotion of fruits and vegetables meant fresh fruits and vegetables, which are more costly.
Some of these suggested program improvements would require additional resources and may not be feasible for MSUE to implement. However, adopting one or more of these recommendations could improve the program’s implementation and potentially enhance its desired behavioral impacts.
▲ Suggestions for Improving Evaluation
MSUE encountered difficulties in recruiting senior centers and participants into the study, which resulted in ultimately changing the design of the study from a fully randomized design to a less rigorous quasi-experimental design. For future evaluation studies, it is suggested that MSUE provide additional assistance to those centers and educators that experience difficulties recruiting participants into the evaluation study.
SNAP Education and Evaluation Wave II Case Study Report Michigan State University Extension’s Eat Smart, Live Strong Program 1
Chapter I ● Introduction Nutrition education is an integral component of the Supplemental Nutrition Assistance Program (SNAP) known as SNAP-Education or SNAP-Ed. The goal of SNAP-Ed is to improve the likelihood that SNAP participants and persons eligible for SNAP will make healthy food choices within a limited budget and choose physically active lifestyles consistent with the current (2010) Dietary Guidelines for Americans (U.S. Department of Agriculture (USDA) Center for Nutrition Policy and Promotion, 2011).
The USDA Food and Nutrition Service’s (FNS) official SNAP-Ed Guidance not only provides information to help States in designing and implementing SNAP-Ed programs but also specifically encourages States to evaluate the effectiveness of their SNAP-Ed programs (FNS, 2012). In fiscal year (FY) 2004, 74 percent of SNAP-Ed implementing agencies (IA) reported that they conducted outcome evaluations on at least some aspects of services. However, based on interviews with 17 IAs, these evaluations focused to a greater extent on program use than on participant behavior change (FNS, 2006). As one of the largest Federal funding sources for nutrition education, FNS, States, and local IAs have a significant stake in ensuring that SNAP-Ed nutrition education meets FNS’s goals.
This study, Models of SNAP Education and Evaluation (Wave II), is the second of two FNS-initiated independent evaluations designed to identify models of effective SNAP-Ed nutrition education and models for SNAP-Ed impact evaluation. The overarching goal of this evaluation is to determine whether the selected projects can serve as good examples of SNAP-Ed delivery by meeting the following criteria:
● Positively affecting the nutrition and health behaviors of SNAP participants while adhering to FNS SNAP-Ed guiding principles,
● Exhibiting the potential to serve as models of effective nutrition intervention for large segments of the SNAP audience while requiring levels of resources that are manageable by a large percentage of SNAP-Ed IAs, and
● Providing methodologically robust yet logistically practical examples of project-level SNAP-Ed evaluation efforts.
To accomplish the study goal, three complementary types of assessments were conducted: a process evaluation, an impact evaluation, and an assessment of the demonstration project’s own outcome or impact evaluation. Exhibit I-1 lists the broad research questions framing the design and measures used in each component of the evaluation.
SNAP Education and Evaluation Wave II Case Study Report Michigan State University Extension’s Eat Smart, Live Strong Program 2
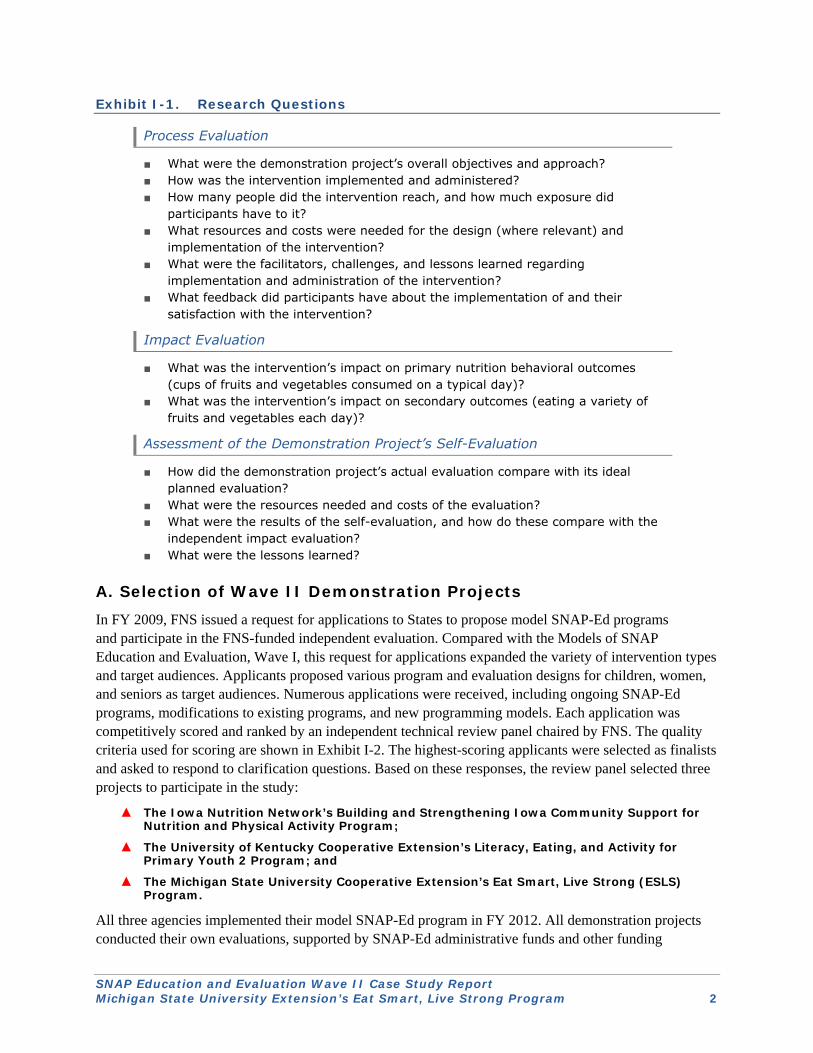
Exhibit I-1. Research Questions
Process Evaluation
■ What were the demonstration project’s overall objectives and approach? ■ How was the intervention implemented and administered? ■ How many people did the intervention reach, and how much exposure did
participants have to it? ■ What resources and costs were needed for the design (where relevant) and
implementation of the intervention? ■ What were the facilitators, challenges, and lessons learned regarding
implementation and administration of the intervention? ■ What feedback did participants have about the implementation of and their
satisfaction with the intervention?
Impact Evaluation
■ What was the intervention’s impact on primary nutrition behavioral outcomes (cups of fruits and vegetables consumed on a typical day)?
■ What was the intervention’s impact on secondary outcomes (eating a variety of fruits and vegetables each day)?
Assessment of the Demonstration Project’s Self-Evaluation
■ How did the demonstration project’s actual evaluation compare with its ideal planned evaluation?
■ What were the resources needed and costs of the evaluation? ■ What were the results of the self-evaluation, and how do these compare with the
independent impact evaluation? ■ What were the lessons learned?
A. Selection of Wave II Demonstration Projects In FY 2009, FNS issued a request for applications to States to propose model SNAP-Ed programs and participate in the FNS-funded independent evaluation. Compared with the Models of SNAP Education and Evaluation, Wave I, this request for applications expanded the variety of intervention types and target audiences. Applicants proposed various program and evaluation designs for children, women, and seniors as target audiences. Numerous applications were received, including ongoing SNAP-Ed programs, modifications to existing programs, and new programming models. Each application was competitively scored and ranked by an independent technical review panel chaired by FNS. The quality criteria used for scoring are shown in Exhibit I-2. The highest-scoring applicants were selected as finalists and asked to respond to clarification questions. Based on these responses, the review panel selected three projects to participate in the study:
▲ The Iowa Nutrition Network’s Building and Strengthening Iowa Community Support for Nutrition and Physical Activity Program;
▲ The University of Kentucky Cooperative Extension’s Literacy, Eating, and Activity for Primary Youth 2 Program; and
▲ The Michigan State University Cooperative Extension’s Eat Smart, Live Strong (ESLS) Program.
All three agencies implemented their model SNAP-Ed program in FY 2012. All demonstration projects conducted their own evaluations, supported by SNAP-Ed administrative funds and other funding

SNAP Education and Evaluation Wave II Case Study Report Michigan State University Extension’s Eat Smart, Live Strong Program 3
resources. Each demonstration project received a $100,000 incentive to offset expenses directly incurred as a result of their participation in this evaluation project, such as those associated with facilitating access to SNAP-Ed participants, participation in interviews, record keeping, and providing documents describing the implementer’s SNAP-Ed intervention and evaluation processes.
Exhibit I-2. Scoring Criteria Used for Demonstration Project Selection
Criterion Specific Requirements Quality of intervention plan (35 points)
Incorporates SNAP-Ed guiding principles Budgets are provided as per SNAP-Ed annual guidance
Intervention schedule fits the proposed FNS data collection period (10 points)
Intervention will begin and end sometime between October 2011 and June 2012
Suitability for an FNS evaluation using a rigorous impact evaluation design (30 points)
Can support the random assignment of multiple units (e.g., person, classes) to treatment and control conditions or the quasi-experimental, nonrandom assignment of matched units to both treatment and control groups
If other nutrition education or promotions are delivered to the target audience, they are delivered to both the treatment and control groups during the course of the project
Promise for replication (15 points)
Does not require unusually high levels of resources and technical expertise
Materials and curricula are or can be made readily accessible to other nutrition educators
Quality of staff and staffing plan (10 points)
Individuals with key project responsibilities are identified, and their allocated hours are indicated and adequate
Proposed staff members are well qualified, and planned training is provided
The evaluation of the Michigan State University Extension (MSUE) ESLS demonstration project is the focus of this case study report. Similar case study reports have been prepared for the other two demonstration projects. Key evaluation findings and cross-cutting themes from all Wave II demonstration projects are presented in a separate final report.8
B. Overview of the ESLS Program
FNS developed the ESLS curriculum. The project’s research report, “Improving the Eating and Physical Activity Behaviors of Low-Income Older Adults: Eat Smart, Live Strong Promising Practices Report,” details research that contributed to the development of the curriculum. The report summarizes several phases of formative research and testing and the literature review that was conducted to identify the best evidence-based strategies for seniors. The BEHAVE framework9 was used to guide the project to identify relevant interventions and strategies.
The primary goals of the FNS ESLS are to increase fruit and vegetable consumption and physical activity among able-bodied, 60- to 74-year-olds participating in or eligible for FNS nutrition assistance programs.
8 The individual case studies and integrated final report are published separately and available at
http://www.fns.usda.gov/ora. 9 Academy for Educational Development, Center for Global Health Communication and Marketing. Applying the
BEHAVE framework: A workshop on strategic planning for behavior change in child survival. Retrieved from http://www.globalhealthcommunication.org/tool_docs/54/the_behave_framework_-_full_text.pdf.

SNAP Education and Evaluation Wave II Case Study Report Michigan State University Extension’s Eat Smart, Live Strong Program 4
The intervention focuses on two key messages of the Dietary Guidelines for Americans and utilizes a variety of behavior-focused strategies to promote these behaviors: eat at least 3½ cups of fruit and vegetable per day and participate in at least 30 minutes of moderate-intensity physical activity on most days of the week. ESLS consists of four sessions, a leader’s guide and supplementary materials for the participants. Lessons include a variety of activities and self-assessment tools to assist participants in setting and achieving eating and physical activity goals. The four sessions include (1) a review of the recommended amounts of fruits and vegetables appropriate for various ages and activity levels and both genders, (2) helpful suggestions to assist seniors in improving their fruit and vegetable intake and physical activity behaviors and ways to reach those goals, (3) innovative ways to modify classic recipes to increase fruit and vegetable consumption, and (4) increasing awareness about the variety of food assistance programs available to seniors and other resources available in their community.
FNS has made the ESLS curriculum, activities and resources available to State SNAP and SNAP-Ed IAs and encouraged them to implement and evaluate the effectiveness of the program.
1. MSUE’s Implementation of ESLS
MSUE’s specific goal for ESLS is to demonstrate and evaluate the effectiveness of this USDA curriculum as a preventive approach to reducing diet- and activity-related health problems in Michigan’s SNAP-eligible elderly population. This goal is in keeping with FNS’ goal of making ESLS available to State SNAP and SNAP-Ed IAs. To meet these goals, MSUE used a two-pronged approach to nutrition education as prescribed in the ESLS curriculum: direct education for senior citizens in senior centers and supplemental take-home educational materials that reinforce lesson messaging. The four-lesson curriculum is delivered by MSUE nutrition educators and designed to motivate participants and build skills related to consuming the recommended amount of fruits and vegetables and participating in physical activity each day.
Each core lesson is designed to take approximately 45 minutes with an added 10 minutes at the beginning and end of each lesson for the nutrition educator to lead the participants through a series of simple exercises that are included in the curriculum.
The three key goals of the MSUE ESLS program were for participants to
● Increase fruit consumption by half a cup per day, ● Increase vegetable consumption by half a cup per day, and ● Increase moderate-intensity physical activity by 15 minutes per day.
The ESLS program is one of several SNAP-Ed programs offered by MSUE to SNAP participants and eligibles in Michigan. SNAP-Ed, coordinated through the Michigan State University (MSU) Cooperative Extension, is one of two IAs responsible for coordinating SNAP-Ed in Michigan. The second IA is the Michigan Nutrition Network, one of 15 nutrition networks in the country. Programming specific to the MSUE SNAP-Ed includes
● MSUE’s Eating Right Is Basic, ● Share Our Strength’s Cooking Matters, ● Share Our Strength’s Cooking Matters for Kids/Teens, ● MSUE’s Healthy Harvest, ● ESLS, ● University of Missouri Extension’s Show Me Nutrition, and ● MSUE’s Jump Into Foods and Fitness.

SNAP Education and Evaluation Wave II Case Study Report Michigan State University Extension’s Eat Smart, Live Strong Program 5
2. Audience and Sites
The MSUE project study population was drawn from 13 geographically dispersed Michigan counties. These regions included both urban and rural communities, as well as portions of the Upper Peninsula. The original study design specified an intervention group and a comparison group with 15 centers in each group. To meet study enrollment goals, the age criterion for study participants was changed from ages 60–74 to ages 60–80, and it was necessary for MSUE to add additional intervention and comparison centers. Only senior centers with more than half their participants SNAP eligible were selected as study sites. MSUE enrolled 307 seniors from 18 centers10 in the ESLS program (intervention sites), and 382 seniors from 16 centers for comparison sites.
3. Project Implementation
MSUE conducted the ESLS program and evaluation in selected senior centers from February through July 2012. ESLS participants received four 30-minute in-class lessons taught by MSUE nutrition educators. Corresponding take-home materials, activities, and resources were provided to seniors after each lesson for at-home review and reinforcement of key messages. ESLS participants were encouraged to engage in the at-home activities to improve the likelihood that they would overcome challenges and barriers to healthy eating and physical activity. The first week involved the baseline data collection for the MSUE and independent evaluations, weeks 2–5 consisted of the four ESLS lessons, and the 6th week comprised the follow-up data collection. The follow-up data collection was conducted in person for the MSUE evaluation and by mail or telephone for the independent evaluation. For the comparison centers, the same procedures were followed with the exception that participants in the comparison group received the four ESLS lessons after the follow-up data collection was completed. Thus, participants in both groups completed the baseline data collection in week 1 and the follow-up data collection in week 6.
C. Organization of the Report
This report provides a detailed summary of the findings and conclusions of, as well as the specific methods used in the evaluation of the ESLS demonstration project. Below are the topics addressed in each of the remaining chapters in this report:
● Chapter II: Process Evaluation Methods and Results, ● Chapter III: Impact Evaluation Methods and Results, ● Chapter IV: Assessment of MSUE’s Self-Evaluation, and ● Chapter V: Conclusions and Discussion.
Following these chapters is a series of appendices which include data collection instruments, supplemental data, and detailed descriptions of the methods employed for each of the three components of the evaluation. Additionally, Appendix J provides a complete list of all cited references within this report.
10 MSUE enrolled 18 centers for the intervention group, while the FNS study enrolled 17 centers for the intervention
group. One center was not included in the independent evaluation because it was added after the cutoff date for data collection.
SNAP Education and Evaluation Wave II Case Study Report Michigan State University Extension’s Eat Smart, Live Strong Program 6
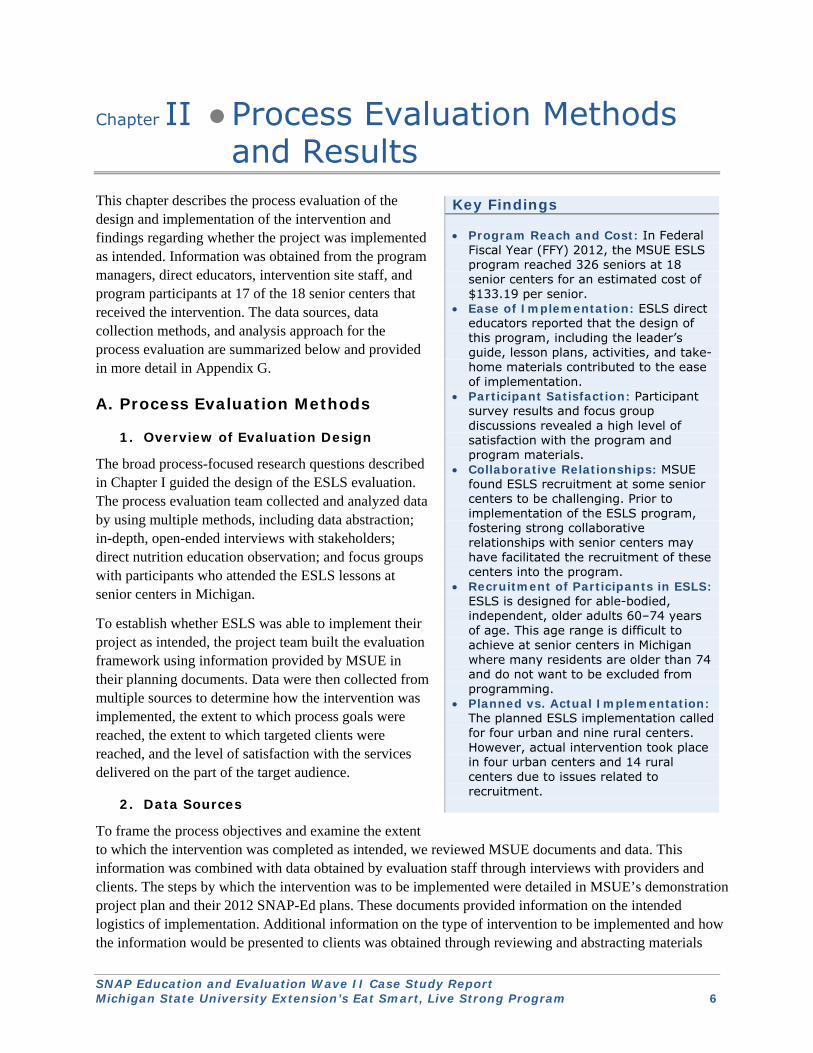
Chapter II ● Process Evaluation Methods and Results
This chapter describes the process evaluation of the design and implementation of the intervention and findings regarding whether the project was implemented as intended. Information was obtained from the program managers, direct educators, intervention site staff, and program participants at 17 of the 18 senior centers that received the intervention. The data sources, data collection methods, and analysis approach for the process evaluation are summarized below and provided in more detail in Appendix G.
A. Process Evaluation Methods
1. Overview of Evaluation Design
The broad process-focused research questions described in Chapter I guided the design of the ESLS evaluation. The process evaluation team collected and analyzed data by using multiple methods, including data abstraction; in-depth, open-ended interviews with stakeholders; direct nutrition education observation; and focus groups with participants who attended the ESLS lessons at senior centers in Michigan.
To establish whether ESLS was able to implement their project as intended, the project team built the evaluation framework using information provided by MSUE in their planning documents. Data were then collected from multiple sources to determine how the intervention was implemented, the extent to which process goals were reached, the extent to which targeted clients were reached, and the level of satisfaction with the services delivered on the part of the target audience.
2. Data Sources
To frame the process objectives and examine the extent to which the intervention was completed as intended, we reviewed MSUE documents and data. This information was combined with data obtained by evaluation staff through interviews with providers and clients. The steps by which the intervention was to be implemented were detailed in MSUE’s demonstration project plan and their 2012 SNAP-Ed plans. These documents provided information on the intended logistics of implementation. Additional information on the type of intervention to be implemented and how the information would be presented to clients was obtained through reviewing and abstracting materials
Key Findings
Program Reach and Cost: In Federal Fiscal Year (FFY) 2012, the MSUE ESLS program reached 326 seniors at 18 senior centers for an estimated cost of $133.19 per senior.
Ease of Implementation: ESLS direct educators reported that the design of this program, including the leader’s guide, lesson plans, activities, and take-home materials contributed to the ease of implementation.
Participant Satisfaction: Participant survey results and focus group discussions revealed a high level of satisfaction with the program and program materials.
Collaborative Relationships: MSUE found ESLS recruitment at some senior centers to be challenging. Prior to implementation of the ESLS program, fostering strong collaborative relationships with senior centers may have facilitated the recruitment of these centers into the program.
Recruitment of Participants in ESLS: ESLS is designed for able-bodied, independent, older adults 60–74 years of age. This age range is difficult to achieve at senior centers in Michigan where many residents are older than 74 and do not want to be excluded from programming.
Planned vs. Actual Implementation: The planned ESLS implementation called for four urban and nine rural centers. However, actual intervention took place in four urban centers and 14 rural centers due to issues related to recruitment.
SNAP Education and Evaluation Wave II Case Study Report Michigan State University Extension’s Eat Smart, Live Strong Program 7
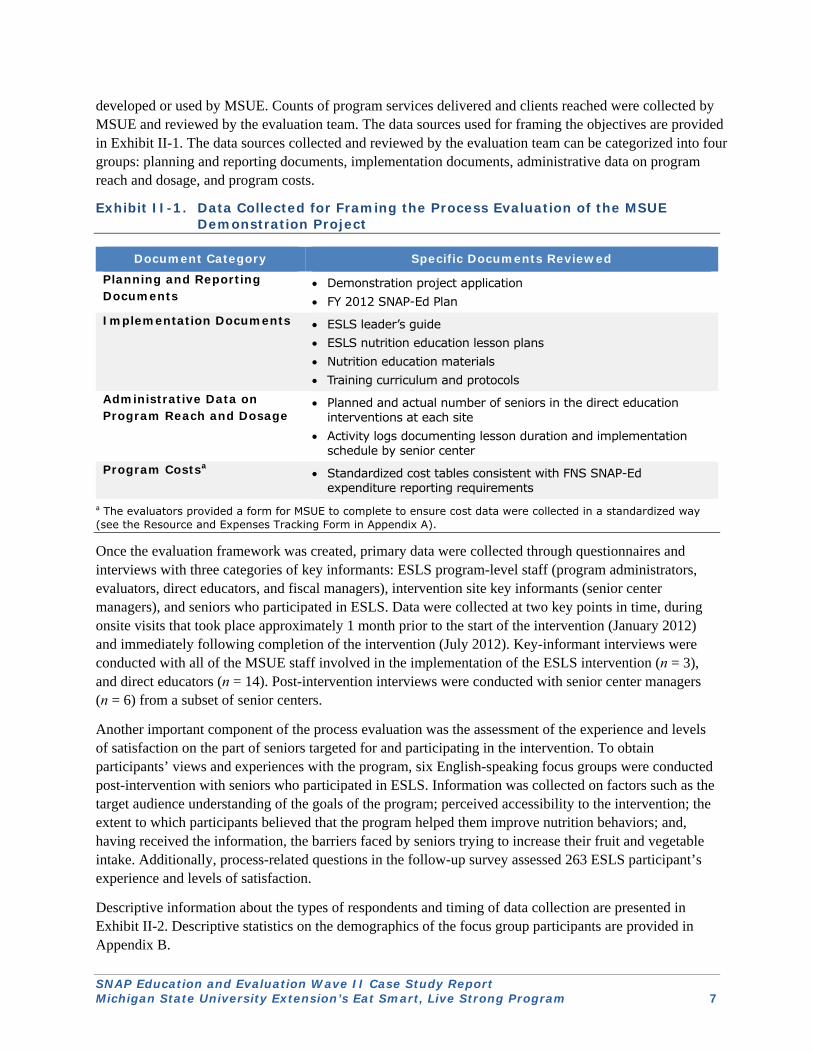
developed or used by MSUE. Counts of program services delivered and clients reached were collected by MSUE and reviewed by the evaluation team. The data sources used for framing the objectives are provided in Exhibit II-1. The data sources collected and reviewed by the evaluation team can be categorized into four groups: planning and reporting documents, implementation documents, administrative data on program reach and dosage, and program costs.
Exhibit II-1. Data Collected for Framing the Process Evaluation of the MSUE Demonstration Project
Document Category Specific Documents Reviewed
Planning and Reporting Documents
Demonstration project application FY 2012 SNAP-Ed Plan
Implementation Documents ESLS leader’s guide ESLS nutrition education lesson plans Nutrition education materials Training curriculum and protocols
Administrative Data on Program Reach and Dosage
Planned and actual number of seniors in the direct education interventions at each site
Activity logs documenting lesson duration and implementation schedule by senior center
Program Costsa Standardized cost tables consistent with FNS SNAP-Ed expenditure reporting requirements
a The evaluators provided a form for MSUE to complete to ensure cost data were collected in a standardized way (see the Resource and Expenses Tracking Form in Appendix A).
Once the evaluation framework was created, primary data were collected through questionnaires and interviews with three categories of key informants: ESLS program-level staff (program administrators, evaluators, direct educators, and fiscal managers), intervention site key informants (senior center managers), and seniors who participated in ESLS. Data were collected at two key points in time, during onsite visits that took place approximately 1 month prior to the start of the intervention (January 2012) and immediately following completion of the intervention (July 2012). Key-informant interviews were conducted with all of the MSUE staff involved in the implementation of the ESLS intervention (n = 3), and direct educators (n = 14). Post-intervention interviews were conducted with senior center managers (n = 6) from a subset of senior centers.
Another important component of the process evaluation was the assessment of the experience and levels of satisfaction on the part of seniors targeted for and participating in the intervention. To obtain participants’ views and experiences with the program, six English-speaking focus groups were conducted post-intervention with seniors who participated in ESLS. Information was collected on factors such as the target audience understanding of the goals of the program; perceived accessibility to the intervention; the extent to which participants believed that the program helped them improve nutrition behaviors; and, having received the information, the barriers faced by seniors trying to increase their fruit and vegetable intake. Additionally, process-related questions in the follow-up survey assessed 263 ESLS participant’s experience and levels of satisfaction.
Descriptive information about the types of respondents and timing of data collection are presented in Exhibit II-2. Descriptive statistics on the demographics of the focus group participants are provided in Appendix B.

SNAP Education and Evaluation Wave II Case Study Report Michigan State University Extension’s Eat Smart, Live Strong Program 8
Process evaluation team members also observed ESLS classes at senior centers in selected locations. During these observation sessions, participant engagement in the lesson and a description of the extent to which the delivery of the intervention was consistent with or deviated from the lesson plan was documented. The evaluator also observed whether there was other nutrition education messaging in the environment from sources other than ESLS. Directly after the lesson, the evaluator spoke briefly with the direct educator to identify facilitators and challenges to implementation of the ESLS lessons.
Exhibit II-2. MSUE Respondent Types, Data Collection Methods, and Number of Respondents
Type of Respondent Data Collection
Method
Number of Respondents
Pre-intervention
Post-intervention
Program Staff Program administrators Interview 2 1a Direct educators Questionnaire 19 14 Program evaluators Interview 2 2 Fiscal manager Interview n/a 1 Intervention Center Staff Senior center managers Interview n/a 6 Program Participants Seniors in the intervention classrooms Focus group n/a 6 groups
(53 seniors)
Participant survey (process questions included in survey completed by intervention group)
n/a 263
a One program administrator transferred to a new job during the intervention period. Note: n/a= not applicable
3. Instrumentation
Data collectors used a set of standardized data abstraction tools and primary data collection instruments. The wording of many of the questions in each key-informant interview guide and the focus group discussion guide was tailored to the specific characteristics of the ESLS program. All data collectors were trained on use of these approved instruments to collect information essential to answering the process-related research questions and queries. In addition, key-informant interviews included relevant, probing questions to allow for in-depth discussions of important issues or topics. Copies of the instruments are provided in Appendix A.
4. Analysis Approach
The evaluation team applied an analysis approach appropriate to each of the data collection methods and respondent types. Key-informant responses were compiled into a master document and organized by themes within each of the process evaluation research questions and process indicators. This approach helped to organize the extensive amount of information collected and allowed for the identification of broad themes (e.g., implementation facilitators and challenges) and specific topics (e.g., lesson plan scheduling) as well as identifying areas of agreement and disagreement among respondents. Direct quotations were also included where they support or supplement key findings.
SNAP Education and Evaluation Wave II Case Study Report Michigan State University Extension’s Eat Smart, Live Strong Program 9
Quantitative process data were primarily used to describe objective aspects of the ESLS intervention, such as those related to dosage, reach, and costs. With the exception of cost data, which were provided through a series of standardized tables, these data were received in or entered into Microsoft Excel spreadsheets. Excel was then used to conduct basic frequencies and mean tabulations. Quantitative process data collected from ESLS participants (intervention group only) through the Participant Follow-Up Survey were analyzed using SAS 9.3. Frequencies of participant responses to each process question are reported in Appendix B and incorporated with the qualitative findings that follow in this chapter.
Transcripts from focus groups with seniors were uploaded as Microsoft Word documents in QSR NVivo 8 software. An inductive content analysis approach was used (linking text from the transcripts to codes or themes). A broad top-level coding scheme and nodes were developed and applied to each transcript, which allowed the evaluation team to systematically organize, process, and summarize information provided by each key-informant group. It allowed the team to capture the breadth of opinions offered by respondents while identifying common themes and issues. Direct quotations were also identified and used to support the survey findings and common themes from the focus groups.
B. Program Development and Design
1. Program Development
The report titled “Improving the Eating and Physical Activity Behaviors of Low-Income Older Adults: Eat Smart, Live Strong Promising Practices Report” (Middlestadt et al., 2004) details research that contributed to the development of the ESLS curriculum. This report identifies several phases of formative research and testing and the literature review that was conducted to identify the best evidence-based strategies for nutrition education and physical activity interventions targeted to seniors. Using this research base, FNS developed the ESLS Nutrition Education for Older Adults program11USDA. This nutrition education program has been disseminated throughout the country and implemented in a variety of settings where seniors congregate. Although not rigorously evaluated by FNS, the ESLS materials were tested during the development process. States and IAs have been encouraged by FNS to conduct their own demonstration projects to determine the impact of the intervention on participants’ behaviors.
2. Theoretical Framework
The BEHAVE framework12 was used to guide the development of the ESLS intervention and implementation strategies. The purpose of the BEHAVE framework is to strengthen the strategic thinking that contributes to project design, research, monitoring and evaluation. The framework facilitates the complex decisionmaking that goes into project design for behavior change.
3. Description of Curriculum
The ESLS curriculum consists of four lessons with compatible messages for senior audiences. ESLS’s goal is to increase fruit and vegetable consumption and physical activity among able-bodied 60- to 74-year-olds who are participating in or eligible for FNS nutrition assistance programs. The intervention focuses on two key messages of the Dietary Guidelines for Americans and utilizes a variety of behavior-
11 FNS. Nutrition education for older adults. Retrieved from http://snap.nal.usda.gov/resource-library/nutrition-
education-materials-fns/eat-smart-live-strong. 12 Academy for Educational Development, Center for Global Health Communication and Marketing. Applying the
BEHAVE framework: A workshop on strategic planning for behavior change in child survival. Retrieved from http://www.globalhealthcommunication.org/tool_docs/54/the_behave_framework_-_full_text.pdf.
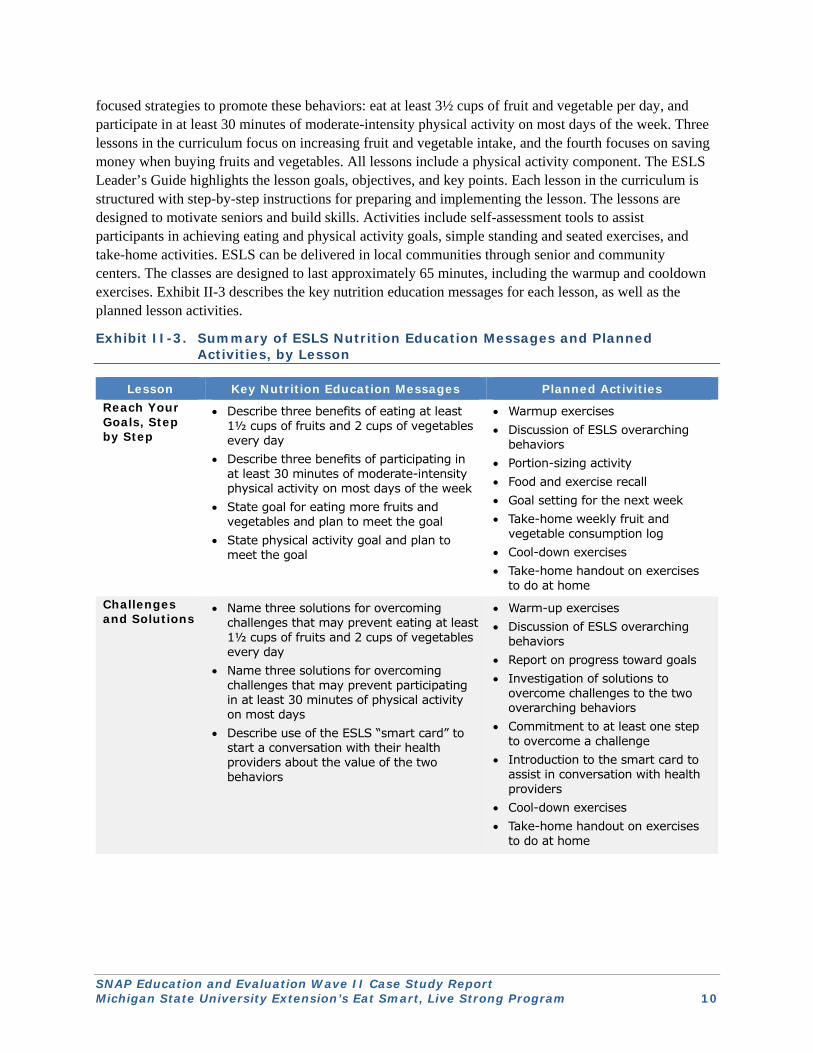
SNAP Education and Evaluation Wave II Case Study Report Michigan State University Extension’s Eat Smart, Live Strong Program 10
focused strategies to promote these behaviors: eat at least 3½ cups of fruit and vegetable per day, and participate in at least 30 minutes of moderate-intensity physical activity on most days of the week. Three lessons in the curriculum focus on increasing fruit and vegetable intake, and the fourth focuses on saving money when buying fruits and vegetables. All lessons include a physical activity component. The ESLS Leader’s Guide highlights the lesson goals, objectives, and key points. Each lesson in the curriculum is structured with step-by-step instructions for preparing and implementing the lesson. The lessons are designed to motivate seniors and build skills. Activities include self-assessment tools to assist participants in achieving eating and physical activity goals, simple standing and seated exercises, and take-home activities. ESLS can be delivered in local communities through senior and community centers. The classes are designed to last approximately 65 minutes, including the warmup and cooldown exercises. Exhibit II-3 describes the key nutrition education messages for each lesson, as well as the planned lesson activities.
Exhibit II-3. Summary of ESLS Nutrition Education Messages and Planned Activities, by Lesson
Lesson Key Nutrition Education Messages Planned Activities Reach Your Goals, Step by Step
Describe three benefits of eating at least 1½ cups of fruits and 2 cups of vegetables every day
Describe three benefits of participating in at least 30 minutes of moderate-intensity physical activity on most days of the week
State goal for eating more fruits and vegetables and plan to meet the goal
State physical activity goal and plan to meet the goal
Warmup exercises Discussion of ESLS overarching
behaviors Portion-sizing activity Food and exercise recall Goal setting for the next week Take-home weekly fruit and
vegetable consumption log Cool-down exercises Take-home handout on exercises
to do at home Challenges and Solutions
Name three solutions for overcoming challenges that may prevent eating at least 1½ cups of fruits and 2 cups of vegetables every day
Name three solutions for overcoming challenges that may prevent participating in at least 30 minutes of physical activity on most days
Describe use of the ESLS “smart card” to start a conversation with their health providers about the value of the two behaviors
Warm-up exercises Discussion of ESLS overarching
behaviors Report on progress toward goals Investigation of solutions to
overcome challenges to the two overarching behaviors
Commitment to at least one step to overcome a challenge
Introduction to the smart card to assist in conversation with health providers
Cool-down exercises Take-home handout on exercises
to do at home
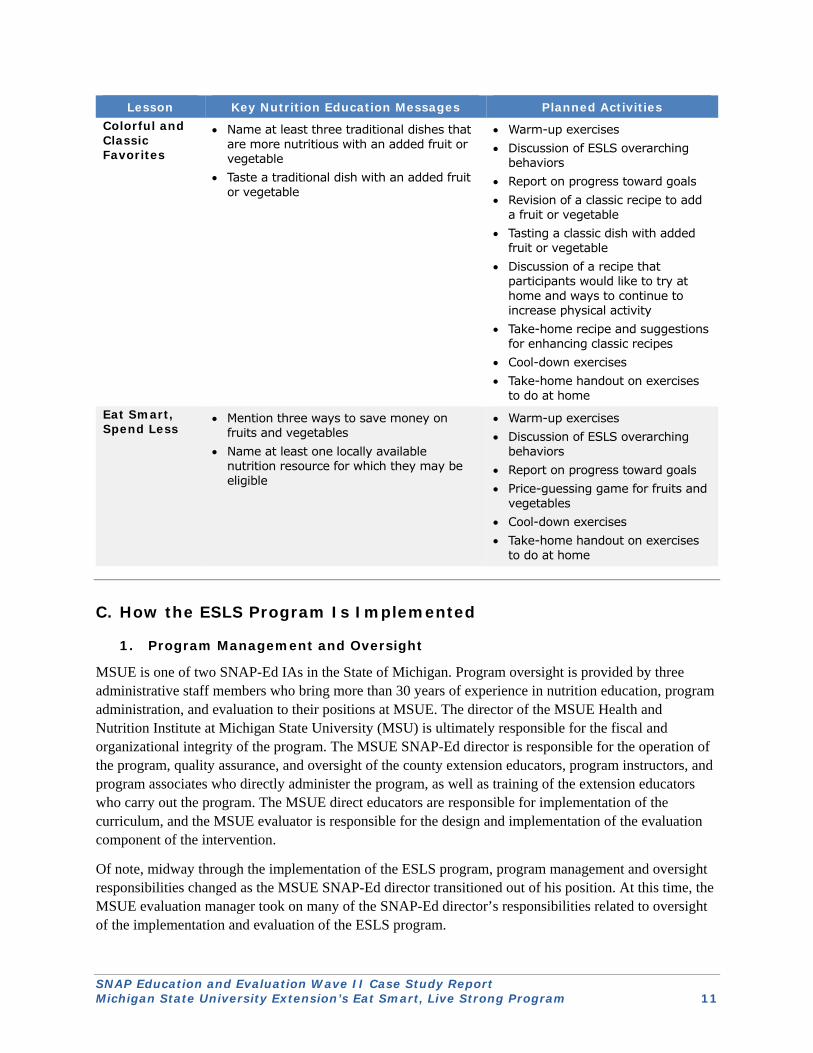
SNAP Education and Evaluation Wave II Case Study Report Michigan State University Extension’s Eat Smart, Live Strong Program 11
Lesson Key Nutrition Education Messages Planned Activities Colorful and Classic Favorites
Name at least three traditional dishes that are more nutritious with an added fruit or vegetable
Taste a traditional dish with an added fruit or vegetable
Warm-up exercises Discussion of ESLS overarching
behaviors Report on progress toward goals Revision of a classic recipe to add
a fruit or vegetable Tasting a classic dish with added
fruit or vegetable Discussion of a recipe that
participants would like to try at home and ways to continue to increase physical activity
Take-home recipe and suggestions for enhancing classic recipes
Cool-down exercises Take-home handout on exercises
to do at home Eat Smart, Spend Less
Mention three ways to save money on fruits and vegetables
Name at least one locally available nutrition resource for which they may be eligible
Warm-up exercises Discussion of ESLS overarching
behaviors Report on progress toward goals Price-guessing game for fruits and
vegetables Cool-down exercises Take-home handout on exercises
to do at home
C. How the ESLS Program Is Implemented
1. Program Management and Oversight
MSUE is one of two SNAP-Ed IAs in the State of Michigan. Program oversight is provided by three administrative staff members who bring more than 30 years of experience in nutrition education, program administration, and evaluation to their positions at MSUE. The director of the MSUE Health and Nutrition Institute at Michigan State University (MSU) is ultimately responsible for the fiscal and organizational integrity of the program. The MSUE SNAP-Ed director is responsible for the operation of the program, quality assurance, and oversight of the county extension educators, program instructors, and program associates who directly administer the program, as well as training of the extension educators who carry out the program. The MSUE direct educators are responsible for implementation of the curriculum, and the MSUE evaluator is responsible for the design and implementation of the evaluation component of the intervention.
Of note, midway through the implementation of the ESLS program, program management and oversight responsibilities changed as the MSUE SNAP-Ed director transitioned out of his position. At this time, the MSUE evaluation manager took on many of the SNAP-Ed director’s responsibilities related to oversight of the implementation and evaluation of the ESLS program.
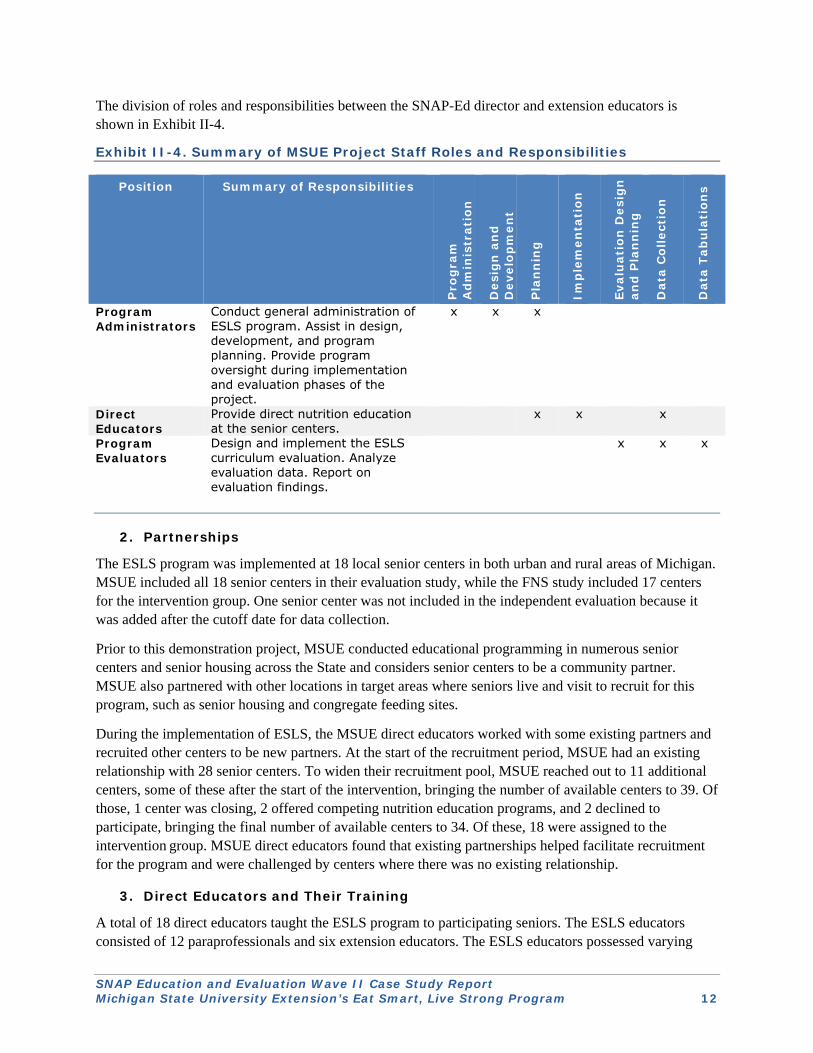
SNAP Education and Evaluation Wave II Case Study Report Michigan State University Extension’s Eat Smart, Live Strong Program 12
The division of roles and responsibilities between the SNAP-Ed director and extension educators is shown in Exhibit II-4.
Exhibit II-4. Summary of MSUE Project Staff Roles and Responsibilities
Position Summary of Responsibilities
Pro
gra
m
Ad
min
istr
atio
n
Des
ign
an
d
Dev
elop
men
t
Pla
nn
ing
Imp
lem
enta
tion
Eval
uat
ion
Des
ign
an
d P
lan
nin
g
Dat
a C
olle
ctio
n
Dat
a Ta
bu
lati
ons
Program Administrators
Conduct general administration of ESLS program. Assist in design, development, and program planning. Provide program oversight during implementation and evaluation phases of the project.
x x x
Direct Educators
Provide direct nutrition education at the senior centers.
x x x
Program Evaluators
Design and implement the ESLS curriculum evaluation. Analyze evaluation data. Report on evaluation findings.
x x x
2. Partnerships
The ESLS program was implemented at 18 local senior centers in both urban and rural areas of Michigan. MSUE included all 18 senior centers in their evaluation study, while the FNS study included 17 centers for the intervention group. One senior center was not included in the independent evaluation because it was added after the cutoff date for data collection.
Prior to this demonstration project, MSUE conducted educational programming in numerous senior centers and senior housing across the State and considers senior centers to be a community partner. MSUE also partnered with other locations in target areas where seniors live and visit to recruit for this program, such as senior housing and congregate feeding sites.
During the implementation of ESLS, the MSUE direct educators worked with some existing partners and recruited other centers to be new partners. At the start of the recruitment period, MSUE had an existing relationship with 28 senior centers. To widen their recruitment pool, MSUE reached out to 11 additional centers, some of these after the start of the intervention, bringing the number of available centers to 39. Of those, 1 center was closing, 2 offered competing nutrition education programs, and 2 declined to participate, bringing the final number of available centers to 34. Of these, 18 were assigned to the intervention group. MSUE direct educators found that existing partnerships helped facilitate recruitment for the program and were challenged by centers where there was no existing relationship.
3. Direct Educators and Their Training
A total of 18 direct educators taught the ESLS program to participating seniors. The ESLS educators consisted of 12 paraprofessionals and six extension educators. The ESLS educators possessed varying
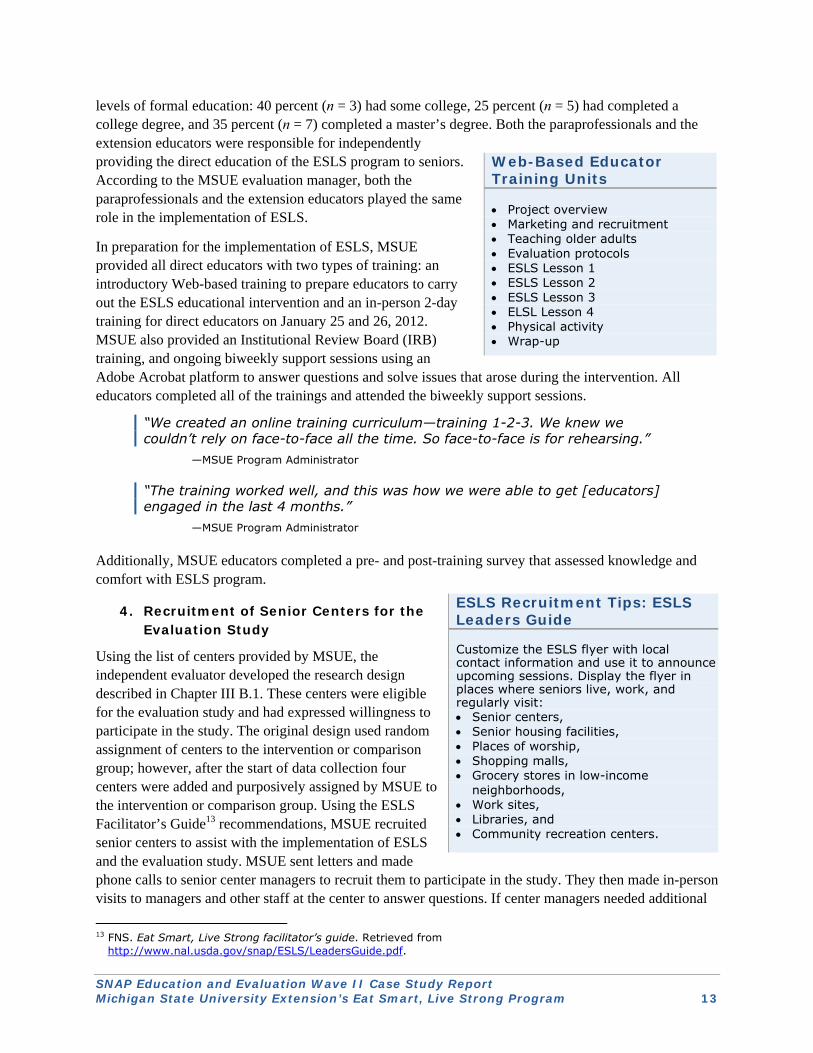
SNAP Education and Evaluation Wave II Case Study Report Michigan State University Extension’s Eat Smart, Live Strong Program 13
ESLS Recruitment Tips: ESLS Leaders Guide Customize the ESLS flyer with local contact information and use it to announce upcoming sessions. Display the flyer in places where seniors live, work, and regularly visit: Senior centers, Senior housing facilities, Places of worship, Shopping malls, Grocery stores in low-income
neighborhoods, Work sites, Libraries, and Community recreation centers.
levels of formal education: 40 percent (n = 3) had some college, 25 percent (n = 5) had completed a college degree, and 35 percent (n = 7) completed a master’s degree. Both the paraprofessionals and the extension educators were responsible for independently providing the direct education of the ESLS program to seniors. According to the MSUE evaluation manager, both the paraprofessionals and the extension educators played the same role in the implementation of ESLS.
In preparation for the implementation of ESLS, MSUE provided all direct educators with two types of training: an introductory Web-based training to prepare educators to carry out the ESLS educational intervention and an in-person 2-day training for direct educators on January 25 and 26, 2012. MSUE also provided an Institutional Review Board (IRB) training, and ongoing biweekly support sessions using an Adobe Acrobat platform to answer questions and solve issues that arose during the intervention. All educators completed all of the trainings and attended the biweekly support sessions.
“We created an online training curriculum—training 1-2-3. We knew we couldn’t rely on face-to-face all the time. So face-to-face is for rehearsing.”
—MSUE Program Administrator
“The training worked well, and this was how we were able to get [educators] engaged in the last 4 months.”
—MSUE Program Administrator
Additionally, MSUE educators completed a pre- and post-training survey that assessed knowledge and comfort with ESLS program.
4. Recruitment of Senior Centers for the Evaluation Study
Using the list of centers provided by MSUE, the independent evaluator developed the research design described in Chapter III B.1. These centers were eligible for the evaluation study and had expressed willingness to participate in the study. The original design used random assignment of centers to the intervention or comparison group; however, after the start of data collection four centers were added and purposively assigned by MSUE to the intervention or comparison group. Using the ESLS Facilitator’s Guide13 recommendations, MSUE recruited senior centers to assist with the implementation of ESLS and the evaluation study. MSUE sent letters and made phone calls to senior center managers to recruit them to participate in the study. They then made in-person visits to managers and other staff at the center to answer questions. If center managers needed additional
13 FNS. Eat Smart, Live Strong facilitator’s guide. Retrieved from
http://www.nal.usda.gov/snap/ESLS/LeadersGuide.pdf.
Web-Based Educator Training Units
Project overview Marketing and recruitment Teaching older adults Evaluation protocols ESLS Lesson 1 ESLS Lesson 2 ESLS Lesson 3 ELSL Lesson 4 Physical activity Wrap-up
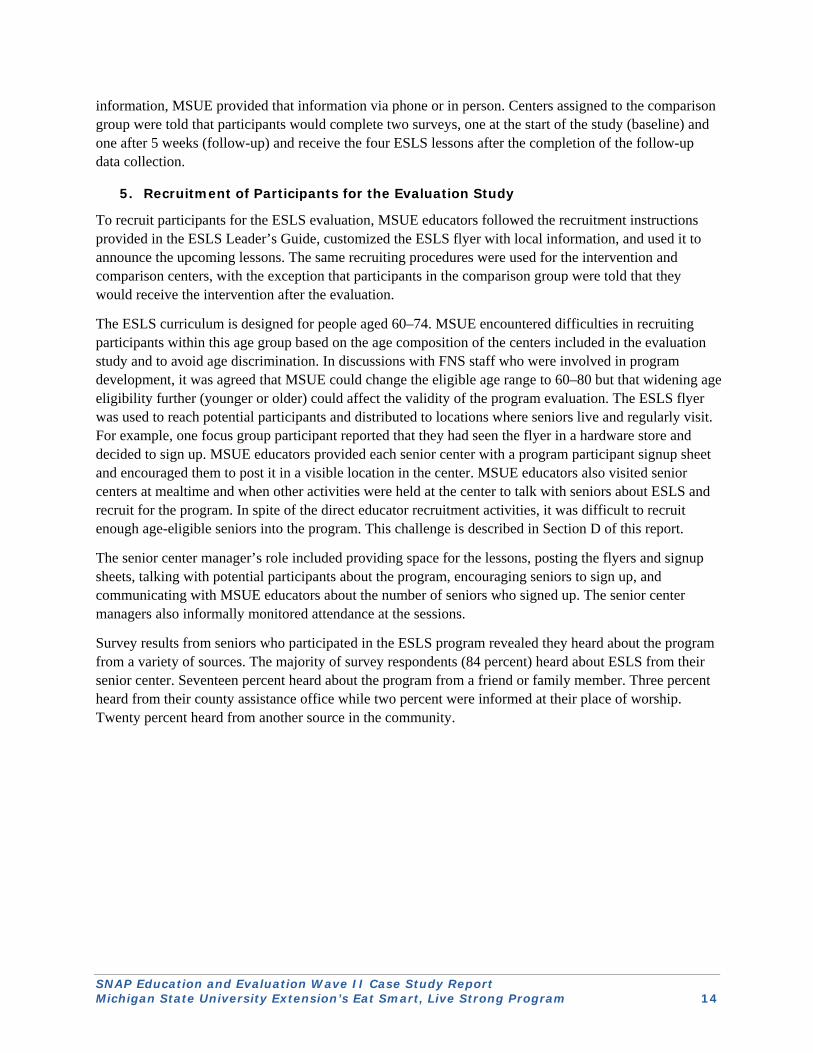
SNAP Education and Evaluation Wave II Case Study Report Michigan State University Extension’s Eat Smart, Live Strong Program 14
information, MSUE provided that information via phone or in person. Centers assigned to the comparison group were told that participants would complete two surveys, one at the start of the study (baseline) and one after 5 weeks (follow-up) and receive the four ESLS lessons after the completion of the follow-up data collection.
5. Recruitment of Participants for the Evaluation Study
To recruit participants for the ESLS evaluation, MSUE educators followed the recruitment instructions provided in the ESLS Leader’s Guide, customized the ESLS flyer with local information, and used it to announce the upcoming lessons. The same recruiting procedures were used for the intervention and comparison centers, with the exception that participants in the comparison group were told that they would receive the intervention after the evaluation.
The ESLS curriculum is designed for people aged 60–74. MSUE encountered difficulties in recruiting participants within this age group based on the age composition of the centers included in the evaluation study and to avoid age discrimination. In discussions with FNS staff who were involved in program development, it was agreed that MSUE could change the eligible age range to 60–80 but that widening age eligibility further (younger or older) could affect the validity of the program evaluation. The ESLS flyer was used to reach potential participants and distributed to locations where seniors live and regularly visit. For example, one focus group participant reported that they had seen the flyer in a hardware store and decided to sign up. MSUE educators provided each senior center with a program participant signup sheet and encouraged them to post it in a visible location in the center. MSUE educators also visited senior centers at mealtime and when other activities were held at the center to talk with seniors about ESLS and recruit for the program. In spite of the direct educator recruitment activities, it was difficult to recruit enough age-eligible seniors into the program. This challenge is described in Section D of this report.
The senior center manager’s role included providing space for the lessons, posting the flyers and signup sheets, talking with potential participants about the program, encouraging seniors to sign up, and communicating with MSUE educators about the number of seniors who signed up. The senior center managers also informally monitored attendance at the sessions.
Survey results from seniors who participated in the ESLS program revealed they heard about the program from a variety of sources. The majority of survey respondents (84 percent) heard about ESLS from their senior center. Seventeen percent heard about the program from a friend or family member. Three percent heard from their county assistance office while two percent were informed at their place of worship. Twenty percent heard from another source in the community.

SNAP Education and Evaluation Wave II Case Study Report Michigan State University Extension’s Eat Smart, Live Strong Program 15
Figure II-1. How Participants Heard About ESLS Programa
a Respondents could select multiple responses. N = 262. Source: Participant Follow-Up Survey, data collected April–July 2012.
6. Quality Assurance Efforts and Tracking Program Fidelity
Quality control primarily took the form of onsite observations conducted by the MSUE program evaluator, with support from the program administrator. The program evaluator observed educators implement pre- and post-intervention data collection and a variety of ESLS lessons. Moreover, the observations assisted MSUE administrators in determining the participants’ level of engagement in the ESLS intervention. This was documented using a standardized observation form for nutrition sessions.
The ESLS staff documented several key measures related to program fidelity, including the frequency and duration of lessons as implemented, and the number of seniors present. Educators posted the documentation in SharePoint, collaboration software available on the MSUE Intranet. Using the SharePoint site allowed MSUE administrators to monitor progress in the field throughout the project, thus assisting with quality assurance efforts and tracking program fidelity.
7. Program Reach
The ESLS intervention was implemented between February and July 2012. During this period, a total of 326 seniors across 18 centers, received the ESLS program. MSUE planned for the ESLS program to be implemented at four urban14 centers and nine rural senior sites and centers. The actual ESLS implementation occurred in 4 urban and 14 rural senior sites due to recruitment issues cited in Section D.2.
Table II-1 illustrates the number of sessions that were completed at participating centers (or sites), the total number of seniors participating in the intervention, and the mean number of seniors per session. The number of ESLS programs completed by each center or site is the number of times that the sequence was taught. The mean size of intervention sessions across all centers was seven participants.
14 The U.S. Census bureau defines urban as areas with a population of 50,000 or more.
0%
1%
2%
3%
17%
20%
84%
0% 20% 40% 60% 80% 100%
Doctor, nurse, other healthcare provider
Don’t remember
Place of worship
County Assistance Office
Friend or family
Other
Senior center

SNAP Education and Evaluation Wave II Case Study Report Michigan State University Extension’s Eat Smart, Live Strong Program 16
Table II-1. ESLS Program Reach
Senior Centers
Number of ESLS Programs
Completed by Center or Site
Total Number of Seniors
Participating in Interventiona
Mean Number of Seniors at
Intervention Sessions
Maplewood Manor 3 14 5 South Colony 2 19 10 West Side Friendship Village 2 14 7 Breton Village Green 6 56 9 Burnside 3 8 3 Dover Court 3 20 7 Englewood 2 20 10 COA Activity Center 4 11 3 COA Foster Grandparent Program 1 6 6 Grand Traverse, Traverse City 3 23 8 Grand Traverse, Kewadin 1 7 7 Grand Traverse, Leelanau 2 7 4 Lake Manor 1 8 8 Montrose 3 16 5 Thetford 6 49 8 Newaygo Council on Aging 4 28 7 Pickford Township 2 11 6 Raber Township 2 9 5 Total 50 326 7
a Participation was based on enrollment for each intervention center. Source: ESLS program data provided by MSUE.
8. Program Dosage and Exposure
a. Senior center classes
In addition to knowing the program’s reach, it is important to determine the exposure level that participants have to the program. In this section, an analysis of data on senior’s exposure to the program lessons is presented. Lesson exposure is defined as the number of lessons each person attended and the number of minutes spent in the lessons. In addition to knowing how many seniors were enrolled in the program, it is important to understand how much of the intervention participants received. In Table II-2, average exposure to the ESLS program is presented in minutes per lesson. The lesson time includes the warmup exercises, core lesson, and cooldown exercises. Analysis of the ESLS program data show that on average, seniors received a total of 259 minutes (4.3 hours) of nutrition and physical activity education through ESLS, with individual lessons ranging from 61 to 68 minutes. The exercises required more time than originally expected.
“Many instructors noted that the exercises took longer than the 10 minutes that was originally projected.”
—MSUE administrator
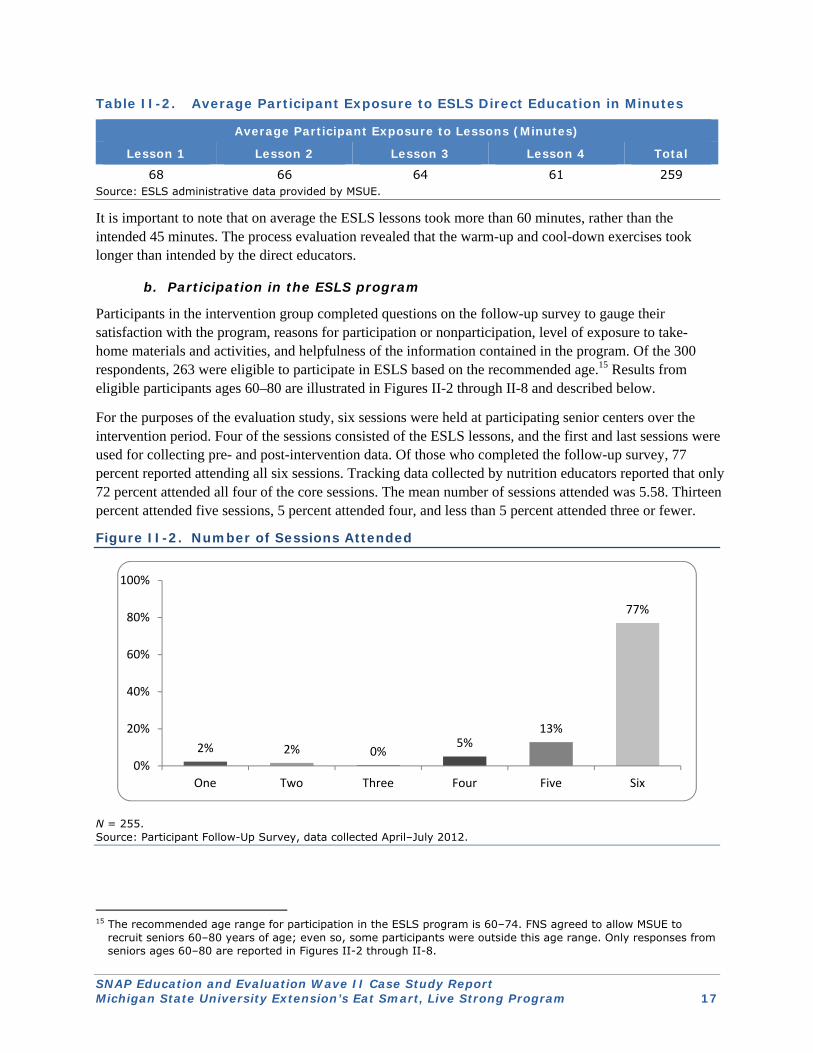
SNAP Education and Evaluation Wave II Case Study Report Michigan State University Extension’s Eat Smart, Live Strong Program 17
Table II-2. Average Participant Exposure to ESLS Direct Education in Minutes
Average Participant Exposure to Lessons (Minutes)
Lesson 1 Lesson 2 Lesson 3 Lesson 4 Total
68 66 64 61 259 Source: ESLS administrative data provided by MSUE.
It is important to note that on average the ESLS lessons took more than 60 minutes, rather than the intended 45 minutes. The process evaluation revealed that the warm-up and cool-down exercises took longer than intended by the direct educators.
b. Participation in the ESLS program
Participants in the intervention group completed questions on the follow-up survey to gauge their satisfaction with the program, reasons for participation or nonparticipation, level of exposure to take-home materials and activities, and helpfulness of the information contained in the program. Of the 300 respondents, 263 were eligible to participate in ESLS based on the recommended age.15 Results from eligible participants ages 60–80 are illustrated in Figures II-2 through II-8 and described below.
For the purposes of the evaluation study, six sessions were held at participating senior centers over the intervention period. Four of the sessions consisted of the ESLS lessons, and the first and last sessions were used for collecting pre- and post-intervention data. Of those who completed the follow-up survey, 77 percent reported attending all six sessions. Tracking data collected by nutrition educators reported that only 72 percent attended all four of the core sessions. The mean number of sessions attended was 5.58. Thirteen percent attended five sessions, 5 percent attended four, and less than 5 percent attended three or fewer.
Figure II-2. Number of Sessions Attended
N = 255. Source: Participant Follow-Up Survey, data collected April–July 2012.
15 The recommended age range for participation in the ESLS program is 60–74. FNS agreed to allow MSUE to
recruit seniors 60–80 years of age; even so, some participants were outside this age range. Only responses from seniors ages 60–80 are reported in Figures II-2 through II-8.
2% 2% 0%5%
13%
77%
0%
20%
40%
60%
80%
100%
One Two Three Four Five Six
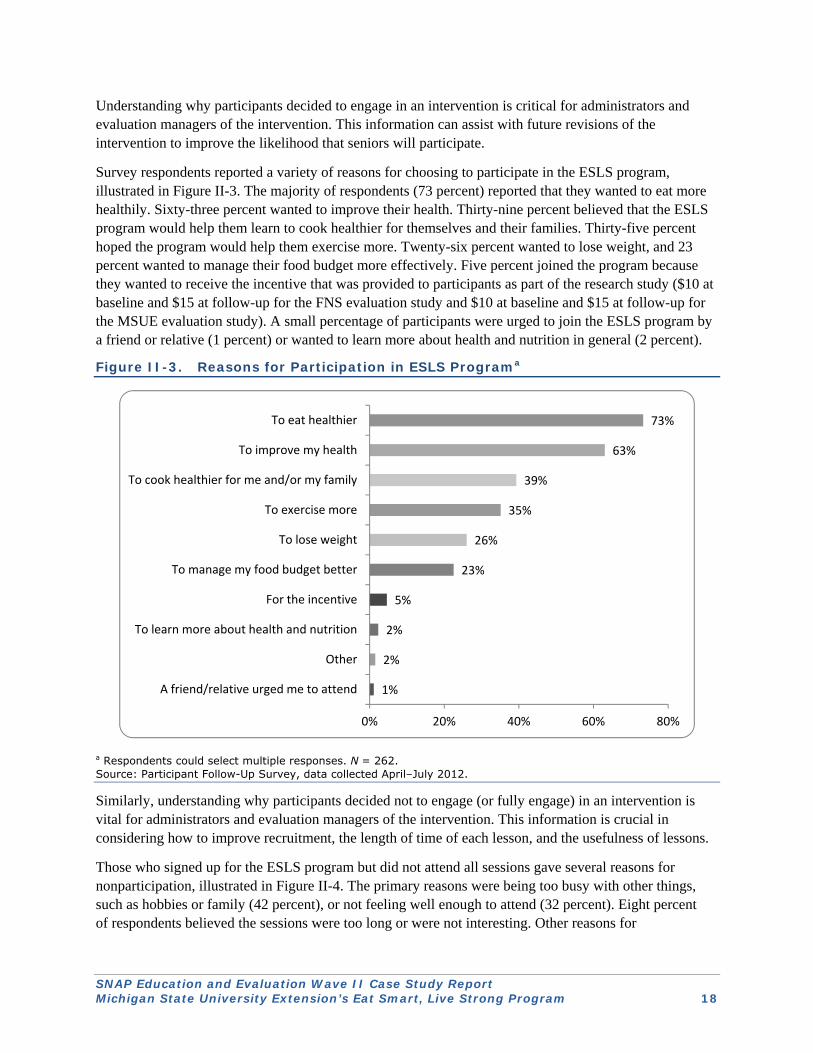
SNAP Education and Evaluation Wave II Case Study Report Michigan State University Extension’s Eat Smart, Live Strong Program 18
Understanding why participants decided to engage in an intervention is critical for administrators and evaluation managers of the intervention. This information can assist with future revisions of the intervention to improve the likelihood that seniors will participate.
Survey respondents reported a variety of reasons for choosing to participate in the ESLS program, illustrated in Figure II-3. The majority of respondents (73 percent) reported that they wanted to eat more healthily. Sixty-three percent wanted to improve their health. Thirty-nine percent believed that the ESLS program would help them learn to cook healthier for themselves and their families. Thirty-five percent hoped the program would help them exercise more. Twenty-six percent wanted to lose weight, and 23 percent wanted to manage their food budget more effectively. Five percent joined the program because they wanted to receive the incentive that was provided to participants as part of the research study ($10 at baseline and $15 at follow-up for the FNS evaluation study and $10 at baseline and $15 at follow-up for the MSUE evaluation study). A small percentage of participants were urged to join the ESLS program by a friend or relative (1 percent) or wanted to learn more about health and nutrition in general (2 percent).
Figure II-3. Reasons for Participation in ESLS Programa
a Respondents could select multiple responses. N = 262. Source: Participant Follow-Up Survey, data collected April–July 2012.
Similarly, understanding why participants decided not to engage (or fully engage) in an intervention is vital for administrators and evaluation managers of the intervention. This information is crucial in considering how to improve recruitment, the length of time of each lesson, and the usefulness of lessons.
Those who signed up for the ESLS program but did not attend all sessions gave several reasons for nonparticipation, illustrated in Figure II-4. The primary reasons were being too busy with other things, such as hobbies or family (42 percent), or not feeling well enough to attend (32 percent). Eight percent of respondents believed the sessions were too long or were not interesting. Other reasons for
1%
2%
2%
5%
23%
26%
35%
39%
63%
73%
0% 20% 40% 60% 80%
A friend/relative urged me to attend
Other
To learn more about health and nutrition
For the incentive
To manage my food budget better
To lose weight
To exercise more
To cook healthier for me and/or my family
To improve my health
To eat healthier
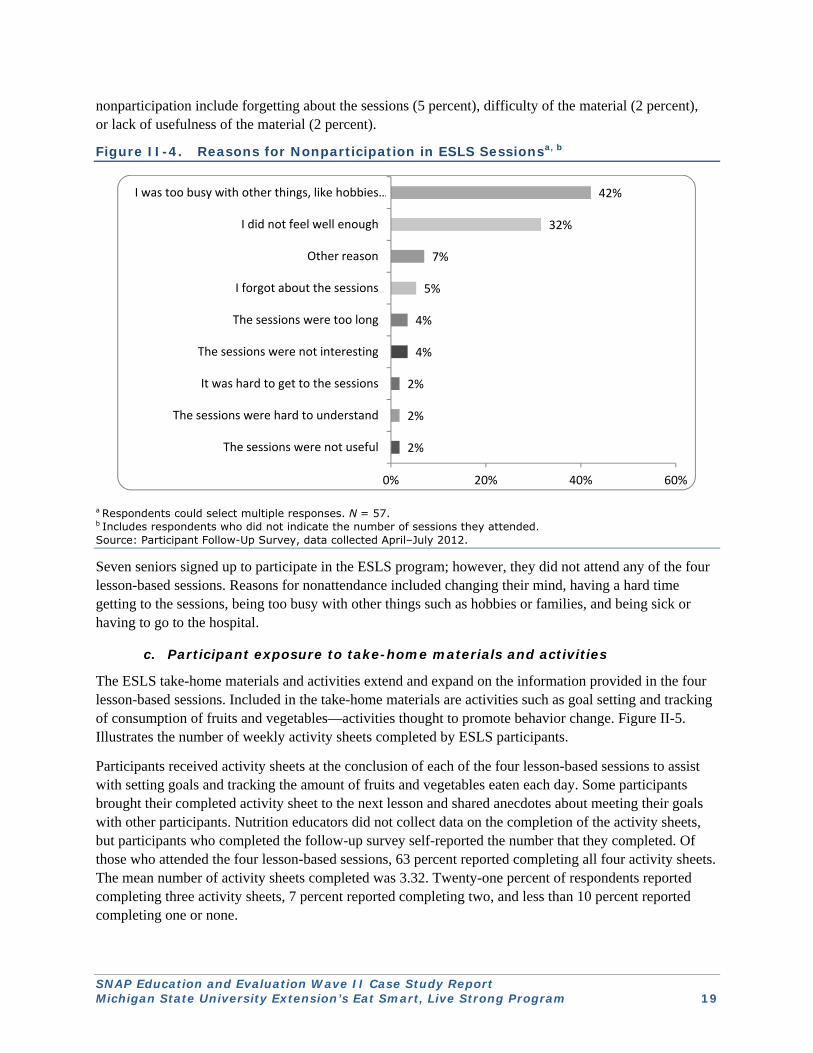
SNAP Education and Evaluation Wave II Case Study Report Michigan State University Extension’s Eat Smart, Live Strong Program 19
nonparticipation include forgetting about the sessions (5 percent), difficulty of the material (2 percent), or lack of usefulness of the material (2 percent).
Figure II-4. Reasons for Nonparticipation in ESLS Sessionsa, b
a Respondents could select multiple responses. N = 57. b Includes respondents who did not indicate the number of sessions they attended. Source: Participant Follow-Up Survey, data collected April–July 2012.
Seven seniors signed up to participate in the ESLS program; however, they did not attend any of the four lesson-based sessions. Reasons for nonattendance included changing their mind, having a hard time getting to the sessions, being too busy with other things such as hobbies or families, and being sick or having to go to the hospital.
c. Participant exposure to take-home materials and activities
The ESLS take-home materials and activities extend and expand on the information provided in the four lesson-based sessions. Included in the take-home materials are activities such as goal setting and tracking of consumption of fruits and vegetables—activities thought to promote behavior change. Figure II-5. Illustrates the number of weekly activity sheets completed by ESLS participants.
Participants received activity sheets at the conclusion of each of the four lesson-based sessions to assist with setting goals and tracking the amount of fruits and vegetables eaten each day. Some participants brought their completed activity sheet to the next lesson and shared anecdotes about meeting their goals with other participants. Nutrition educators did not collect data on the completion of the activity sheets, but participants who completed the follow-up survey self-reported the number that they completed. Of those who attended the four lesson-based sessions, 63 percent reported completing all four activity sheets. The mean number of activity sheets completed was 3.32. Twenty-one percent of respondents reported completing three activity sheets, 7 percent reported completing two, and less than 10 percent reported completing one or none.
2%
2%
2%
4%
4%
5%
7%
32%
42%
0% 20% 40% 60%
The sessions were not useful
The sessions were hard to understand
It was hard to get to the sessions
The sessions were not interesting
The sessions were too long
I forgot about the sessions
Other reason
I did not feel well enough
I was too busy with other things, like hobbies …
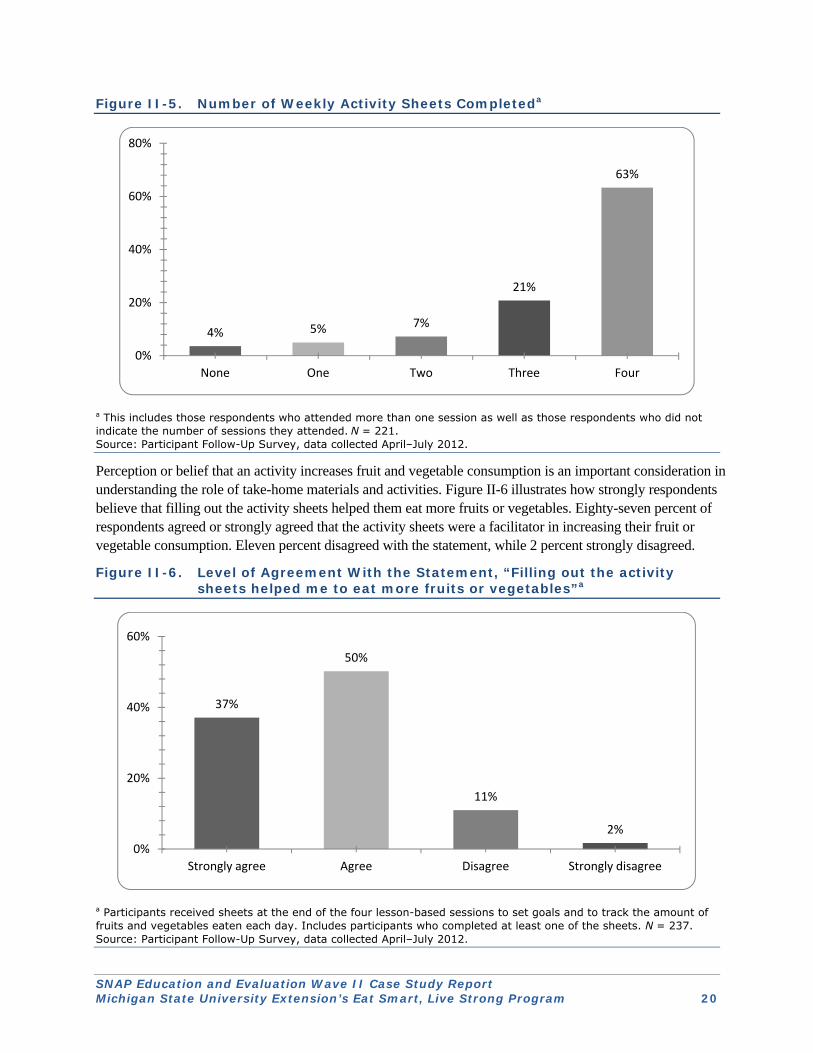
SNAP Education and Evaluation Wave II Case Study Report Michigan State University Extension’s Eat Smart, Live Strong Program 20
Figure II-5. Number of Weekly Activity Sheets Completeda
a This includes those respondents who attended more than one session as well as those respondents who did not indicate the number of sessions they attended. N = 221. Source: Participant Follow-Up Survey, data collected April–July 2012.
Perception or belief that an activity increases fruit and vegetable consumption is an important consideration in understanding the role of take-home materials and activities. Figure II-6 illustrates how strongly respondents believe that filling out the activity sheets helped them eat more fruits or vegetables. Eighty-seven percent of respondents agreed or strongly agreed that the activity sheets were a facilitator in increasing their fruit or vegetable consumption. Eleven percent disagreed with the statement, while 2 percent strongly disagreed.
Figure II-6. Level of Agreement With the Statement, “Filling out the activity sheets helped me to eat more fruits or vegetables”a
a Participants received sheets at the end of the four lesson-based sessions to set goals and to track the amount of fruits and vegetables eaten each day. Includes participants who completed at least one of the sheets. N = 237. Source: Participant Follow-Up Survey, data collected April–July 2012.
4% 5% 7%
21%
63%
0%
20%
40%
60%
80%
None One Two Three Four
37%
50%
11%
2%
0%
20%
40%
60%
Strongly agree Agree Disagree Strongly disagree
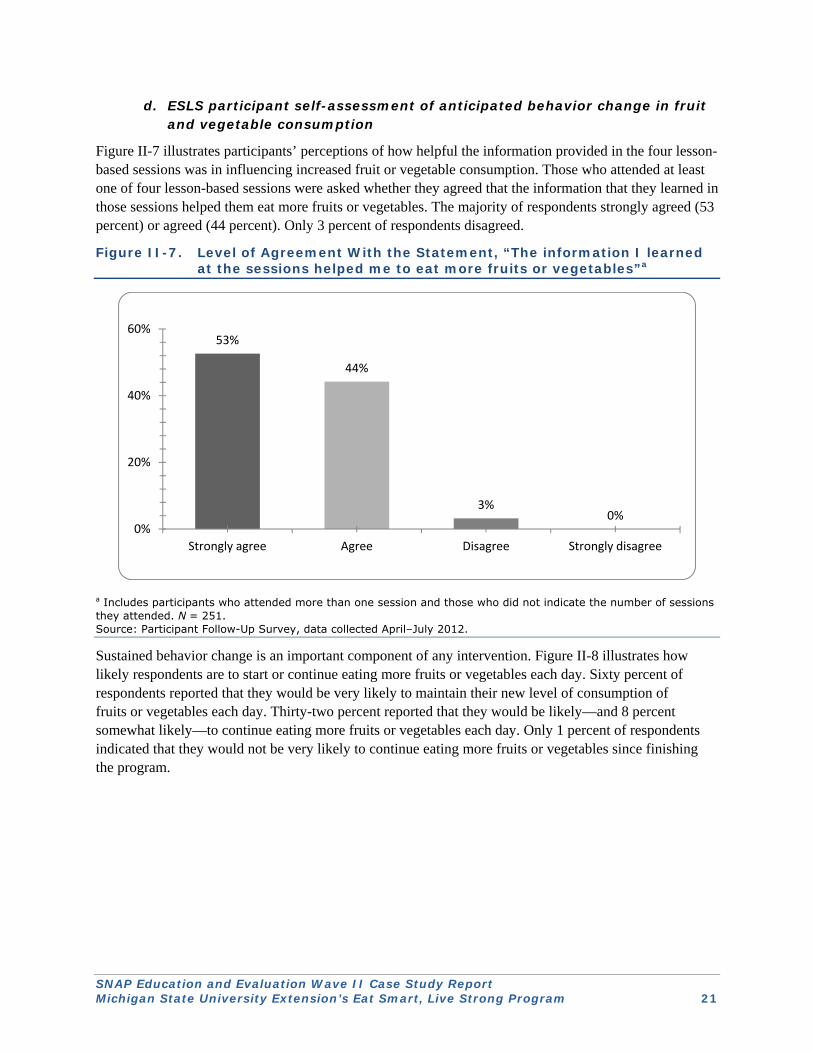
SNAP Education and Evaluation Wave II Case Study Report Michigan State University Extension’s Eat Smart, Live Strong Program 21
d. ESLS participant self-assessment of anticipated behavior change in fruit and vegetable consumption
Figure II-7 illustrates participants’ perceptions of how helpful the information provided in the four lesson-based sessions was in influencing increased fruit or vegetable consumption. Those who attended at least one of four lesson-based sessions were asked whether they agreed that the information that they learned in those sessions helped them eat more fruits or vegetables. The majority of respondents strongly agreed (53 percent) or agreed (44 percent). Only 3 percent of respondents disagreed.
Figure II-7. Level of Agreement With the Statement, “The information I learned at the sessions helped me to eat more fruits or vegetables”a
a Includes participants who attended more than one session and those who did not indicate the number of sessions they attended. N = 251. Source: Participant Follow-Up Survey, data collected April–July 2012.
Sustained behavior change is an important component of any intervention. Figure II-8 illustrates how likely respondents are to start or continue eating more fruits or vegetables each day. Sixty percent of respondents reported that they would be very likely to maintain their new level of consumption of fruits or vegetables each day. Thirty-two percent reported that they would be likely—and 8 percent somewhat likely—to continue eating more fruits or vegetables each day. Only 1 percent of respondents indicated that they would not be very likely to continue eating more fruits or vegetables since finishing the program.
53%
44%
3%0%
0%
20%
40%
60%
Strongly agree Agree Disagree Strongly disagree

SNAP Education and Evaluation Wave II Case Study Report Michigan State University Extension’s Eat Smart, Live Strong Program 22
Figure II-8. Likelihood of Starting or Continuing to Eat More Fruits or Vegetables Each Day Since Finishing the Programa
a Includes participants who attended more than one session and those who did not indicate the number of sessions they attended. N = 251. Source: Participant Follow-Up Survey, data collected April–July 2012.
e. Other nutrition messaging in senior center environment
Observations at a subset of both urban and rural centers provided insight into nutrition and physical activity educational materials, flyers, or posters other than ESLS materials and messages that may have been available to ESLS participants. Based on these observations, there were few if any materials displayed for seniors. The exception was in some senior centers that displayed educational information about diabetes management, especially centers with large Native American populations. In focus group interviews, seniors mentioned that some senior centers provided information about the farmers’ market coupon program, and distributed coupons to seniors at the center. Outside of these examples, nutrition and physical activity information was not available at senior centers.
9. Resources and Costs of Program Implementation
Because MSUE used the ESLS program developed by FNS, there were no costs to MSUE for the design and development of this intervention. The ESLS Activity Kit located on the SNAP-Ed Connection Web site (FNS, 2007a) contains a leader’s guide, four interactive lessons, 10 sets of participant handouts, one set of black and white reproducible documents, and a CD with PDF files of all items in the kit.
This section discusses the cost of implementing the ESLS program and a breakout of the reported cost centers. It also includes an analysis of the costs as they relate to the number of seniors served by the program. The detailed budget tables MSUE provided for this evaluation, including a breakout of non-Federal and Federal funding for each budget category, are included in Appendix B. Costs associated with MSUE’s self-evaluation are reported separately in Chapter IV.
0% 1%
8%
32%
60%
0%
20%
40%
60%
80%
Not at all likely Not very likely Somewhat likely Likely Very likely

SNAP Education and Evaluation Wave II Case Study Report Michigan State University Extension’s Eat Smart, Live Strong Program 23
a. Costs for program implementation
Costs included in this section are those that can be associated with the implementation of the ESLS intervention. They include both direct and indirect costs.
● Total program cost for implementation: $43,419 ● Sources of funding by type:
Non-Federal funds $0 Federal non-SNAP-Ed funds $11,467 Federal SNAP-Ed funds $31,952
The resources needed for ESLS program implementation fall into four primary cost categories: salary and benefits, noncapital equipment and supplies, travel, and indirect costs. The types of expenditures that MSUE reported as included in the areas of salaries, noncapital equipment, materials, and travel are described below.16
● Salary and benefits. This expense includes the salaries or hourly wages for the IA staff that supported ESLS implementation directly or administratively. As shown in Section 2.1 of Appendix B, the staffing costs for ESLS implementation includes the following:
Position Number of FTEs Program manager (1 staff member) 0.05 Co-program manager (1 staff member) 0.04 Extension educators (6 staff member) 0.04 Program instructors (12 staff member) 0.04 Total 0.17
● Noncapital equipment and supplies. This expense includes costs associated with office and classroom supplies for the implementation of ESLS.
● Materials. This expense includes costs associated with reproducing education materials, and classroom educational materials related to the implementation of ESLS.
● Travel. This expense includes the costs for MSUE staff to travel to training and to and from senior centers to teach ESLS and for administrators to observe implementation of ESLS.
Table II-3 outlines the actual expenditures MSUE reports as the costs of ESLS implementation in FFY 2012.
Table II-3. Summary of MSUE Costs for Implementation of ESLS Program (FFY 2012)
Budget Category Expenditures Percentage of Total Costs
Salary and benefits $24,086 55.5 Noncapital equipment and supplies $4,804 11.1 Materials $2,534 5.8 Travel $6,670 15.4 Total direct costs $38,094 87.8 Indirect costsa $5,325 12.2 Total $43,419 100
a Indirect costs of 20 percent are charged only on Federal SNAP-Ed funds. The funding streams noted above are both Federal non-SNAP-Ed and Federal SNAP-Ed. The indirect cost charged to total costs is 12.2 percent. Source: Cost data provided by MSUE (see completed Resource and Expense Tracking Form in Appendix B).
16 Budget justification language was provided by MSUE to Altarum, and FTE information was extracted from MSUE
ESLS Resources and Expenses Tracking Form (included in Appendix B).

SNAP Education and Evaluation Wave II Case Study Report Michigan State University Extension’s Eat Smart, Live Strong Program 24
b. Program cost per participant
Calculating costs per program participant presents some challenges. Depending on the type of intervention, costs per program participant can be calculated based on the number of clients who receive a single intervention dose, complete the entire intervention, or are enrolled at a “site” where interventions are being conducted regardless of their receipt of education or materials.
Since ESLS provides programming for individual participants, the number of seniors enrolled in the intervention lessons prior to the start of the intervention was used as the basis of the cost per participant calculation. Using the total program expenditures ($43,419) and this total number of seniors potentially reached through direct education (n = 326), the estimated cost per senior participant was $133.19.
Additionally, because ESLS is a center-based program, it is important to note that there are economies of scale with practical implications on the resources required to replicate the program elsewhere. For example, the costs associated with implementing the program in a center with eight seniors per session might not be substantially different from the costs associated with implementing the program in a center with 15 seniors per session, yet the reach of the program would be substantially greater for the latter scenario. For this reason, cost per center ($2,411.83), derived using the same formula described above but with 18 centers as the denominator, was also estimated.
D. Factors Affecting Program Implementation and Opportunities for Improvement
Overall, program managers, direct educators, intervention site staff members, and seniors participating in the ESLS program reported a high degree of satisfaction with the program, saying that they liked the content and approach. Direct educators said that the program was easy to implement and attributed this to both clarity of the lesson plans and the program’s emphasis on training and quality oversight and improvement. Senior center staff emphasized that the lesson content and approach were critical to achieving the program’s desired behavioral outcomes and cited the direct educators’ enthusiasm and teaching skills as key to the program’s acceptance and effectiveness. Key informants’ responses highlighted the critical role that senior center staff plays in facilitating the program’s implementation and reinforcing its messages.
The process evaluation also identified several critical challenges to implementing this program in senior centers. In particular, findings highlighted the challenge of reaching and engaging senior audiences. Program implementers also provided recommendations for how the program could be modified to improve its reach and effectiveness.
The most commonly reported facilitators and challenges to program implementation are listed in Exhibit II-5 and described in greater detail below. Opportunities for improving the program to address the challenges identified are also discussed. Quotes from key informants are included to highlight their perspectives.
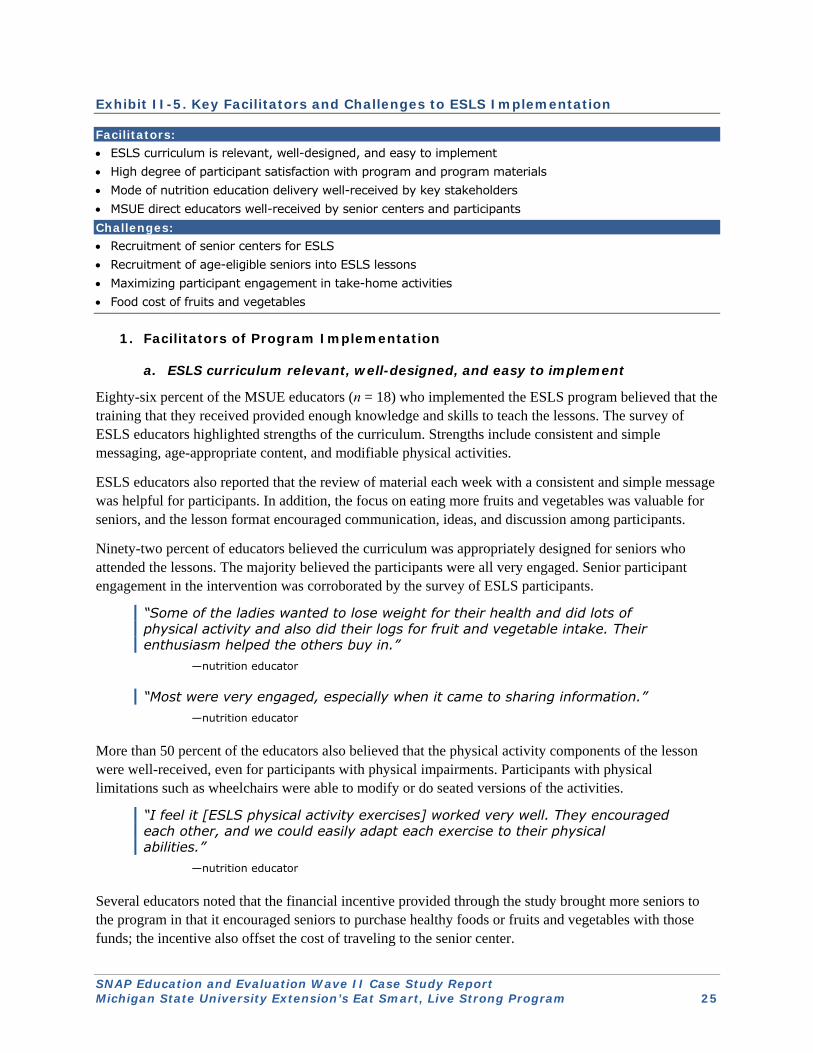
SNAP Education and Evaluation Wave II Case Study Report Michigan State University Extension’s Eat Smart, Live Strong Program 25
Exhibit II-5. Key Facilitators and Challenges to ESLS Implementation
Facilitators: ESLS curriculum is relevant, well-designed, and easy to implement High degree of participant satisfaction with program and program materials Mode of nutrition education delivery well-received by key stakeholders MSUE direct educators well-received by senior centers and participants Challenges: Recruitment of senior centers for ESLS Recruitment of age-eligible seniors into ESLS lessons Maximizing participant engagement in take-home activities Food cost of fruits and vegetables
1. Facilitators of Program Implementation
a. ESLS curriculum relevant, well-designed, and easy to implement
Eighty-six percent of the MSUE educators (n = 18) who implemented the ESLS program believed that the training that they received provided enough knowledge and skills to teach the lessons. The survey of ESLS educators highlighted strengths of the curriculum. Strengths include consistent and simple messaging, age-appropriate content, and modifiable physical activities.
ESLS educators also reported that the review of material each week with a consistent and simple message was helpful for participants. In addition, the focus on eating more fruits and vegetables was valuable for seniors, and the lesson format encouraged communication, ideas, and discussion among participants.
Ninety-two percent of educators believed the curriculum was appropriately designed for seniors who attended the lessons. The majority believed the participants were all very engaged. Senior participant engagement in the intervention was corroborated by the survey of ESLS participants.
“Some of the ladies wanted to lose weight for their health and did lots of physical activity and also did their logs for fruit and vegetable intake. Their enthusiasm helped the others buy in.”
—nutrition educator
“Most were very engaged, especially when it came to sharing information.” —nutrition educator
More than 50 percent of the educators also believed that the physical activity components of the lesson were well-received, even for participants with physical impairments. Participants with physical limitations such as wheelchairs were able to modify or do seated versions of the activities.
“I feel it [ESLS physical activity exercises] worked very well. They encouraged each other, and we could easily adapt each exercise to their physical abilities.”
—nutrition educator
Several educators noted that the financial incentive provided through the study brought more seniors to the program in that it encouraged seniors to purchase healthy foods or fruits and vegetables with those funds; the incentive also offset the cost of traveling to the senior center.
SNAP Education and Evaluation Wave II Case Study Report Michigan State University Extension’s Eat Smart, Live Strong Program 26
“In many cases, [the incentive] was the ‘ace in the hole’ for participants.” —nutrition educator
b. High degree of participant satisfaction with program and program materials
Seniors who participated in focus group discussions provided positive feedback about the ESLS program and take-home materials. They consistently said that they liked the messages in the program and found the materials useful in helping them eat healthier foods.
“I had a lot of residents tell me they learned a lot. They thought they knew about eating healthy, but it made them think a lot about how they were eating and storing food with the food diaries.”
—senior center director
“It was probably reading the labels [that I found the most useful], the contents of what’s in it and all that. I never paid that much attention up until lately, when they told me about my diabetes. Now I stand in the store and read [the labels].”
—ESLS program participant
“[One of the other participants] sits at the table out there and does these exercises, and she’s not even aware that we’re looking at her, and I’m like, ‘I know where she learned that.’”
—ESLS program participant
Another component of the program enjoyed by seniors was the daily logs.
“That is what I like: the daily logs. They helped me balance out, because I was eating only when I wanted, and it showed me how to eat and how to balance the portions and everything.”
—ESLS program participant
Moreover, observations conducted at selected senior centers implementing ESLS clearly demonstrated seniors were engaged in the program by questions that they asked and input that they provided. Focus group interviews revealed that seniors enjoyed participating in the nutrition education and physical activity components of the program and that they were looking forward to another program of this nature if it were offered at their center.
c. Mode of nutrition education delivery well-received by key stakeholders
Interviews with center directors and center administrators provided a great deal of insight into how ESLS was received. The directors enjoyed having this programming available for their participants, because it helps provide a well-rounded grouping of programs for their seniors.
“We had people who wanted to join and couldn’t because there wasn’t room. A lot of elders don’t do things at first, but once others talk about it and how good it is, they want to sign up.”
—senior center director
The center directors also mentioned the limited time commitment (a 1-hour session in a series no longer than 6 weeks) works well for their participants.

SNAP Education and Evaluation Wave II Case Study Report Michigan State University Extension’s Eat Smart, Live Strong Program 27
“I don’t think anyone dropped out.” —senior center director
More than one senior center director mentioned that the content of the ESLS program and the methods used in teaching it were appropriate for seniors.
“I think they like to feel like they can still learn and accomplish something, something worthwhile they can participate in, and they got satisfaction from that.”
—senior center director
d. MSUE direct educators well-received by senior centers and participants
Focus group participants reported a high-degree of respect for MSUE educational programming. Seniors noted the combination of programming from MSU and the professional educators employed by cooperative extension provides a level of respect for programs that they offer to the community.
“When I see anything that says it’s sponsored by MSU, I’m going to it.” —ESLS program participant
“The residents gave us positive feedback on the instructors.” —senior center director
2. Challenges to Implementation and Opportunities for Improvement
Program administrators recognized and reported several challenges that they faced in implementing the ESLS program. Interestingly, there was some overlap between the challenges cited by these key informants and the barriers reported by seniors who participated in the intervention. This section provides a description of the challenges identified by these key stakeholder groups followed by recommendations for program improvement to specifically address some of the challenges or barriers that they cited.
a. Recruitment of senior centers and seniors for ESLS
Recruitment of senior centers in educational programming can be challenging. In the implementation of the ESLS program, it was necessary to extend the timeline for recruitment of centers, and expand the age eligibility requirement to recruit seniors. Even with these changes, 12 percent of senior center participants who were recruited were not eligible to participate.
With these challenges, center managers must consider the interests of their seniors, whether they know and trust the organization providing the educational offering, whether there is time and space for a series of programs, and program eligibility of seniors. Some center managers were more resistant to being recruited than others.
“Some senior centers were not cooperative, so we didn’t push those centers. We only wanted centers that wanted to participate willingly with us.”
—MSUE program administrator
SNAP Education and Evaluation Wave II Case Study Report Michigan State University Extension’s Eat Smart, Live Strong Program 28
Additionally, it was difficult to recruit participants at some senior centers.
“We experienced difficulty recruiting participants in various senior centers, for reasons such as changes in staff or contact persons, or the amount of the population served by that center, among other reasons.”
—MSUE program administrator
As reported in the ESLS educator survey, the majority of educators asked the senior center site coordinators to recruit seniors for the ESLS program. Educators reported some centers that recruited 10 participants per class and others that recruited only 5–8. The targeted class size was 10 participants. Educators believed that the lack of participation was due to transportation issues, health problems, having other things to do, timing, unwillingness to commit to a 6-week program, and seniors leaving the area for the winter.
▲ Opportunities for improvement
Educators and administrators suggested that establishment of strong relationships with partners is essential to the success of program implementation if the expectation is that the partner will assist with the recruitment of participants for the intervention. Key steps in the development of partnerships include clarity of purpose, ownership, identification of the right people with which to work, development and maintenance of a level of trust, and development of roles and working arrangements. Taking the time to help partners understand the mutual benefits of partnering, establishing clear channels of communication, and developing an understanding of respective roles can help provide the foundation for strong partnerships.
b. Recruitment of seniors in the ESLS target age range
ESLS is designed for able-bodied, independent adults 60–74 years of age (FNS, 2007b). This age range is difficult to achieve at senior centers, where many residents are older than 74 and do not want to be excluded from programming.
The MSUE demonstration project recruitment materials targeted seniors ages 60–74, but younger and older seniors also signed up for the program. During the course of the study, when MSUE was experiencing difficulties in the recruitment of the target age range, FNS allowed an age range of 60–80 years to be enrolled in ESLS for the purpose of the study. Of the 300 ESLS participants who participated in the intervention for the independent evaluation, 37 (12 percent) were younger than 60 or older than 80. This represents a significant number of seniors who were not targeted for the ESLS program yet participated.
Educators are encouraged to consider cognitive abilities, vision, hearing, and mobility limitations when planning lessons for groups of seniors. The ESLS Leader’s Guide emphasizes that ESLS was developed and tested for low-income adults 60–74 years of age, but even in this age range, seniors’ needs and capabilities vary greatly.
“With our particular building, some of our 80-year-olds are in better shape than the 70-year-olds. They are more mentally competent and able to do things. That’s what got them to 80 in the first place. We’ve got a couple of 90-year-olds; they take the Meijer bus. We’ve got some 60-year-olds who are doing really bad.”
—senior center director

SNAP Education and Evaluation Wave II Case Study Report Michigan State University Extension’s Eat Smart, Live Strong Program 29
▲ Opportunities for improvement
Process evaluation findings indicate that in the recruitment of age-appropriate seniors, senior center staff and counselors play a key role in supporting the recruitment of seniors into the ESLS program. Furthermore, center staff could serve as guides in determining whether seniors are well-suited to the activities and demands of ESLS, within the targeted age range. An approach educators could suggest to senior center staff is having center staff provide initial written information about the program to participants and then follow up with personal contact with potential participants. The focus group respondents at a center that used this approach believed that the personal interaction between center staff and potential participants helped them make a decision about coming to the ESLS lessons.
“Our people upstairs [senior center staff] helped a lot of us. I think we originally got a letter in our door box from them, and then they came around to our rooms to talk to us about the program.”
—ESLS program participant
Other recruitment efforts focus on the most culturally appropriate means for their participants. The Native American focus group clearly stated that the best way to learn about programming in their senior center was through their Tribe. They look to the Tribe for credible information and guidance.
“I heard about the program through the Tribe.” —ESLS program participant
c. Maximizing participant engagement in take-home activities
ESLS lesson materials include handouts for participants to complete in class, take-home reference materials, and a “Set Your Goals” activity sheet to complete and bring back to the next class. The activity sheets asked participants to set physical activity, and fruit and vegetable consumption goals for the next week.
A majority of participants either agreed or strongly agreed that filling out the activity sheets influenced them to eat more fruits and vegetables. Moreover, 63 percent completed all four activity sheets, while 21 percent completed three.
▲ Opportunities for improvement
The primary focus of the ESLS program is helping seniors set realistic goals for consumption of fruits and vegetables, and exercise. The underlying assumption is that setting specific goals will lead to greater behavior change. Since 37 percent of ESLS participants did not complete all four activity sheets, motivating a higher percentage of senior ESLS participants to complete all activity sheets each week would assist in the promotion of positive behaviors and set the stage for discussion of barriers and challenges in class. Training for ESLS educators should include techniques to motivate seniors to complete the activity sheets and bring them to class (e.g., the use of incentives).
d. Cost of purchasing fruits and vegetables
Although the materials include references and activities that clearly point out the use of fresh, canned, frozen, and dried fruits and vegetables, seniors felt that in general, the cost of fruit and vegetables can be a barrier to consuming more.

SNAP Education and Evaluation Wave II Case Study Report Michigan State University Extension’s Eat Smart, Live Strong Program 30
“In the winter, you can’t go out and pick apples. You can’t go in the garden and get things. You have to get them from somewhere else. And they ship them here, so it costs more.”
—ESLS program participant
In focus group discussions, some seniors stated that while they very much liked the goals of the program, the cost of fresh fruits and vegetables on a very limited budget was a major barrier to increasing the amount of fruits and vegetables in their diet.
“When you have bills to pay and you pay those bills, sometimes there’s not enough money left over to go to the store for food.”
—ESLS program participant
They also stated that it can be difficult to make trips to the grocery store for fresh fruits and vegetables on a regular basis if they do not have transportation. The ESLS program information, however, does provide some suggestions for getting to the grocery store (e.g., asking a friend for a ride, using public transportation).
“If you get a check once a month and you need to buy groceries for the month, you need to decide how much groceries you have to buy for that month, because maybe gasoline costs too much to get there to go every day.”
—ESLS program participant
“And it all depends on how many trips you can make into the supermarket a week—if you can go every day or if you can go once a week or twice a week. That makes a big difference on if you want to buy frozen or if you want to buy fresh, because you can keep fresh vegetables or fruit for just so long. Then you have to decide what it is that you want to buy, and it just makes a big difference.”
—ESLS program participant
Seniors also worried about food waste when preparing meals or eating one fruit or vegetable for several days. Fresh fruits and vegetables as well as canned and frozen can be packaged in sizes too large for one person.
“They sell everything in such large quantity. I wish they could go to smaller bags.” —ESLS program participant
“Well, I think, too, when you go the store, when you buy for one person, it’s hard to buy a whole count of carrots or a whole pound of this or that or a bunch of the green onions, because they don’t keep that well.”
—ESLS program participant
“And the way you buy food, the way you freeze food, and the way you prepare food is totally different than a household that has two or three people in it.”
—ESLS program participant
▲ Opportunities for improvement
Although the ESLS lessons and other take-home materials include information on how to plan and shop for meals with fruits and vegetables on a limited budget, focus group input clearly highlights more that
SNAP Education and Evaluation Wave II Case Study Report Michigan State University Extension’s Eat Smart, Live Strong Program 31
could be done to address participant concerns about the cost of purchasing fruits and vegetables. Seniors indicated that they assumed that the promotion of fruits and vegetables meant fresh fruits and vegetables, which are more costly than canned or frozen.
Consistent with the current (2010) Dietary Guidelines for Americans, program materials and direct educators could encourage the use of all forms of fruits and vegetables, including fresh, frozen, canned, and dried (USDA Center for Nutrition Policy and Promotion, 2011). To help seniors stretch their shopping dollar, the ESLS lessons and take-home materials could include several images and recipes that include canned, frozen, or dried fruits or vegetables rather than fresh. Additionally, other foods used in programming should reflect the limited budget participants deal with on a daily basis and skill level of participants.
But clearly, ESLS participants appreciated being introduced to a variety of fruits and vegetables, and the techniques needed to prepare them.
“Well, some of the mangoes and things like that and the fruits—I never knew how to peel them, how to eat them, things like that, even like the star fruit. And you don’t know about them things. You get into the store, and maybe you see them, but you wonder, ‘What is that thing?’”
—ESLS program participant
“But I am sure there are other recipes using different vegetables. I see different fruits and vegetables in the grocery store all of the time that I have never used, and I shy away from them, because I do not know what to do with them. And I am sure different people have different ideas, and it always makes it interesting to try something different.”
—ESLS program participant
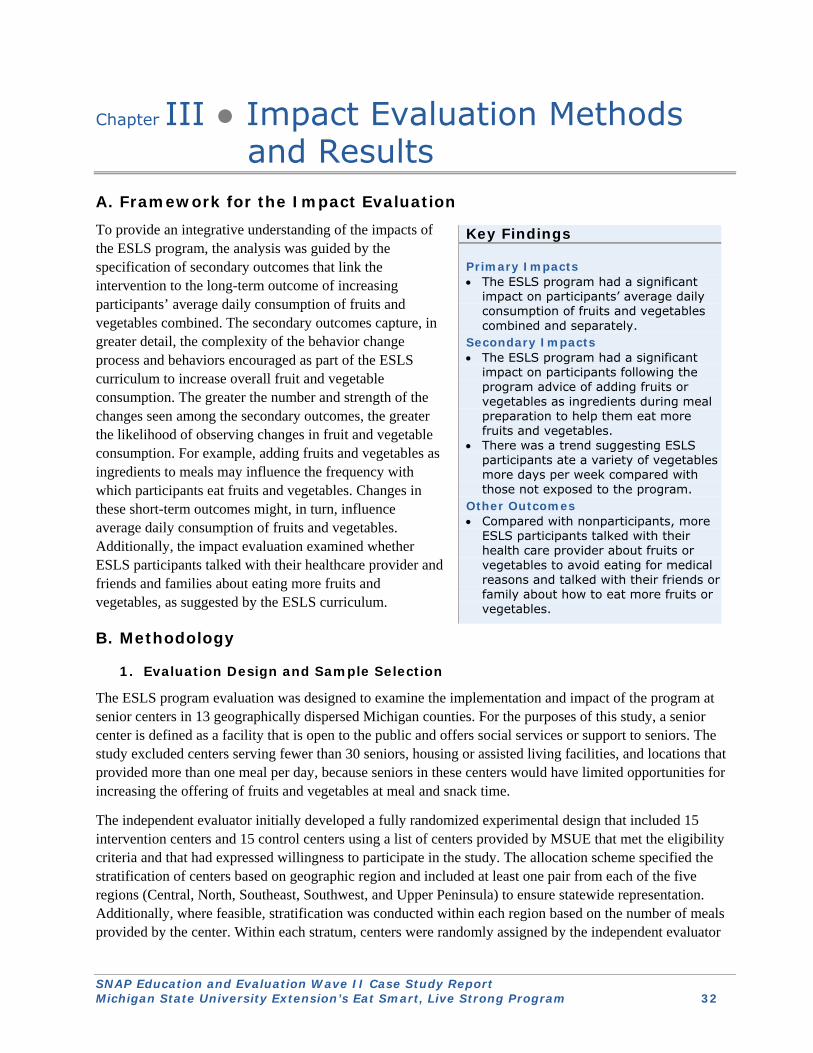
SNAP Education and Evaluation Wave II Case Study Report Michigan State University Extension’s Eat Smart, Live Strong Program 32
Chapter III ● Impact Evaluation Methods and Results
A. Framework for the Impact Evaluation To provide an integrative understanding of the impacts of the ESLS program, the analysis was guided by the specification of secondary outcomes that link the intervention to the long-term outcome of increasing participants’ average daily consumption of fruits and vegetables combined. The secondary outcomes capture, in greater detail, the complexity of the behavior change process and behaviors encouraged as part of the ESLS curriculum to increase overall fruit and vegetable consumption. The greater the number and strength of the changes seen among the secondary outcomes, the greater the likelihood of observing changes in fruit and vegetable consumption. For example, adding fruits and vegetables as ingredients to meals may influence the frequency with which participants eat fruits and vegetables. Changes in these short-term outcomes might, in turn, influence average daily consumption of fruits and vegetables. Additionally, the impact evaluation examined whether ESLS participants talked with their healthcare provider and friends and families about eating more fruits and vegetables, as suggested by the ESLS curriculum.
B. Methodology
1. Evaluation Design and Sample Selection
The ESLS program evaluation was designed to examine the implementation and impact of the program at senior centers in 13 geographically dispersed Michigan counties. For the purposes of this study, a senior center is defined as a facility that is open to the public and offers social services or support to seniors. The study excluded centers serving fewer than 30 seniors, housing or assisted living facilities, and locations that provided more than one meal per day, because seniors in these centers would have limited opportunities for increasing the offering of fruits and vegetables at meal and snack time.
The independent evaluator initially developed a fully randomized experimental design that included 15 intervention centers and 15 control centers using a list of centers provided by MSUE that met the eligibility criteria and that had expressed willingness to participate in the study. The allocation scheme specified the stratification of centers based on geographic region and included at least one pair from each of the five regions (Central, North, Southeast, Southwest, and Upper Peninsula) to ensure statewide representation. Additionally, where feasible, stratification was conducted within each region based on the number of meals provided by the center. Within each stratum, centers were randomly assigned by the independent evaluator
Key Findings
Primary Impacts The ESLS program had a significant
impact on participants’ average daily consumption of fruits and vegetables combined and separately.
Secondary Impacts The ESLS program had a significant
impact on participants following the program advice of adding fruits or vegetables as ingredients during meal preparation to help them eat more fruits and vegetables.
There was a trend suggesting ESLS participants ate a variety of vegetables more days per week compared with those not exposed to the program.
Other Outcomes Compared with nonparticipants, more
ESLS participants talked with their health care provider about fruits or vegetables to avoid eating for medical reasons and talked with their friends or family about how to eat more fruits or vegetables.

SNAP Education and Evaluation Wave II Case Study Report Michigan State University Extension’s Eat Smart, Live Strong Program 33
to the intervention or control group; thus, centers were not allowed to self-select into a particular group. As described in Chapter II, MSUE used the same procedures to recruit centers and participants in both the intervention and comparison groups; with the exception that centers in the comparison group were told that participants would complete two surveys, one at the start of the study (Week 1), and a second survey 5 weeks later (Week 6), and then receive the nutrition education program after Week 6.
Subsequent to the initial design, two rounds of revisions were made because centers originally included were unable to participate in the study. The design was revised with the goal of maintaining balance across region, size, and number of meals served and preserving the random assignment of centers to the intervention or control group. The revised design included 15 intervention centers serving an average of 74.3 seniors and providing an average of 3.13 meals per week, while the 15 control centers served an average of 64.5 seniors and provided an average of 2.73 meals per week.17
Because of challenges faced by MSUE in scheduling the specified number of classes at each center and recruiting participants, it was decided that MSUE could abandon the experimental design and add additional classes at larger centers and additional centers within counties already included in the study to meet sample size goals. The centers added by MSUE after the start of the evaluation study were purposively assigned by MSUE to the intervention or comparison group. Thus, the final design was a quasi-experimental research design that included 17 intervention centers and 16 comparison centers.
To recruit participants at the intervention and comparison centers, MSUE educators followed the recruitment instructions provided in the ESLS Leader’s Guide, customized the ESLS flyer with local information, and used it to announce the upcoming lessons. This flyer was used to reach potential participants and distributed to locations where seniors live and regularly visit.
The ESLS curriculum is designed for people aged 60–74. As described in Chapter II, MSUE encountered difficulties in recruiting participants within this age group based on the age composition of the centers included in the evaluation study and to avoid age discrimination. In discussions with FNS staff who were involved in program development, it was agreed that changing the eligible age range to 60–80 could be supported but that widening age eligibility further (younger or older) could affect the validity of the program evaluation.
For the initial design, sample size was estimated following commonly accepted evaluation practices (80 percent statistical power and a type I error rate of 0.05 with a two-tailed test). Sample size estimation was based on observing a change in reported average daily consumption of fruits and vegetables combined of 0.30 standard deviation units or better, as specified by FNS. Estimates are based on a statistical model that assesses change across time between the intervention and comparison groups. This analysis indicated that in order to observe a net difference of 0.30 cups with 15 intervention centers and 15 comparison centers, completed baseline and follow-up information would be needed from 510 participants. Appendix H provides additional information on the evaluation design and sample size calculations.
2. Primary and Secondary Outcome Measures
Exhibit III-1 lists the primary and secondary outcome measures for the impact evaluation of the ESLS program. The independent evaluators estimated the impact of the program on the primary outcome measure of the participant’s average daily consumption of fruits and vegetables combined. It was hypothesized that
17 The larger number of seniors served in the intervention group was due to the presence of one uncharacteristically
large center that served 350 seniors; excluding this center, the average number of seniors served in the intervention group was 54.6.
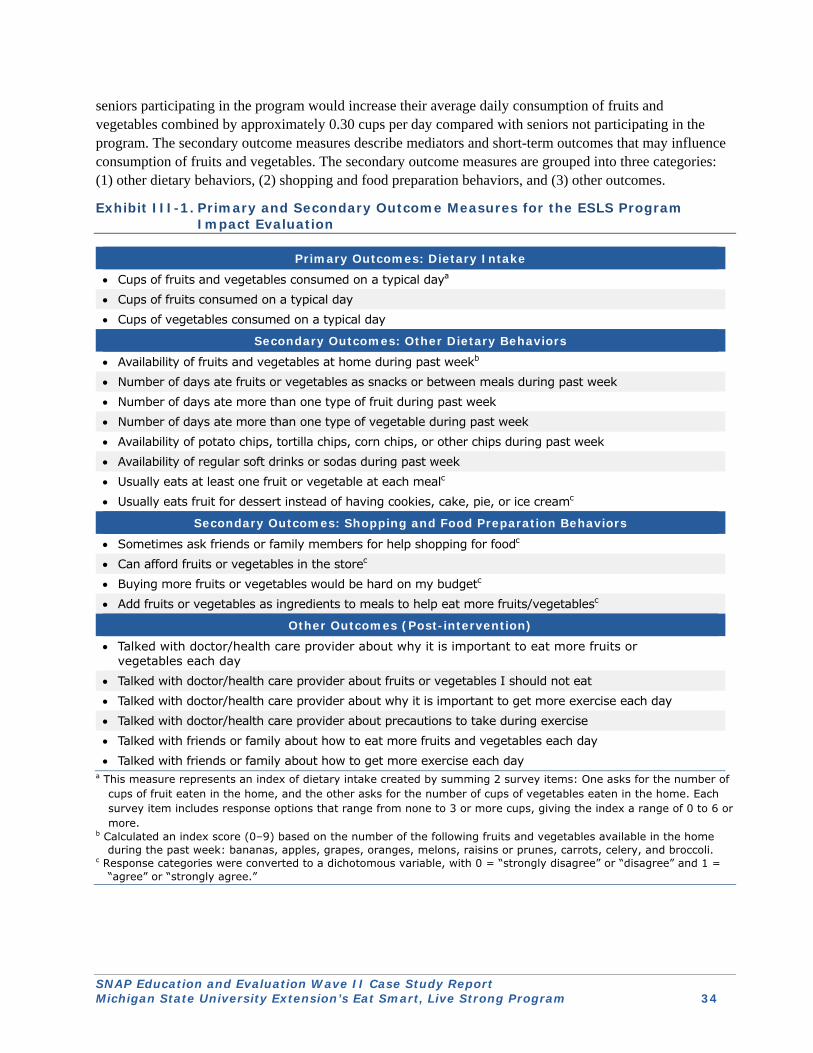
SNAP Education and Evaluation Wave II Case Study Report Michigan State University Extension’s Eat Smart, Live Strong Program 34
seniors participating in the program would increase their average daily consumption of fruits and vegetables combined by approximately 0.30 cups per day compared with seniors not participating in the program. The secondary outcome measures describe mediators and short-term outcomes that may influence consumption of fruits and vegetables. The secondary outcome measures are grouped into three categories: (1) other dietary behaviors, (2) shopping and food preparation behaviors, and (3) other outcomes.
Exhibit III-1. Primary and Secondary Outcome Measures for the ESLS Program Impact Evaluation
Primary Outcomes: Dietary Intake
Cups of fruits and vegetables consumed on a typical daya Cups of fruits consumed on a typical day Cups of vegetables consumed on a typical day
Secondary Outcomes: Other Dietary Behaviors
Availability of fruits and vegetables at home during past weekb Number of days ate fruits or vegetables as snacks or between meals during past week Number of days ate more than one type of fruit during past week Number of days ate more than one type of vegetable during past week Availability of potato chips, tortilla chips, corn chips, or other chips during past week Availability of regular soft drinks or sodas during past week Usually eats at least one fruit or vegetable at each mealc Usually eats fruit for dessert instead of having cookies, cake, pie, or ice creamc
Secondary Outcomes: Shopping and Food Preparation Behaviors
Sometimes ask friends or family members for help shopping for foodc Can afford fruits or vegetables in the storec Buying more fruits or vegetables would be hard on my budgetc Add fruits or vegetables as ingredients to meals to help eat more fruits/vegetablesc
Other Outcomes (Post-intervention)
Talked with doctor/health care provider about why it is important to eat more fruits or vegetables each day
Talked with doctor/health care provider about fruits or vegetables I should not eat Talked with doctor/health care provider about why it is important to get more exercise each day Talked with doctor/health care provider about precautions to take during exercise Talked with friends or family about how to eat more fruits and vegetables each day Talked with friends or family about how to get more exercise each day
a This measure represents an index of dietary intake created by summing 2 survey items: One asks for the number of cups of fruit eaten in the home, and the other asks for the number of cups of vegetables eaten in the home. Each survey item includes response options that range from none to 3 or more cups, giving the index a range of 0 to 6 or more.
b Calculated an index score (0–9) based on the number of the following fruits and vegetables available in the home during the past week: bananas, apples, grapes, oranges, melons, raisins or prunes, carrots, celery, and broccoli.
c Response categories were converted to a dichotomous variable, with 0 = “strongly disagree” or “disagree” and 1 = “agree” or “strongly agree.”
SNAP Education and Evaluation Wave II Case Study Report Michigan State University Extension’s Eat Smart, Live Strong Program 35
3. Instrument Development and Testing
To develop the impact evaluation instruments for the baseline and follow-up surveys, the independent evaluators reviewed MSUE’s application and ESLS curriculum and talked with MSUE project staff to identify the primary and secondary outcome measures for the intervention. Existing instruments as compiled for the literature review conducted for the Models of SNAP Education and Evaluation, Wave I study (FNS, 2012) were reviewed to identify those that address these outcomes and are feasible, appropriate for the target audience, reliable, valid, and sensitive to change.
In developing the impact instruments, the appropriateness of the instruments for collecting data on fruit and vegetable outcomes was assessed. Exhibit III-2 provides information on the study population, mode(s) of data collection, reliability, validity, and sensitivity to change for the instruments used to develop the questionnaire items on outcome measures. The majority of the items were taken or adapted from instruments that have been administered successfully with low-income audiences, validated, and demonstrated to be reliable and sensitive to change in previous studies.
For the primary outcome measures, dietary intake, questions from previously validated instruments, the Food Stamp Program Fruit and Vegetable Checklist (Townsend, Kaiser, Allen, Joy, & Murphy, 2003), and University of California Cooperative Extension Food Behavior Checklist (Townsend, Silva, Martin, Metz, & Wooten-Swanson, 2008) were used to ask the respondent to report on his or her consumption of fruits and vegetables.
The instruments for the baseline survey for the intervention and comparison groups were the same. For the follow-up survey, the instruments for the two groups were the same with the exception that the instrument for the intervention group collected information needed for the process evaluation (e.g., reasons for program participation and program satisfaction).
To test and refine the instruments, cognitive interviews were conducted with nine older adults. The readability of the instruments was assessed by using the Fry test, which examines the proportion of syllables and sentence length and is a commonly used measure of reading level (Fry et al., 1968). The questions were between third- and sixth-grade reading levels. Appendix C provides a copy of the final survey instruments, and Appendix D provides a copy of the supplemental survey materials.
4. Survey Administration Procedures and Response
The survey administration procedures for the baseline and follow-up surveys were the same for the intervention and comparison groups. For the baseline data collection, the survey was administered in person at the same time that the respondent completed the baseline survey for the MSUE evaluation study. After providing informed consent, participants completed the FNS questionnaire. Following a short break, participants completed a form developed by MSUE that collected demographic information18 and the MSUE assessments. Respondents received $10 cash for completing the baseline survey. The baseline survey for the intervention and comparison groups was conducted in March through May 2012. The start date for the study (and thus the baseline data collection) varied throughout this period with the first center starting the study March 2, 2012, and the last center starting May 24, 2012. The start dates for the remaining centers (intervention and comparison) were staggered throughout this 3-month period.
18 To minimize respondent burden, MSUE provided the independent contractor with copies of the completed
demographic forms. These data were keyed into a database and used by the independent evaluators in their analysis.
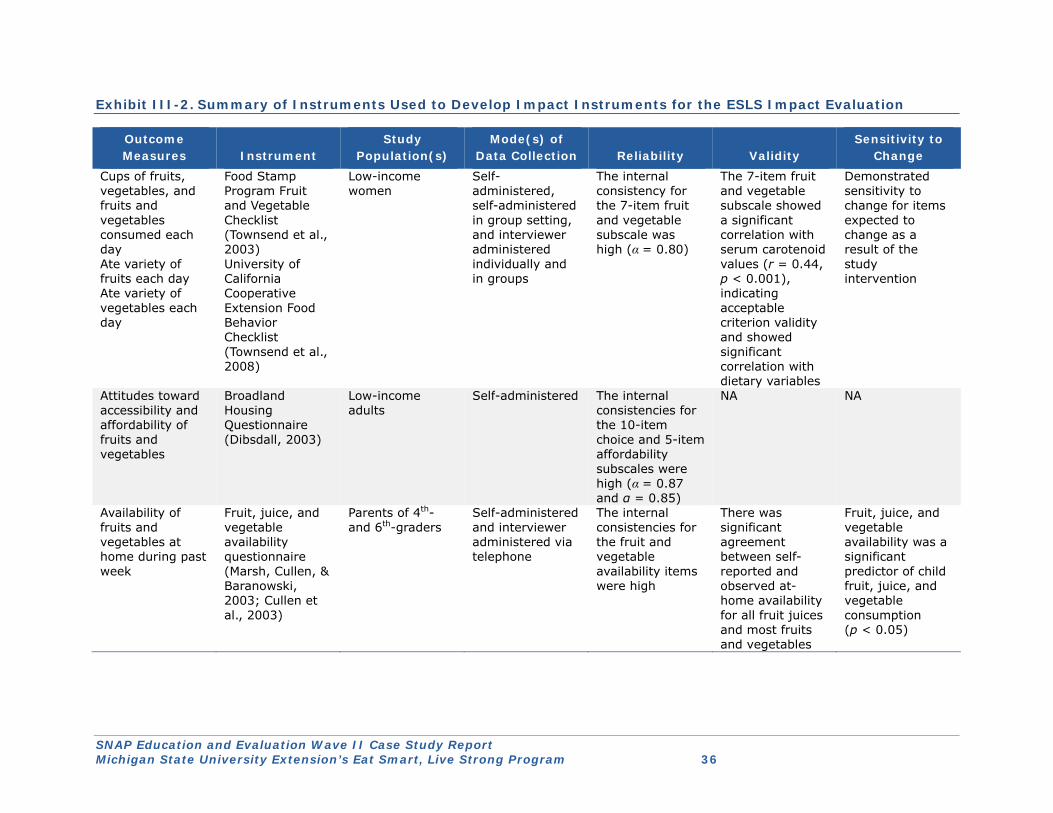
SNAP Education and Evaluation Wave II Case Study Report Michigan State University Extension’s Eat Smart, Live Strong Program 36
Exhibit III-2. Summary of Instruments Used to Develop Impact Instruments for the ESLS Impact Evaluation
Outcome Measures Instrument
Study Population(s)
Mode(s) of Data Collection Reliability Validity
Sensitivity to Change
Cups of fruits, vegetables, and fruits and vegetables consumed each day Ate variety of fruits each day Ate variety of vegetables each day
Food Stamp Program Fruit and Vegetable Checklist (Townsend et al., 2003) University of California Cooperative Extension Food Behavior Checklist (Townsend et al., 2008)
Low-income women
Self-administered, self-administered in group setting, and interviewer administered individually and in groups
The internal consistency for the 7-item fruit and vegetable subscale was high (α = 0.80)
The 7-item fruit and vegetable subscale showed a significant correlation with serum carotenoid values (r = 0.44, p < 0.001), indicating acceptable criterion validity and showed significant correlation with dietary variables
Demonstrated sensitivity to change for items expected to change as a result of the study intervention
Attitudes toward accessibility and affordability of fruits and vegetables
Broadland Housing Questionnaire (Dibsdall, 2003)
Low-income adults
Self-administered The internal consistencies for the 10-item choice and 5-item affordability subscales were high (α = 0.87 and α = 0.85)
NA NA
Availability of fruits and vegetables at home during past week
Fruit, juice, and vegetable availability questionnaire (Marsh, Cullen, & Baranowski, 2003; Cullen et al., 2003)
Parents of 4th- and 6th-graders
Self-administered and interviewer administered via telephone
The internal consistencies for the fruit and vegetable availability items were high
There was significant agreement between self-reported and observed at-home availability for all fruit juices and most fruits and vegetables
Fruit, juice, and vegetable availability was a significant predictor of child fruit, juice, and vegetable consumption (p < 0.05)
SNAP Education and Evaluation Wave II Case Study Report Michigan State University Extension’s Eat Smart, Live Strong Program 37
For the follow-up survey, the independent evaluators mailed the survey and telephone follow-ups were made to nonrespondents (thus the follow-up data were not collected concurrent with the MSUE evaluation). Respondents received $15 cash for completing the follow-up survey. The follow-up survey for the intervention and comparison groups was conducted in April through July 2012. Appendix H provides information on interviewer training and the survey procedures.
For the baseline survey, there were 267 participants in the intervention group and 347 participants in the comparison group (participants aged 60–80). At follow-up, there were 263 participants in the intervention group and 340 participants in the comparison group (participants aged 60–80), thus meeting the sample size requirements of 255 participants per group at follow-up. The response rate for the follow-up survey was 98 percent.
5. Impact Analysis Procedures
Preliminary assessment of the data indicated that 10 percent of the study participants (intervention and comparison groups) did not meet the age eligibility criterion (age 60–80) for the evaluation study. Exploratory analysis was conducted to examine whether including age-ineligible participants would introduce systematic bias into the estimates produced by the impact analysis. The exploratory analysis revealed that participants younger than 60 years old and older than 80 years old reported lower intake at follow-up than did age-eligible participants. This difference was similar across the study conditions, suggesting that the finding was not a result of the intervention. The number of age-ineligible cases was small, making it difficult to assess whether the difference between age-eligible and age-ineligible participants was statistically significant. The small number of age-ineligible cases also meant that their removal would not adversely affect the statistical power of the impact analyses. Thus the decision was made to exclude these cases from the impact analysis.
The impact evaluation included repeated measures on individual respondents who are nested within centers and centers that are nested in a study condition (intervention or comparison). When data are nested, responses within the same cluster tend to be correlated. If the correlated nature of the data is ignored in the specification of the model, then it is likely to lead to inflated type I error rates. A series of hierarchical, or mixed-effects, regression models were developed to account for correlated responses by allowing for the inclusion of multiple sources of random variation.
General linear mixed models were used for continuous impact variables and generalized linear mixed (GLM) models were used for dichotomous impact variables to evaluate program impacts while accounting for the clustering of participants within centers. These models were estimated via difference-in-difference estimates of program effect, comparing change across time (baseline and follow-up) in the intervention group with change across time in the comparison group. Covariates in the model included participant’s age, sex, household size, health status, employment status, and race and ethnicity. Missing data for covariates ranged from 4.2 percent to 9.8 percent of responses. Only 11 participants did not complete the follow-up survey, resulting in insufficient nonrespondents to assess their similarity to study participants who provided follow-up data; thus an attrition analysis was not conducted. Appendix H provides additional detail on the sampling models and link functions that describe the statistical models used to assess program outcomes and the structural models that detail the explanatory variables and the model coefficients.

SNAP Education and Evaluation Wave II Case Study Report Michigan State University Extension’s Eat Smart, Live Strong Program 38
C. Impact Analysis Results This section describes the baseline demographic characteristics of those who participated in the evaluation study and the baseline outcome measures and presents the impact results. A p-value of 0.05 was used for determining statistical significance. The results presented are for age-eligible participants (ages 60–80). Results for all individuals who participated in the evaluation study are provided in Appendix E.
1. Baseline Data
The baseline analysis included 614 respondents, 267 for the intervention group and 347 for the comparison group. Table III-1 shows the baseline demographic characteristics for the evaluation study participants overall and by study condition. Appendix E, Tables E-1 and E-2 provide baseline information on participants’ shopping and food preparation habits and participation in classes and workshops. At baseline, there were statistically significant differences between the intervention and comparison groups with regard to gender and education.
● Gender: The comparison group had more male participants than the intervention group (32.2 percent versus 16.3 percent, p < 0.01).
● Education: The intervention group had more participants who had some college or a 2-year degree than the comparison group (32.6 percent versus 24.8 percent, p < 0.05).
Differences were not observed for other demographic characteristics, other shopping and food preparation habits, and attendance at classes or workshops on nutrition or physical activity during the past year.
Appendix E, Table E-3 shows the baseline outcome measures overall and by study condition.19 There were no statistically significant differences for any of the primary or secondary outcome measures between the study conditions.
Figures III-1 and III-2 show the baseline distribution of reported consumption of fruits and vegetables, respectively, for those participating in the ESLS evaluation by condition. As a point of reference, the USDA Food Guidance System recommends that adults aged 51 and older eat about 2–2.5 cups of vegetables each day and 1.5–2 cups of fruit each day, depending on their gender (USDA, 2011a; USDA, 2011b). These results suggest that on average the study participants did not meet these recommendations at baseline.
With regard to the secondary outcome measures, this study found the following at baseline for all study participants (intervention and comparison groups; see Appendix E, Table E-3):
● The at-home availability of nine fruits and vegetables was 5.7 (index score: 0–9). ● Participants ate fruits or vegetables for snacks about 4 days during the past week. ● Participants ate more than one type of fruit each day about 4 days during the past week and more
than one type of vegetable each day about 3.5 days during the past week. ● Fifty-four percent of participants agreed or strongly agreed that they usually ate fruit for dessert
instead of cookies, cake, pie, or ice cream. ● Twenty-nine percent of participants agreed or strongly agreed that they sometimes asked friends
or family members for help shopping for food.
19 Appendix E, Tables E-4 and E-5 provide the unadjusted baseline means and post-test means for the 263
intervention group participants and 340 comparison group participants who completed the baseline and follow-up surveys.
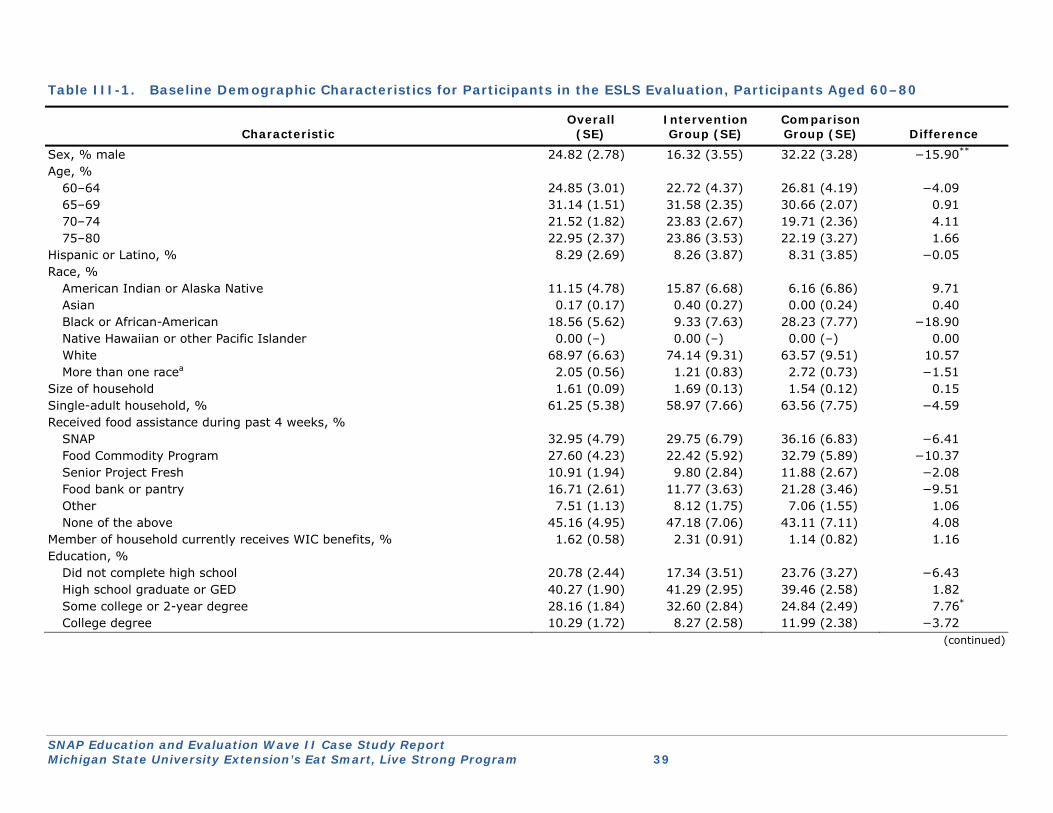
SNAP Education and Evaluation Wave II Case Study Report Michigan State University Extension’s Eat Smart, Live Strong Program 39
Table III-1. Baseline Demographic Characteristics for Participants in the ESLS Evaluation, Participants Aged 60–80
Characteristic Overall
(SE) Intervention Group (SE)
Comparison Group (SE) Difference
Sex, % male 24.82 (2.78) 16.32 (3.55) 32.22 (3.28) −15.90** Age, %
60–64 24.85 (3.01) 22.72 (4.37) 26.81 (4.19) −4.09 65–69 31.14 (1.51) 31.58 (2.35) 30.66 (2.07) 0.91 70–74 21.52 (1.82) 23.83 (2.67) 19.71 (2.36) 4.11 75–80 22.95 (2.37) 23.86 (3.53) 22.19 (3.27) 1.66
Hispanic or Latino, % 8.29 (2.69) 8.26 (3.87) 8.31 (3.85) −0.05 Race, %
American Indian or Alaska Native 11.15 (4.78) 15.87 (6.68) 6.16 (6.86) 9.71 Asian 0.17 (0.17) 0.40 (0.27) 0.00 (0.24) 0.40 Black or African-American 18.56 (5.62) 9.33 (7.63) 28.23 (7.77) −18.90 Native Hawaiian or other Pacific Islander 0.00 (–) 0.00 (–) 0.00 (–) 0.00 White 68.97 (6.63) 74.14 (9.31) 63.57 (9.51) 10.57 More than one racea 2.05 (0.56) 1.21 (0.83) 2.72 (0.73) −1.51
Size of household 1.61 (0.09) 1.69 (0.13) 1.54 (0.12) 0.15 Single-adult household, % 61.25 (5.38) 58.97 (7.66) 63.56 (7.75) −4.59 Received food assistance during past 4 weeks, %
SNAP 32.95 (4.79) 29.75 (6.79) 36.16 (6.83) −6.41 Food Commodity Program 27.60 (4.23) 22.42 (5.92) 32.79 (5.89) −10.37 Senior Project Fresh 10.91 (1.94) 9.80 (2.84) 11.88 (2.67) −2.08 Food bank or pantry 16.71 (2.61) 11.77 (3.63) 21.28 (3.46) −9.51 Other 7.51 (1.13) 8.12 (1.75) 7.06 (1.55) 1.06 None of the above 45.16 (4.95) 47.18 (7.06) 43.11 (7.11) 4.08
Member of household currently receives WIC benefits, % 1.62 (0.58) 2.31 (0.91) 1.14 (0.82) 1.16 Education, %
Did not complete high school 20.78 (2.44) 17.34 (3.51) 23.76 (3.27) −6.43 High school graduate or GED 40.27 (1.90) 41.29 (2.95) 39.46 (2.58) 1.82 Some college or 2-year degree 28.16 (1.84) 32.60 (2.84) 24.84 (2.49) 7.76* College degree 10.29 (1.72) 8.27 (2.58) 11.99 (2.38) −3.72
(continued)
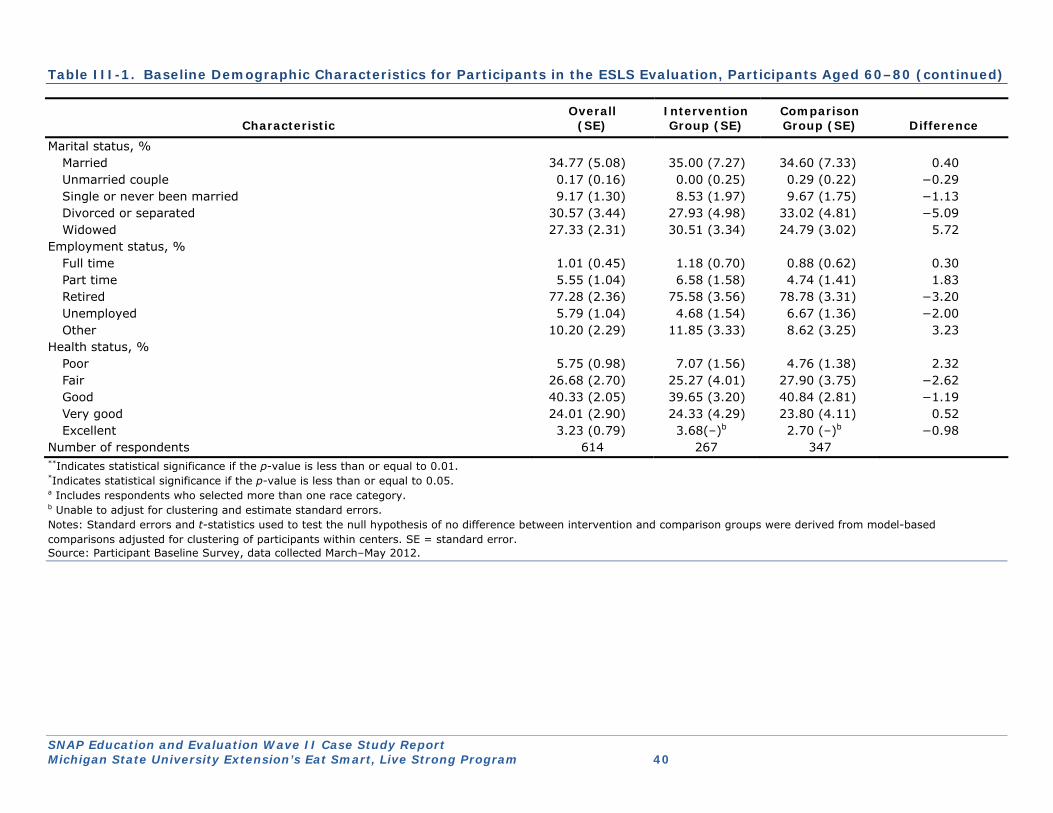
SNAP Education and Evaluation Wave II Case Study Report Michigan State University Extension’s Eat Smart, Live Strong Program 40
Table III-1. Baseline Demographic Characteristics for Participants in the ESLS Evaluation, Participants Aged 60–80 (continued)
Characteristic Overall
(SE) Intervention Group (SE)
Comparison Group (SE) Difference
Marital status, % Married 34.77 (5.08) 35.00 (7.27) 34.60 (7.33) 0.40 Unmarried couple 0.17 (0.16) 0.00 (0.25) 0.29 (0.22) −0.29 Single or never been married 9.17 (1.30) 8.53 (1.97) 9.67 (1.75) −1.13 Divorced or separated 30.57 (3.44) 27.93 (4.98) 33.02 (4.81) −5.09 Widowed 27.33 (2.31) 30.51 (3.34) 24.79 (3.02) 5.72
Employment status, % Full time 1.01 (0.45) 1.18 (0.70) 0.88 (0.62) 0.30 Part time 5.55 (1.04) 6.58 (1.58) 4.74 (1.41) 1.83 Retired 77.28 (2.36) 75.58 (3.56) 78.78 (3.31) −3.20 Unemployed 5.79 (1.04) 4.68 (1.54) 6.67 (1.36) −2.00 Other 10.20 (2.29) 11.85 (3.33) 8.62 (3.25) 3.23
Health status, % Poor 5.75 (0.98) 7.07 (1.56) 4.76 (1.38) 2.32 Fair 26.68 (2.70) 25.27 (4.01) 27.90 (3.75) −2.62 Good 40.33 (2.05) 39.65 (3.20) 40.84 (2.81) −1.19 Very good 24.01 (2.90) 24.33 (4.29) 23.80 (4.11) 0.52 Excellent 3.23 (0.79) 3.68(–)b 2.70 (–)b −0.98
Number of respondents 614 267 347 **Indicates statistical significance if the p-value is less than or equal to 0.01. *Indicates statistical significance if the p-value is less than or equal to 0.05. a Includes respondents who selected more than one race category. b Unable to adjust for clustering and estimate standard errors. Notes: Standard errors and t-statistics used to test the null hypothesis of no difference between intervention and comparison groups were derived from model-based comparisons adjusted for clustering of participants within centers. SE = standard error. Source: Participant Baseline Survey, data collected March–May 2012.
SNAP Education and Evaluation Wave II Case Study Report Michigan State University Extension’s Eat Smart, Live Strong Program 41
● Eighty percent of participants agreed or strongly agreed that they could afford fruits or vegetables in the store where they shopped for most of their food, and 59 percent agreed or strongly agreed that buying more fruits or vegetables than they already did would be hard on their budget.
Figure III-1. Baseline Distribution of Cups of Fruit Consumed by Participants in the ESLS Evaluation Study, by Condition
Source: Participant Baseline Survey, data collected March–May 2012.
Figure III-2. Baseline Distribution of Cups of Vegetables Consumed by Participants in the ESLS Evaluation Study, by Condition
Source: Participant Baseline Survey, data collected March–May 2012.
SNAP Education and Evaluation Wave II Case Study Report Michigan State University Extension’s Eat Smart, Live Strong Program 42
2. Primary Impact Results
Table III-2 shows the model-adjusted means at baseline and follow-up for the intervention and comparison groups and the estimated impact on the primary outcomes of number of combined cups of fruits and vegetables, cups of fruits, and cups of vegetables consumed. For both the intervention and comparison groups, participants reported increases in consumption of cups of fruits and vegetables, cups of fruits, and cups of vegetables between baseline and follow-up. The difference in the changes between the intervention and comparison groups was statistically significant:
● Cups of fruits and vegetables: The ESLS program increased participants’ average daily consumption of fruits and vegetables by 0.52 cups (p < 0.01).
● Cups of fruits: The ESLS program increased participants’ average daily consumption of fruits by 0.20 cups (p < 0.05).
● Cups of vegetables: The ESLS program increased participants’ average daily consumption of vegetables by 0.31 cups (p < 0.01).
3. Secondary Impact Results
Tables III-3 and III-4 show the model-adjusted means at baseline and follow-up for the intervention and comparison groups and the estimated impact on participants’ other dietary behaviors and shopping and food preparation practices, respectively. Although there were small increases in most of the dietary behaviors for the intervention and comparison groups, the difference in the changes between the two groups was not statistically significant. This suggests that the ESLS program did not have an impact on participants’ other dietary behaviors. There was a positive improvement in the number of days in the past week participants ate more than one type of vegetable that approached statistical significance: (0.4 days, p = 0.0504). For shopping and food preparation practices, improvements were noted for the intervention group between baseline and follow-up, with a statistically significant increase for the proportion of participants who agreed or strongly agreed that they added fruits or vegetables as ingredients during meal preparation to help them eat more fruits and vegetables (odds ratio = 1.9 percent, p < 0.05).
4. Other Outcomes Results
Table III-5 shows the model-adjusted means at follow-up for the intervention and comparison groups and the estimated difference for outcomes relating to whether participants spoke with their health care provider and/or friends and family about fruits and vegetables and exercise, which was encouraged as part of the ESLS program. At the end of the intervention, ESLS participants were more likely to discuss with their health care provider the fruits and vegetables they should not eat for medical reasons compared with participants in the comparison group (16.5 percent versus 7.1 percent, p < 0.05). Additionally, ESLS participants were more likely to talk with friends and family about how to eat more fruits and vegetables each day (54.8 percent versus 25.6 percent, p < 0.01).
5. Results for All Participants
Results for all individuals who participated in the evaluation study are provided in Appendix E. Tables E-6 through E-9 provide the results for the baseline analysis, and Tables E-10 through E-13 provide the results for the impact analysis. These results are very similar to the results for age-eligible participants.

SNAP Education and Evaluation Wave II Case Study Report Michigan State University Extension’s Eat Smart, Live Strong Program 43
Table III-2. Dietary Intake: Primary Impacts for the Evaluation of the ESLS Program, Participants Aged 60–80
Measure
Model-Adjusted Baseline Means (SE)
Model-Adjusted Follow-Up Means (SE)
Estimated Impacta (95% CI)
Wald Chi-Square p-Value
Intervention Group
Comparison Group
Intervention Group
Comparison Group
Cups of fruits and vegetables 2.46 (0.11) 2.59 (0.10) 3.05 (0.11) 2.65 (0.10) 0.52** (0.23, 0.82) 0.0010 Cups of fruits 1.26 (0.06) 1.29 (0.06) 1.47 (0.07) 1.31 (0.06) 0.20* (0.01, 0.38) 0.0365 Cups of vegetables 1.20 (0.06) 1.30 (0.05) 1.55 (0.06) 1.34 (0.05) 0.31** (0.16, 0.47) 0.0003 Number of respondents 267 347 263 340
**Indicates statistical significance if the p-value is less than or equal to 0.01. *Indicates statistical significance if the p-value is less than or equal to 0.05. a Program impact (with 95% confidence limits) estimated via difference-in-difference models comparing change across time in the intervention versus
comparison groups. Notes: General linear mixed models (SAS PROC MIXED) were used to evaluate the program impact while accounting for the clustering of participants within
centers. Covariates in the model included age, sex, household size, health status, employment status, education, and race and ethnicity. Missing data ranged from 4.2% to 9.8%. SE = standard error. CI = confidence interval.
Source: Participant Survey, March–May 2012 (Baseline) and April–July 2012 (Follow-Up).

SNAP Education and Evaluation Wave II Case Study Report Michigan State University Extension’s Eat Smart, Live Strong Program 44
Table III-3. Other Dietary Behaviors: Secondary Impacts for the Evaluation of the ESLS Program, Participants Aged 60–80
Measure
Model-Adjusted Baseline Means (SE)
Model-Adjusted Follow-Up
Means (SE)
Estimated Impacta (95% CI)
Wald Chi-
Square p-Value
Intervention Group
Comparison Group
Intervention Group
Comparison Group
Availability of fruits and vegetablesb 5.63 (0.16) 5.74 (0.15) 5.70 (0.16) 5.56 (0.15) 0.24 (−0.22, 0.70) 0.3001 Ate fruits or vegetables for snacksc 4.32 (0.19) 3.95 (0.17) 4.34 (0.19) 4.11 (0.18) −0.14 (−0.75, 0.47) 0.6495 Ate variety of fruitsc 3.88 (0.16) 3.84 (0.15) 4.13 (0.17) 3.99 (0.15) 0.10 (−0.34, 0.55) 0.6406 Ate variety of vegetablesc 3.46 (0.17) 3.42 (0.15) 4.01 (0.17) 3.57 (0.15) 0.40 (0.00, 0.80) 0.0504 Availability of potato chips, tortilla chips,
corn chips, or other chipsd 70.93 (3.47) 76.30 (2.85) 73.28 (3.38) 74.99 (2.93) 1.21 (0.75, 1.95) 0.4301
Availability of regular soft drinks or sodasd 61.44 (3.64) 65.14 (3.16) 53.66 (3.81) 63.53 (3.21) 0.78 (0.50, 1.23) 0.2700 Usually eat at least one fruit or vegetable
at each meale 76.63 (3.52) 80.19 (2.92) 81.98 (3.04) 83.30 (2.65) 1.13 (0.68, 1.87) 0.6369
Usually eat fruit for dessert instead of cookies, cake, pie, or ice creame
54.53 (3.95) 55.27 (3.52) 69.11 (3.52) 62.94 (3.37) 1.36 (0.88, 2.09) 0.1601
Number of respondents 267 347 263 340 a Program impact (with 95% confidence limits) estimated via difference-in-difference models comparing change across time in the intervention versus
comparison groups. Impacts provided as odds ratios for dichotomous outcomes. b Index score (0–9) based on reported household availability of nine fruits and vegetables. c Reported as the number of days in the past week. d Dichotomous variable indicates the proportion responding “Yes.” e Dichotomous variable indicates the proportion responding “Agree” or “Strongly agree” vs. “Disagree” or “Strongly disagree.” Notes: General linear mixed models (SAS PROC MIXED) for continuous impact variables and GLM models (SAS PROC GLIMMIX) for dichotomous impact
variables were used to evaluate the program impact while accounting for the clustering of participants within centers. Covariates in the model included age, sex, household size, health status, employment status, education, and race and ethnicity. Missing data ranged from 4.2% to 9.8%. SE = standard error. CI = confidence interval.
Source: Participant Survey, March–May 2012 (Baseline) and April–July 2012 (Follow-Up).
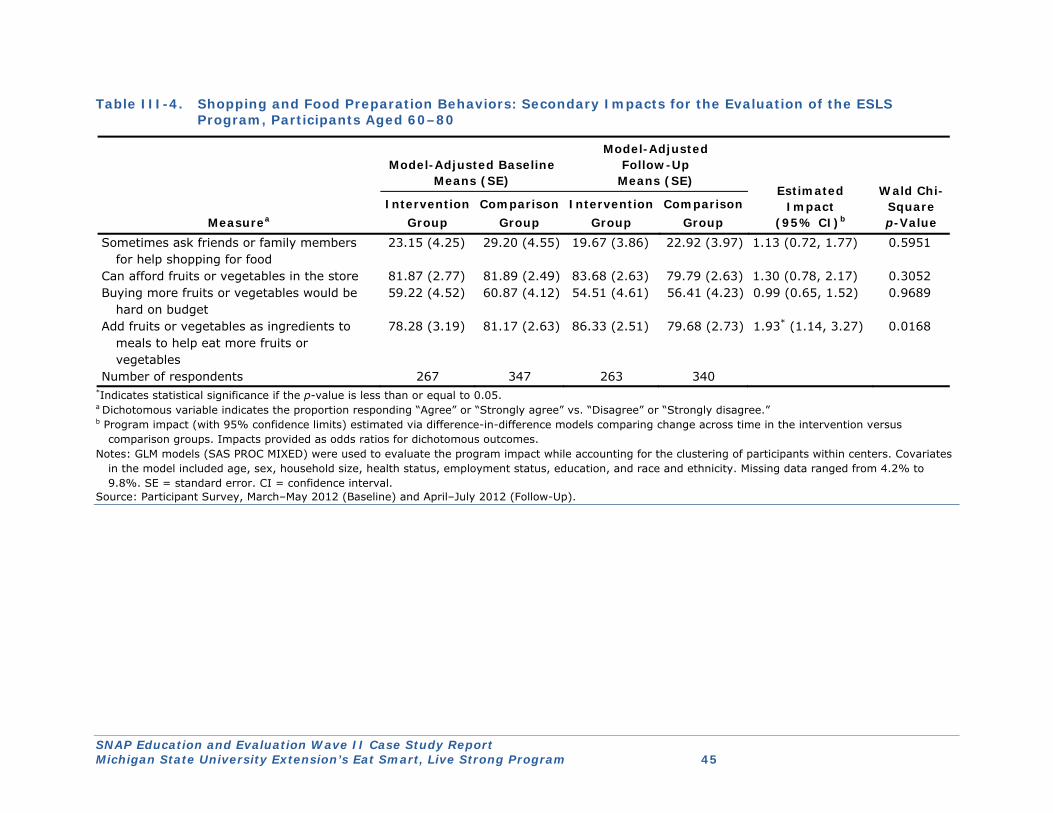
SNAP Education and Evaluation Wave II Case Study Report Michigan State University Extension’s Eat Smart, Live Strong Program 45
Table III-4. Shopping and Food Preparation Behaviors: Secondary Impacts for the Evaluation of the ESLS Program, Participants Aged 60–80
Measurea
Model-Adjusted Baseline Means (SE)
Model-Adjusted Follow-Up
Means (SE) Estimated
Impact (95% CI)b
Wald Chi-Square p-Value
Intervention Group
Comparison Group
Intervention Group
Comparison Group
Sometimes ask friends or family members for help shopping for food
23.15 (4.25) 29.20 (4.55) 19.67 (3.86) 22.92 (3.97) 1.13 (0.72, 1.77) 0.5951
Can afford fruits or vegetables in the store 81.87 (2.77) 81.89 (2.49) 83.68 (2.63) 79.79 (2.63) 1.30 (0.78, 2.17) 0.3052 Buying more fruits or vegetables would be
hard on budget 59.22 (4.52) 60.87 (4.12) 54.51 (4.61) 56.41 (4.23) 0.99 (0.65, 1.52) 0.9689
Add fruits or vegetables as ingredients to meals to help eat more fruits or vegetables
78.28 (3.19) 81.17 (2.63) 86.33 (2.51) 79.68 (2.73) 1.93* (1.14, 3.27) 0.0168
Number of respondents 267 347 263 340 *Indicates statistical significance if the p-value is less than or equal to 0.05. a Dichotomous variable indicates the proportion responding “Agree” or “Strongly agree” vs. “Disagree” or “Strongly disagree.” b Program impact (with 95% confidence limits) estimated via difference-in-difference models comparing change across time in the intervention versus
comparison groups. Impacts provided as odds ratios for dichotomous outcomes. Notes: GLM models (SAS PROC MIXED) were used to evaluate the program impact while accounting for the clustering of participants within centers. Covariates
in the model included age, sex, household size, health status, employment status, education, and race and ethnicity. Missing data ranged from 4.2% to 9.8%. SE = standard error. CI = confidence interval.
Source: Participant Survey, March–May 2012 (Baseline) and April–July 2012 (Follow-Up).

SNAP Education and Evaluation Wave II Case Study Report Michigan State University Extension’s Eat Smart, Live Strong Program 46
Table III-5. Other Outcomes for the Evaluation of the ESLS Program, Participants Aged 60–80
Measure Overall
(SE) Intervention Group (SE)
Comparison Group (SE) Difference
t-statistic
p-value
Talked with health care provider about…, %a Why it is important to eat more fruits or vegetables
each day 19.85 (3.00) 21.85 (4.91) 18.49 (3.95) 3.36 0.53 0.5976
Fruits or vegetables I should not eat 10.38 (1.99) 16.48 (2.90) 7.09 (2.06) 9.40* 2.64 0.0127 Why it is important to get more exercise each day 34.28 (3.61) 31.54 (5.79) 36.04 (4.63) −4.50 −0.61 0.5484 Precautions to take during exercise 22.45 (3.10) 23.42 (5.04) 21.86 (4.04) 1.56 0.24 0.8110
Talked with friends or family about…, % How to eat more fruits or vegetables each day 39.31 (3.32) 54.79 (2.83) 25.60 (2.49) 29.18** 7.75 0.0000 How to get more exercise each day 40.08 (2.84) 44.33 (4.17) 36.45 (3.86) 7.87 1.39 0.1754
Number of respondents 603 263 340 *Indicates statistical significance if the p-value is less than or equal to 0.05. **Indicates statistical significance if the p-value is less than or equal to 0.01. a For participants who saw their health care providers during the past 4 weeks. Source: Participant Follow-Up Survey, data collected April–July 2012. These questions were not asked in the baseline survey.

SNAP Education and Evaluation Wave II Case Study Report Michigan State University Extension’s Eat Smart, Live Strong Program 47
Chapter IV ● Assessment of MSUE’s Self-Evaluation
A. Methodology Determining the effectiveness of the evaluation conducted by MSUE required a clear understanding of the planning, design, and implementation of the evaluation based on both objective and subjective measures. To the extent possible, the assessment was based on objective information such as the evaluation report prepared by MSUE. Qualitative methods were used to gather in-depth information as well as perspectives of key players in the evaluation (e.g., the principal investigator, the program manager). Exhibit IV-1 describes the data sources used for the assessment, and Appendix F provides copies of the forms and instruments used in the assessment.
The assessment of MSUE’s evaluation of the ESLS program included a detailed description of their evaluation methodology, including management, staffing, and costs of the evaluation; an assessment of the quality of MSUE’s evaluation, including strengths and weaknesses; a comparison of MSUE’s study design and results with the FNS independent evaluation; and an assessment of lessons learned based on the quality assessment, cost analysis, and reported factors affecting evaluation implementation. Appendix I provides additional information on the methodology for assessing MSUE’s self-evaluation.
Exhibit IV-1. Description and Use of Data Sources for the Assessment of MSUE’s Self-Evaluation
Data Source Description and Use
MSUE’s application The application to request funding as a demonstration project provided information on the proposed evaluation procedures. The independent evaluators abstracted information from MSUE’s application to describe their evaluation approach and identify any differences between their planned and actual evaluation approach.
Evaluation review form This form included eight evaluation components (e.g., viable comparison strategy) that were rated on a 1–5 scale. The form was completed using information from MSUE’s application and evaluation report and additional information obtained in the key-informant interviews conducted following the evaluation. The completed review form was used to prepare a descriptive assessment of the quality of MSUE’S evaluation that identified the strengths and weaknesses of the evaluation and detailed areas for improvement.
Evaluation cost form This form, completed by MSUE, documented the resources used and costs incurred to evaluate the ESLS program. The completed form and the findings from the key informant interviews were used to
Key Findings Strengths of MSUE’s evaluation
included the use of a viable comparison strategy, the use of 24-hour food recalls for collecting fruit and vegetable intake, well-planned and -executed data collection procedures, and modest attrition and minimal missing data for the impact evaluation.
The primary weakness of MSUE’s evaluation centered on difficulties enrolling the specified number of participants meeting the age eligibility criterion into the study.
The MSUE evaluation found a positive impact on vegetable consumption, and the independent evaluation found a positive impact on both fruit and vegetable consumption. These findings suggest that the ESLS program is effective at encouraging seniors to eat more fruits and vegetables each day.
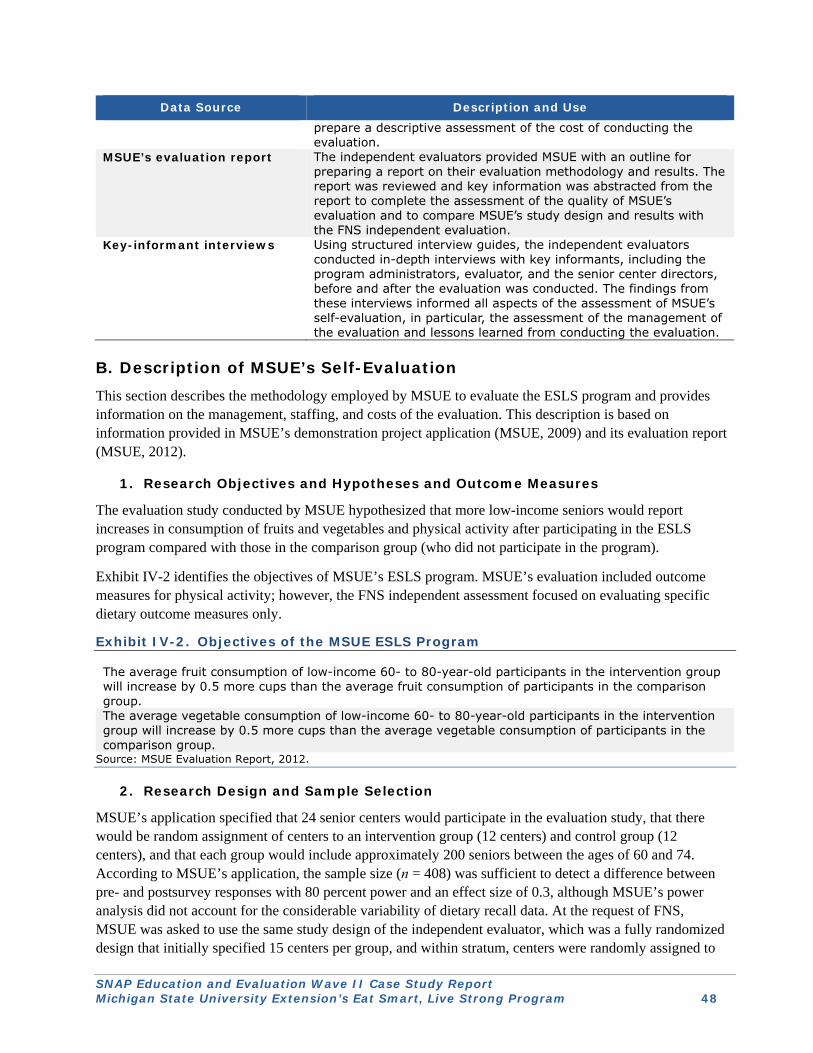
SNAP Education and Evaluation Wave II Case Study Report Michigan State University Extension’s Eat Smart, Live Strong Program 48
Data Source Description and Use prepare a descriptive assessment of the cost of conducting the evaluation.
MSUE’s evaluation report The independent evaluators provided MSUE with an outline for preparing a report on their evaluation methodology and results. The report was reviewed and key information was abstracted from the report to complete the assessment of the quality of MSUE’s evaluation and to compare MSUE’s study design and results with the FNS independent evaluation.
Key-informant interviews Using structured interview guides, the independent evaluators conducted in-depth interviews with key informants, including the program administrators, evaluator, and the senior center directors, before and after the evaluation was conducted. The findings from these interviews informed all aspects of the assessment of MSUE’s self-evaluation, in particular, the assessment of the management of the evaluation and lessons learned from conducting the evaluation.
B. Description of MSUE’s Self-Evaluation This section describes the methodology employed by MSUE to evaluate the ESLS program and provides information on the management, staffing, and costs of the evaluation. This description is based on information provided in MSUE’s demonstration project application (MSUE, 2009) and its evaluation report (MSUE, 2012).
1. Research Objectives and Hypotheses and Outcome Measures
The evaluation study conducted by MSUE hypothesized that more low-income seniors would report increases in consumption of fruits and vegetables and physical activity after participating in the ESLS program compared with those in the comparison group (who did not participate in the program).
Exhibit IV-2 identifies the objectives of MSUE’s ESLS program. MSUE’s evaluation included outcome measures for physical activity; however, the FNS independent assessment focused on evaluating specific dietary outcome measures only.
Exhibit IV-2. Objectives of the MSUE ESLS Program
The average fruit consumption of low-income 60- to 80-year-old participants in the intervention group will increase by 0.5 more cups than the average fruit consumption of participants in the comparison group. The average vegetable consumption of low-income 60- to 80-year-old participants in the intervention group will increase by 0.5 more cups than the average vegetable consumption of participants in the comparison group.
Source: MSUE Evaluation Report, 2012.
2. Research Design and Sample Selection
MSUE’s application specified that 24 senior centers would participate in the evaluation study, that there would be random assignment of centers to an intervention group (12 centers) and control group (12 centers), and that each group would include approximately 200 seniors between the ages of 60 and 74. According to MSUE’s application, the sample size (n = 408) was sufficient to detect a difference between pre- and postsurvey responses with 80 percent power and an effect size of 0.3, although MSUE’s power analysis did not account for the considerable variability of dietary recall data. At the request of FNS, MSUE was asked to use the same study design of the independent evaluator, which was a fully randomized design that initially specified 15 centers per group, and within stratum, centers were randomly assigned to
SNAP Education and Evaluation Wave II Case Study Report Michigan State University Extension’s Eat Smart, Live Strong Program 49
the intervention or the control group. Chapter III provides information on the original study design specified by the independent evaluator.
Because of challenges faced by MSUE in scheduling the specified number of classes at each center and recruiting participants, it was decided that MSUE could abandon the experimental design and add additional classes at larger centers and add additional centers within counties already included in the study that met the inclusion criteria for the study. The original design used random assignment of centers to the intervention or comparison group (15 centers per group); however, after the start of data collection MSUE added four centers which were purposively assigned by MSUE to the intervention or comparison group. Thus, the final design was a quasi-experimental research design with17 intervention centers and 16 comparison centers that were also included in the independent evaluation and one additional intervention center in which the independent evaluator did not collect data.20
3. Instrument Development and Testing
MSUE assessed fruit and vegetable consumption at baseline and follow-up using the Expanded Food and Nutrition Program (EFNEP) 24-Hour Food Recall. The EFNEP 24-Hour Food Recall applies the USDA 5-Step Multiple Pass Method: the quick list, the forgotten foods list, time and occasion, the detail cycle, and final probes. Several research studies have validated this method among U.S. adults using telephone administration (Conway, Ingwersen, & Moshfegh, 2004; Conway, Ingwersen, Vinyard, & Moshfegh, 2003). MSUE administered the EFNEP food recall in a group setting with food models for estimating portion size. MSUE conducted a pilot study to evaluate the EFNEP instrument for readability and made minimal changes based on the findings from the pilot study. For example, to facilitate administration of the food recall, the input form was modified to increase the font size, and questions that were not applicable for seniors were removed (e.g., pregnancy).
MSUE developed a survey instrument that was administered at baseline and follow-up to collect information on other dietary behaviors and participant experience with the ESLS program (intervention group only). This instrument was tested in the pilot study conducted to evaluate the EFNEP instrument.
In its application, MSUE had proposed to use the Set Your Goals handout provided as part of the ESLS curriculum to measure intake of fruits and vegetables at baseline and follow-up. The purpose of the handout is to help participants monitor their progress in terms of their goals for fruit and vegetable consumption and physical activity. During the lessons, participants are invited to share their successes with the rest of the group. The ESLS curriculum does not suggest or require that these handouts be collected. In its final evaluation report, MSUE concludes that collecting these forms could affect the results of the evaluation and is a deviation from the curriculum; thus the decision was made to use food recalls to collect information on intake of fruit and vegetables.
4. Interviewer Training
MSUE developed several tools that were used to train instructors and to ensure standardized administration of the food recall. MSUE transcribed the audio portion of a training video used by the Oklahoma Cooperative Extension Service (Oklahoma State University, 2010). The transcribed script was reviewed and revised by MSUE’s Health and Nutrition Institute Evaluation Committee, which includes SNAP-Ed extension educators and supervisory educators, most of them registered dieticians. Additionally, MSUE prepared a training video on administering the five-step multiple-pass method, which included tips to improve recall accuracy. All of the 20 The independent evaluator did not collect data in this center because it was added after the cutoff date for data
collection.
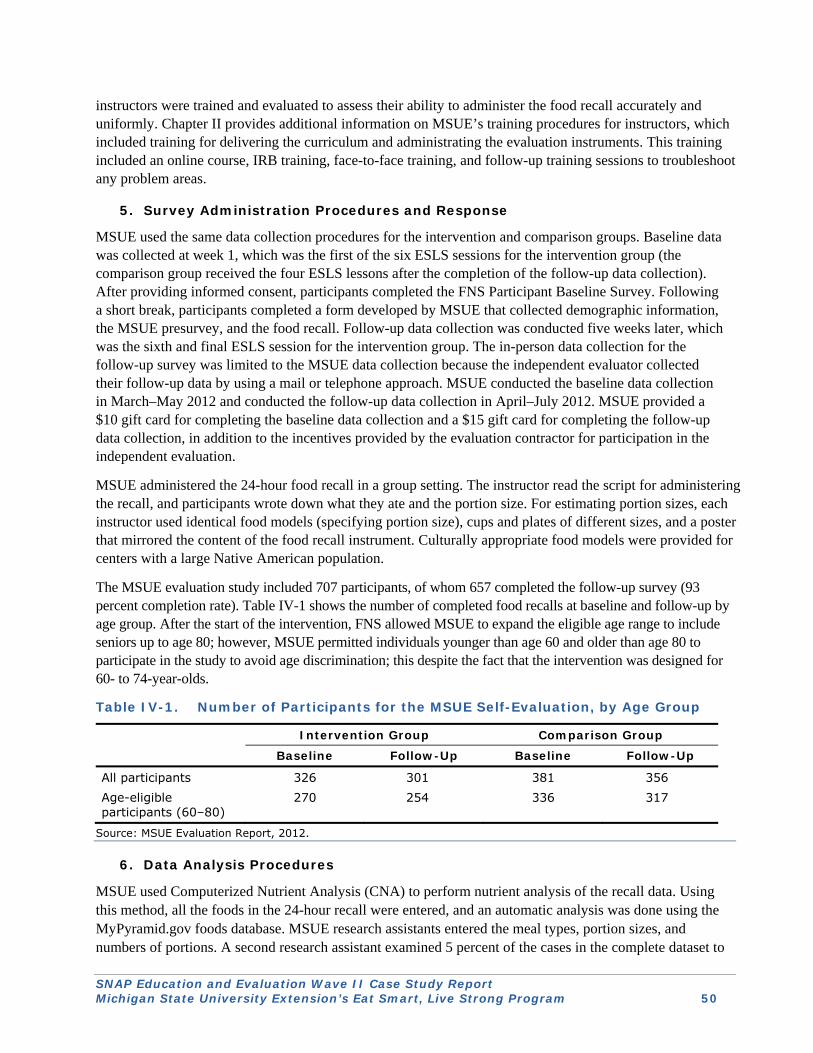
SNAP Education and Evaluation Wave II Case Study Report Michigan State University Extension’s Eat Smart, Live Strong Program 50
instructors were trained and evaluated to assess their ability to administer the food recall accurately and uniformly. Chapter II provides additional information on MSUE’s training procedures for instructors, which included training for delivering the curriculum and administrating the evaluation instruments. This training included an online course, IRB training, face-to-face training, and follow-up training sessions to troubleshoot any problem areas.
5. Survey Administration Procedures and Response
MSUE used the same data collection procedures for the intervention and comparison groups. Baseline data was collected at week 1, which was the first of the six ESLS sessions for the intervention group (the comparison group received the four ESLS lessons after the completion of the follow-up data collection). After providing informed consent, participants completed the FNS Participant Baseline Survey. Following a short break, participants completed a form developed by MSUE that collected demographic information, the MSUE presurvey, and the food recall. Follow-up data collection was conducted five weeks later, which was the sixth and final ESLS session for the intervention group. The in-person data collection for the follow-up survey was limited to the MSUE data collection because the independent evaluator collected their follow-up data by using a mail or telephone approach. MSUE conducted the baseline data collection in March–May 2012 and conducted the follow-up data collection in April–July 2012. MSUE provided a $10 gift card for completing the baseline data collection and a $15 gift card for completing the follow-up data collection, in addition to the incentives provided by the evaluation contractor for participation in the independent evaluation.
MSUE administered the 24-hour food recall in a group setting. The instructor read the script for administering the recall, and participants wrote down what they ate and the portion size. For estimating portion sizes, each instructor used identical food models (specifying portion size), cups and plates of different sizes, and a poster that mirrored the content of the food recall instrument. Culturally appropriate food models were provided for centers with a large Native American population.
The MSUE evaluation study included 707 participants, of whom 657 completed the follow-up survey (93 percent completion rate). Table IV-1 shows the number of completed food recalls at baseline and follow-up by age group. After the start of the intervention, FNS allowed MSUE to expand the eligible age range to include seniors up to age 80; however, MSUE permitted individuals younger than age 60 and older than age 80 to participate in the study to avoid age discrimination; this despite the fact that the intervention was designed for 60- to 74-year-olds.
Table IV-1. Number of Participants for the MSUE Self-Evaluation, by Age Group
Intervention Group Comparison Group
Baseline Follow-Up Baseline Follow-Up
All participants 326 301 381 356 Age-eligible participants (60–80)
270 254 336 317
Source: MSUE Evaluation Report, 2012.
6. Data Analysis Procedures
MSUE used Computerized Nutrient Analysis (CNA) to perform nutrient analysis of the recall data. Using this method, all the foods in the 24-hour recall were entered, and an automatic analysis was done using the MyPyramid.gov foods database. MSUE research assistants entered the meal types, portion sizes, and numbers of portions. A second research assistant examined 5 percent of the cases in the complete dataset to
SNAP Education and Evaluation Wave II Case Study Report Michigan State University Extension’s Eat Smart, Live Strong Program 51
verify the accuracy of the data entered. The CNA calculated the food group amounts, in this case the amount of cups of fruits and vegetables in increments of 0.5 cups.
MSUE began by examining descriptive statistics such as means, standard deviations, and percentages for the full study sample. Statistical tests to compare means (t-test) for continuous variables and proportions (chi-squared test) for categorical variables between the intervention and comparison groups were used at this step. These comparisons were made to determine baseline differences on demographic, as well as other sample characteristics. Next, for each outcome measure, MSUE conducted similar comparisons at baseline and follow-up to determine any association between the outcome and demographic variables, as well as determinants suspected to be associated with the study outcomes. Characteristics and variables found to be statistically associated with both the outcome and/or the study groups (intervention and comparison) were included in the multivariate analyses as potential confounders.
Statistical analyses (paired t-tests) were conducted for the intervention and comparison groups separately to compare differences between baseline and follow-up for the study outcomes. Additionally, statistical analyses (paired t-tests) were conducted for the intervention and comparison groups to compare differences between groups at baseline and follow-up for the main outcomes. These analyses were conducted using SPSS for Windows version 19 (IBM Corp, 2010).
To estimate the impact of the ESLS program, MSUE used GLM models to determine the relationship between the study groups and the study outcomes while controlling for the suspected confounding effects of demographic and other study variables. The covariates included varied by model specification. To determine whether the multivariate analysis required controls for the possible influence of clustering due to the study design (participants were nested with centers), the intraclass correlation coefficient (ICC) for each study outcome was calculated using a GLM null model. MSUE adjusted for clustering if the ICC was greater than 17 percent; this cutoff value was guided by the literature (Woltman, Feldstain, MacKay, & Rocchia, 2012). The GLM modeling was conducted using Stata version 11 (Stata Corp., College Station, TX). The level of significance was set to 0.05 for all statistical tests.
MSUE ran an additional set of analyses in response to a request from the independent evaluator. The request was made in reaction to an observed non sequitur in the reported outcome for fruit intake among respondents aged 60–80. The MSUE evaluator ran a series of simple (ordinary least squares) difference-in-difference regression models that included the same covariates used in the GLM analyses. The modeling was conducted using Stata version 11 (Stata Corp., College Station, TX).
7. Description of Management, Staffing, and Costs of the Evaluation
The ESLS evaluation team was comprised of the evaluation manager, graduate students, and the direct educators whose respective roles were described in Chapter II. The program manager provided review and assistance for the implementation of the evaluation at the programmatic level.
Table IV-2 shows the actual expenditures MSUE reported as the costs required to conduct their self-evaluation—a total of $89,717.12—with all direct costs attributed to staff salaries, noncapital equipment or supplies, and travel. Appendix B includes the detailed budget tables MSUE provided for this evaluation, including a breakout of non-Federal and Federal funding for each budget category.
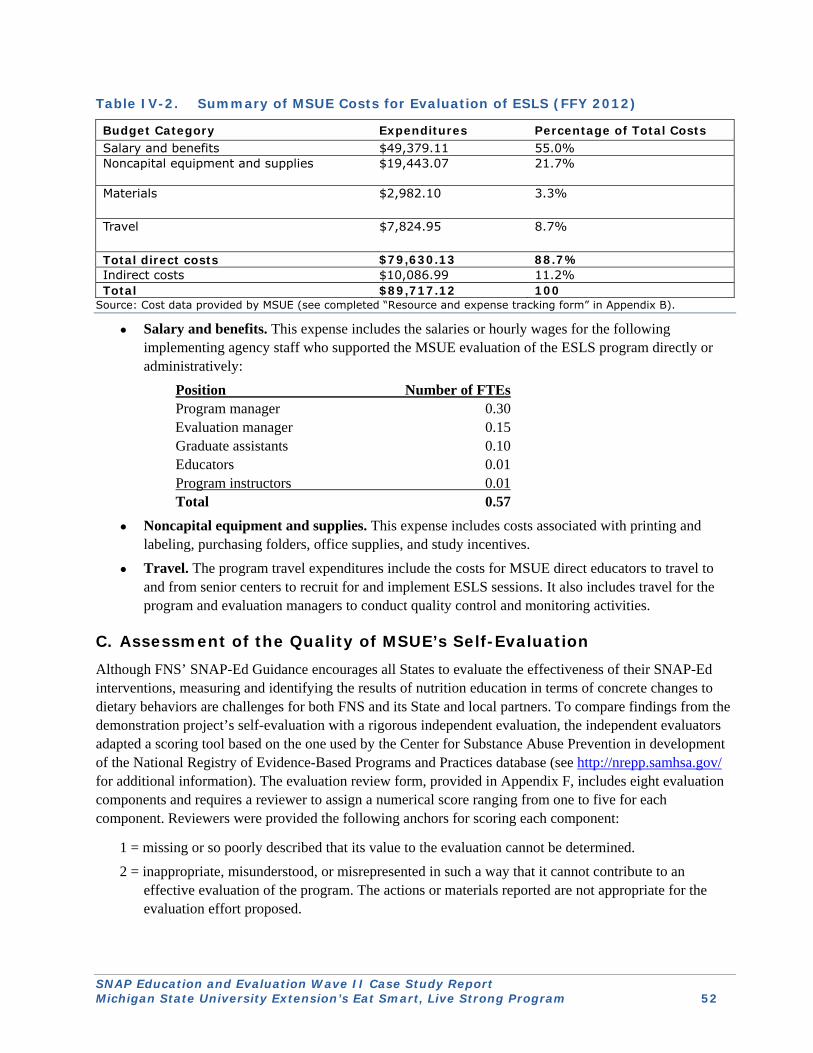
SNAP Education and Evaluation Wave II Case Study Report Michigan State University Extension’s Eat Smart, Live Strong Program 52
Table IV-2. Summary of MSUE Costs for Evaluation of ESLS (FFY 2012)
Budget Category Expenditures Percentage of Total Costs Salary and benefits $49,379.11 55.0% Noncapital equipment and supplies $19,443.07 21.7%
Materials $2,982.10 3.3%
Travel $7,824.95 8.7%
Total direct costs $79,630.13 88.7% Indirect costs $10,086.99 11.2% Total $89,717.12 100
Source: Cost data provided by MSUE (see completed “Resource and expense tracking form” in Appendix B).
● Salary and benefits. This expense includes the salaries or hourly wages for the following implementing agency staff who supported the MSUE evaluation of the ESLS program directly or administratively:
Position Number of FTEs Program manager 0.30 Evaluation manager 0.15 Graduate assistants 0.10 Educators 0.01 Program instructors 0.01 Total 0.57
● Noncapital equipment and supplies. This expense includes costs associated with printing and labeling, purchasing folders, office supplies, and study incentives.
● Travel. The program travel expenditures include the costs for MSUE direct educators to travel to and from senior centers to recruit for and implement ESLS sessions. It also includes travel for the program and evaluation managers to conduct quality control and monitoring activities.
C. Assessment of the Quality of MSUE’s Self-Evaluation Although FNS’ SNAP-Ed Guidance encourages all States to evaluate the effectiveness of their SNAP-Ed interventions, measuring and identifying the results of nutrition education in terms of concrete changes to dietary behaviors are challenges for both FNS and its State and local partners. To compare findings from the demonstration project’s self-evaluation with a rigorous independent evaluation, the independent evaluators adapted a scoring tool based on the one used by the Center for Substance Abuse Prevention in development of the National Registry of Evidence-Based Programs and Practices database (see http://nrepp.samhsa.gov/ for additional information). The evaluation review form, provided in Appendix F, includes eight evaluation components and requires a reviewer to assign a numerical score ranging from one to five for each component. Reviewers were provided the following anchors for scoring each component:
1 = missing or so poorly described that its value to the evaluation cannot be determined.
2 = inappropriate, misunderstood, or misrepresented in such a way that it cannot contribute to an effective evaluation of the program. The actions or materials reported are not appropriate for the evaluation effort proposed.
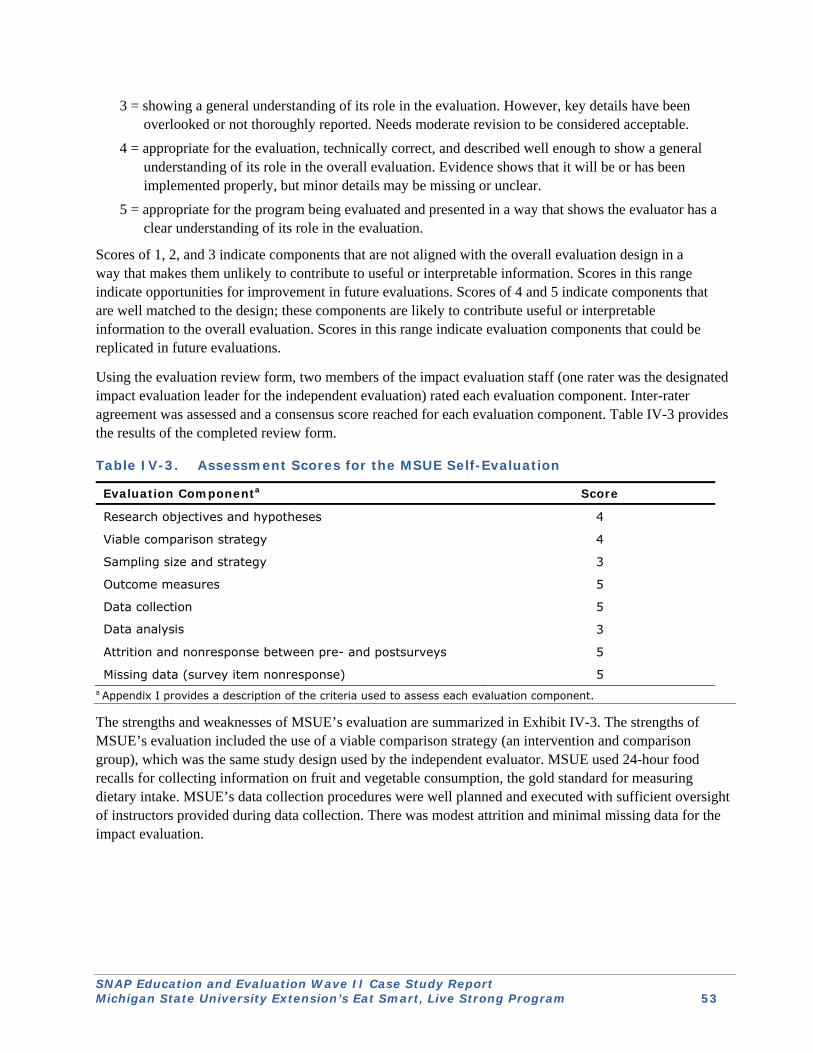
SNAP Education and Evaluation Wave II Case Study Report Michigan State University Extension’s Eat Smart, Live Strong Program 53
3 = showing a general understanding of its role in the evaluation. However, key details have been overlooked or not thoroughly reported. Needs moderate revision to be considered acceptable.
4 = appropriate for the evaluation, technically correct, and described well enough to show a general understanding of its role in the overall evaluation. Evidence shows that it will be or has been implemented properly, but minor details may be missing or unclear.
5 = appropriate for the program being evaluated and presented in a way that shows the evaluator has a clear understanding of its role in the evaluation.
Scores of 1, 2, and 3 indicate components that are not aligned with the overall evaluation design in a way that makes them unlikely to contribute to useful or interpretable information. Scores in this range indicate opportunities for improvement in future evaluations. Scores of 4 and 5 indicate components that are well matched to the design; these components are likely to contribute useful or interpretable information to the overall evaluation. Scores in this range indicate evaluation components that could be replicated in future evaluations.
Using the evaluation review form, two members of the impact evaluation staff (one rater was the designated impact evaluation leader for the independent evaluation) rated each evaluation component. Inter-rater agreement was assessed and a consensus score reached for each evaluation component. Table IV-3 provides the results of the completed review form.
Table IV-3. Assessment Scores for the MSUE Self-Evaluation
Evaluation Componenta Score
Research objectives and hypotheses 4
Viable comparison strategy 4
Sampling size and strategy 3
Outcome measures 5
Data collection 5
Data analysis 3
Attrition and nonresponse between pre- and postsurveys 5
Missing data (survey item nonresponse) 5 a Appendix I provides a description of the criteria used to assess each evaluation component.
The strengths and weaknesses of MSUE’s evaluation are summarized in Exhibit IV-3. The strengths of MSUE’s evaluation included the use of a viable comparison strategy (an intervention and comparison group), which was the same study design used by the independent evaluator. MSUE used 24-hour food recalls for collecting information on fruit and vegetable consumption, the gold standard for measuring dietary intake. MSUE’s data collection procedures were well planned and executed with sufficient oversight of instructors provided during data collection. There was modest attrition and minimal missing data for the impact evaluation.
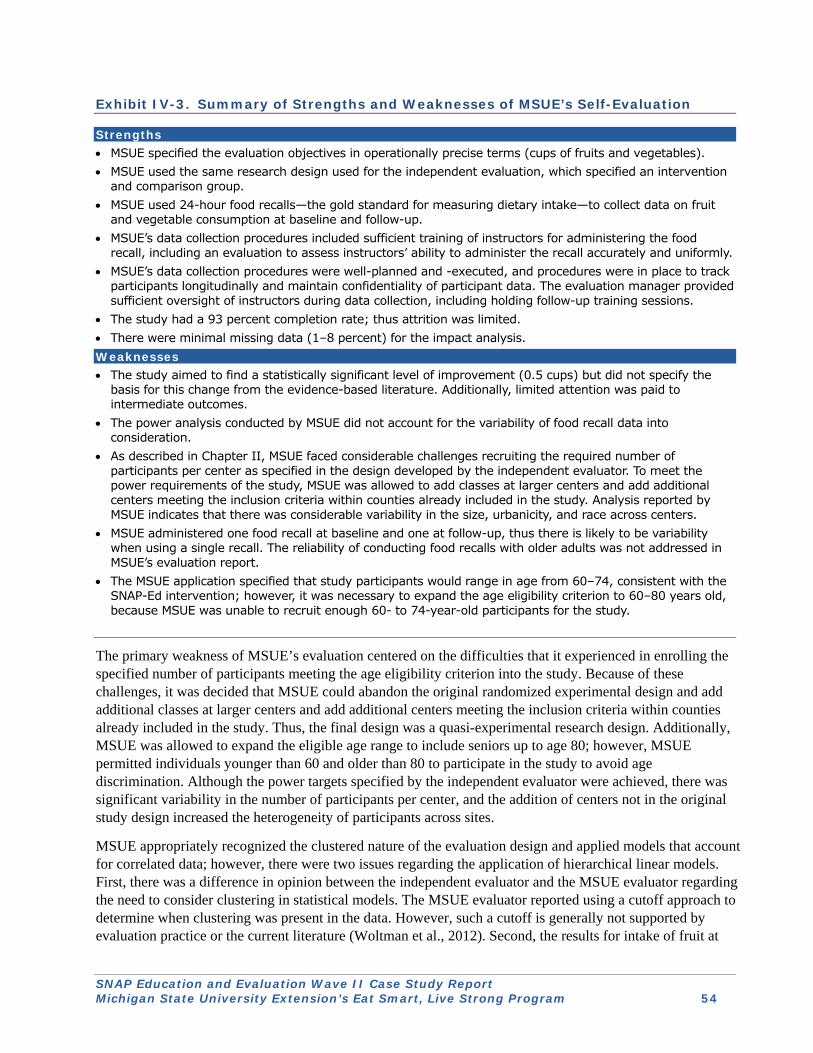
SNAP Education and Evaluation Wave II Case Study Report Michigan State University Extension’s Eat Smart, Live Strong Program 54
Exhibit IV-3. Summary of Strengths and Weaknesses of MSUE’s Self-Evaluation
Strengths MSUE specified the evaluation objectives in operationally precise terms (cups of fruits and vegetables). MSUE used the same research design used for the independent evaluation, which specified an intervention
and comparison group. MSUE used 24-hour food recalls—the gold standard for measuring dietary intake—to collect data on fruit
and vegetable consumption at baseline and follow-up. MSUE’s data collection procedures included sufficient training of instructors for administering the food
recall, including an evaluation to assess instructors’ ability to administer the recall accurately and uniformly. MSUE’s data collection procedures were well-planned and -executed, and procedures were in place to track
participants longitudinally and maintain confidentiality of participant data. The evaluation manager provided sufficient oversight of instructors during data collection, including holding follow-up training sessions.
The study had a 93 percent completion rate; thus attrition was limited. There were minimal missing data (1–8 percent) for the impact analysis. Weaknesses The study aimed to find a statistically significant level of improvement (0.5 cups) but did not specify the
basis for this change from the evidence-based literature. Additionally, limited attention was paid to intermediate outcomes.
The power analysis conducted by MSUE did not account for the variability of food recall data into consideration.
As described in Chapter II, MSUE faced considerable challenges recruiting the required number of participants per center as specified in the design developed by the independent evaluator. To meet the power requirements of the study, MSUE was allowed to add classes at larger centers and add additional centers meeting the inclusion criteria within counties already included in the study. Analysis reported by MSUE indicates that there was considerable variability in the size, urbanicity, and race across centers.
MSUE administered one food recall at baseline and one at follow-up, thus there is likely to be variability when using a single recall. The reliability of conducting food recalls with older adults was not addressed in MSUE’s evaluation report.
The MSUE application specified that study participants would range in age from 60–74, consistent with the SNAP-Ed intervention; however, it was necessary to expand the age eligibility criterion to 60–80 years old, because MSUE was unable to recruit enough 60- to 74-year-old participants for the study.
The primary weakness of MSUE’s evaluation centered on the difficulties that it experienced in enrolling the specified number of participants meeting the age eligibility criterion into the study. Because of these challenges, it was decided that MSUE could abandon the original randomized experimental design and add additional classes at larger centers and add additional centers meeting the inclusion criteria within counties already included in the study. Thus, the final design was a quasi-experimental research design. Additionally, MSUE was allowed to expand the eligible age range to include seniors up to age 80; however, MSUE permitted individuals younger than 60 and older than 80 to participate in the study to avoid age discrimination. Although the power targets specified by the independent evaluator were achieved, there was significant variability in the number of participants per center, and the addition of centers not in the original study design increased the heterogeneity of participants across sites.
MSUE appropriately recognized the clustered nature of the evaluation design and applied models that account for correlated data; however, there were two issues regarding the application of hierarchical linear models. First, there was a difference in opinion between the independent evaluator and the MSUE evaluator regarding the need to consider clustering in statistical models. The MSUE evaluator reported using a cutoff approach to determine when clustering was present in the data. However, such a cutoff is generally not supported by evaluation practice or the current literature (Woltman et al., 2012). Second, the results for intake of fruit at
SNAP Education and Evaluation Wave II Case Study Report Michigan State University Extension’s Eat Smart, Live Strong Program 55
follow up were difficult to interpret (negative impact, not significant). In response to questions from the independent evaluator, the MSUE evaluator conducted additional analyses, and subsequently reexamined their original analyses and provided an explanation for the unexpected results.
D. Comparison of Evaluation Methods and Results for the MSUE and Independent Evaluations
Exhibit IV-4 compares the study design for the MSUE self-evaluation and the independent impact evaluation of the ESLS program. The MSUE evaluation and the independent evaluation used the same research design and sampling strategy. As previously noted, baseline data collection was conducted concurrently for the two evaluations. MSUE’s follow-up data collection was conducted in person, whereas the independent evaluation used a mail survey and followed up with nonrespondents by telephone. The MSUE evaluation used food recalls to collect information on fruit and vegetable consumption, whereas the independent evaluation used participants’ self-reports of the amount of fruits and vegetables consumed on a typical day during the past week. Participants were provided with a visual aid that showed quantities of fruits and vegetables in half cup increments ranging from none to 3 cups or more. The two evaluation studies employed different analysis procedures for the impact evaluation.
MSUE conducted the impact analysis for all study participants and participants aged 60 to 80 years. Table IV-4 shows the results of the GLM models (adjusted and unadjusted) to test the difference from baseline to follow-up between intervention and comparison group. Although participants did not increase their fruit and vegetable intake by 0.5 cups each, there was a significant impact from baseline to follow-up. Among all study participants, the ESLS program increased participants’ average daily consumption of fruit by 0.31 cups (adjusted model, p < 0.05). For analyses limited to participants aged 60–80 years, there was no impact on fruit consumption. Among all study participants, the ESLS program increased participants’ average daily consumption of vegetables by 0.33 cups (adjusted model, p < 0.05). For analyses limited to participants aged 60 to 80, the ESLS program increased participants’ average daily consumption of vegetables by 0.35 cups (adjusted model, p < 0.05). In response to questions from the independent evaluator about the results for fruit (decrease of 0.08 cups, not significant), the MSUE evaluator estimated the impact models using simple (ordinary least squares) difference-in-difference regression models that included the same covariates used in the GLM analyses (see Table IV-5). Based on these models, the findings are similar with the exception of fruit consumption which shows a significant impact of 0.37 cups (adjusted model, p = 0.05) for all participants and 0.35 cups (adjusted model, p < 0.05) for age-eligible participants. Subsequent to conducting the additional analyses, at the request of the independent evaluator MSUE reexamined the GLM analyses and determined that the negative impact was likely due to relatively high fruit consumption at follow-up among the three participants enrolled at one comparison center.
Although physical activity was not an outcome of interest for the independent evaluation, the ESLS program placed an equal emphasis on physical activity and on nutrition. MSUE found that there was not a significant impact on the amount of moderate physical activity, for all participants and for participants aged 60–80.
Table IV-6 compares the results of the independent evaluation with the MSUE evaluation (based on the GLM analyses) for average daily consumption of fruits and vegetables for age-eligible participants. Based on the independent evaluation, the ESLS program increased participants’ average daily consumption of fruits by 0.20 cups (p < 0.05) and average daily consumption of vegetables by 0.31 cups (p < 0.01). The MSUE evaluation found an impact on average daily consumption of vegetables based on the GLM analyses and the simple difference-in-difference models, but the impact on average daily consumption of fruits is inconclusive given differing results for the two types of models. The findings from the two evaluation studies suggest that the ESLS program is effective at encouraging seniors to eat more fruits and vegetables each day.
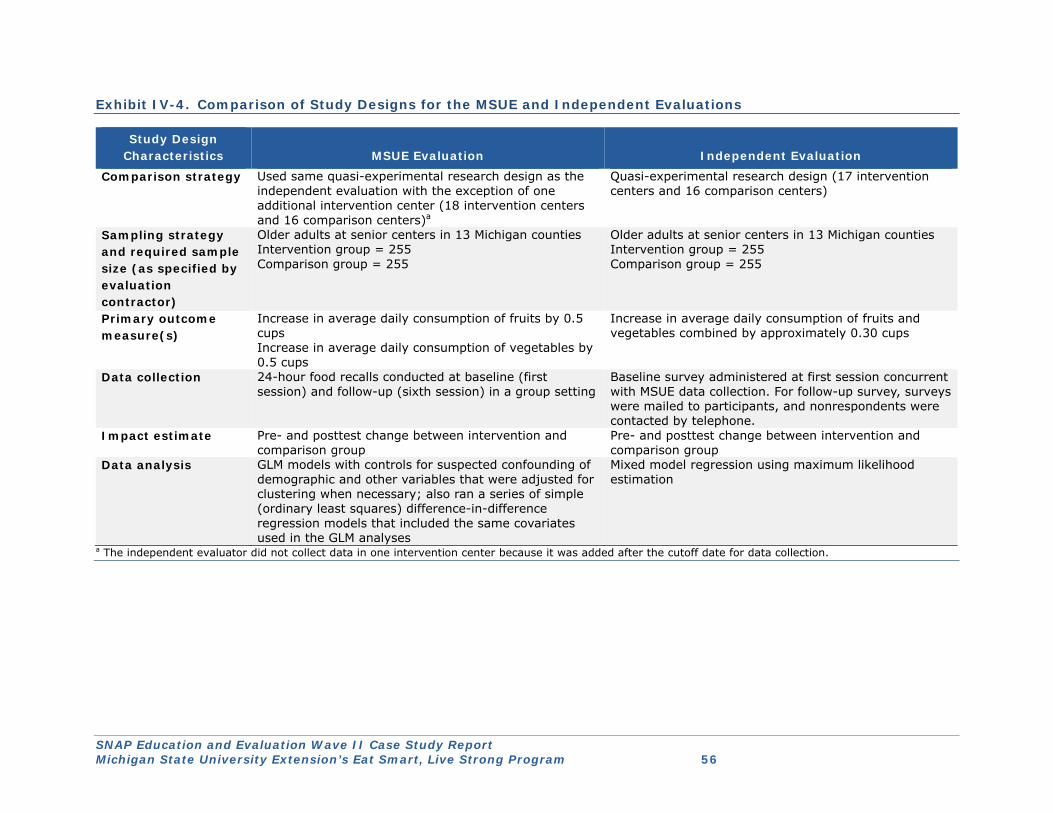
SNAP Education and Evaluation Wave II Case Study Report Michigan State University Extension’s Eat Smart, Live Strong Program 56
Exhibit IV-4. Comparison of Study Designs for the MSUE and Independent Evaluations
Study Design Characteristics MSUE Evaluation Independent Evaluation
Comparison strategy Used same quasi-experimental research design as the independent evaluation with the exception of one additional intervention center (18 intervention centers and 16 comparison centers)a
Quasi-experimental research design (17 intervention centers and 16 comparison centers)
Sampling strategy and required sample size (as specified by evaluation contractor)
Older adults at senior centers in 13 Michigan counties Intervention group = 255 Comparison group = 255
Older adults at senior centers in 13 Michigan counties Intervention group = 255 Comparison group = 255
Primary outcome measure(s)
Increase in average daily consumption of fruits by 0.5 cups Increase in average daily consumption of vegetables by 0.5 cups
Increase in average daily consumption of fruits and vegetables combined by approximately 0.30 cups
Data collection 24-hour food recalls conducted at baseline (first session) and follow-up (sixth session) in a group setting
Baseline survey administered at first session concurrent with MSUE data collection. For follow-up survey, surveys were mailed to participants, and nonrespondents were contacted by telephone.
Impact estimate Pre- and posttest change between intervention and comparison group
Pre- and posttest change between intervention and comparison group
Data analysis GLM models with controls for suspected confounding of demographic and other variables that were adjusted for clustering when necessary; also ran a series of simple (ordinary least squares) difference-in-difference regression models that included the same covariates used in the GLM analyses
Mixed model regression using maximum likelihood estimation
a The independent evaluator did not collect data in one intervention center because it was added after the cutoff date for data collection.
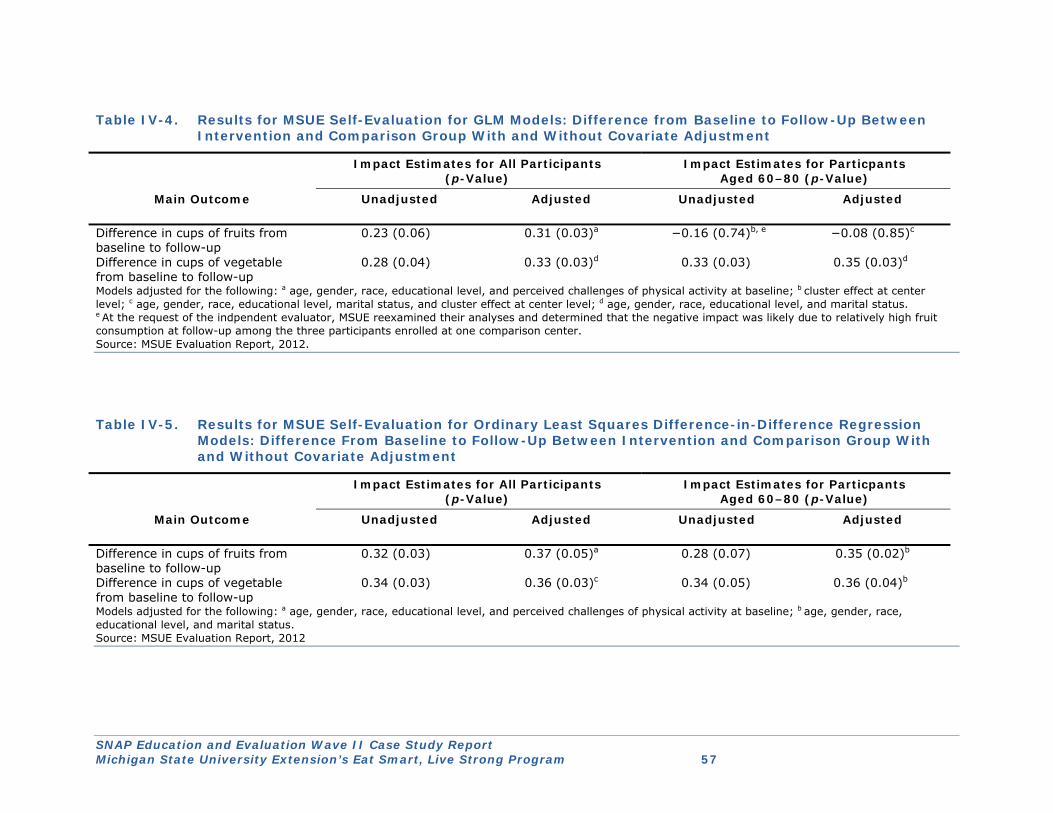
SNAP Education and Evaluation Wave II Case Study Report Michigan State University Extension’s Eat Smart, Live Strong Program 57
Table IV-4. Results for MSUE Self-Evaluation for GLM Models: Difference from Baseline to Follow-Up Between Intervention and Comparison Group With and Without Covariate Adjustment
Impact Estimates for All Participants (p-Value)
Impact Estimates for Particpants Aged 60–80 (p-Value)
Main Outcome Unadjusted
Adjusted
Unadjusted Adjusted
Difference in cups of fruits from baseline to follow-up
0.23 (0.06) 0.31 (0.03)a −0.16 (0.74)b, e −0.08 (0.85)c
Difference in cups of vegetable from baseline to follow-up
0.28 (0.04) 0.33 (0.03)d 0.33 (0.03) 0.35 (0.03)d
Models adjusted for the following: a age, gender, race, educational level, and perceived challenges of physical activity at baseline; b cluster effect at center level; c age, gender, race, educational level, marital status, and cluster effect at center level; d age, gender, race, educational level, and marital status. e At the request of the indpendent evaluator, MSUE reexamined their analyses and determined that the negative impact was likely due to relatively high fruit consumption at follow-up among the three participants enrolled at one comparison center. Source: MSUE Evaluation Report, 2012.
Table IV-5. Results for MSUE Self-Evaluation for Ordinary Least Squares Difference-in-Difference Regression Models: Difference From Baseline to Follow-Up Between Intervention and Comparison Group With and Without Covariate Adjustment
Impact Estimates for All Participants (p-Value)
Impact Estimates for Particpants Aged 60–80 (p-Value)
Main Outcome Unadjusted
Adjusted Unadjusted Adjusted
Difference in cups of fruits from baseline to follow-up
0.32 (0.03) 0.37 (0.05)a 0.28 (0.07) 0.35 (0.02)b
Difference in cups of vegetable from baseline to follow-up
0.34 (0.03) 0.36 (0.03)c 0.34 (0.05) 0.36 (0.04)b
Models adjusted for the following: a age, gender, race, educational level, and perceived challenges of physical activity at baseline; b age, gender, race, educational level, and marital status. Source: MSUE Evaluation Report, 2012
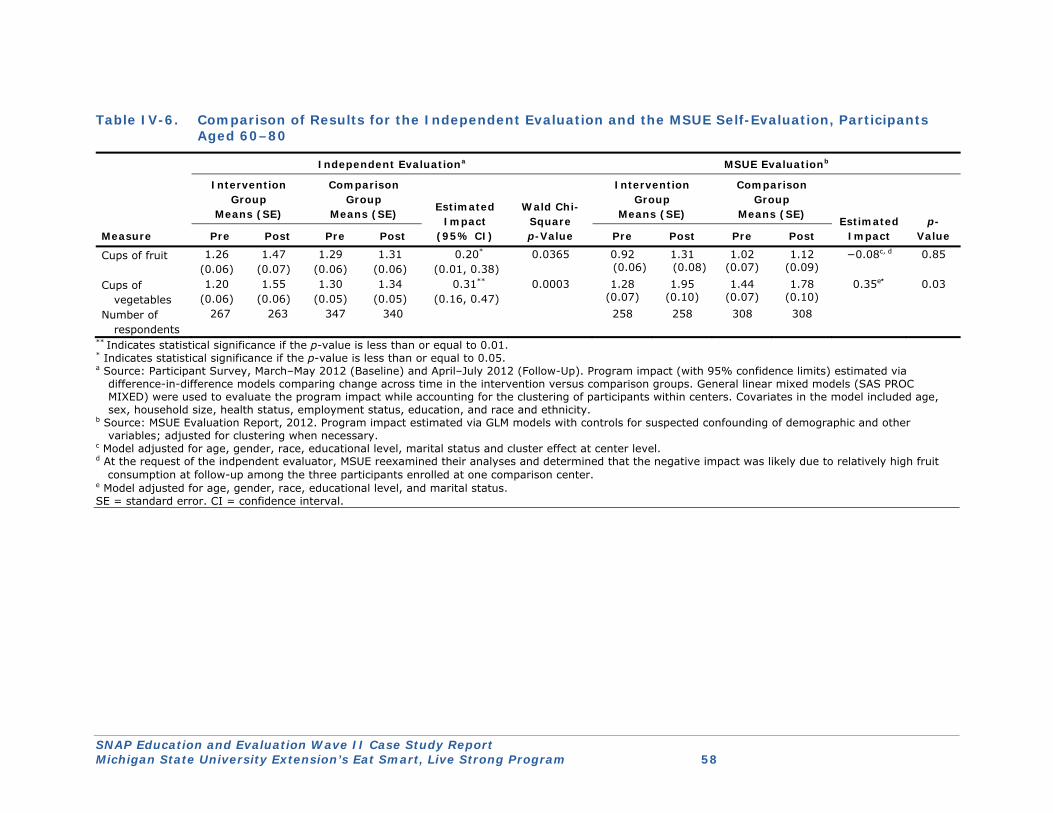
SNAP Education and Evaluation Wave II Case Study Report Michigan State University Extension’s Eat Smart, Live Strong Program 58
Table IV-6. Comparison of Results for the Independent Evaluation and the MSUE Self-Evaluation, Participants Aged 60–80
Independent Evaluationa MSUE Evaluationb
Measure
Intervention Group
Means (SE)
Comparison Group
Means (SE) Estimated
Impact (95% CI)
Wald Chi-Square p-Value
Intervention Group
Means (SE)
Comparison Group
Means (SE) Estimated
Impact p-
Value Pre Post Pre Post Pre Post Pre Post
Cups of fruit 1.26 (0.06)
1.47 (0.07)
1.29 (0.06)
1.31 (0.06)
0.20* (0.01, 0.38)
0.0365 0.92 (0.06)
1.31 (0.08)
1.02 (0.07)
1.12 (0.09)
−0.08c, d 0.85
Cups of vegetables
1.20 (0.06)
1.55 (0.06)
1.30 (0.05)
1.34 (0.05)
0.31** (0.16, 0.47)
0.0003 1.28 (0.07)
1.95 (0.10)
1.44 (0.07)
1.78 (0.10)
0.35e* 0.03
Number of respondents
267 263 347 340 258 258 308 308
** Indicates statistical significance if the p-value is less than or equal to 0.01. * Indicates statistical significance if the p-value is less than or equal to 0.05. a Source: Participant Survey, March–May 2012 (Baseline) and April–July 2012 (Follow-Up). Program impact (with 95% confidence limits) estimated via
difference-in-difference models comparing change across time in the intervention versus comparison groups. General linear mixed models (SAS PROC MIXED) were used to evaluate the program impact while accounting for the clustering of participants within centers. Covariates in the model included age, sex, household size, health status, employment status, education, and race and ethnicity.
b Source: MSUE Evaluation Report, 2012. Program impact estimated via GLM models with controls for suspected confounding of demographic and other variables; adjusted for clustering when necessary.
c Model adjusted for age, gender, race, educational level, marital status and cluster effect at center level. d At the request of the indpendent evaluator, MSUE reexamined their analyses and determined that the negative impact was likely due to relatively high fruit
consumption at follow-up among the three participants enrolled at one comparison center. e Model adjusted for age, gender, race, educational level, and marital status. SE = standard error. CI = confidence interval.

SNAP Education and Evaluation Wave II Case Study Report Michigan State University Extension’s Eat Smart, Live Strong Program 59
E. Lessons Learned
1. Facilitators and Challenges to Implementation of Evaluation as Planned
The MSUE evaluation manager identified several critical challenges she faced in implementing the evaluation, particularly with a senior audience. The most commonly reported facilitators and challengers are described below:
a. Facilitators
▲ Training was high quality and effective, ensuring consistent data collection
The program director reported that the high quality and effectiveness of the data collector training. Based on her observation and review of the training program, as well as data collectors’ administration of the pre- and postsurveys, she thought that the training that they received helped to ensure that the data were collected consistently and appropriately. She specifically cited the emphasis placed on administering the surveys in a manner that would reduce response bias to the greatest extent possible (e.g., paying close attention to intonation while reading survey questions).
▲ Resources available from MSUE were helpful in conducting the ESLS demonstration project evaluation
The evaluation manager reported that the resources available from MSUE (supplies and qualified personnel) were very helpful in completing this project. The MSUE business office, specifically, assisted with the coordination of the gift cards, approval of the research assistant’s time, and coordination of how the counties purchased the supplies needed to implement the study (e.g., office supplies).
▲ MSUE supervisory educators and direct educators were extremely cooperative and helpful in the evaluation of ESLS
MSUE supervisory educators and direct educators made significant contributions of time and flexibility in the evaluation of ESLS. Direct educators made the ESLS program a high priority in their county programming and were cooperative with the State extension office in the implementation of the evaluation.
▲ The ESLS curriculum design facilitated an efficient evaluation
The ESLS curriculum is a four-lesson curriculum implemented primarily at senior centers. The design of ESLS provides for a simple and efficient evaluation, yet seniors reported this program to be interesting and the right length for their interests.
b. Challenges
▲ Variety and the number of instructors administering the evaluation of ESLS increased the complexity of the evaluation
The evaluation manager reported that the number of different instructors involved in this project was unusual in this type of study.
“In research, you have to control for this number and variety of instructors. It was then very hard because there were so many instructors and each have their own personality.”
—MSUE evaluation manager
In order to reach the required number of seniors in the intervention group throughout the State, a large number of MSUE direct educators needed to be involved in this project
SNAP Education and Evaluation Wave II Case Study Report Michigan State University Extension’s Eat Smart, Live Strong Program 60
▲ It was a challenge to recruit enough ESLS senior centers for the evaluation
The evaluation manager reported that it was difficult to recruit enough intervention and comparison centers for the study. The primary reason for this challenge was that study commitments from senior centers had been obtained early on, long before the study started. During that interim period, changes in personnel at senior centers and MSUE required obtaining new commitments from senior centers at the commencement of the study.
▲ It was a challenge to recruit enough ESLS participants for the evaluation
Because it was difficult to recruit the required number of senior centers for the evaluation, it also was difficult to recruit ESLS participants. The senior centers’ role was central in the recruitment of ESLS participants, and without their assistance, direct educators found recruitment challenging. As direct educators reported, the senior centers are central to a successful program implementation.
▲ The evaluation necessitated senior center visits by evaluation manager and State SNAP-Ed director
In order to monitor recruitment efforts and study fidelity, implementation of the ESLS program required that the evaluation manager and the State SNAP-Ed director travel to a number of senior centers to monitor and provide assistance. This level of monitoring involved many more staff hours spent in the evaluation of this program. As reported by the evaluation manager, this level of support is atypical for MSUE’s SNAP-Ed regular programming.
▲ Use of gift cards as an incentive proved more challenging than originally expected
MSUE reported that it was challenging to purchase and track use of the gift cards, even though the MSUE business office was extremely helpful. MSUE key informants reported that they used strict protocols for the administration and tracking of the gift cards, which was much more time-consuming and difficult than originally planned.
▲ Data quality was inconsistent
The evaluation manager reported that after the initial analysis, there were challenges with data quality. In some cases, a subject completed a postsurvey but not a presurvey. In another instance, one group of five cases was mailed to the state office but never received. These data were lost to the evaluation.
2. Intended Use of Evaluation Results
The evaluation manager provided the following list of ways that they will share results of the ESLS program with stakeholders, colleagues and partners.
Internal reports
● Internal reports MSUE administrators
● Annual reporting to National Institute of Food and Agriculture
● MSUE Fall Conference
External reports
● Submit manuscripts for publication in peer-reviewed journals
Moreover, the evaluation manager plans to ask the MSUE direct educators whether there are research questions that they think that the data could answer, and she will conduct an analysis. She reported that this additional activity will make the most of the data available.
SNAP Education and Evaluation Wave II Case Study Report Michigan State University Extension’s Eat Smart, Live Strong Program 61
3. MSUE’s Future Evaluation Plans
The evaluation manager emphasized the importance of conducting program evaluation, recognizing that it is critical to ensuring that they can continue to improve MSUE SNAP-Ed programming.
MSUE’s future evaluation plans include the following:
● ESLS data will answer other programming questions. The ESLS demonstration project has provided MSUE with a great deal of valuable data. More analyses will be performed on these data, specifically eating behavior and physical activity data.
● Trained direct educators may use more rigorous evaluation for ESLS in the field if they choose. MSUE does plan to require rigorous evaluation of new ESLS participants, but direct educators who have been trained in the study will be allowed to use this evaluation methodology for their programming in the future. MSUE will track the usual Nutrition Education Evaluation and Reporting System outcomes at the state level and include the additional evaluation if the direct educator so desires.
● Independent data collectors will serve on future grant funded projects. In future program evaluations for grant-funded projects, MSUE has stated feeling that it would be beneficial to have independent data collectors. This will help facilitate program fidelity and provide for a more efficient data collection process.
▲ Suggestions for Improving Evaluations
A well-designed impact evaluation accomplishes several tasks that permit the investigator to draw a reasonable and supportable conclusion about the effect of the program and the likelihood that any changes observed in the sample participants would replicate to the broader target population. No single design can address every potential concern, and some approaches are commonly viewed as preferable. Although MSUE’s impact evaluation was well-designed, it faced some challenges in carrying out the evaluation. Specifically, MSUE encountered difficulties in recruiting senior centers and participants into the study, which resulted in ultimately changing the design of the study from a fully randomized design to a less rigorous quasi-experimental design and extending the timeline of the study to allow sufficient time to recruit the required number of participants into the study. For future evaluation studies, it is suggested that MSUE provide additional assistance to those centers and educators that experience difficulties recruiting participants into the evaluation study.
SNAP Education and Evaluation Wave II Case Study Report Michigan State University Extension’s Eat Smart, Live Strong Program 62
Chapter V ● Conclusions and Discussion ESLS is a SNAP-Ed nutrition education program conducted by MSUE in FY 2012. This nutrition education program for low-income older adults is designed to influence the target audience to adopt two key behaviors that will improve their health and quality of life: eat at least 3½ cups of fruits and vegetables every day and participate in at least 30 minutes of physical activity on most days of the week. ESLS participants received four 65-minute21 in-class lessons taught by MSUE nutrition educators over a 6-week period. Corresponding take-home materials, activities, and resources were provided to seniors after each lesson for at-home review and reinforcement of key messages. ESLS participants were encouraged to engage in the at-home activities to improve the likelihood that they would overcome challenges and barriers to healthy eating and physical activity. The first week comprised pre-intervention data collection, weeks 2–5 consisted of the four ESLS lessons, and the 6th week included post-intervention data collection. MSUE conducted ESLS programs in selected senior centers from March through July 2012.
In Federal FY 2012, ESLS was implemented in 18 centers in both rural and urban areas of Michigan. MSUE enrolled 326 seniors from 18 senior centers in the ESLS program at an approximate cost of $133.19 per senior. This final chapter presents a summary and discussion of the key findings of this independent study.
A. Key Process Evaluation Findings: Factors Supporting Implementation
Program administrators, the evaluation manager, and direct educators from MSUE reported that ESLS was a popular program for senior audiences, which facilitated implementation of this nutrition intervention. Key informants identified many factors that contributed to its successful implementation:
▲ Useful and relevant program materials and messages. MSUE educators reported that the ESLS program and materials developed by FNS were easy to use and very relevant to the needs of older adults. Moreover, the ESLS leader’s guide is well-crafted and includes instructions for the effective implementation of the program, marketing materials, developmental information about 60- to 74-year-olds, and additional resources. The ESLS key messages are as relevant to older adults today as they were when the program was originally developed in 2007. Interviews with direct educators highlighted the fact that programs such as ESLS make efficient use of their time because the materials are already designed and ready for implementation at the local level. The evaluation manager reported that ESLS provides a consistent program for implementation throughout the state, which makes evaluation of outcomes easier to determine.
▲ Target audience receptive to the intervention. ESLS participants consistently reported that they liked the messages in the program and found the materials useful in helping them eat healthier foods and incorporate exercise into their daily routine. Moreover, observations conducted at selected senior centers implementing ESLS clearly demonstrated that seniors were engaged in the program by the questions they asked and input they provided. Focus group interviews revealed that seniors enjoyed participating in the nutrition education and physical activity components of
21 This represents the average time of ESLS sessions as implemented, including the nutrition and physical activity
components.

SNAP Education and Evaluation Wave II Case Study Report Michigan State University Extension’s Eat Smart, Live Strong Program 63
the program and that they were looking forward to another program of this nature if it were offered at their center or housing complex.
▲ MSUE educators well-received by participants. MSU is a respected educational institution in Michigan. As a land grant university, cooperative extension is tasked with providing a broad component of the population with practical education to improve everyday living. Seniors who participated in focus groups expressed a high regard for MSU and cooperative extension. Programs such as ESLS afford seniors the opportunity for lifelong learning in a convenient location. The link to MSU and cooperative extension enhanced extension’s ability to market ESLS. This, combined with extension educators who are subject matter professionals working in these communities, assists with the engagement of audiences in their programming.
B. Key Process Evaluation Findings: Challenges to Implementation Some challenges to the implementation of the ESLS program were also identified by key informants:
▲ Enrollment of target-age seniors into the program. Although some senior housing residents and senior meals program participants were in their early 60s,22 the majority were in their 70s or older. Since ESLS is designed for able-bodied, independent older adults between the ages of 60 and 74, it was difficult for educators to reach the targeted audience without restricting a large group of seniors who were interested in the program. ESLS was opened up to those aged 75–80 in order to have enough participants for the study; nevertheless, some seniors older than 80 participated in the evaluation study. Because the age restriction relates to safety issues with the physical activity portion of ESLS, extension educators will need to continue to restrict the age of participants and perhaps offer another type of program to seniors who are interested in the topic. A more desirable alternative may be to add a physical activity component to ESLS tailored to adults aged 74 and older, because the program did have a positive impact on the fruit and vegetable consumption of adults from age 60–80.
▲ Varied levels of senior center engagement. Senior centers and community senior meal sites were at times a challenge to engage in ESLS programming. The senior center directors played a key role in the program in that they needed to be a partner in the program by providing space and assist with recruitment. Some senior center directors were not fully engaged in the process and not helpful in providing space and assist with recruitment. In key-informant interviews, educators and administrators reported that establishment of strong relationships with partners is essential to the success of program implementation especially if the expectation is that the partner will assist with the recruitment of participants for the intervention. Taking the time to help partners understand the mutual benefits of partnering, establishing clear channels of communication, and developing an understanding of respective roles can help provide the foundation for strong partnerships.
▲ Costs of fruits and vegetables. When seniors were asked whether anything external to the program prevented them from trying the nutrition suggestions and recipes provided in the program materials, the most frequently cited factor was cost. Several focus group participants emphasized that while they liked the recipes and shopping ideas provided by the program materials, they are shopping on a very limited budget. They felt that the cost of purchasing fruits and vegetables in their communities was prohibitive, and finding stores with affordable quality
22 At tribal centers, Native Americans are considered seniors if they are over the age of 55.
SNAP Education and Evaluation Wave II Case Study Report Michigan State University Extension’s Eat Smart, Live Strong Program 64
fruits and vegetables was difficult, especially for seniors without transportation options. Reinforcing the community food resource options in Lesson 4, as well providing additional food resources available in the community, will provide an enhanced opportunity to increase fruits and vegetables in seniors’ diets.
C. Key Impact Evaluation Findings The goal of the impact evaluation was to assess the impact of ESLS on participants’ average daily consumption of fruits and vegetables. At baseline, the comparison group was composed of significantly more males and was relatively less educated than the intervention group; however, these differences were taken into consideration by including these and other demographic variables in the impact models. The results of the impact evaluation suggest that ESLS is effective at encouraging seniors to eat more fruits and vegetables each day. ESLS increased participants’ average daily consumption of fruits and vegetables combined by 0.52 cups (p < 0.01), average daily consumption of fruits by 0.20 cups (p < 0.05), and average daily consumption of vegetables by 0.31 cups (p < 0.01). These changes compare favorably with findings from evaluations of other adult nutrition education programs (Ammerman et al., 2002). Additional research is needed to evaluate whether participants sustained these behavior changes following the 4-week intervention.
It appears that program participants were highly motivated to improve their nutrition behaviors as evidenced by findings from the participant survey on reasons for choosing to participate in ESLS, thus there may be some evidence of selection bias. The majority of respondents (73 percent) reported that they wanted to eat more healthily, and 63 percent wanted to improve their overall health. The comparison group was not asked to answer these questions. Similar procedures were used to recruit participants for the comparison group, with the exception that comparison group participants were told that that they would need to attend two sessions to complete the evaluation surveys (week 1 for baseline and week 6 for follow-up) and take part in the 4 weeks of nutrition education after the follow-up data collection.
ESLS did not have an impact on other dietary behaviors examined in the impact evaluation, except for an increase in eating a variety of vegetables each day that approached statistical significance. For shopping and food preparation practices, there was a statistically significant increase in the proportion of participants who agreed or strongly agreed that they add fruits or vegetables as ingredients during meal preparation (odds ratio = 1.9 percent, p < 0.05), a practice encouraged by the ESLS curriculum to help seniors eat more fruits and vegetables each day.
Although physical activity was not an outcome of interest for the independent evaluation, ESLS placed equal emphasis on physical activity and nutrition. MSUE found that the program did not have an impact on moderate physical activity,
The ESLS curriculum encouraged participants to obtain support from their health care providers and friends and family members. At the end of the intervention, ESLS participants were more likely to discuss with their health care provider the fruits and vegetables that they should not eat for medical reasons compared to participants in the comparison group (16.5 versus 7.1 percent, p < 0.05). Additionally, ESLS participants were more likely to talk with friends and family about how to eat more fruits and vegetables each day (54.8 versus 25.6 percent, p < 0.01)

SNAP Education and Evaluation Wave II Case Study Report Michigan State University Extension’s Eat Smart, Live Strong Program 65
D. Key Findings From the Assessment of MSUE’s Self-Evaluation The independent evaluators assessed the quality of MSUE’s self-evaluation and compared the methods and results of MSUE’s self-evaluation with those of the independent evaluation. The MSUE evaluation employed the same quasi-experimental design used for the independent evaluation. The assessment identified the following strengths and weaknesses of the MSUE self-evaluation:
▲ Strengths of MSUE’s evaluation included the use of 24-hour food recalls for collecting fruit and vegetable intake, well-planned and -executed data collection procedures, and modest attrition and minimal missing data for the impact evaluation.
▲ Regarding weaknesses, MSUE experienced difficulties enrolling the specified number of participants meeting the age eligibility criterion.
The MSUE and independent evaluations found a positive impact on vegetable consumption. The independent evaluation found a positive impact on fruit consumption; based on the analyses conducted by MSUE, the impact on fruit consumption was inconclusive since two different modeling approaches (the GLM analyses originally conducted and the simple least squares analysis conducted at the request of the independent evaluator) produced different results. Combined, the findings from these two evaluation studies suggest that ESLS is effective at encouraging seniors to eat more fruits and vegetables each day.
E. Recommendations The success of ESLS in increasing seniors’ fruit and vegetable consumption is an important finding. Furthermore, the program was well-received by seniors who participated.
1. Key Areas for Program Improvement
While this evaluation found that ESLS has a significant positive impact on seniors’ consumption of fruits and vegetables, in order to replicate this program in other states, SNAP-Ed IAs should consider the following actions for program improvement:
▲ Establish strong relationships with senior center and senior housing directors. In establishing strong relationships with senior centers, key-informant interviews highlighted five key components: (1) clear purpose, (2) ownership in the process, (3) working with the right staff, (4) development and maintenance of a level of trust, and (5) development of the roles and working arrangements. Taking the time to help partners understand the mutual benefit of partnering, establishing clear channels of communication, and developing an understanding of the respective roles can help provide the foundation for strong relationships.
▲ Develop additional educational techniques to motivate seniors to complete activity sheets each week. One goal of ESLS is to assist seniors with setting realistic goals that will lead to improved behaviors. The purpose of the ESLS take-home activity materials is to encourage seniors to set their own goals, and start the process of behavior change. Since only 37 percent of ESLS participants completed all take-home materials each week, more investigation is needed to determine the best way to motivate seniors to complete take-home activities and bring them back to class the next week.
▲ Specifically address participant concerns about the cost of purchasing fruits and vegetables. Understanding the environment in which seniors live will assist educators in providing assistance with the types of fruits and vegetables available in the area, where the bargains can be located,
SNAP Education and Evaluation Wave II Case Study Report Michigan State University Extension’s Eat Smart, Live Strong Program 66
and how they might take advantage of available fruits and vegetables. Some seniors may have issues with transportation, others with resource management, and still others with preparing and/or storing fruits and vegetables. Discussing these issues with the senior center director and investigating community food resources before implementing ESLS will enhance educators’ understanding of the challenges participants face in increasing their fruit and vegetable intake, This will work toward the goal of maximizing the use of local food resources, as stated in Lesson 4 of the ESLS Leader’s Guide. Moreover, to more adequately address concerns about the costs of fruits and vegetables, the curriculum could be supplemented with more informational materials on meal planning and shopping on a limited budget.
2. Suggestions for Improving Evaluations
MSUE encountered difficulties in recruiting senior centers and participants into the study. These difficulties resulted in ultimately changing the design of the study from a fully randomized design to a less rigorous quasi-experimental design and extending the timeline of the study to allow sufficient time to enroll study participants. For future evaluation studies, it is suggested that MSUE provide additional assistance to those centers and educators that encounter difficulties recruiting participants into the evaluation study.