supplementary data for: sprouty genes … word - supplementary data.docx author ophir klein created...
TRANSCRIPT

SUPPLEMENTARY DATA FOR: Sprouty genes regulate proliferation and survival of human embryonic stem cells Hady Felfly1 and Ophir D. Klein1,2,* 1Program in Craniofacial and Mesenchymal Biology and Department of Orofacial Sciences, University of California, San Francisco, San Francisco, CA, USA 2Department of Pediatrics and Institute for Human Genetics, University of California, San Francisco, San Francisco, CA, USA

Supplementary Figure 1: Colony characteristics of the UCSF4 hESC. The UCSF4
hESC line was grown feeder free and exhibited typical colony morphology of hESCs (a,
b). These cells also expressed common markers for hESCs, as stained by
immunocytochemistry and observed by fluorescent microscope: Nanog (c), Oct4 (d),
Sox2 (e), Tra-1-60 (f), Tra-1-81 (g), SSEA4 (h). Magnification: a, c-h, 100X; b, 200X.

Supplementary Figure 2: Percentage of live cells with and without lipofectamine. To
assess the level of lipofectamine toxicity, the percentage of live cells was measured by
flow cytometry 24h after adding lipofectamine to cells (without siRNA), and compared
with untreated controls.
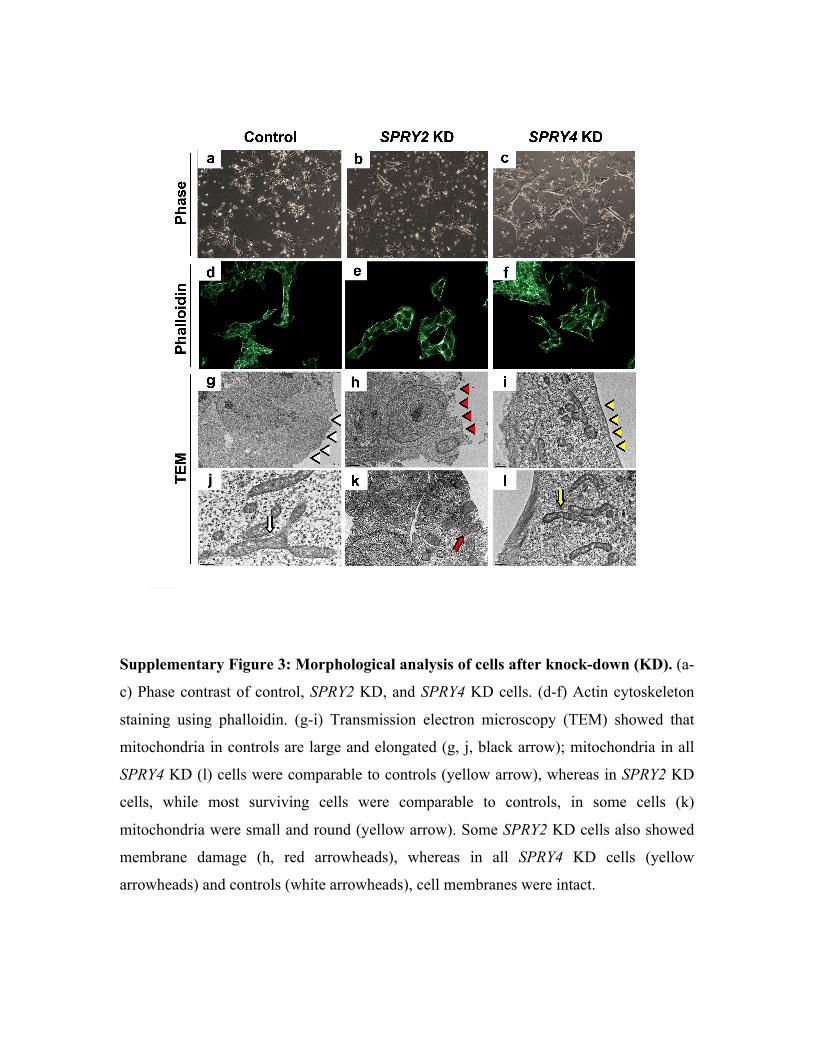
Supplementary Figure 3: Morphological analysis of cells after knock-down (KD). (a-
c) Phase contrast of control, SPRY2 KD, and SPRY4 KD cells. (d-f) Actin cytoskeleton
staining using phalloidin. (g-i) Transmission electron microscopy (TEM) showed that
mitochondria in controls are large and elongated (g, j, black arrow); mitochondria in all
SPRY4 KD (l) cells were comparable to controls (yellow arrow), whereas in SPRY2 KD
cells, while most surviving cells were comparable to controls, in some cells (k)
mitochondria were small and round (yellow arrow). Some SPRY2 KD cells also showed
membrane damage (h, red arrowheads), whereas in all SPRY4 KD cells (yellow
arrowheads) and controls (white arrowheads), cell membranes were intact.

Supplementary Figure 4: Percentage of live cells after knock-down. Knock-down
experiments were performed and the percentage of live cells was measured at three time
points afterwards for both SPRY2 (top) and SPRY4 (bottom). After SPRY2 knock-down,
the percentage of live cells was lower at Day 2 and increased progressively afterwards,
while in SPRY4 the percentage of live cells was higher at all three time points.