supplementary digital content
TRANSCRIPT

1
Supplementary Digital Content
This appendix has been provided by the authors to give readers additional information about
their work.
Supplement to: Checklist for early recognition and treatment of acute illness and injury
(CERTAIN): an exploratory multicenter international quality improvement study in the intensive
care units with variable resources
Writing group for the CERTAIN investigators of the SCCM Discovery Network

2
Table of contents
e Table 1. Participating ICUs……………………………………............................... 3
e Figure 1. Admission module …………………………………….............................. 5
e Figure 2. Rounding module ………………………………………………………. 6
e Figure 3. Paper rounding module………………………………………………….. 7
e Figure 4. Description of the intervention ………………………………................... 8
e Figure 5. Study design………………………………................................................ 9
e Figure 6. Study time line………………………………………................................. 10
e Table 2. Missing data……………………………………………………………… 11
e Table 3. Definitions of care processes and clinical outcomes……………………... 12
e Table 4. Study duration……………………………………………………………. 15
e Figure 7. Study duration by center….………………………………………………. 16
e Table 5. The incidence rates of non-adherence to basic critical care and outcomes
in low and middle income countries………………………………………
17
e Table 6. The incidence rates of non-adherence to basic critical care and outcomes
in high income countries……………………………………………….
20
e Figure 8. Survival analysis according to income strata…………………………….. 23
e Table 7. Modifications from the original analysis plan……………………………. 26
e Table 8. The incidence rates of non-adherence to daily care processes before and
after CERTAIN implementation …………………………….
29
E Text 1
Data Set Development and Statistical Analysis …………………………
32

3
e Table 1.Participating ICUs
Hospital Country Income
level
Number
of ICU
beds
Number of
hospital
beds
ICU type
Number of
ICU
physicians
Number
of ICU
nurses
General Hospital "Prim.drAbdulahNakas" Bosnia and
Herzegovina LMIC 8 240 MICU 2 2
University Clinical Hospital Mostar Bosnia and
Herzegovina LMIC 12 650 MIXED 8 30
University Clinical Centre of the Republic
of Srpska
Bosnia and
Herzegovina LMIC 8 1100 MICU 12 14
Anhui Province Hospital China LMIC 67 3800 MIXED 18 68
Beijing Hospital China LMIC 10 1200 SICU 9 21
Chinese PLA General Hospital China LMIC 20 4500 SICU 20 60
DongGuanKanghua Hospital China LMIC 14 1080 OTHER 36 28
the First Affiliated Hospital of Guangzhou
Medical University China LMIC 37 1500 MIXED 23 109
Guandong General Hospital China LMIC 15 2877 MICU 11 42
Guang'anmen Hospital China LMIC 8 680 MICU 8 26
Tianjin First Center Hospital China LMIC 30 1400 MICU 30 75
West China Hospital of Sichuan University China LMIC 52 4300 MICU 32 140
Xiangya Hospital Central South University China LMIC 33 2500 SICU 15 80
Clinical Hospital Center Rijeka Croatia HIC 21 1069 MIXED 43 44
CEDIMAT, Plaza de la Salud Dominican
Republic LMIC 6 97 MIXED 3 2
Ispat General Hospital (IGH) India LMIC 19 635 MICU 3 12
Kasturba Medical College Hospital (KMC) India LMIC 20 2058 MICU 6 18
LokNayak Hospital, MAMC India LMIC 8 2850 MICU 8 8
St. James’s Hospital Ireland HIC 15 1010 MIXED 44 120
St. George's hospital Lebanon LMIC 10 385 MICU 5 16
Instituto Nacional de CienciasMédicas y
Nutrición Salvador Zubirán (INCMNSZ) Mexico LMIC 12 167 MICU / /
ShaukatKhanum Memorial Cancer Hospital
and Research Center Pakistan LMIC 11 220 MIXED 12 0
St. Luke's Medical Center Philippines LMIC 18 520 MIXED 8 88

4
The Medical City Hospital (TMC) Philippines LMIC 18 800 MICU 8 40
Heliodor Swiecicki Clinical Hospital at the
Karol Marcinkowski Medical University Poland HIC 7 460 MIXED 2 5
King Abdulaziz Medical City Saudi Arabia HIC 21 900 MIXED 10 100
Military Medical Academy (MMA) Serbia LMIC 7 1200 SICU 8 12
The Institute for Pulmonary Diseases of
Vojvodina Sremska Kamenica Serbia LMIC 5 320 MICU 7 21
Mbeya Zonal Referral Hospital Tanzania LMIC 6 9 MIXED 3 8
Akdeniz University Hospital Turkey LMIC 94 967 MIXED 43 44
Corpus Christi Medical Center USA HIC 21 160 MIXED 4 5
Mayo Clinic Health System Mankato USA HIC 10 200 MIXED 5 40
Mayo Clinic Health System Franciscan
Healthcare USA HIC 14 150 MIXED 4 35
Wyckoff Heights Medical Center USA HIC 16 350 MICU 60 15

5
e Figure 1. Admission module
CERTAIN admission/resuscitation module (Online version)
CERTAIN-admission is designed for evaluation of life-threatening emergencies with embedded
timer, checklists and decision support cards to facilitate error-free care of acutely deteriorating
patient (ICU admission and subsequent emergencies). Reading from up to bottom organizational
elements are (1) primary (ABCDE) survey; and (2) secondary patient survey, and from left to
right the key organizational elements are: (1) clinical context -reason for admission/patient
problem list; (2) provider actions tracked in the status central panel; and (3) proposed
medications and interventions.

6
e Figure 2. Rounding module (Online version)
CERTAIN Rounding module is designed as a simple and efficient ICU rounding tool with
embedded checklist and decision support cards to facilitate error-free day-to-day care in the ICU.
The key characteristic of CERTAIN is the availability of task-specific and concept-oriented
views of patient data. CERTAIN serves to organize appropriate data, as determined by a review
of end-user data needs, and incorporates evidence-based checklists.

7
e Figure 3. Paper rounding module
CERTAIN is available in electronic form for PC, in mobile version for cell phones and in paper
version in case of problems with internet connection. Below is an example of local adaptation of
paper version for rounding in Mexico.

8
e Figure 4. Description of the intervention
Quiz results were used to assess competency of the participants to use the CERTAIN tool.

9
e Figure 5. Study design
CERTAIN is a before-after study. Following successful implementation in a single center pilot
ICU, CERTAIN was implemented sequentially in each ICU in their selected turn so that by the
end of the study all ICUs have received the intervention.

10
e Figure 6. Study timeline

11
e Table 2. Missing data
Manual Checks were performed followed by Microsoft Excel Sheets and custom report forms for
each center in REDCap which were specifically designed to identify missing data points. We
created online tutorials and hold several online training sessions that explained the data filling
rules. The table shows the extent of missing data after attempts to locate missing data had been
made.
Form Section
(total observations) Parameters
N (%)
Admission
Date of birth 67 (1.6)
Weight (kg) at admission 90 (2.1)
Gender 60 (1.4)
Hospital Admission Date 87 (2.1)
Hospital Admission Source 71 (1.7)
ICU admission source 72 (1.0)
Discussion of limitation of life support Interventions at admission 93 (2.2)
Daily
Invasive mechanical ventilation 98 (0.8)
Documented Head of bed elevated at 30 degrees 175 (1.4)
Documented Peptic ulcer prophylaxis 128 (1.0)
Documented DVT prophylaxis 135 (1.0)
Documented Daily oral care 238 (1.8)
Documented assessment of spontaneous breathing trial 131 (1.0)
Documented ventilator associated pneumonia 131 (1.0)
Documented Use of vasoactive medication today 128 (1.0)
Documented family conference/discussion 203 (1.6)
Documented Central line 168 (1.3)
Urinary Catheter 170 (1.3)
List of Antimicrobial medications 1858
(14.4)
Outcome
Total number of days on mechanical ventilation during the entire
hospitalization 185 (4.5)
Palliative / comfort care given 182 (4.4)
Date of ICU discharge 172 (4.1)
Final ICU diagnosis 222 (5.3)
ICU discharge status 164 (3.9)
Hospital discharge date 242 (5.8)
Hospital discharge status 232 (5.6)
28-day mortality 286 (6.9)
12
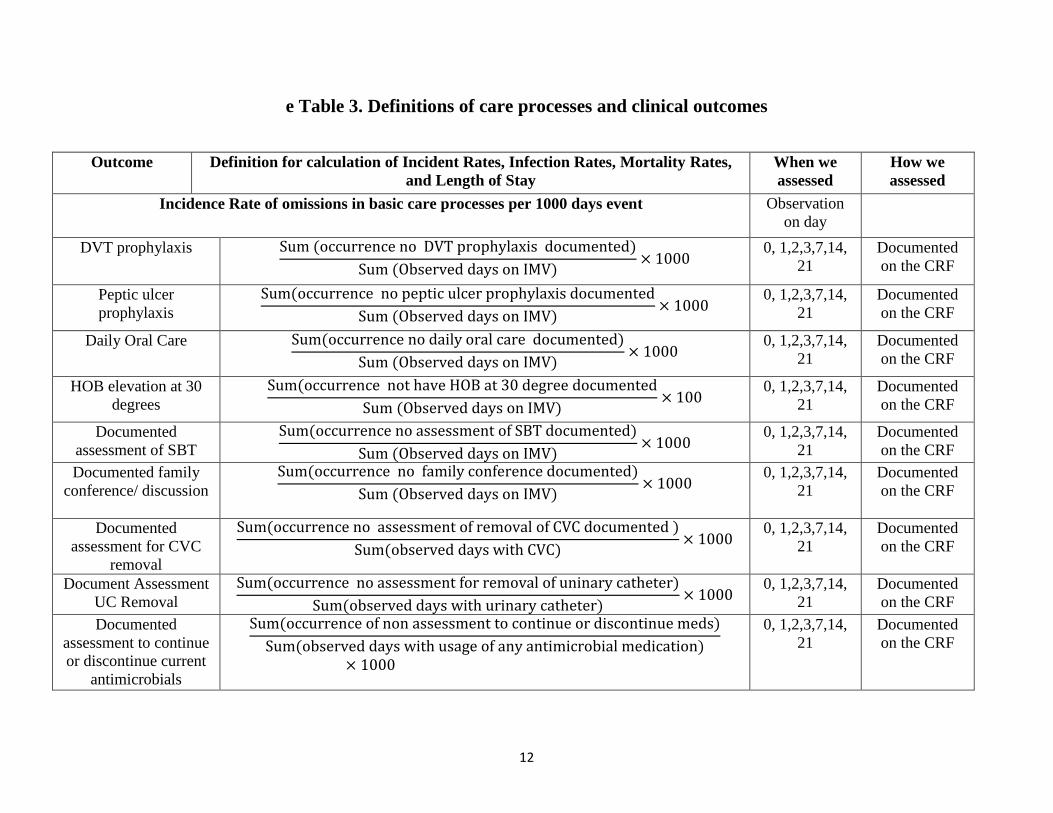
e Table 3. Definitions of care processes and clinical outcomes
Outcome Definition for calculation of Incident Rates, Infection Rates, Mortality Rates,
and Length of Stay
When we
assessed
How we
assessed
Incidence Rate of omissions in basic care processes per 1000 days event Observation
on day
DVT prophylaxis Sum (occurrence no DVT prophylaxis documented)
Sum (Observed days on IMV)× 1000
0, 1,2,3,7,14,
21
Documented
on the CRF
Peptic ulcer
prophylaxis
Sum(occurrence no peptic ulcer prophylaxis documented
Sum (Observed days on IMV)× 1000
0, 1,2,3,7,14,
21
Documented
on the CRF
Daily Oral Care Sum(occurrence no daily oral care documented)
Sum (Observed days on IMV)× 1000
0, 1,2,3,7,14,
21
Documented
on the CRF
HOB elevation at 30
degrees
Sum(occurrence not have HOB at 30 degree documented
Sum (Observed days on IMV)× 100
0, 1,2,3,7,14,
21
Documented
on the CRF
Documented
assessment of SBT
Sum(occurrence no assessment of SBT documented)
Sum (Observed days on IMV)× 1000
0, 1,2,3,7,14,
21
Documented
on the CRF
Documented family
conference/ discussion
Sum(occurrence no family conference documented)
Sum (Observed days on IMV)× 1000
0, 1,2,3,7,14,
21
Documented
on the CRF
Documented
assessment for CVC
removal
Sum(occurrence no assessment of removal of CVC documented )
Sum(observed days with CVC)× 1000
0, 1,2,3,7,14,
21
Documented
on the CRF
Document Assessment
UC Removal
Sum(occurrence no assessment for removal of uninary catheter)
Sum(observed days with urinary catheter)× 1000
0, 1,2,3,7,14,
21
Documented
on the CRF
Documented
assessment to continue
or discontinue current
antimicrobials
Sum(occurrence of non assessment to continue or discontinue meds)
Sum(observed days with usage of any antimicrobial medication)× 1000
0, 1,2,3,7,14,
21
Documented
on the CRF

13
Documented
assessment to continue
or discontinue current
sedation meds
Sum(occurrence of non assessment to continue or discontinue meds)
Sum (observed days with usage of sedation or analgesics )× 1000
0, 1,2,3,7,14,
21
Documented
on the CRF
Incidence Rate of transfusion per 1000 ICU days
Any RBC
transfusion
Sum(occurrence of RBC transfusion)
Sum(Patient observation days)× 1000
0, 1,2,3,7,14,
21
Documented
on the CRF
Any Platelet
transfusion
Sum(occurrence of platelet transfusion
Sum(patient observation days)× 1000
0, 1,2,3,7,14,
21
Documented
on the CRF
Any FFP
transfusion
Sum(occurrence of FFP transfusion)
Sum(patient observation days)× 1000
0, 1,2,3,7,14,
21
Documented
on the CRF
Infection rates
Documented VAP
Sum(number of patient with VAP ever documented)
Sum (number of patients on IMV)× 100
0, 1,2,3,7,14,
21
Documented
on the CRF
Documented CVC
infection
Sum(number of patient with CL infection documented)
Sum (number of patient with central line)× 100
0, 1,2,3,7,14,
21
Documented
on the CRF
Documented UC
infection =Sum(number of patient with UC infections documented)
Sum (number of patient with urinary catheter)× 100
0, 1,2,3,7,14,
21
Documented
on the CRF
Mortality
ICU Mortality (number of ICU deaths)
ICUpatientsdischargedalive + ICUpatients dischargeddead× 100
Deaths of
patients in
ICU
Documented
on the CRF
Hospital mortality (number of hospital deaths)
Hospitalpatientsdischargedalive + Hospital patientsdischargeddead× 100
Deaths of
patients in
Hospital
Documented
on the CRF

14
The infection rate of patients experiencing central venous catheter (CVC) infections, urinary catheter (UC) infections, and ventilator associated
pneumonia (VAP) was calculated as follows: the denominator was the number of patients undergoing central line placement, urinary catheter
placement or invasive mechanical ventilation. The numerator was the number of patients having the infection on any observation day (only one
episode per patient was included in the analysis).
CRF, case report form; DVT, deep vein thrombosis; FFP, fresh frozen plasma; HOB, head of bed; IMV, invasive mechanical
ventilation; RBC, red blood cell; SBT, spontaneous breathing trial
Day 28 mortality (number of deaths in the first of 28 days after admission)
Patients alive day 28 + Patients dead day 28× 100
28 days after
ICU admission
Documented
on the CRF
Length of stay
Hospital length of
stay, days HospitalDischargeDate − HospitalAdmissionDate
The hospital
length of stay
for each
patient was
calculated. If
hospital LOS
exceeded 2
years, we
truncated it.
Documented
on the CRF
ICU length of stay,
days ICUDischargeDate − ICUAdmissionDate
The length of
day in ICU for
each patient
was
calculated.
ICU stay
greater than 2
years was
truncated at 2
years.
Documented
on the CRF.

15
e Table 4. Study duration
Length of Time to Complete Each Phase, (weeks)
N Median (IQR)
Pre-implementation: study set-up time 44 5.8 (1.6-18.5)
Stage 1. Baseline data collection 38 16.1 (10.3-29.4)
Stage 2. Remote training 38 7.1 (3.8-16.1)
Stage 3. Local implementation 35 15.0 (8.6-26.6)
Stage 4. Post implementation patient data
collection and maintenance of processes of care
34 30.2 (19.3-45.0)
Completion of whole study includes phases 1-4 34 96.1 (54.0-139.3)
IQR = interquartile range

16
e Figure 7. Study duration by center
Important variations in the length of time to complete each stage in different centers was noted.
Year
s

17
e Table 5. The incidence rates of non-adherence to basic critical care and outcomes in low- and middle-income
countries
Total 3233
Pre intervention
N=1065
Post intervention
N= 2168
Mechanical ventilation
Observed event
Incidence rate
95%CI
Observation
days
n
Observed
event
n
Patients
n
Incidence rate
95%CI
Observation
days
n
Observed
event
n
Patients
n
aIRR
p
per 1000
ventilator days 2678 725 per 1000
ventilator days 5250 1472
No DVT prophylaxis
327.9
(306.9-350.3) 2678 878 725
231.0
(218.4-244.4) 5250 1213 1472
0.72
0.66-0.78) <0.001
No Daily oral care
38.8
(32.0-47.1) 2678 104 725
40.8
(35.6-46.6) 5250 214 1472
0.95
(0.75-1.20) 0.66
No HOB elevation at 30
degrees
45.2
(37.8-54.0) 2678 121 725
45.1
(39.7-51.3) 5250 237 1472
1.09
(0.87-1.36) 0.46
No peptic ulcer
prophylaxis
66.8
(57.7-77.4) 2678 179 725
32.0
(27.5-37.2) 5250 168 1472
0.45
(0.37-0.56) <0.001
No documented
assessment of SBT
589.6
(561.2-619.4) 2678 1579 725
498.1
(479.4-517.6) 5250 2615 1472
0.87
(0.81-0.92) <0.001
No documented family
conference/ discussion
458.9
(434.0-485.3) 2678 1229 725
347.6
(332.0-363.9) 1472
0.76 (0.71-
0.82) <0.001
Central venous catheters
per 1000 CVC
days per 1000 CVC
days No documented
assessment for central
line removal
664.6
(636.1-694.5) 2988 1986 732
613.1
(593.1-633.7) 5727 3511 1470
0.90
(0.85-0.95) <0.001

18
Urinary catheters
per 1000
urinary
catheter days
per 1000
urinary
catheter days No documented
assessment for urinary
catheter removal
668.2
(643.7-693.6) 4138 2765 1007
609.5
(593.0-626.5) 8362 5097 2094
0.92
(0.87-0.96) <0.001
Antimicrobials and sedation
per 1000 days
of use per 1000
days of use No documented
assessment to continue
or discontinue current
antimicrobials
357.7
(339.7-376.6) 4054 1450 986
235.1
(224.5-246.3) 7588 1784 1950
0.67
(0.62-0.72) <0.001 No documented
assessment to continue
or discontinue current
sedation meds
366.9
(342.8-392.8) 2251 826 684
223.9
(210.6-238.1) 4546 1018 1456
0.64
(0.59-0.71) <0.001
Transfusions
per 1000 ICU
days per 1000 ICU
days
RBC
115.7
(106.3-125.9) 4650 538 1065
110.0
(103.4-117.1) 9000 990 2168
0.93
(0.84-1.04) 0.21
PLT
20.4
(16.7-25.0) 4650 95 1065
22.0
(19.1-25.3) 9000 198 2168
0.93
(0.73-1.20) 0.58
FFP
85.2
(77.2-94.0) 4650 396 1065
59.7
(54.8-64.9) 9000 537 2168
0.73
(0.64-0.83) <0.001
Infections
% (95%CI) % (95%CI) aOR
CRBSI 4.9 (3.6-6.7) 36 732 2.9(2.2-3.9) 43 1470
0.60
(0.38-0.95) 0.03

19
Urinary catheter
infections 4.3 (3.2-5.7) 43 1007 4.0 (3.2-4.9) 84 2094
0.89
(0.61-1.31) 0.56
VAP
22.9
(20.0-26.1) 166 725
23.1
(21.0-25.3) 340 1472
1.01
(0.80-1.28) 0.94
Mortality
Mortality rates Mortality rates
ICU
31.6
(28.9-34.5) 332 1049
23.4
(21.7-25.3) 507 21062
0.63
(0.53- 0.75) <0.001
Hospital
36.3
(33.4-39.3) 378 1041
28.5
(26.7-30.5) 616 21059
0.64
(0.54-0.76) <0.001
DAY 28
39.8
(36.8-42.8) 408 1025
30.9
(29.0-32.9) 668 2159
0.65
(0.55-0.76) <0.001
LOS
Geometric mean
(SD) Geometric mean
(SD) aRoGM
ICU 7.3 (3.0) 1037 6.2 (2.8) 2127
0.84
(0.77-0.90) <0.001
Hospital 16.0 (3.0) 1019 15.7 (2.7) 2118
0.97
(0.90-1.05) 0.45 Footnote. LMIC-Low and middle income countries, a-adjusted for center effect , OR-odds ratio, IRR-incident rate ratio, DVT-deep vein thrombosis, HOB-
head of bed, SBT-spontaneous breathing trial, VAP-ventilator associated pneumonia, CRBSI–catheter related bloodstream infection, RBC-red blood cell, Plt-
platelets, FFP-fresh frozen plasma, LOS-Length of stay, RoGM-ratio of geometric means
20
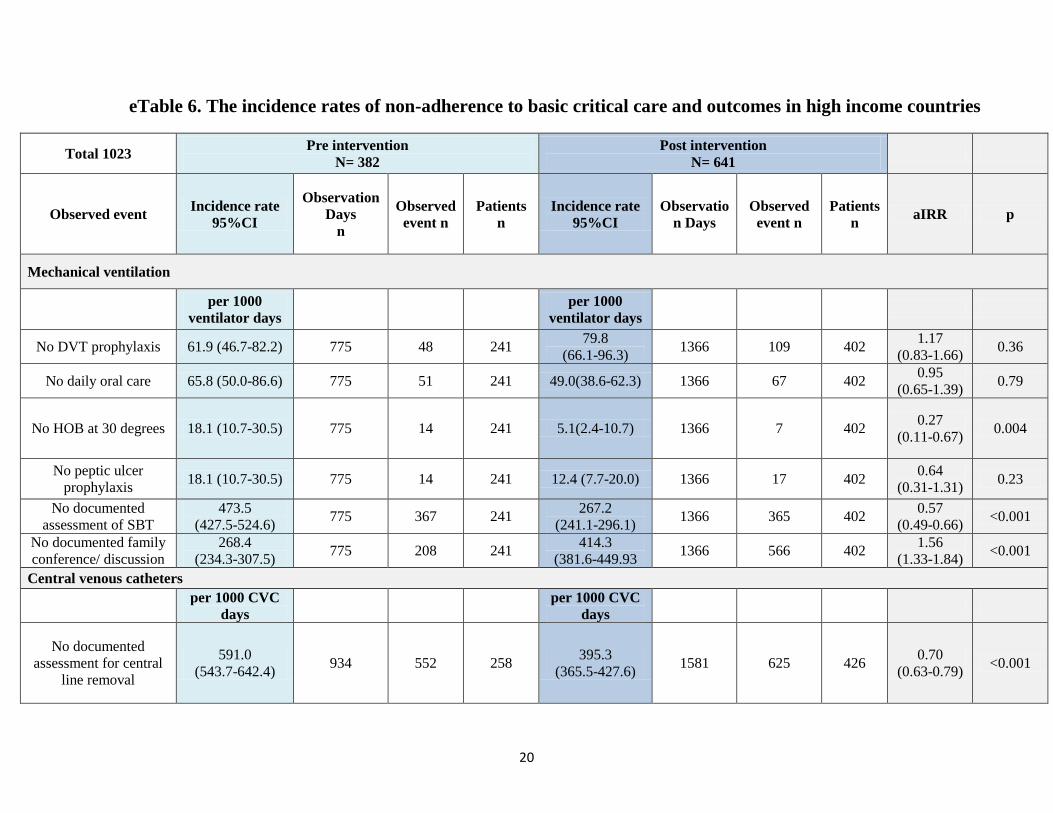
eTable 6. The incidence rates of non-adherence to basic critical care and outcomes in high income countries
Total 1023 Pre intervention
N= 382
Post intervention
N= 641
Observed event Incidence rate
95%CI
Observation
Days
n
Observed
event n
Patients
n
Incidence rate
95%CI
Observatio
n Days
Observed
event n
Patients
n aIRR p
Mechanical ventilation
per 1000
ventilator days
per 1000
ventilator days
No DVT prophylaxis 61.9 (46.7-82.2) 775 48 241 79.8
(66.1-96.3) 1366 109 402
1.17
(0.83-1.66) 0.36
No daily oral care 65.8 (50.0-86.6) 775 51 241 49.0(38.6-62.3) 1366 67 402 0.95
(0.65-1.39) 0.79
No HOB at 30 degrees 18.1 (10.7-30.5) 775 14 241 5.1(2.4-10.7) 1366 7 402 0.27
(0.11-0.67) 0.004
No peptic ulcer
prophylaxis 18.1 (10.7-30.5) 775 14 241 12.4 (7.7-20.0) 1366 17 402
0.64
(0.31-1.31) 0.23
No documented
assessment of SBT
473.5
(427.5-524.6) 775 367 241
267.2
(241.1-296.1) 1366 365 402
0.57
(0.49-0.66) <0.001
No documented family
conference/ discussion
268.4
(234.3-307.5) 775 208 241
414.3
(381.6-449.93 1366 566 402
1.56
(1.33-1.84) <0.001
Central venous catheters
per 1000 CVC
days
per 1000 CVC
days
No documented
assessment for central
line removal
591.0
(543.7-642.4) 934 552 258
395.3
(365.5-427.6) 1581 625 426
0.70
(0.63-0.79) <0.001

21
Urinary catheter
per 1000
urinary catheter
days
per 1000
urinary
catheter days
No documented
assessment for urinary
catheter removal
697.3
(650.3-747.8) 1130 788 315
358.5
(332.4-386.7) 1866 669 515
0.56
(0.50-0.62) <0.001
Antimicrobials and sedation
per 1000 days of
use
per 1000 days
of use
No documented
assessment to continue
or discontinue current
antimicrobials
276.5
(24.3-309.1) 1114 308 324
154.5
(137.9-173.2) 1909 295 548
0.67
(0.57-0.78) <0.001
No documented
assessment to continue
or discontinue current
sedation meds
337.1
(299.0-380.2) 789 266 257
172.8
(152.0-196.5) 1348 233 439
0.56
(0.47-0.67) <0.001
Transfusion
per 1000 ICU
days
per 1000 ICU
days
RBC 94.5
(79.899-111.8) 1439 136 382 84.5(73.5-97.2) 2330 197 641
0.91
(0.73-1.14) 0.41
PLT 32.7
(24.5-43.5) 1439 47 382
28.3
(22.2-36.1) 2330 66 641
0.81
(0.55-1.20) 0.3
FFP 27.8
(20.4-37.9) 1439 40 382 24.5(18.9-31.7) 2330 57 641
0.94
(0.62-1.42) 0.76
Infections
% (95%CI) % (95%CI) aOR p
CBRSI 3.1 (1.6-6.1) 8 258 2.3(1.3-4.3) 10 426 0.92
(0.33-2.55) 0.87
Urinary catheter
infection 4.8 (2.9-7.7) 15 315 4.1(2.7-6.2) 21 515
0.96
(0.49-1.95) 0.97

22
VAP 6.2 (3.8-10.1) 15 241 9.0 (6.5-12.2) 36 402 1.40
(0.73-2.67) 0.30
Mortality
Mortality rates
ICU 20.6
(16.7-25.0) 74 360 23.5 (20.3-27.1) 141 600
1.18
(0.83-1.68) 0.35
Hospital 27.9 (23.5-32.8) 99 355 29.6 (26.1-33.4) 177 598 1.03
(0.75-1.42) 0.84
DAY 28 28.1(23.6-33.1) 96 342 30.9(27.3-34.8) 177 572
1.20
(0.87-1.64) 0.27
LOS
Geometric mean
(SD)
Geometric mean
(SD) aRoGM p
ICU LOS 4.6 (2.6) 357 4.6 (2.8) 599
0.93(0.81-
1.06) 0.28
Hospital LOS 11.9 (3.2) 353 11.3 (3.2) 593
0.82
(0.71-0.94) 0.01
Footnote: HIC-High income countries, A-adjusted for center effect , OR-odds ratio, IRR-incident rate ratio, DVT-deep vein thrombosis, HOB-head of bed,
SBT-spontaneous breathing trial, VAP-ventilator associated pneumonia, CRBSI–catheter related bloodstream infection, RBC-red blood cell, Plt-platelets,
FFP-fresh frozen plasma, LOS-Length of stay, RoGM-ratio of geometric means

23
e Figure 8. Survival analysis according to income strata
a) Survival analysis: Shown is the unadjusted Kaplan-Meier estimate of survival. P value for the
Pre/Post Change is based on a Cox mixed model (treating centers as a random effects) that
adjusts for imbalances in the following baseline risk factors: Invasive mechanical ventilation,
Comorbidities, Life Support limitations, Home Admission Source and the center’s income
classification (HIC vs. LMIC). Hazard Ratio of the CERTAIN effect is also adjusted for the
above risk factors.

24
b) LMIC Survival: Shown is the unadjusted Kaplan-Meier estimate of survival. P value for the
Pre/Post Change is based on a Cox mixed model (centers random effects) that adjusts for
imbalances in the following baseline risk factors: Invasive mechanical ventilation,
Comorbidities, Life Support limitations, and Home Admission source. Hazard Ratio of the
CERTAIN effect is also adjusted for the above risk factors.

25
c) Survival for HIC: Shown is the raw Kaplan-Meier estimate of survival. P value for the
Pre/Post Change is based on a Cox mixed model (centers random effects) that adjusts for
imbalances in the baseline following risk factors: Invasive mechanical ventilation,
Comorbidities, Life Support limitations, and Home Admission source. Hazard Ratio of the
CERTAIN effect is also adjusted for the above risk factors.

26
ANALYSI
S
ORIGINAL PLAN
(eIRB ID: 12-007998
9/16/2013)
PROTOCOL UPDATE
(https://clinicaltrials.gov/ct2/show/
record/NCT01973829)
IN THE PAPER POST HOC*
Settings LMIC Variable resources including HIC Variable resources including HIC
Study type Stepped wedge cluster
RCT Before-after study Before-after study
Primary
outcomes
Increased compliance to
90% of processes of care
(ICU prophylaxis,
ventilator bundles,
sedation reduction and
other recommended
processes of care)
Adherence to best critical
care practices
Appropriate shock
resuscitation**
Appropriate sepsis
treatment**
Appropriate mechanical
ventilation
Appropriate peptic ulcer,
deep vein thrombosis and
infectious disease
prophylaxis
ICU and hospital lengths of
stay
Non-adherence to 10 critical
care practices
deep vein thrombosis (DVT)
and peptic ulcer prophylaxis
daily oral care
head of bed (HOB) elevation
to at least 30 degrees above
horizontal
Spontaneous breathing trial
(SBT)
Family conference discussion
assessment of central line (CL)
and urinary catheter removal
and assessment to continue or
discontinue current
antimicrobials and sedation
According to country
income group (HIC
vs. LMIC)
e Table 7. Modifications from the original analysis plan

27
ICU and hospital
lengths of stay
According to country
income group with
adjustment for
baseline imbalances
Secondary
outcomes
Rate of ICU acquired
complications, discharge
home, hospital
mortality, ICU and
hospital readmission.
Mortality for 4 weeks
ICU, hospital and 28-day
mortality
Infection rates
According to country
income group with
adjustment for
baseline imbalances
According to country
income group
Subgroup
analyses Not specified
Not specified
LMIC vs. HIC settings
Statistical
approach
Generalized linear mixed
models will be used to
model changes in event
rates using
Poisson and negative
binomial outcome
distributions.
Not described
Primary outcomes:
Non-adherence to basic care:
procedures: A generalized linear model
with a log link function (Poisson
regression) was used to calculate the
adjusted incident rate ratio.

28
LOS: Center was modeled as fixed
effect, accounting for the clustering of
patients within centers.
A linear mixed model was used to
calculate the adjusted ratio of the
geometric means.Center was treated
as a random variable in order to
account for the clustering of patients
within centers
Secondary outcome: A generalized
linear mixed model with a logit link
function was used to calculate the
adjusted odds ratio. Center was
treated as a random effect and
CERTAIN intervention and patient
characteristics as fixed effects
*Not considered neither in the original plan nor in the updated SAP
** Not included due to feasibility limitations including the need for real time data collection for shock resuscitation and assessment of adequacy
of antibiotics.
LMIC-low and middle income countries, HIC-High income countries, LOS-Length of stay

29
eTable 8. The incidence rates of non-adherence to daily care processes before and after CERTAIN
implementation
Total 4256
Pre intervention
N= 1447
Post intervention
N= 2809
Mechanical ventilation
Observed event
Incidence
rate
95% CI
Observati
on
Days
n
Observed
events
n
Patien
ts
n
Incidence
rate
95%CI
Observati
on days
n
Observe
d events
n
Patient
s
n aIRR p
per 1000
ventilator
days
per 1000
ventilator
days
No DVT prophylaxis
268
(251-286) 3453 926 966
200
(189-211) 6616 1322 1874
0.74
(0.68-
0.81) <.001
No daily oral care
45
(38-52) 3453 155 966
42
(38-48) 6616 281 1874
0.94
(0.77-
1.16) 0.60
No HOB elevation at
30 degrees
39
(33-46) 3453 135 966
37
(32-42) 6616 244 1874
1.00
(0.81-
1.23) 0.98
No peptic ulcer
prophylaxis
55
(48-64) 3453 193 966
28
(24-32) 6616 185 1874
0.46
(0.38-
0.57) <.001
No documented
assessment of SBT
563
(539-589) 3453 1946 966
450
(434-467) 6616 2980 1874
0.81
(0.76-
0.86) <.001

30
No documented family
conference/ discussion
416
(395-438) 3453 1437 966
361
(347-376) 6616 2391 1874
0.86
(0.81-
0.92) <.001
Central venous catheters
per 1000
CVC
days per 1000
CVC days 1896
No documented
assessment for central
venous catheter
removal
647
(622-673) 3922 2538 990
566
(549-583) 7308 4136 1896
0.85
(0.81-
0.90) <.001
Urinary catheters
per 1000
urinary
catheter
days
per 1000
urinary
catheter
days
No Documented
assessment for urinary
catheter removal
674
(653-697) 5268 3553 1322
564
(549-578) 10228 5766 2609
0.84
(0.80-
0.88) <.001
Antimicrobials and sedation
per 1000
days of use per 1000
days of use
No documented
assessment to continue
or discontinue current
antimicrobials
340
(324-356) 5168 1758 1310
219 (209-
228) 9497 2079 2498
0.66
(0.62-
0.71) <.001
No documented
assessment to continue
or discontinue current
sedation
359
(338-381) 3049 1092 941
212
(201-224) 5436 1251 1895
0.62
(0.57-
0.67) <.001
Transfusion

31
Footnote 2. A-adjusted for center effects, OR-odds ratio, IRR-incident rate ratio, DVT-deep vein thrombosis, HOB-head of bed, SBT-
spontaneous breathing trial, VAP-ventilator associated pneumonia, CRBSI–catheter related bloodstream infection, RBC-red blood
cell, Plt-platelets, FFP-fresh frozen plasma,
per 1000
ICU days per 1000
ICU days
RBC
110
(102-119) 6089 647 1447
105
(99-111) 11330 1187 2809
0.92
(0.84-
1.02) 0.13
PLT
23.32
(19.78-
27.49) 6089 142 1447
23.
(21-26) 11330 264 2809
0.89
(0.72-
1.10) 0.3
FFP
71.60
(65.18-
78.65) 6089 436 1447
52
(48-57) 11330 594 2809
0.75
(0.66-
0.85) <.001
Infections
%, (95%
CI) %, (95%
CI) aOR p
CRBSI 4.4
(3.3-5.9) N/A 44 990 2.8
(2.1-3.6) N/A 53 1896
0.59
(0.38-
0.90) 0.018
Urinary catheter
infections 4.4
(3.0-5.6) N/A 58 1322 4.0
(3.3-4.8) N/A 105 2609
0.88
(0.62-
1.23) 0.46
VAP 18.7
(16.0-21.3) N/A 181 966 20.1
(18.3-21.9) N/A 376 1874
1.08
(0.80-
1.28) 0.88

32
Supplement: Data Set Development and Statistical Analysis
As this was a non-randomized study, we adjusted for patient severity of illness for the LOS,
mortality and survival time outcomes. The following patient severity factors had significantly
changed from pre to post CERTAIN implementation and were judged as likely to influence patient
outcome: 1) use of invasive mechanical ventilation, 2) ICU admission source, 3) life support
limitation at admission, and 4) comorbidity. Thus, these patient factors were included in the
statistical models. Each of the study outcomes was analyzed within LMIC and HIC ICUs as
defined by the World Bank.11
The statistical analysis for each outcome is outlined as follows:
Daily care Processes - Data set development: Each patient was observed during an intervention
(e.g., invasive mechanical ventilation) and the number of observation days was recorded. For
each observation day, non-adherence to daily care-processes (e.g. DVT prophylaxis) was recorded
as either Yes or No. Thus, each patient had an intervention time interval (exposure) during which
an event was noted. Poisson regression was used to model such data. Non-adherence (the ‘No’
outcome) was chosen as the endpoint to fit the assumptions of the Poisson probability distribution
which is used in the maximum likelihood estimation of the model’s parameters. The Poisson
distribution can be applied to systems with a large number of possible events, each of which is
rare. In our study, non-adherence was the rare event. The data analysis aggregated events and
exposures within each ICU using a property of the Poisson distribution where the sum of a Poisson
random variable is Poisson distributed.

33
Daily care Processes - Statistical Analysis: A generalized linear model (GLM) with a log link
function (Poisson regression) was used to calculate the adjusted incidence rate ratio as a measure
of the effect of CERTAIN. Specifically, the number of non-adherence events was the dependent
variable, center and the CERTAIN intervention were the independent variables, and exposure was
an offset. Center was modeled as fixed effect, accounting for the clustering of patients within
centers. The likelihood ratio test was used to determine the statistical significance of the incident
rate ratio (CERTAIN effect), using two models: 1) a full model with center and CERTAIN and 2)
a nested model with only center. The difference in log likelihood between the two models
indicated the significance of the incident rate ratio (CERTAIN effect) adjusted for the centers.
Blood products utilization - Data set development: The exposure variable was ICU observation
days and for each observation day, whether the patient received a blood product was recorded as
Yes/No. For these analyses, the Yes outcome was the event as Yes occurred less frequently.
Blood products utilization -Statistical Analysis: A generalized linear model (GLM) with a log link
function (Poisson regression) was used to calculate the adjusted incident rate ratio (CERTAIN
effect) using the above statistical methods.
Infections-Data set development: The unit of analysis was the individual patient. In case of
repeated episodes of VAP, CBRSI or urinary catheter infections, during the observation interval,
only one episode per patient was used. Thus, the statistical endpoint was that patient experienced
an infection.
Infections-Statistical Analysis: A generalized linear model (GLM) with logit link function
(binomial regression) was used to calculate the adjusted odds ratio (CERTAIN effect).

34
Specifically, the dependent variable was infection or non-infection (coded 1/0), and center and the
CERTAIN intervention were the independent variables. Center was modeled as fixed effect,
accounting for the clustering of patients within centers. The likelihood ratio test was used to
determine the statistical significance of the odds ratio (CERTAIN effect), using two models: 1) a
full model with center and CERTAIN and 2) a nested model with only center. Thus, the difference
in log likelihood between the two models indicated the significance of the odds ratio (due to
CERTAIN intervention) adjusted for the centers.
LOS - Data set development: The interval (in days) between the ICU admission date and the ICU
discharge date was the ICU LOS measurement and the interval (in days) between the hospital
admission date and the hospital discharge date was the hospital LOS measurement. The individual
patient’s LOS was the unit of analysis. The distributions of LOS was examined using histograms
and density plots. As LOS data was highly positively skewed, a log transformation of LOS was
calculated rendering a symmetrical log normal distribution. LOS was capped at two years.
LOS-Statistical Analysis: A linear mixed model (LMM) was used to calculate the adjusted ratio
of the geometric means (CERTAIN effect). Specifically, the log transformed LOS was the
dependent variable; the independent variables were the CERTAIN intervention and the
aforementioned patient severity factors. In these analyses, center was treated as a random variable
in order to account for the clustering of patients within centers. The model’s CERTAIN coefficient
is the log of the ratio of the geometric means. The values reported in the tables is the anti-log of
the coefficient, which is a ratio of geometric means. The F test comparing a nested and full model
was used to determine the statistical significance of the adjusted ratio of geometric means. The
lmer package in the R statistical library was utilized for these analyses.

35
Mortality-Data set development: The unit of analysis was the individual patient and the
statistical endpoints were ICU mortality, hospital mortality and 28 days mortality.
Mortality-Statistical Analysis: A generalized linear mixed model (GLMM) with a logit link
function (logistic regression) was used to calculate the adjusted odds ratio (CERTAIN effect).
Specifically, the dependent variable was 0/1 coded mortality and the independent variables were
the cited patient severity factors, and the CERTAIN intervention. Center was treated as a random
effect and CERTAIN intervention and patient characteristics as fixed effects. The likelihood ratio
test was used to determine the statistical significance of the adjusted odds ratio, using the nested
and full models. The glmer package in the R statistical library was utilized for these analyses.
The analysis was conducted separately for ICU mortality, hospital mortality, and 28-day mortality.
Survival time-Data set development: The unit of analysis was the individual patient and the
statistical endpoint the patient’s survival time. Survival time was calculated as the interval
between ICU admission date and hospital discharge date. Patient who were discharged alive were
censored (coded 0) at their discharge date. Patients who died were coded 1. The statistical endpoint
was survival time, capped at 2 years, with a censoring indication.
Survival time-Statistical Analysis: The proportion who survived was estimate using the Kaplan-
Meier method and summarized using unadjusted Kaplan-Meier survival curves. The Cox
proportional hazards mixed effect model was used to calculate the adjusted hazard ratio
(CERTAIN effect). Specifically, the dependent variable was the censored survival time and the
independent variables were the cited patient severity factors, and the CERTAIN intervention. The
adjusted hazard ratio was calculated by treating center as a random effect and the CERTAIN
intervention and patient severity factors as fixed effects. The likelihood ratio test was used to

36
determine the statistical significance of the adjusted odds ratio, using the nested and full models.
The coxme package in the R statistical library was utilized for these analyses.
LMIC/HIC Centers: Each of the above outcomes were studied in 1) high-income and 2) low-
middle income ICUs and 3) all ICUs. For the statistical models including all ICUs, ICU income
level (HIC/LMIC) was added as a stratification factor. All data analyses were conducted using
the R statistical software, version 3.4 (R reference). All tests were 2-sided with p < 0.05 denoting
statistical significance.