supplementary figure 1 abu jawdeh et al. quantitation of cnhe1 binding by densitometry, as...
TRANSCRIPT

Rel
ativ
e bi
ndin
g in
tens
ity
0.0
0.5
1.0
1.5
2.0
PI(3,4
)P2
PI(3,5
)P2
PI(4,5
)P2
PI(3,4
,5)P
3
PI(3)P
PI(4)P
PI(5)P PA PS
LPA
LPCPE PCPI
S-1P
Supplementary Figure 1Abu Jawdeh et al.
Quantitation of cNHE1 binding by densitometry, as determined by anti-6xHis antibody detection. Data are normalized to PI(4,5)P2 (defined as 1.0 in each experiment), and expressed as mean ± SEM.
Supplementary Figure 2Abu Jawdeh et al.
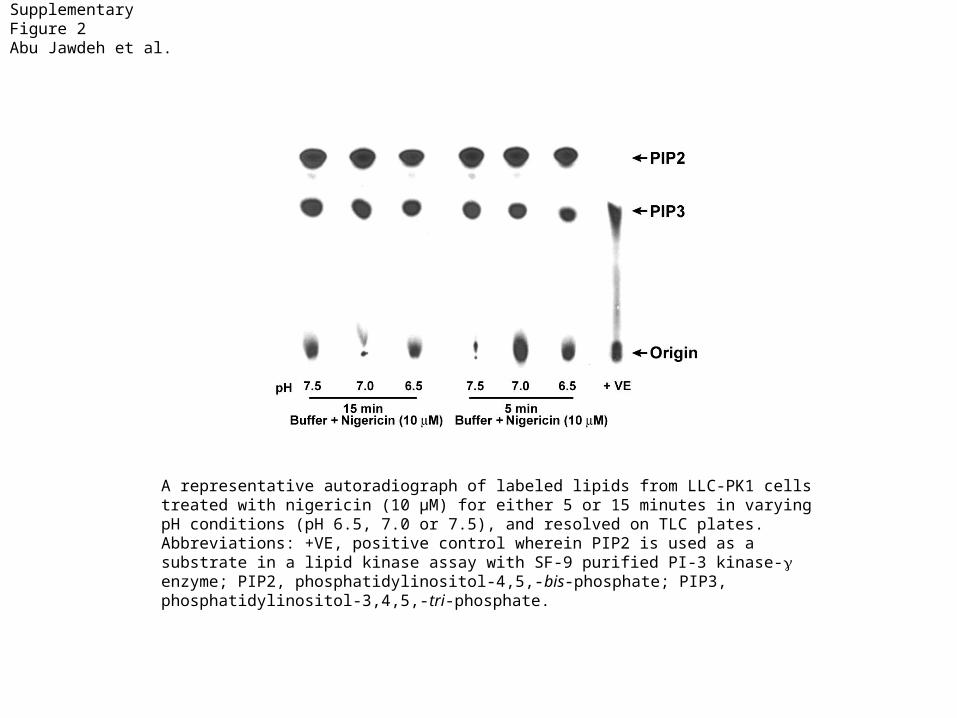
A representative autoradiograph of labeled lipids from LLC-PK1 cells treated with nigericin (10 µM) for either 5 or 15 minutes in varying pH conditions (pH 6.5, 7.0 or 7.5), and resolved on TLC plates. Abbreviations: +VE, positive control wherein PIP2 is used as a substrate in a lipid kinase assay with SF-9 purified PI-3 kinase-g enzyme; PIP2, phosphatidylinositol-4,5,-bis-phosphate; PIP3, phosphatidylinositol-3,4,5,-tri-phosphate.

Supplementary Figure 2, continuedAbu Jawdeh et al.
Ra
dio
act
ivity
co
un
ts
0
5000
10000
15000
20000
25000
PI(4,5)P2
pH 7.06.5 7.56.57.57.0
Nigericinincubation 5 min 15 min
Ra
dio
act
ivity
co
un
ts
0
1000
2000
3000
4000
5000
6000
7000
PI(3,4,5)P3
pH 7.06.5 7.56.57.57.0
Nigericinincubation 5 min 15 min
0.00
0.05
0.10
0.15
0.20
0.25
0.30
PI(
3,4,
5)P
3:P
I(4,
5)P
2 ra
tio
pH 7.06.5 7.56.57.57.0
Nigericinincubation
5 min 15 min
De
nsi
tom
etr
y u
nits
0
20
40
60
80
PI(4,5)P2
pH 7.06.5 7.56.57.57.0
Nigericinincubation 5 min 15 min
De
nsi
tom
etr
y u
nits
0
10
20
30
40
PI(3,4,5)P3
pH 7.06.5 7.56.57.57.0
Nigericinincubation 5 min 15 min
0.0
0.1
0.2
0.3
0.4
0.5
0.6
0.7
PI(
3,4,
5)P
3:P
I(4,
5)P
2 ra
tio
pH 7.06.5 7.56.57.57.0
Nigericinincubation 5 min 15 min
LLC-PK1 cells were treated with Nigericin (10 µM) for either 5 or 15 minutes in varying pH conditions (pH 6.5, 7.0 or 7.5), and resolved on TLC plates. Phosphoinositides from all experiments were quantitated by liquid scintillation counting (left panels) and densitometry (right panels). Bottom panels represent ratios of PI(3,4,5)P3:PI(4,5)P2 counts. Data are expressed as mean ± SEM.

Supplementary Figure 3Abu Jawdeh et al. X-Y Plane X-Z Plane
PI(4,5)P2
A
PI(3,4,5)P3
B
PI(4,5)P2
PI(3,4,5)P3
D
E
G
PI(4,5)P2
H
NHE1
NHE1
C F
NHE1
I
Merge
LLC-PK1 cells were cultured on permeable supports, transiently transfected with PLCd-PH (A,D) or Akt-PH (B,E) vectors, and then incubated with chemically modified, hydrolysis-resistant C8-PI(4,5)P2 (A,D) or C8-PI(3,4,5)P3 (B,E) in the upper and lower chambers, respectively. NHE1 was detected with anti-NHE1, followed by Texas red-conjugated anti-rabbit antibodies (C,F). In some panels (C,D), nuclei were counterstained with DAPI (Blue).
Time (sec)
0 200 400 600 800 1000
Cyt
oso
lic p
H
6.0
6.2
6.4
6.6
6.8
7.0
7.2
7.4
Supplementary Figure 4Abu Jawdeh et al.
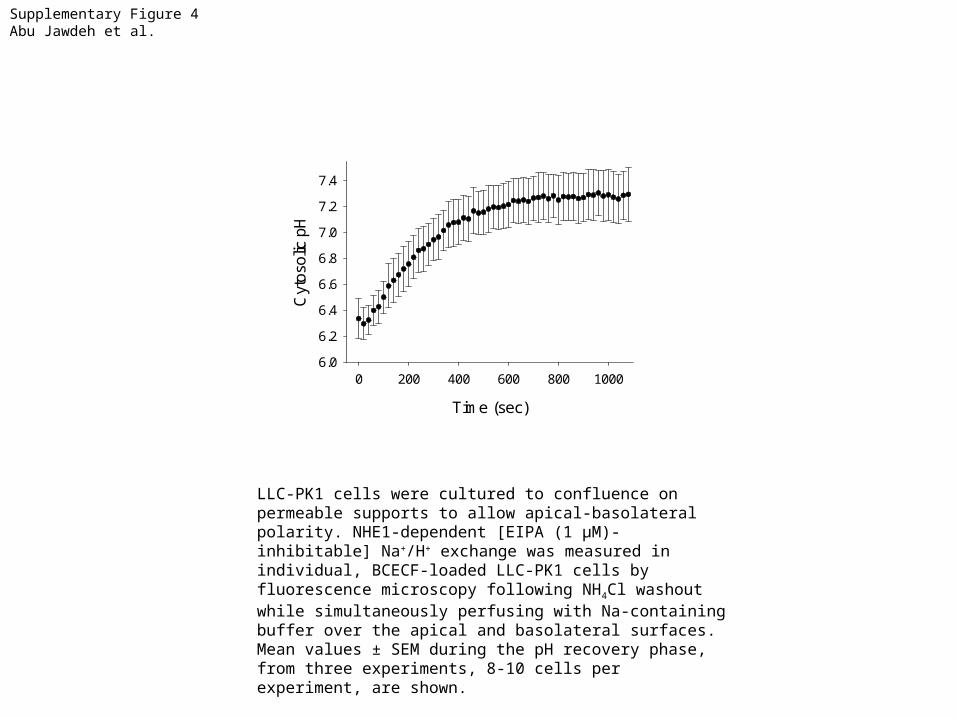
LLC-PK1 cells were cultured to confluence on permeable supports to allow apical-basolateral polarity. NHE1-dependent [EIPA (1 µM)-inhibitable] Na+/H+ exchange was measured in individual, BCECF-loaded LLC-PK1 cells by fluorescence microscopy following NH4Cl washout while simultaneously perfusing with Na-containing buffer over the apical and basolateral surfaces. Mean values ± SEM during the pH recovery phase, from three experiments, 8-10 cells per experiment, are shown.
Supplementary Figure 5Abu Jawdeh et al.
- GAPDH
- Casp-3
Cisplatin
PI(3,4,5)P3
PI(4,5)P2
+ ++
+
+
- GAPDH
- Casp-3
Cisplatin
PI(3,4,5)P3
PI(4,5)P2
+ ++
+
+
B D
% a
popt
otic
cel
ls
0
5
10
15
20
25
30
PI(3,4,5)P3
PI(4,5)P2
Cisplatin +
+
+++
++
% a
popt
otic
cel
ls
0
5
10
15
20
25
30
PI(3,4,5)P3
PI(4,5)P2
Cisplatin +
+
+++
++
A C
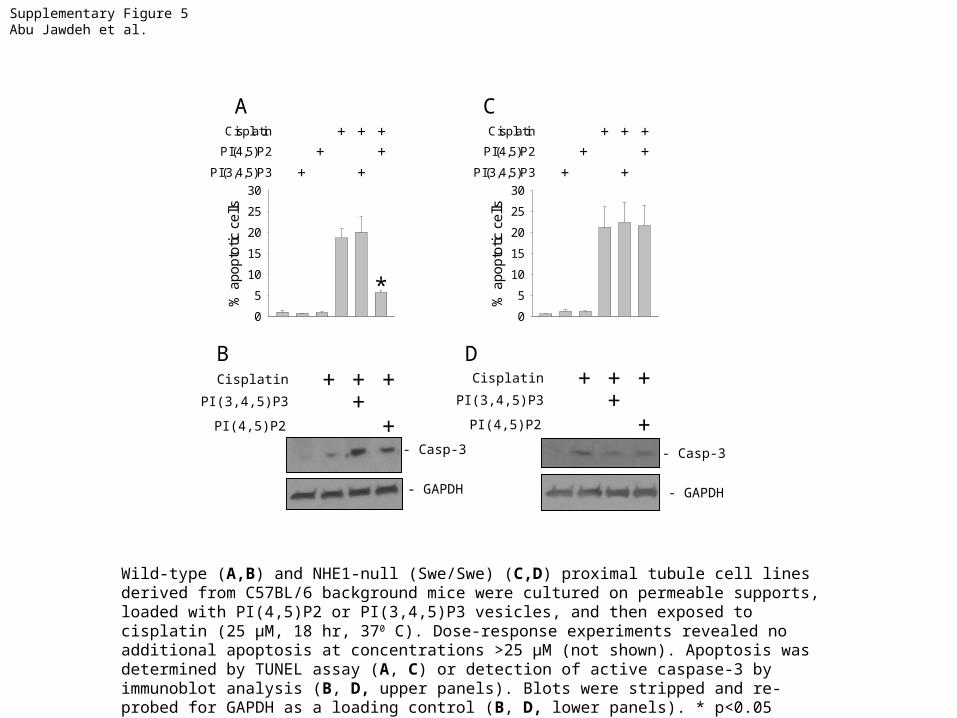
Wild-type (A,B) and NHE1-null (Swe/Swe) (C,D) proximal tubule cell lines derived from C57BL/6 background mice were cultured on permeable supports, loaded with PI(4,5)P2 or PI(3,4,5)P3 vesicles, and then exposed to cisplatin (25 µM, 18 hr, 370 C). Dose-response experiments revealed no additional apoptosis at concentrations >25 µM (not shown). Apoptosis was determined by TUNEL assay (A, C) or detection of active caspase-3 by immunoblot analysis (B, D, upper panels). Blots were stripped and re-probed for GAPDH as a loading control (B, D, lower panels). * p<0.05 compared to cisplatin only by ANOVA.
*