supplementary figure 1. hr-tem images of unzipped … · supplementary figure 1. hr-tem images of...
TRANSCRIPT
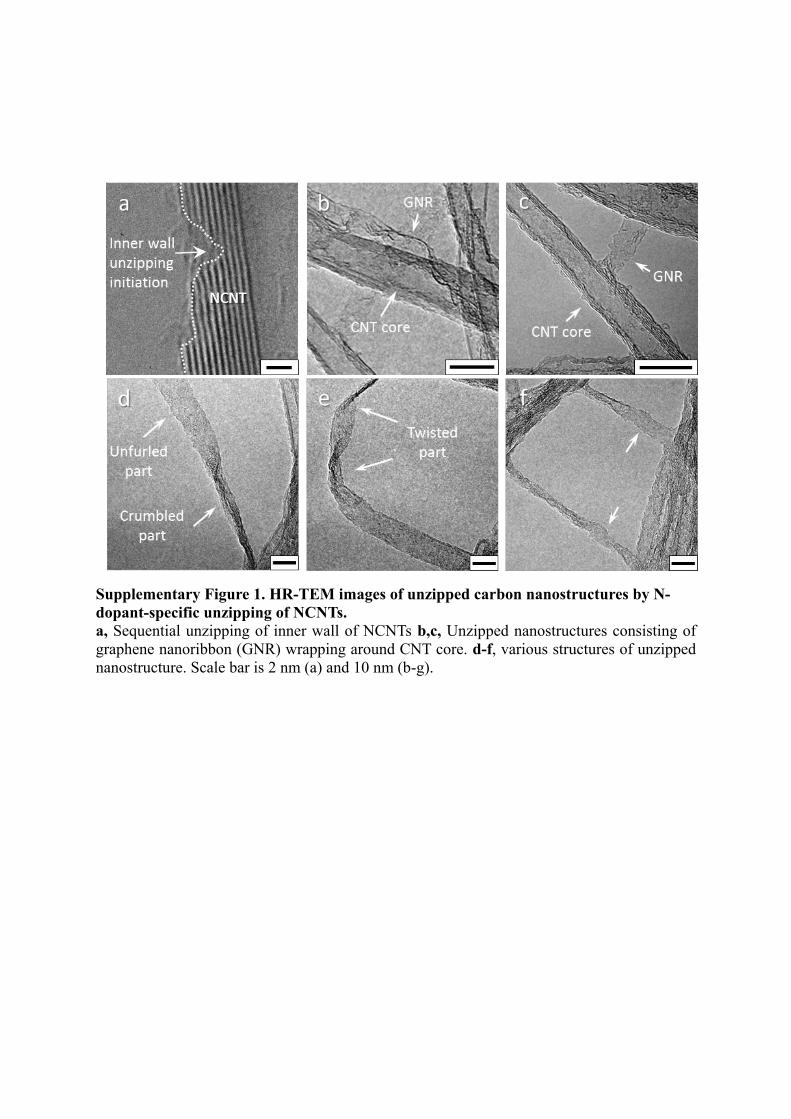
Supplementary Figure 1. HR-TEM images of unzipped carbon nanostructures by N-
dopant-specific unzipping of NCNTs.
a, Sequential unzipping of inner wall of NCNTs b,c, Unzipped nanostructures consisting of
graphene nanoribbon (GNR) wrapping around CNT core. d-f, various structures of unzipped
nanostructure. Scale bar is 2 nm (a) and 10 nm (b-g).

Supplementary Figure 2. Influence of CNT chirality on the edge-configuration of
unzipped graphene structures.
In principle, the CNT unzipping mechanism is driven by the competition of tubular strain
(blue arrow) and chemically favorable reaction direction1 (red arrow). In the unzipping of an
armchair nanotubes (chiral vector is (n, n), case 1), these two factors are completely
constructive such that unzipping principally propagates along the tube axial direction,
developing zigzag edge-configuration. By contrast, in the case of a zigzag or chiral nanotube
(chiral vector (n, 0) or (n, m), case 2), there is a competition between these two factors and
the unzipping propagate in instantaneous balance of those, generating zigzag- and armchair-
mixed edge configuration. In our work, the chirality of NCNTs is not controlled. Therefore,
despite of the proposed selective zigzag-edge-developing unzipping mechanism by reactive
oxygen species, zigzag, armchair, and chiral edge configurations coexist in the real unzipped
structures, as shown in Figure 1d. It is rationally explained with the presence of the induced
mechanical stretching from tubular structure and the chirality of CNTs, which can
significantly influence the resulting edge shape, as estimated by R. P. B. dos Santos et al.2.
Nonetheless, zigzag edge configuration is still predominant in Figure 1d, as the main driving
factor for unzipping process is the chemical C=C bond cleavage, as rationally discussed in
the reaction mechanism section (Figure 2).

Supplementary Figure 3. AFM images of unzipped nanostructures produced from N-
dopant-specific unzipping process.
The resultant nanostructures show various layer thickness depending on the original NCNT
wall number. Scale bar is 300 nm.

Supplementary Figure 4. The CNT diameter distribution before and after unzipping.
The diameter of CNTs and the width of fully unzipped parts were measured to investigate the
statistics chart (up). TEM images show fully unzipped part in the unzipped nanostructure
(bottom). Scale bar is 10 nm.

Supplementary Figure 5. SEM images of vertical unzipped nanostructure forest and the
change in the length of CNTs after unzipping process.
The influence of unzipping time on the length of the unzipped nanostructures was
investigated by SEM measurement. SEM images show vertically aligned NCNTs and the
resulting unzipped nanostructure for various unzipping time. It shows that the unzipping
process doesn’t cause noticeable change in the length of the unzipped structures. This is
attributed to the longitudinal unzipping of carbon nanotubes. Scale bar is 10 μm.
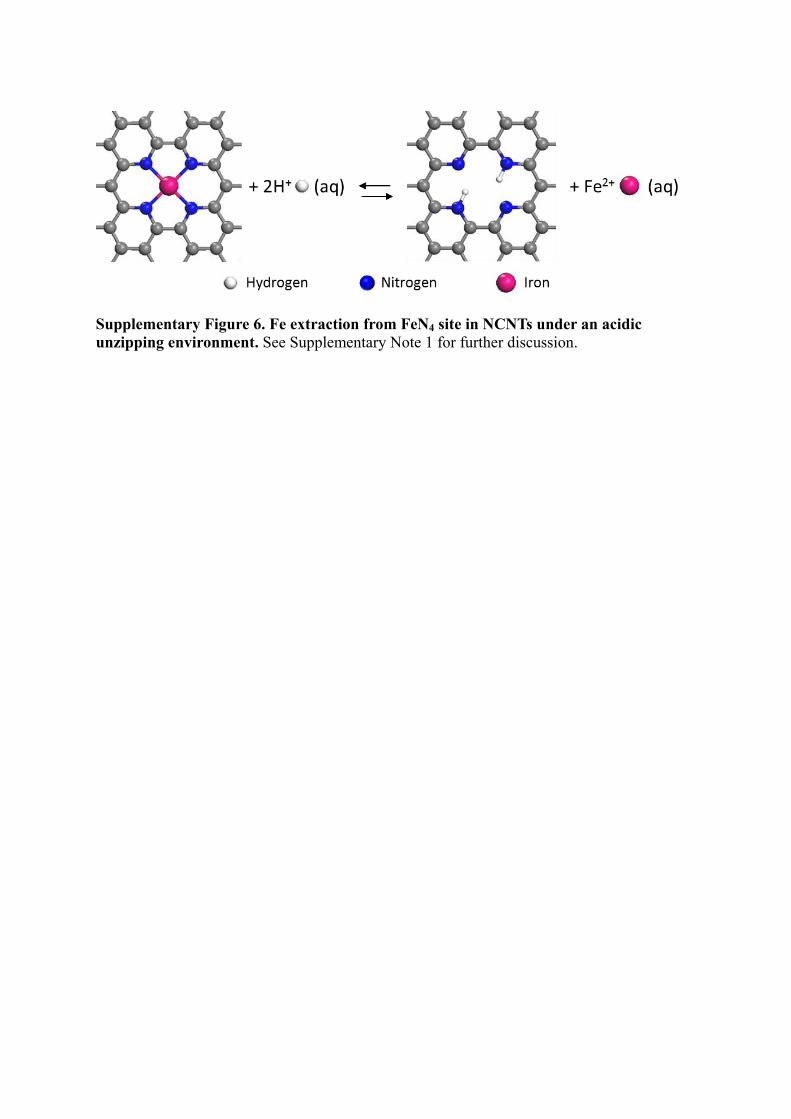
Supplementary Figure 6. Fe extraction from FeN4 site in NCNTs under an acidic
unzipping environment. See Supplementary Note 1 for further discussion.

Supplementary Figure 7. Acid-catalyzed imine hydrolysis in unzipping process
Temporal analysis of N1s XPS spectra clearly shows that prydinic N (Np) is strongly involved
in the unzipping process. While the peak intensity for quaternary N (NQ) is maintained, the
peak intensity for Np drastically decreases from the early stage of unzipping. In our unzipping
condition, acid-catalyzed imine hydrolysis reaction, which is the crucial unzipping initiation
step, can be accelerated. The proton (H+) generated by water electrolysis increases the
concentration of H+ around NCNTs, which plays a role as catalyst for acid-catalyzed imine
hydrolysis3. Additionally, the positive potential applied to the anode activates NCNTs to be
more reactive for 1, 2-addition of water by extracting electrons from NCNTs. Consequently,
the initiation reaction can be promoted. Detailed scheme for unzipping initiation step,
consisting of Fe extraction (i-ii) and acid-catalyzed imine hydrolysis (iii-vi), and the temporal
change of N1s XPS spectra during unzipping reaction.

Supplementary Figure 8. Generation and detection of high-energy oxygen species
High-energy oxygen species (singlet oxygen, ozone, etc.), which breaks C=C bonding of
graphitic wall of NCNTs, were detected by checking UV-VIS spectra of potassium
indigotrisulfonate. This chemical has been widely used for detection of reactive oxygen
species, such as ozone. Potassium indigotrisulfonate solution of certain molar concentration
was dropped into 1 M H2SO4 and unzipping process was carried out at 0.8 V (vs. MMS). As
unzipping process proceeded, the major peak of Potassium indigotrisulfonate at 600 nm
gradually deceased. This confirms the existence of high-energy oxygen species generated
from water-electrolysis under unzipping condition.

Supplementary Figure 9. Proposed propagation reaction pathway
Supplementary Fig. 8 shows the relative energy diagram along the reaction pathway, and
more detailed configurations for each phase. The notations of R, TS, P, and Int indicate
reactant, transition state, product, and intermediate, respectively. The first step is the
adsorption of O3 with the adsorption energy of 0.75 eV. The adsorbed O3 forms pentagon
with two carbons at the pore along the tube axis (R1), and subsequent C-C bond breaking and
the dissociation of O3 to O2 and O occurs with a very small energy (0.07 eV, TS2). The
resultant O2 is dissociated into 2O, the one of which transfers to next C=C bond to form
epoxide ring shown in P1. Subsequent unzipping reaction may proceed with O2. After O2
adsorption at one side of the epoxide ring (R2), the O2 is decomposed by a similar reaction
process with TS2 along with the formation of epoxide ring (Int), and finally yield 5O
structure (P2). By repeating the C=C cleavage by O2, fully unzipped configuration can be
generated. Interestingly, meta-stable singlet O2 (black line) is considered to be a reasonable
unzipping propagation species comparing to triplet O2 (blue line) with relatively higher
energy barrier (Eads, triplet=0.016eV, Eads, singlet=0.088eV, Ea, triplet=1.21eV, Ea, singlet=0.28eV).

Supplementary Figure 10. ATR–IR spectroscopy of unzipped nanostructures and
NCNTs.
Attenuated-total reflection infrared (ATR–IR) spectroscopy was carried out for the unzipped
nanostructures, which are produced by 8-hours-unzipping at 0.8 V in 1M H2SO4, to
characterize the formation of surface functional groups. C=O stretch (1,707 cm-1
) and the
negligible appearance of COO-H / O-H stretch (~3,600 ~ 2,800 cm-1
) were detected. This
result confirms that our unzipping method principally develops C=O bond at unzipped edges,
which is consistent with our proposal for unzipping reaction mechanism.
3,500 3,000 2,500 2,000 1,500
Absorb
ance (
a.
u.)
Wavenumber (cm-1)
Unzipped structures
NCNTs
C=O StretchingCOO-H / O-H Stretching

Supplementary Figure 11. I-V measurements with unzipping time.
a, Schematic for experimental set up. b, c I-V curves and calculated resistances with
unzipping time. To investigate the decrease of electrical conductivity of NCNTs during
unzipping process, we monitored the change of resistance using conductive AFM. As-grown
NCNT forests were transferred onto platinum foil. Unzipping was conducted under optimized
condition (in 1M H2SO4, at 0.8 V vs. MMS, for 8 hours). After predetermined periods of
unzipping, small pieces of unzipped sample were collected while other part undergoes further
unzipping. The collected sample was thoroughly washed with D.I water. After solvent
exchange with ethanol, critical point drying process was employed to obtain vertically
aligned graphene nanostructures for resistance measurement. As shown in Supplementary Fig.
11b, the resistance (the slope of I-V curve) abruptly increases between 8 and 12 hours of
unzipping period. Supplementary Fig. 11c clearly shows the increase of resistance of NCNTs
during unzipping.

Supplementary Figure 12. TEM images of unzipped nanostructures produced from
NCNTs with different N-doping levels.
The density of Np site in NCNTs is easily manipulated by adjusting NH3 partial pressure and
plasma power during NCNT growth by PECVD. To investigate the correlation between the
density of Np-sites and unzipping reaction initiation, we synthesized NCNTs with various
nitrogen (N) doping contents (atomic ratio) of 0, 1.75, 2.65, 3.94 % and conducted unzipping
process in 1 M H2SO4 solution for 8 hours at 0.8 V (vs. MMS). As shown in TEM images,
unzipping level is clearly correlated with N-dopant content. Scale bar is 20 nm.

Supplementary Figure 13. TEM images of pristine undoped CNTs after electrochemical
unzipping at 0.8 V and 1.0 V.
Electrochemical unzipping process was carried out with pristine CNTs under same
experimental condition with NCNTs case (in 1M H2SO4, at 0.8 V vs. MMS, for 8 hours).
Unlike NCNTs, unzipping was not observed by TEM analysis. By contrast, at 1.0 V of
electrical potential, pristine CNTs was completely and randomly damaged and torn up.
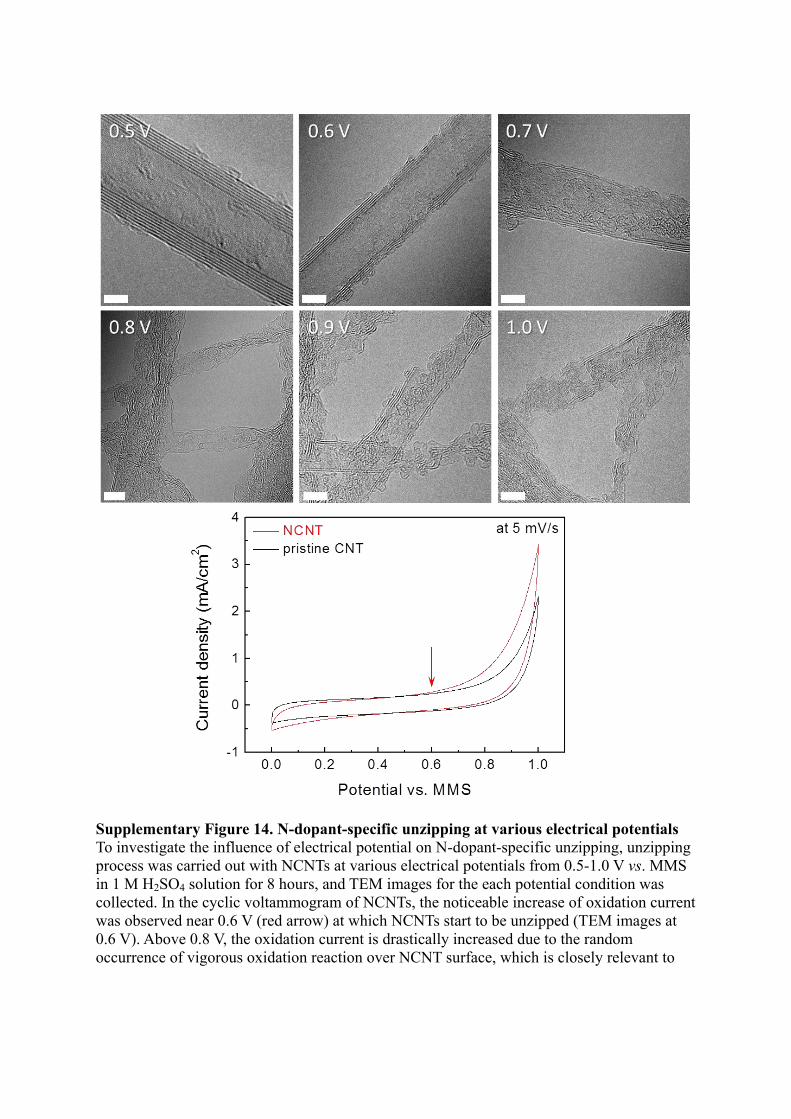
Supplementary Figure 14. N-dopant-specific unzipping at various electrical potentials
To investigate the influence of electrical potential on N-dopant-specific unzipping, unzipping
process was carried out with NCNTs at various electrical potentials from 0.5-1.0 V vs. MMS
in 1 M H2SO4 solution for 8 hours, and TEM images for the each potential condition was
collected. In the cyclic voltammogram of NCNTs, the noticeable increase of oxidation current
was observed near 0.6 V (red arrow) at which NCNTs start to be unzipped (TEM images at
0.6 V). Above 0.8 V, the oxidation current is drastically increased due to the random
occurrence of vigorous oxidation reaction over NCNT surface, which is closely relevant to

uncontrollable cutting of CNT walls (TEM images at 0.9 and 1.0 V). In the case of pristine
CNTs, the oxidation current starts to increase at a potential significantly higher than 0.6 V.

Supplementary Figure 15. Contact angle measurements before and after unzipping
a and b show contact angle of NCNT forest (83.5) and unzipped nanostructure forests (58),
respectively.

Supplementary Figure 16. Electrochemical performance of unzipped nanostructure-
based DLCs.
a shows evolution of the specific capacitance of the unzipped nanostructure-based DLCs as a
function of the scan rate. b shows excellent cycle stability of the 1-μm-unzipped
nanostructure-based DLC. The cell capacitance (in F cm-2
) was calculated from the
voltammetric discharge integrated from the cyclic voltammetry measurements over the entire
potential range using the following equation:
𝐶 =𝑄
∆𝐸×𝑆 (1)
where Q is the charge (in C or A.s); ∆𝐸 is the potential window (in V); S is the area (in cm-2
).
a b

Supplementary Figure 17. TEM images of unzipped structure produced from single
walled carbon nanotubes. Scale bar is 2 nm.

Ntotal NQ
(quaternary N)
Np
(pyridinic N) N-O bonding Fe
Ratio of
Np : Fe
1.83 % 1.27 % 0.47 % 0.09 % 0.12 % 3.92:1
3.40 % 1.82 % 1.29 % 0.29 % 0.32 % 4.03:1
4.10 % 2.18 % 1.66 % 0.26 % 0.48 % 3.81:1
Supplementary Table 1. Estimation of atomic ratio of Np to Fe in NCNTs at different doping
levels.

Supplementary Note 1. The reaction energetics of Fe extraction from FeN4 moiety in
NCNT
In our proposed unzipping mechanism, the FeN4 moiety in porphyrinic NCNTs4 is the
initiation site for unzipping process. In an acidic aqueous environment, two protons (2H+) can
replace the Fe2+
ion with forming the H2N4 moiety, represented by FeN4(s) + 2H+(aq) ↔
N4H2(s) + Fe2+
(aq) (see Supplementary Fig. 6). The reaction energetics depend on the proton
content or pH, represented by
ΔG = E(N4H2) + μexp
(Fe2+
) – E(FeN4) – 2μexp
(H+) = –1.86 eV – 2μ
exp(H
+), (2)
where E is DFT total energy, and μexp
is experimental chemical potential5. As μ
exp(H+) varies
from 0 (pH = 1) to -0.83 eV (pH = 14)6, the reaction energy will be more negative at pH = 1
than at pH = 14. Therefore, the Fe2+
extraction is highly probable in an acidic condition
(Figure 2c), which is consistent with the experimental Fe2p XPS measurement results.

Supplementary References
1 Kosynkin, D. V. et al. Longitudinal unzipping of carbon nanotubes to form graphene
nanoribbons. Nature 458, 872-876 (2009).
2 Dos Santos, R., Perim, E., Autreto, P., Brunetto, G. & Galvao, D. On the unzipping of
multiwalled carbon nanotubes. Nanotechnology 23, 465702 (2012).
3 Lee, D., Lee, W., Lee, W., Kim, S. & Kim, Y.-H. Theory, Synthesis, and Oxygen
Reduction Catalysis of Fe-Porphyrin-Like Carbon Nanotube. Phys. Rev. Lett. 106,
175502 (2011).
4 Kim, Y.-H., Kang, J. & Wei, S.-H. Origin of Enhanced Dihydrogen-Metal Interaction
in Carboxylate Bridged Cu2-Paddle-Wheel Frameworks. Phys. Rev. Lett. 105, 236105
(2010).
5 Kim, Y.-H., Kim, K. & Zhang, S. B. First-principles calculation of thermodynamic
stability of acids and bases under pH environment: A microscopic pH theory. J. Chem.
Phys. 136, 134112 (2012).
6 Krabbenborg, S. O., Nicosia, C., Chen, P. & Huskens, J. Reactivity mapping with
electrochemical gradients for monitoring reactivity at surfaces in space and time. Nat.
Commun. 4, 1667 (2013).