supplementary information design of yield-stress fluids: … · design of yield-stress fluids: a...
TRANSCRIPT

Supplementary Information
Design of yield-stress fluids:
A rheology-to-structure inverse problem
Arif Z. Nelson, Randy H. Ewoldt*
Department of Mechanical Science and Engineering,
University of Illinois at Urbana-Champaign, Urbana, IL 61801, USA
SI. Information flow for design versus analysis
This section provides more background discussion on perspectives of materials
design versus analysis. Both analysis and design require an understanding of the physics
(and often chemistry) of the candidate materials but result in different organizations of
information. Design evokes a rheology-to-structure organization (Figure S1A), in which a
particular property (e.g. yield stress) is a shared feature and all possible microstructures
are considered. Importantly, in this inverse problem, not all microstructures achieve the
relevant behavior; particulate gels, emulsions, electrorheological fluids, etc. are all
materials capable of displaying apparent yield stress behavior, but dilute emulsions,
entangled polymer solutions, and many other materials have no yield stress. In contrast,
the more common analysis approach evokes structure-to-rheology organization (Figure
S1B), e.g. the seminal textbook of Larson [1]. Here the shared feature is a structure from
which many possible rheological properties may arise.
Electronic Supplementary Material (ESI) for Soft Matter.This journal is © The Royal Society of Chemistry 2017

Figure S1. Flipping the structure-to-rheology paradigm. (A) Rheology-to-structure from the design perspective; multiple structure concepts considered, compared to (B) the more typical structure-to-rheology organization [1] from the analysis perspective; multiple properties [2–5], shown for a given structure of an emulsion. Materials shown are (a) particulate gel [6], (b) emulsion [7], (c) microgel suspension [8], (d) foam [9], (e) emulsion [10], and (f) electrorheological fluid [11]). For the inverse problem in (A), not all material concepts will have the desired property, e.g. (e) an emulsion with a low volume-fraction has no yield stress.
As we know, the analysis perspective is non-trivial for rheologically-complex materials;
the characterization of properties can be especially arduous due to their function-valued
nature, and so several complicated structural and observational dependencies are used
to describe a single material. For example, in Figure S1B, the single material class of
emulsions has zero-shear relative viscosity, ( is given by [2]) as a function of ,0r IK
droplet volume fraction, ; , storage modulus, and , loss modulus in Pascals as a G G
function of frequency, , in inverse seconds [3]; yield stress, , in dynes/cm2 as a Y
function of effective volume fraction, [4]; and first normal stress difference, , in eff 1N
Pascals, as a function of time in seconds [5].

SII. Supplemental Background
A. Design Process Theory
This section reviews basic (but foundational) concepts from design science and
describes how we will map them onto the field of rheology for the first time. There is a
multitude of models for design processes and while they can differ significantly, the
concepts we discuss here are generic enough to have analogs in most of them, including
the process outlined in Figure 1B [12,13].
A generic design process follows six phases [13]: planning, concept development,
system-level design, detail design, testing and refinement, and production ramp-up.
Often, the term “material design” is used for what we would call “material optimization”,
(a narrow portion of the full design process), e.g. efforts to tailor a particular (already
selected) microstructure to optimize properties. Some would call this premature
optimization as it skips past the “concept development” phase. The optimization may
either be by trial-and-error or with deterministic processing-structure and/or structure-
property models [14]. Examples of this approach can be found for more traditional
materials [15] and for rheologically-complex materials [16]. Others use the term “material
design” to only refer to the process of formulating new materials. This point-of-view also
completely skips the concept development phase, ignoring the design strategy of
selecting a pre-existing material to satisfy functional requirements and not acknowledging
the difficult process of ideating new and potentially ground-breaking material concepts to
satisfy one’s functional requirements.
This work makes contributions to the concept development phase. While the
downstream optimization and detail design phases are necessary, they are premature

without first considering multiple concepts. To set the stage for concept development, the
functional requirements and target specifications must first be described as part of the
planning phase. Then, a set of numerous possible concepts are obtained through
surveying existing materials, and through various brainstorming and ideation strategies.
This set of concepts is then subjected to selection, formulation, and testing [13]. In this
work, multiple material structure concepts are considered as ways to achieve a particular
rheological behavior, that of a yield-stress fluid.
A fundamental aspect of the design process is describing a desired performance, i.e.
the functional requirements, without specifying any particular solution [13,17,18]. This is
non-trivial, and is accomplished by abstracting a problem to what is essential and general
[19]. An over-specified requirement places creativity-stifling restrictions on concept
generation, leading to design fixation and less innovative technologies (or materials) [20].
Good functional requirements also cannot be too broad, in order to provide physical
insight into possible solutions and accurately frame the product’s purpose [19]. For the
design of a yield-stress fluid, a poor functional requirement might be, “a polymeric network
that flows under stress and reversibly solidifies at low stress”. This mock-functional
requirement is overly specific since it describes a particular material design choice:
polymers in a network.
Once functional requirements are established, generation of product concepts can
occur. Methodologies for the concept generation process generally build on approaches
from lateral thinking [21], categorized as either surveying existing concepts or creating
new concepts.

Figure S2. The value of concept generation (before detailed optimization) is well-established in machine/manufacturing design as shown in this example of affixing two surfaces. Similar approaches are needed for designing rheologically-complex soft materials. (Schematics adapted from [22]; material microstructure images pictured: (A) particulate gel from [6], (B) emulsion with high volume fraction dispersed phase from [7], (C) microgel suspension from [8], (D) foam from [9].)
B. A brief example on the importance of creativity and design:
The field of Mechanical Design (Machine Design) is well established by textbooks and
undergraduate curricula [23,24]. Here we describe an example from this area which, by
analogy, helps frame a design paradigm for materials in which a functional requirement
(planning phase) leads to creative brainstorming of multiple design strategies (concept
generation).

Consider the functional requirement to constrain one surface to another. How many
ways can you imagine achieving this? The most obvious approach might be to use a rivet
or screw, while a slightly more creative strategy would be changing the surface
topography to create a snapfit. Each strategy involves significant analysis and choices
must be made to determine the detailed design (e.g. what rivet geometry supports the
necessary stresses). However, even though there are seemingly endless varieties of
mechanically separable fasteners one could choose from or newly create, only
considering the approaches of “fasteners” is unnecessarily limiting.
We can increase the likelihood of obtaining the “best” solution (as determined by one’s
functional requirements) by identifying more possible design ideas [25], as shown in
Figure S2. Design strategies such as welding or an adhesive also satisfy the functional
requirement. In the case of an adhesive, a material with a desired functionality/rheological
property is introduced. This yields another layer to the methodologies for concept
generation, choosing from dozens of existing materials or synthesizing new ones. Yield-
stress fluids are, of course, one class of materials that can be used as an adhesive [26–
28]. This presented adhesion scenario is developed and used in Section IV. as one
demonstration of our proposed design paradigm.
Often the approaches to generate many concepts before down-selection are seen as
a waste of time by those inexperienced in effective design, but there is great value. Even
if the most obvious strategy or material turns out to be “best”, the generation of additional
ideas allows one to effectively justify their design as clearly superior to all other
considered concepts [21].

SIII. Materials and Methods
Table S1 describes the specific material compositions presented in this paper; sample
preparation steps are as follows. This section also details the experimental setup and
model fitting protocol.
Aqueous suspensions of polymer microgel particles were prepared from Carbopol 940
obtained from Acros Organics. Powdered material was mixed with steam distilled water
for thirty minutes before being neutralized to a pH of 7 using a sodium hydroxide solution,
resulting in the swollen microgel particles that are jammed at sufficiently high
concentrations [29].
Silicone oil-in-water emulsions were formulated with 1000 cSt (at 25 °C) silicone oil
obtained from Sigma-Aldrich and deionized water; sodium dodecyl sulfate from Fisher
Scientific was used as the emulsifier. The mixture was homogenized at 5000 rpm for 10
minutes using an IKA T-18 homogenizer with an S18N-19G dispersing element
attachment. Mineral oil-in-water emulsions were synthesized by the same procedure
using light mineral oil from Sigma Aldrich which has a viscosity between 14.2 and 17.0
cSt at 40 °C.
Bentonite from Sigma Aldrich was dispersed in steam distilled water using an
overhead stirrer at approximately 300 rpm until mixed, at which point the clay particles
form a percolated gel network [30]. The Laponite RD suspension, which also has particles
that can attractively interact, was synthesized by the same procedure as the Bentonite
suspensions with powder obtained from Conservation Support Systems. Bentonite and
Laponite suspensions were allowed to stand quiescently for one week before testing to
hydrate [31].

Xanthan gum from Xanthomonas Campestris, a polymer which is known to form
structure in solution through self-associative intermolecular attractions [32], was obtained
from Sigma-Aldrich. Solutions were formulated by slowly adding xanthan gum powder to
deionized water being mixed with an overhead stirrer at between 300 and 600 rpm.
Solutions were mixed for 5 minutes before being covered with tin foil and placed on a
hotplate at 80 °C to mix at 400 rpm for an additional 30 minutes.
Table S1. Material formulations organized by material and weight-percentage of additive.
Material wt% Solid Content
Carbopol 0.1, 0.15, 0.2, 0.25, 0.5
Bentonite 7, 8, 9, 10, 11, 12
Laponite 3, 4, 5
Xanthan Gum 2, 4, 5
wt% Oil wt% SDS
Silicone Oil-in-Water Emulsion
65
70
11.7
10
75 8.3
80 6.7Mineral Oil-in-
Water Emulsion65
75
11.7
8.3
Rheological characterization of steady flow properties was performed on rotational
rheometers (combined motor/transducer instruments, TA Instruments DHR-3 or AR-G2)
using a parallel-plate geometry with a diameter of 40 millimeters. Depending on the
sample, either a sandblasted plate or adhesive-backed silicon carbide sandpaper (600
grit or 60 grit) was used to prevent slip. Materials were tested at multiple gaps to verify

the absence of slip [33]. Parallel-plate corrections were used to identify the true shear
stress. Apparent stress, , was fit to a polynomial curve and corrected to the stress at A
the rim using,
, (S1)ln
34 lnA A
TrueTrue
dd
&
where is the apparent applied shear rate at the rim [34]. Unless otherwise specified, True&
all steady flow tests are performed from high-to-low shear rates, thus the yield stress is a
dynamic yield stress rather than a static yield stress [30]. All materials except Bentonite
and Laponite (see above), were tested within one week of formulation.
Shear flow measurements were fit to parameterized equations (Bingham and
Herschel-Bulkley, details in Section III.D). For some materials, especially at smaller gaps,
an increasing stress was observed as the shear rate was lowered, creating a non-
monotonic flow curve [35]. In the case of these materials, the fitting was only done with
the higher shear rate data lying between the highest and lowest values of corrected
stress. When fitting the Bingham model, the yield-stress parameter was constrained to
the lowest corrected stress value. All fitting was performed using OriginPro 9.0 software
with variance weighting where the residual sum of squares, RSS, is calculated by,
. (S2)2
,
1 ,
nData i Model
i Data i

Figure S3. Two representations of apparent yield-stress fluid behavior; steady flow shear stress, σ, for 0.15% Carbopol, measured with decreasing shear rate, . An apparent yield stress is indicated by a �̇�stress plateau over a wide range of shear rate, or alternatively (Inset) a
dramatic drop in viscosity, , occurring over a narrow range of 𝜂 =̅ 𝜎 �̇�
stress. The apparent yield-stress can be dependent on the approach one takes to measure it. For this paper, the parallel-plate corrected shear-stress values were fit to a Herschel-Bulkley model, Equation (2), to determine the yield-stress parameter, .Y
Figure S3 precisely depicts the single method we choose to characterize our
materials, and shows two equivalent representations of apparent yield-stress fluid
behavior based on steady shear flow characterization. A plateauing shear stress as shear
rate decreases (Figure S3) and a dramatic drop in viscosity across a narrow range of
shear stress (Figure S3 Inset), show the subjective nature of reporting a precise yield
stress value.

SIV. Experimental Results
Figure S4. Steady simple shear flow from high to low rate for six materials. (A) Carbopol of 0.1, 0.15, 0.2, 0.25, 0.5 %wt; (C) silicone oil-in-water emulsion of 65, 70, 75, 80 %wt of oil; (C) mineral oil-in-water emulsion of 65, 75 %wt of oil; (D) Bentonite of 7, 8, 9, 10, 11, 12 %wt; (E) Laponite of 3, 4, 5 %wt; (F) Xanthan gum of 2, 4, 5 %wt. In all cases a higher concentration increases the yield stress. The overlapping ranges of yield stresses indicate that secondary criteria, such as other properties or scaling laws, will determine down-selection for any particular design requirements. For discussion of static yield stress measurement for Xanthan gum, see Appendix Figure 16.
The experimental flow curves in Figure S4 (additional rheological data in
Supplemental Information) are evidence that there are numerous ways to achieve the
same yield stress, and therefore designing such materials is an inverse problem. Plateaus
in shear stress at low shear rates indicate apparent yield stress behavior. All materials
tested show an increasing yield stress with weight-percentage of additive. Although the
chemistry and microstructure vary, the ranges of yield stress overlap.
Additional material properties can vary considerably (e.g. high-rate viscosity and
critical shear rate). When engineering a yield-stress fluid, one must use such additional

(secondary) criteria to make rational design decisions. An example of varying secondary
properties was considered in Emady [36], who found that for approximately the same
yield stress value, materials of differing microstructure showed different particle
sedimentation behavior. There is an uncountable number of secondary properties that
may be relevant for yield-stress fluid applications. Here, we consider the most
fundamental secondary property: the flow behavior after yield. This may be sufficient for
some applications, as shown for robotic adhesive locomotion [37] and the understanding
of droplet impact of yield stress fluids [38,39]. The experimental results here form a
foundational paradigm for a database of yield-stress fluid properties. This database can
be expanded through the later addition of more secondary properties. Full rheological
results (uncorrected stresses, repeat experiments, multiple gaps) are provided in Section
SVI.
SV. Comparison of high-dimensional data
The reader may question how necessary low-dimensional descriptions are when
selecting between different candidate materials. It is fairly uncomplicated to compare the
full flow curves of a few materials and discern qualitative differences in yield stress and
even high-rate viscosity. Co-plotted in Figure S5 are the full flow curves of the over twenty
materials characterized in this work. Even for this limited database, it is not feasible to
efficiently select or rank particular materials based on some performance target.
Presented only with Figure S5, ranking materials based on critical shear-rate (as in
Section IV. A) would be an outrageously cumbersome task.

Figure S5. Comparing the high-dimensional flow data of a significant number of
materials is an ineffective method of rationally selecting materials. For this reason, low
dimensional descriptions are necessary for design. Data the same as in Figure S4.
SVI. Detailed Rheological Data
Figures S4 through S9 depict the repeated experiments for each material formulation
with uncorrected values of stress (see Section II for formulation and correction specifics).
For each formulation, a representative data set was corrected (see supplementary .csv
file) and validated for lack of slip with an experiment performed at a smaller gap (500 μm).
Comparisons of corrected data at the two tested gaps are shown in Figures S10 through
15. In the case of the emulsions, at a smaller gap, the measured stress can be

significantly higher; this can be attributed to a confinement effect, where the suspended
droplets are more tightly packed at the smaller gap. In no cases is the measured stress
at the small gap smaller than at the larger gap (outside of the experimental error from
repeat experiments). Therefore, we have no evidence of slip occurring for any of the
formulations shown.
Figure S6. Uncorrected, repeat, steady state, simple shear flow experiments from high to low rate for Carbopol of 0.1, 0.15, 0.2, 0.25, 0.5 %wt. Each symbol type corresponds to a particular concentration. A higher concentration increases the yield stress.

Figure S7. Uncorrected, repeat, steady state, simple shear flow experiments from high to low rate for Bentonite of 7, 8, 9, 10, 11, 12 %wt. Each symbol type corresponds to a particular concentration. A higher concentration increases the yield stress.

Figure S8. Uncorrected, repeat, steady state, simple shear flow experiments from high to low rate for Laponite of 3, 4, 5 %wt. Each symbol type corresponds to a particular concentration. A higher concentration increases the yield stress.

Figure S9. Uncorrected, repeat, steady state, simple shear flow experiments from low to high rate for Xanthan Gum of 2, 4, 5 %wt. Each symbol type corresponds to a particular concentration. A higher concentration increases the yield stress.

Figure S10. Uncorrected, repeat, steady state,simple shear flow experiments from high to low rate for silicone oil-in-water emulsions of 65, 70, 75, 80 %wt oil. Each symbol type corresponds to a particular concentration. A higher concentration increases the yield stress.

Figure S11. Uncorrected, repeat, steady state, simple shear flow experiments from high to low rate for mineral oil-in-water emulsions of 65, 75 %wt oil. Each symbol type corresponds to a particular concentration. A higher concentration increases the yield stress.

Figure S12. Corrected, steady state, simple shear flow experiments from high to low rate for Carbopol of 0.1, 0.15, 0.2, 0.25, 0.5 %wt at different gap heights. The small yellow symbols are for a gap of 1000μm, the large orange symbols are for a gap of 500μm. Each symbol type corresponds to a particular concentration. A higher concentration increases the yield stress.

Figure S13. Corrected, steady state, simple shear flow experiments from high to low rate for Bentonite of 7, 8, 9, 10, 11, 12 %wt at different gap heights. The small purple symbols are for a gap of 1000μm, the large blue symbols are for a gap of 500μm. Each symbol type corresponds to a particular concentration. A higher concentration increases the yield stress.

Figure S14. Corrected, steady state, simple shear flow experiments from high to low rate for Laponite of 3, 4, 5 %wt at different gap heights. The small purple symbols are for a gap of 1000μm, the large blue symbols are for a gap of 500μm. Each symbol type corresponds to a particular concentration. A higher concentration increases the yield stress.
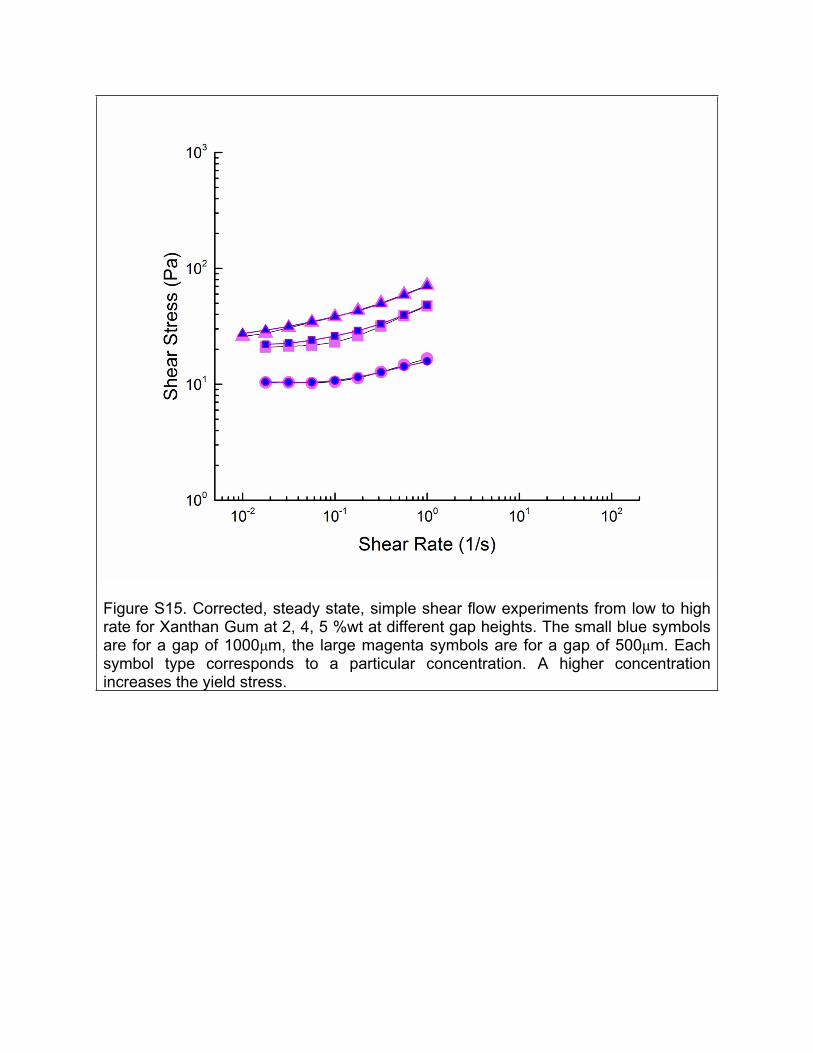
Figure S15. Corrected, steady state, simple shear flow experiments from low to high rate for Xanthan Gum at 2, 4, 5 %wt at different gap heights. The small blue symbols are for a gap of 1000μm, the large magenta symbols are for a gap of 500μm. Each symbol type corresponds to a particular concentration. A higher concentration increases the yield stress.
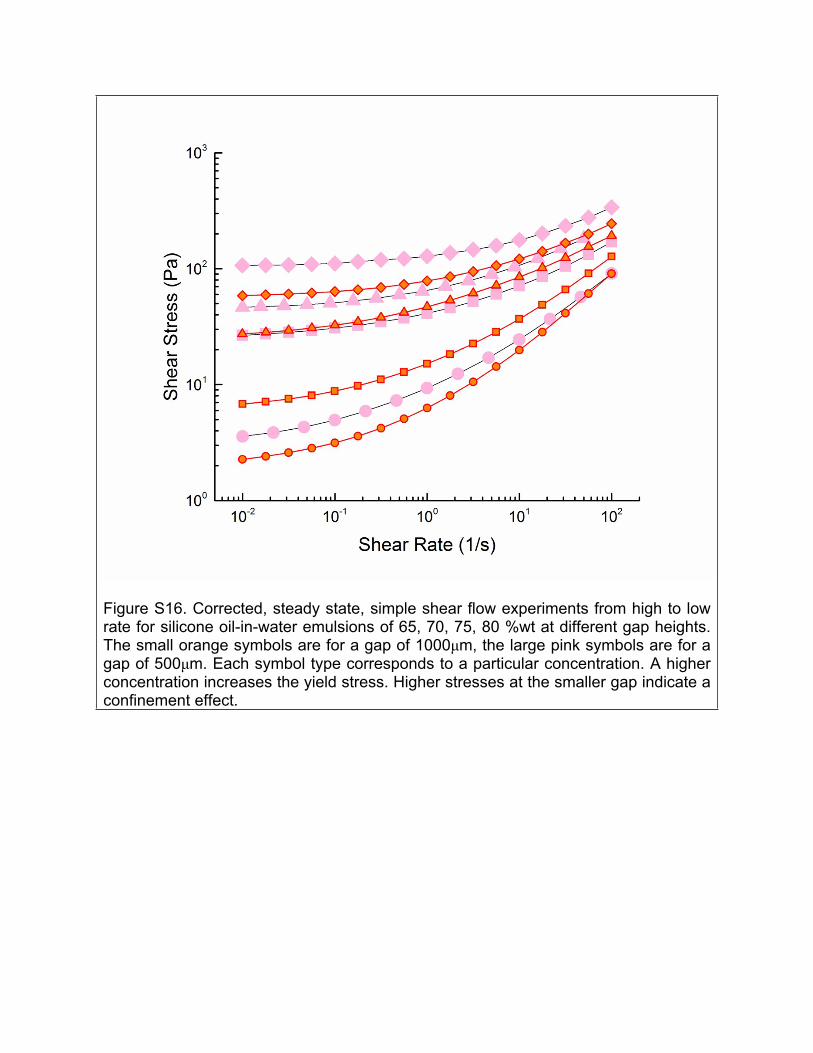
Figure S16. Corrected, steady state, simple shear flow experiments from high to low rate for silicone oil-in-water emulsions of 65, 70, 75, 80 %wt at different gap heights. The small orange symbols are for a gap of 1000μm, the large pink symbols are for a gap of 500μm. Each symbol type corresponds to a particular concentration. A higher concentration increases the yield stress. Higher stresses at the smaller gap indicate a confinement effect.

Figure S17. Corrected, steady state, simple shear flow experiments from high to low rate for mineral oil-in-water emulsions of 65, 75 %wt at different gap heights. The small orange symbols are for a gap of 1000μm, the large pink symbols are for a gap of 500μm. Each symbol type corresponds to a particular concentration. A higher concentration increases the yield stress. Higher stresses at the smaller gap indicate a confinement effect.
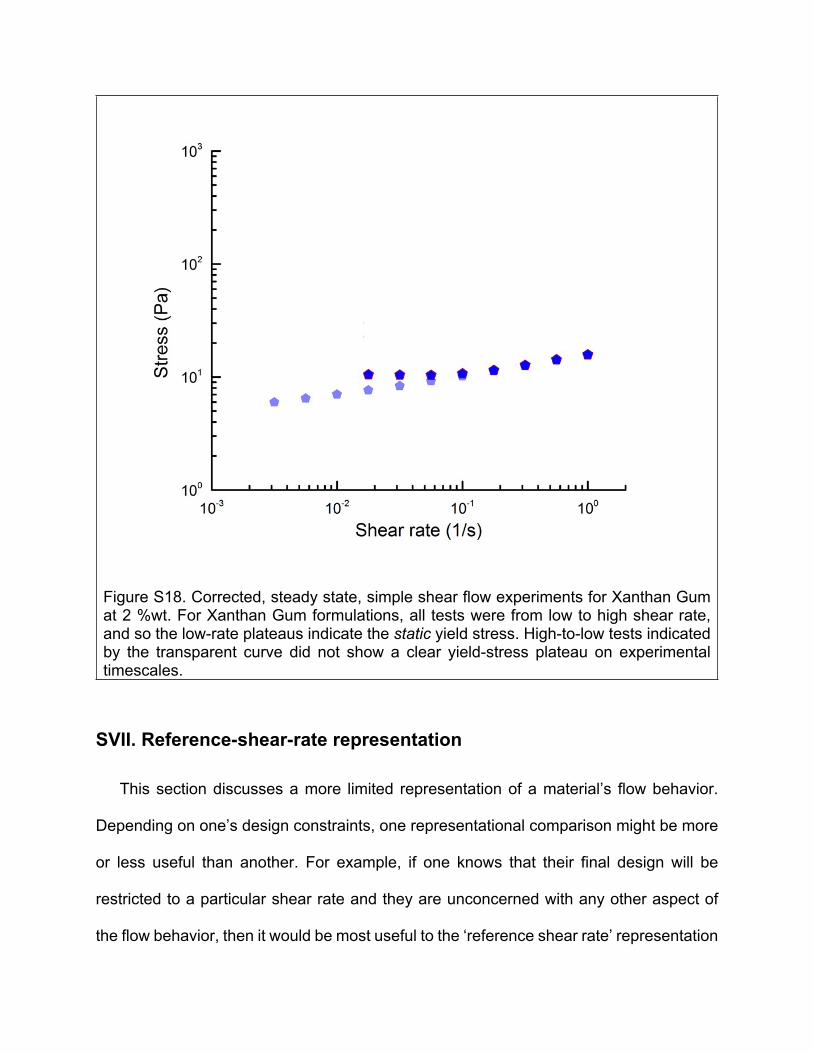
Figure S18. Corrected, steady state, simple shear flow experiments for Xanthan Gum at 2 %wt. For Xanthan Gum formulations, all tests were from low to high shear rate, and so the low-rate plateaus indicate the static yield stress. High-to-low tests indicated by the transparent curve did not show a clear yield-stress plateau on experimental timescales.
SVII. Reference-shear-rate representation
This section discusses a more limited representation of a material’s flow behavior.
Depending on one’s design constraints, one representational comparison might be more
or less useful than another. For example, if one knows that their final design will be
restricted to a particular shear rate and they are unconcerned with any other aspect of
the flow behavior, then it would be most useful to the ‘reference shear rate’ representation

described in Section III.C Figure 8 (for each formulation at three different shear rates
shown in Figure S24), rather than full-curve representations which would add needless
complexity. Within Figure S24, the particular shear rate of an application design will
further dictate the usefulness of such a comparison. As seen in Figure S24A, at the lowest
shear rate of 0.01 s-1, materials are not differentiated in any way as they all have yet to
deviate significantly from the yield stress value; in terms of this shear-rate design
constraint, any choice of material is as good as any other choice, however this is not the
case for the other, higher shear rates.

For the higher reference shear rates (Figure S24B-C), we begin to see differentiating
behavior of the flow stress based on the classification tree of design strategies. This
differentiation is most clear in Figure S24B where the oil-in-water emulsions and Carbopol
(material systems where the yield-stress comes about due to jamming) have higher flow
stresses than either of the two particulate gel samples. In Figure S24C, at the highest
measured shear rate it is notable that while all other materials, including Bentonite, have
an increased stress from the yield value, the shear stress of the other particulate gel,
Laponite, still has not increased appreciably. This effect can also be seen in Figure S4,
where Laponite has a much flatter flow curve than the other materials. This differentiating
behavior of Laponite and Bentonite also manifests itself in the other low-dimensional
representations.
A) γref = 0.01 s-1 B) γref = 10 s-1 C) γref = 100 s-1. . .
..
Figure S19. Ashby-style co-plot of low-dimensional yield-stress fluid descriptions: shear yield stress, and steady shear stress at reference shear rates of 0.01, 10, and Y100 s-1. The dashed lines indicate flow stress equal to the yield stress. Within each plot, each data point represents the steady shear stress for a particular concentration. Shear yield stress always increases with concentration. See Table S1 for the details of each formulation. See Figure S4 for the full steady shear flow data that these plots represent.

Supplementary Information References
[1] R.G. Larson, The Structure and Rheology of Complex Fluids, Oxford University
Press, New York, NY, 1999.
[2] R. Pal, Rheology of polymer-thickened emulsions, J. Rheol. (N. Y. N. Y). 36 (1992)
1245. doi:10.1122/1.550310.
[3] Y. Otsubo, R.K. Prud’homme, Rheology of oil-in-water emulsions, Rheol. Acta. 33
(1994) 29–37. doi:10.1007/BF00453461.
[4] T.G. Mason, J. Bibette, D.A. Weitz, Yielding and Flow of Monodisperse Emulsions,
J. Colloid Interface Sci. 179 (1996) 439–448. doi:10.1006/jcis.1996.0235.
[5] Y. Takahashi, Experimental tests of the scaling relation for textured materials in
mixtures of two immiscible fluids, J. Rheol. (N. Y. N. Y). 38 (1994) 699.
doi:10.1122/1.550481.
[6] D.A. Weitz, J.S. Huang, Self-similar structures and the kinetic of aggregation of gold
colloids, in: Kinet. Aggreg. Gelation, Elsevier, 1984: pp. 19–28. doi:10.1016/B978-
0-444-86912-8.50010-9.
[7] C. Clasen, B.P. Gearing, G.H. McKinley, The flexure-based microgap rheometer
(FMR), J. Rheol. (N. Y. N. Y). 50 (2006) 883. doi:10.1122/1.2357190.
[8] A. Burmistrova, R. von Klitzing, Control of number density and swelling/shrinking
behavior of P(NIPAM–AAc) particles at solid surfaces, J. Mater. Chem. 20 (2010)
3502. doi:10.1039/b923969c.
[9] M. Le Merrer, R. Lespiat, R. Höhler, S. Cohen-Addad, Linear and non-linear wall
friction of wet foams, Soft Matter. 11 (2015) 368–381. doi:10.1039/C4SM01557F.
[10] R. Pal, Effect of droplet size on the rheology of emulsions, AIChE J. 42 (1996)
3181–3190. doi:10.1002/aic.690421119.
[11] Y.D. Liu, H.J. Choi, Electrorheological fluids: smart soft matter and characteristics,
Soft Matter. 8 (2012) 11961. doi:10.1039/c2sm26179k.
[12] H. Dubberly, How do you design? A Compendium of Models, Dubberly Design
Office, 2008.
[13] K. Ulrich, S.D. Eppinger, Product design and development, 5th ed., McGraw-Hill,
New York, 2012. http://www.worldcat.org/title/product-design-and-
development/oclc/791505360?referer=br&ht=edition (accessed September 26,
2012).
[14] D.L. McDowell, J.H. Panchal, H.-J. Choi, C.C. Seepersad, J.K. Allen, F. Mistree,
Decision Making in Engineering Design, in: Integr. Des. Multiscale, Multifunct.
Mater. Prod., Elsevier, 2010: pp. 65–85. doi:10.1016/B978-1-85617-662-0.00004-
1.
[15] C.C. Seepersad, R.S. Kumar, J.K. Allen, F. Mistree, D.L. McDowell, Multifunctional
design of prismatic cellular materials, in: J. Comput. Mater. Des., 2005: pp. 163–
181. doi:10.1007/s10820-005-3167-0.
[16] N.A. Lynd, F.T. Oyerokun, D.L. O’Donoghue, D.L. Handlin, G.H. Fredrickson,
Design of soft and strong thermoplastic elastomers based on nonlinear block
copolymer architectures using self-consistent-field theory, Macromolecules. 43
(2010) 3479–3486. doi:10.1021/ma902517v.
[17] J. Hirtz, R. Stone, D. McAdams, S. Szykman, K. Wood, A functional basis for
engineering design: Reconciling and evolving previous efforts, Res. Eng. Des. 13
(2002) 65–82. doi:10.1007/s00163-001-0008-3.

[18] A. Winter, V. Govindarajan, Engineering Reverse Innovations, Harv. Bus. Rev. 93
(2015) 80–89.
[19] G. Pahl, W. Beitz, Engineering Design - A Systematic Approach, Springer London,
London, 1996. doi:10.1007/978-1-4471-3581-4.
[20] J.S. Linsey, I. Tseng, K. Fu, J. Cagan, K.L. Wood, C. Schunn, A Study of Design
Fixation, Its Mitigation and Perception in Engineering Design Faculty, J. Mech. Des.
132 (2010) 41003. doi:10.1115/1.4001110.
[21] E. de Bono, Lateral Thinking, Penguin Books, New York, NY, 1977.
[22] M.P. Groover, Fundamentals of Modern Manufacturing: materials, processes and
systems, (2010) 1025.
[23] R. Norton, Machine Design, 5th ed., Pearson, 2013.
[24] R. Budynas, K. Nisbett, Shigley’s Mechanical Engineering Design, 10th ed.,
McGraw-Hill Education, 2014.
[25] B.M. Kudrowitz, D. Wallace, Assessing the quality of ideas from prolific, early-stage
product ideation, J. Eng. Des. (2012) 1–20. doi:10.1080/09544828.2012.676633.
[26] Q. Barral, G. Ovarlez, X. Chateau, J. Boujlel, B. Rabideau, P. Coussot, Adhesion of
yield stress fluids, Soft Matter. (2010) 1343–1351. doi:10.1039/b922162j.
[27] R.H. Ewoldt, P. Tourkine, G.H. McKinley, A.E. Hosoi, Controllable adhesion using
field-activated fluids, Phys. Fluids. 23 (2011). doi:10.1063/1.3608277.
[28] D. Derks, A. Lindner, C. Creton, D. Bonn, Cohesive failure of thin layers of soft
model adhesives under tension, J. Appl. Phys. 93 (2003) 1557–1566.
doi:10.1063/1.1533095.
[29] J.M. Piau, Carbopol gels: Elastoviscoplastic and slippery glasses made of individual

swollen sponges Meso- and macroscopic properties, constitutive equations and
scaling laws, J. Nonnewton. Fluid Mech. 144 (2007) 1–29.
doi:10.1016/j.jnnfm.2007.02.011.
[30] P. Møller, A. Fall, V. Chikkadi, D. Derks, D. Bonn, An attempt to categorize yield
stress fluid behaviour., Philos. Trans. A. Math. Phys. Eng. Sci. 367 (2009) 5139–
5155. doi:10.1098/rsta.2009.0194.
[31] Y.M. Joshi, Model for cage formation in colloidal suspension of laponite, J. Chem.
Phys. 127 (2007). doi:10.1063/1.2779026.
[32] W.E. Rochefort, S. Middleman, Rheology of Xanthan Gum: Salt, Temperature, and
Strain Effects in Oscillatory and Steady Shear Experiments, J. Rheol. (N. Y. N. Y).
31 (1987) 337. doi:10.1122/1.549953.
[33] R.H. Ewoldt, M.T. Johnston, L.M. Caretta, Experimental challenges of shear
rheology with case studies in biological complex fluids, in: S.E. Spagnolie (Ed.),
Complex Fluids Biol. Syst., Springer, 2015: pp. 207–241. doi:10.1007/978-1-4939-
2065-5_6.
[34] C.W. Macosko, Rheology Principles, Measurements, and Applications, Wiley, New
York, 1994.
[35] P. Coussot, Q.D. Nguyen, H.T. Huynh, D. Bonn, Viscosity bifurcation in thixotropic,
yielding fluids, J. Rheol. (N. Y. N. Y). 46 (2002) 573–589. doi:10.1122/1.1459447.
[36] H. Emady, M. Caggioni, P. Spicer, Colloidal microstructure effects on particle
sedimentation in yield stress fluids, J. Rheol. 57 (2013) 1761–1772.
doi:10.1122/1.4824471.
[37] R.H. Ewoldt, C. Clasen, a. E. Hosoi, G.H. McKinley, Rheological fingerprinting of
gastropod pedal mucus and synthetic complex fluids for biomimicking adhesive
locomotion, Soft Matter. 3 (2007) 634. doi:10.1039/b615546d.
[38] B.C. Blackwell, M.E. Deetjen, J.E. Gaudio, R.H. Ewoldt, Sticking and splashing in
yield-stress fluid drop impacts on coated surfaces, Phys. Fluids. 27 (2015) 43101.
doi:10.1063/1.4916620.
[39] B.C. Blackwell, M.E. Deetjen, J.E. Gaudio, R.H. Ewoldt, Quantitative measures of
yield-stress fluid drop impacts on coated surfaces, J. Nonnewton. Fluid Mech.
(2016).