supplementary information for - media. · pdf file1/500 and 1/1,000 dilutions of the original...
TRANSCRIPT
Supplementary Information for
Recombinant antibodies to histone post-translational modifications
Takamitsu Hattori, Joseph M. Taft, Kalina M. Swist, Hao Luo, Heather Witt, Matthew Slattery,
Akiko Koide, Alexander J. Ruthenburg, Krzysztof Krajewski, Brian D. Strahl, Kevin P. White,
Peggy J. Farnham, Yingming Zhao and Shohei Koide
Contents
Supplementary Data
1. Supplementary Figure 1. Characterization of commercial anti-H3K9me3 antibodies by
peptide IP assay, related to Fig. 1a.
2. Supplementary Figure 2. Generation and characterization of recombinant antibodies to
tri-methylated Lys residues.
3. Supplementary Figure 3. Characterization of 309M3-A recombinant antibodies by
peptide IP assay and Western blot, related to Fig. 1b.
4. Supplementary Figure 4. Characterization of the 304M3-A recombinant antibody by
peptide IP assay.
5. Supplementary Figure 5. Validation of recombinant antibodies using ChIP.
6. Supplementary Figure 6. IP followed by mass spectrometry analysis, related to Fig. 2c.
Supplementary Note
1. Step-by-step protocol for preparing Fab-loaded magnetic beads for ChIP experiments.
Supplementary References
Nature Methods: doi:10.1038/nmeth.2605

Supplementary Figure 1. Characterization of commercial anti-H3K9me3 antibodies by peptide IP assay.
Supplementary Figure 1. Characterization of commercial anti-H3K9me3 antibodies by peptide IP assay1, related to Fig. 1a. (a) The amino acid sequences of peptides used in this work. The residue numbering in the histone proteins is also shown. The lysine residues containing the PTM are shaded in red. Conserved amino acids around the Lys residues, with respect to the H3K9 sequence, are highlighted in bold. The GYCD tag is for biotinylation and quantification. (b) Titration curves of anti-H3K9me3 antibodies to a series of peptides. Data are plotted on a linear scale for peptide concentration. Data shown in solid and open symbols are from replicate assays (n = 2). The left panels show the binding data to peptides containing trimethylated Lys, indicating sequence specificity. The center panels show the binding data to peptides containing different methylation states, indicating methylation-state specificity. Fluorescence intensity shown in the left and center panels have been normalized to have a range of 0–1 with 1 corresponding to the mean fluorescence intensity (MFI) at saturation of the highest-affinity interaction estimated from curve fitting. The right panels show the binding data to the H3K9me3 with MFI, prior to normalization. The fluorescence intensities are proportional to the amounts of peptides captured by an antibody, and thus the binding capacity of an antibody sample.
Nature Methods: doi:10.1038/nmeth.2605

Supplementary Figure 2. Generation and characterization of recombinant antibodies to trimethylated Lys residues.
Supplementary Figure 2. Generation and characterization of recombinant antibodies to trimethylated Lys residues. (a) Nomenclature of antibody fragments. The domain architecture of immunoglobulin G (IgG) is shown, with the heavy and light chains in dark and light blue, respectively. The rectangles indicate portions of IgG corresponding to the antigen-binding fragment (Fab) and the variable fragment (Fv). Single-chain Fv (scFv) contains the variable domains of the heavy and light chains connected via a flexible linker. (b) Schematic representation of steps required for the generation of recombinant antibodies. Large antibody repertories (“libraries”) are generated by cloning either naïve or designed antibody genes, and antibodies binding to a target are identified by in vitro selection. The evolved antibodies are then produced in bacteria from an expression vector. (c) Quantitative characterization of recombinant antibodies using the peptide IP assay. Titration data for scFv 4-5 displayed on yeast surface is shown in the same manner as in Supplementary Fig. 1b. (d) Shotgun-scanning mutagenesis analysis of scFv 4-5. The ratios of the wild type amino acid over a replacement at mutated position for recovered clones that retained binding to H3K4me3 (white bar) or H3K9me3 (black bar) are plotted for amino acid residues of the CDRs. (e) Sequence alignment of recombinant antibodies generated in this work. Dashes indicate the same amino acid as in scFv 4-5.
Nature Methods: doi:10.1038/nmeth.2605

Supplementary Figure 3. Characterization of 309M3-A recombinant antibodies by peptide IP assay and Western blot.
Supplementary Figure 3. Characterization of 309M3-A recombinant antibodies by peptide IP assay and Western blot, related to Fig. 1b. (a) Titration data for two separate preparations of the 309M3-A antibody. Purified protein samples of the 309M3-A antibodies captured on beads is shown in the same manner as in Supplementary Fig. 1b. (b) Binding of the 309M3-A antibody to the H3K9me3, H3K9Ac, H3K36me3 and H3K56me3 peptides. The amino acid sequences of H3K36me3 and H3K56me3 peptides are SAPATGGVK-K(me3)-PHRYRPGG-K(biotin)-D and LREIRRYQ-K(me3)-STELLIRGG-K(biotin)-D, respectively. (c) Binding capacity determination of anti-H3K9me3 antibodies. Equivalent amounts of Fab to IgG (after accounting for their different formats) were immobilized on beads, and thus the fluorescence signal at a saturating concentration of the H3K9me3 peptide is proportional to the binding capacity of the antibodies. (d) Western blotting of human cell lysates with anti-H3K9me3 antibodies. Whole cell lysate of K562 cells were stained with coomassie brilliant blue (left panel) and blotted with 309M3-A (200, 40 and 8 nM; center panel, 200 and 40 nM; right panel), the anti-H3K9me3 polyclonal antibody (Abcam Ab8898, lot 960144; center panel, pAb-056-050, lot A93-0042 at 1/500 and 1/1,000 dilutions of the original sample; right panel) and the anti-histone H3 pAb (Abcam Ab1791, lot GR64775-1). The 309M3-A antibody was detected with horseradish peroxidase (HRP) conjugated neutravidin, the others with HRP conjugated anti-rabbit secondary antibody. The arrows indicate the location of histone H3.The top two bands are artifacts due to the secondary reagent, and the middle band is an unidentified protein that cross-reacts with both recombinant and polyclonal anti-H3K9me3 antibodies.
Nature Methods: doi:10.1038/nmeth.2605
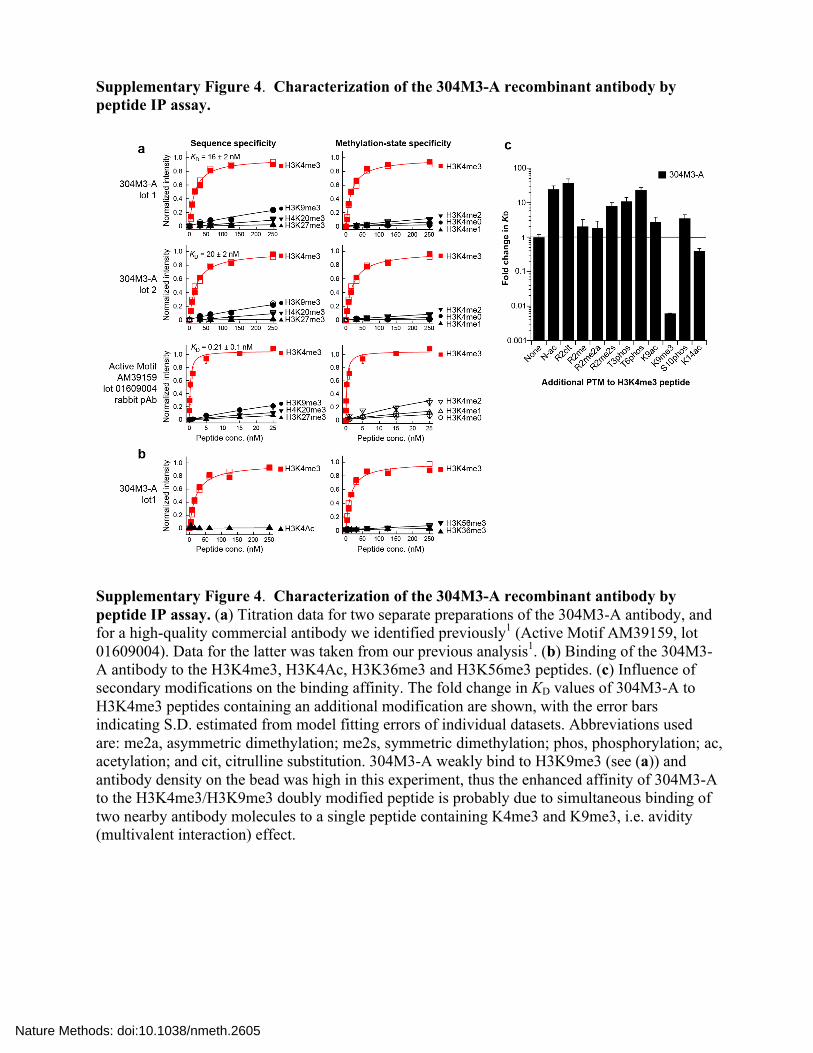
Supplementary Figure 4. Characterization of the 304M3-A recombinant antibody by peptide IP assay.
Supplementary Figure 4. Characterization of the 304M3-A recombinant antibody by peptide IP assay. (a) Titration data for two separate preparations of the 304M3-A antibody, and for a high-quality commercial antibody we identified previously1 (Active Motif AM39159, lot 01609004). Data for the latter was taken from our previous analysis1. (b) Binding of the 304M3-A antibody to the H3K4me3, H3K4Ac, H3K36me3 and H3K56me3 peptides. (c) Influence of secondary modifications on the binding affinity. The fold change in KD values of 304M3-A to H3K4me3 peptides containing an additional modification are shown, with the error bars indicating S.D. estimated from model fitting errors of individual datasets. Abbreviations used are: me2a, asymmetric dimethylation; me2s, symmetric dimethylation; phos, phosphorylation; ac, acetylation; and cit, citrulline substitution. 304M3-A weakly bind to H3K9me3 (see (a)) and antibody density on the bead was high in this experiment, thus the enhanced affinity of 304M3-A to the H3K4me3/H3K9me3 doubly modified peptide is probably due to simultaneous binding of two nearby antibody molecules to a single peptide containing K4me3 and K9me3, i.e. avidity (multivalent interaction) effect.
Nature Methods: doi:10.1038/nmeth.2605

Supplementary Figure 5. Validation of recombinant antibodies using ChIP.
Supplementary Figure 5. Validation of recombinant antibodies using ChIP. (a) Recovery of five different loci in cross-linked ChIP of HEK293T cells with and without 5-azaC treatment, as tested by ChIP-qPCR. Four different antibodies were used for ChIP, as indicated. The chemical, 5-azaC, is known to reduce the H3K9me3 level at specific loci2. Equivalent amounts of antibodies (after accounting for their format differences) were used. The fold enrichment over the input (from triplicate assays) is shown, with the error bars indicating S.D. (b) ChIP followed by sequencing (ChIP-seq) of HEK293T cells using the indicated antibodies. The number of reads for a portion of chromosome 19 is plotted (vertical axis) versus genomic location (horizontal axis). Four times as much amount of pAb-056-050 as 309M3-A (after accounting for their format differences) was used to obtain sufficient quantities of DNA for generating a library (See Online Methods for detail).
Nature Methods: doi:10.1038/nmeth.2605

Supplementary Figure 6. IP followed by mass spectrometry analysis.
Supplementary Figure 6. IP followed by mass spectrometry analysis, related to Fig. 2c. (a) Schematic representation of IP and MS analysis procedures. The symbols above the line represent PTMs, and Pr* denotes 13C-propionyl group. (b and c) The fractions of the peptides containing the indicated modifications before (open bars) and after (solid bars) IP with 309M3-A. Data shown in black and red colors are from replicates (n = 2). The fraction was calculated from the spectral count of the peptide containing the modification of interest and the total spectral count of all peptides bearing the residue of interest. Data for the fragment corresponding to residues 9-17 of all the H3 isoforms are shown in (b), and data for residues 27-40 of the H3.1/H3.2 isoforms are shown in (c). (d) The data set used to derive data shown in Fig. 2c, summary of the fractions of PTMs at the indicated lysine residues of histone H3 before and after IP with 309M3-A. The fractions of the PTMs were calculated by summing over all peptides containing the residue of interest. Data shown are from replicates (n = 2). nd, not detected.
Nature Methods: doi:10.1038/nmeth.2605
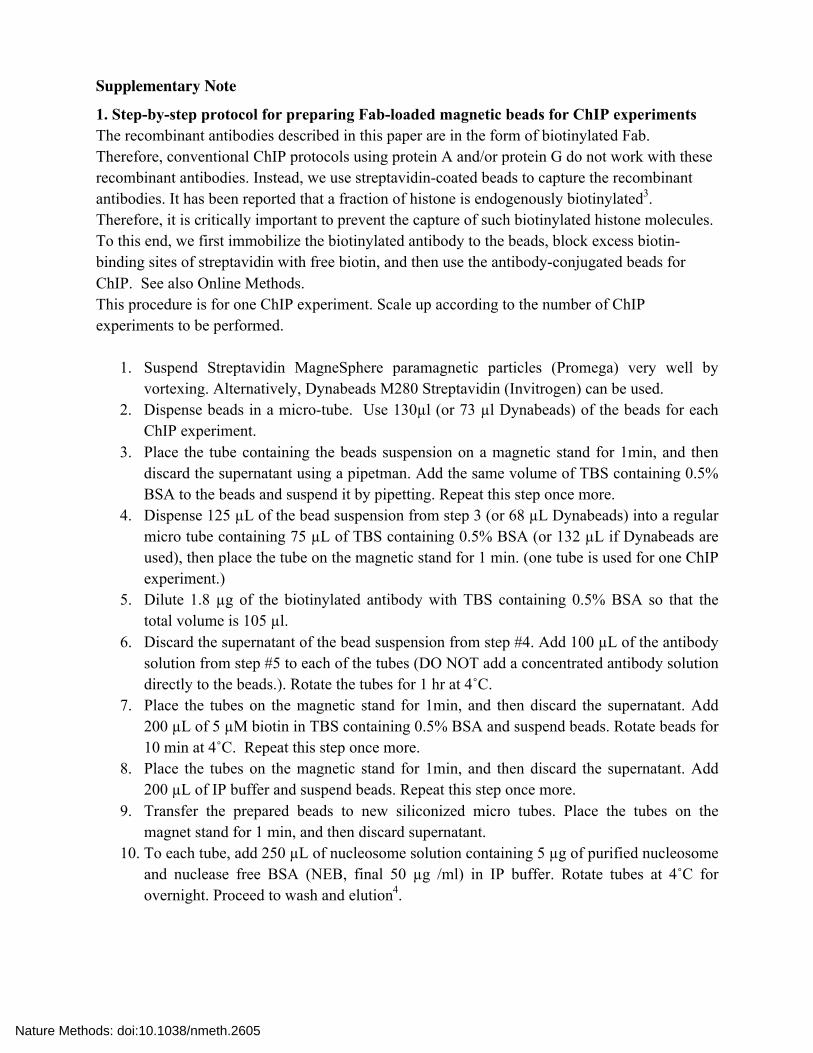
Supplementary Note
1. Step-by-step protocol for preparing Fab-loaded magnetic beads for ChIP experiments The recombinant antibodies described in this paper are in the form of biotinylated Fab. Therefore, conventional ChIP protocols using protein A and/or protein G do not work with these recombinant antibodies. Instead, we use streptavidin-coated beads to capture the recombinant antibodies. It has been reported that a fraction of histone is endogenously biotinylated3. Therefore, it is critically important to prevent the capture of such biotinylated histone molecules. To this end, we first immobilize the biotinylated antibody to the beads, block excess biotin-binding sites of streptavidin with free biotin, and then use the antibody-conjugated beads for ChIP. See also Online Methods. This procedure is for one ChIP experiment. Scale up according to the number of ChIP experiments to be performed.
1. Suspend Streptavidin MagneSphere paramagnetic particles (Promega) very well by vortexing. Alternatively, Dynabeads M280 Streptavidin (Invitrogen) can be used.
2. Dispense beads in a micro-tube. Use 130µl (or 73 µl Dynabeads) of the beads for each ChIP experiment.
3. Place the tube containing the beads suspension on a magnetic stand for 1min, and then discard the supernatant using a pipetman. Add the same volume of TBS containing 0.5% BSA to the beads and suspend it by pipetting. Repeat this step once more.
4. Dispense 125 µL of the bead suspension from step 3 (or 68 µL Dynabeads) into a regular micro tube containing 75 µL of TBS containing 0.5% BSA (or 132 µL if Dynabeads are used), then place the tube on the magnetic stand for 1 min. (one tube is used for one ChIP experiment.)
5. Dilute 1.8 µg of the biotinylated antibody with TBS containing 0.5% BSA so that the total volume is 105 µl.
6. Discard the supernatant of the bead suspension from step #4. Add 100 µL of the antibody solution from step #5 to each of the tubes (DO NOT add a concentrated antibody solution directly to the beads.). Rotate the tubes for 1 hr at 4˚C.
7. Place the tubes on the magnetic stand for 1min, and then discard the supernatant. Add 200 µL of 5 µM biotin in TBS containing 0.5% BSA and suspend beads. Rotate beads for 10 min at 4˚C. Repeat this step once more.
8. Place the tubes on the magnetic stand for 1min, and then discard the supernatant. Add 200 µL of IP buffer and suspend beads. Repeat this step once more.
9. Transfer the prepared beads to new siliconized micro tubes. Place the tubes on the magnet stand for 1 min, and then discard supernatant.
10. To each tube, add 250 µL of nucleosome solution containing 5 µg of purified nucleosome and nuclease free BSA (NEB, final 50 µg /ml) in IP buffer. Rotate tubes at 4˚C for overnight. Proceed to wash and elution4.
Nature Methods: doi:10.1038/nmeth.2605

Supplementary References
1. Nishikori, S. et al. J. Mol. Biol. 424, 391-399 (2012). 2. Komashko, V.M. & Farnham, P.J. Epigenetics 5 (2010). 3. Chew, Y.C. et al. J Nutrition 138, 2316-2322 (2008). 4. Ruthenburg, A.J. et al. Cell 145, 692-706 (2011).
Nature Methods: doi:10.1038/nmeth.2605