supplementary information for - royal society of chemistry · supplementary information for ... 1.1...
TRANSCRIPT

1
Supplementary information for
Millisecond lifetime imaging with a europium complex using a
commercial confocal microscope under one or two-photon
excitation
Alexei Grichine,* Alexandre Haefele, Simon Pascal, Alain Duperray, Richard Michel, Chantal
Andraud, Olivier Maury*
Figure S1. Absorption (plain) and emission (dashed) spectra of [Na]3[EuL1G3] and 2b in water.
Electronic Supplementary Material (ESI) for Chemical Science.This journal is © The Royal Society of Chemistry 2014

2
Figure S2. Absorption (plain) and emission (dashed) spectra of [Na]3[EuL1G3] and 2a in
CH2Cl2.
Table S1. Quenching of [Na]3[EuL1G3] with 2a in CH2Cl2
2a/[Na]3[EuL1G3] ratio Eu(III) emission
quenching (%)a
Eu (ms) FRETb
0.3 0.10 1.41 0.13
1.1 0.31 1.15 0.29
2.6 0.55 0.86 0.47
4.6 0.71 0.61 0.62
7.7 0.81 0.48 0.70
a. Defined as the ratio between Eu(III) emission in presence and in absence of 2a measured at
the J = 2 transition.
b. FRET = (1-τEu/τ0) where τ0 designed the lifetime in absence of 2a.

3
A B C
D E F
Figure S3. The transmitted light DIC (A) and confocal (B) images of sub-cellular distribution
of the mitochondrial label MitoID. The co-staining of [Na]3[EuL1G3] loaded PFA-fixed cells
with MitoID (C-G). The wide emission spectrum of MitoID overlapped that of europium
precluding the use of band-pass detection (C). The spectral unmixing confocal microscopy
(LSM710) allowed a faithful discrimination of the MitoID (D) and [Na]3[EuL1G3] (E) signals.
In spite of lower signal-to-noise ratio of the spectral detection and too fast scanning speed of
the confocal microscope (maximum value of 177 µs/pixel), colocalisation of MitoID with
[Na]3[EuL1G3] (E) can be clearly seen in the overlap image (F). The positive correlation of both
signals is visible in colocalisation scatterplot (G) except a region corresponding to nucleoli
(arrowhead). One can notice the tendency of MitoID (D,E arrowheads) as of [Na]3[EuL1G3] and
some other tested probes (Acridine Orange, FRET acceptor dyes 2a,b) to accumulate in the
nucleoli. The partition between organelles is however different for each dye and is known to be
a complex function of structural symmetry, hydrophobicity and charge of the probe (for review
see Horobin et al1). Scale bars 10 µm.

4
G
A B C
D E F
H I
[Na]
3[EuL1
G3]
inte
nsity
DAPI intensity
Figure S4. The co-staining of [Na]3[EuL1G3] loaded fixed cells with the membrane label DiD
(A-C), the immuno-labelled protein Golgin (D-F) and with the DNA intercalator DAPI (G-
I).A, D – transmitted light DIC images, B,E,H confocal optical sections, C,F,I – [Na]3[EuL1G3]
distribution 2P images. No significant colocalization was detected between these labels and
europium complex. The colocalization scatterplot with DAPI in the region of nucleus (G)
shows the absence of intensity correlation of the chromatin density (H) and [Na]3[EuL1G3]
signal (I). Scale bars 10 µm.

5
0.99 ms
1.11 ms
0.99 ms
1.11 ms
A B C
D E F
B C D
Figure S5. TDS imaging of the fixed cells stained with [Na]3[EuL1G3]. T24 cells were
fixed by PFA (A-C) or EtOH (D-F). Transmitted light DIC images (A, D) are superposed with
intensity distribution of Eu. Dashed rectangle shows the region measured by TDS FLIM.
Intensity maps of Eu in ROIs measured with the resolution 20x21 pixels (B,E). Lifetime maps
in the ROIs were color coded within the same scale for comparison (C,F).
Figure S6. Colocalization of the [Na]3[EuL1G3] and 2b in PFA-fixed cells. A – transmitted
light DIC image of the fixed cell. B – 2b subcellular distribution shows prominent
accumulation in mitochondria, moderate nucleolar and faint chromatin staining, although this
diffuse staining could be more pronounced probably depending on the degree of nuclear
membrane permeabilization (panel D, another experiment). C – [Na]3[EuL1G3] localization in
mitochondria, chromatin and nucleoli is similar to 2b albeit with completely different partition
ratios. The pixels of these three subcellular structures present thus co-localized dyes with
variable Donor/Acceptor ratio and are used as for the FRET analysis. Scale bars – 10 µm.

6
AA
B
C
Figure S7. TSLIM imaging in line scanning mode of [Na]3[EuL1G3] in the nucleus of the fixed
T24 cell. A – 128x60 pixel intensity image. The dashed rectangle represents one of 60 lines,
average of 10 repetitions. Scale bars 10 µm. B – temporal sampling of the example dashed line
outlined in A. Ten sequential measurements are presented in ordinate, starting from the one
taken before the excitation pulse (top black line). The vertical dashed rectangle outlines
luminescence decay in a single pixel. C – Intensity profile of the single dashed decay
presented in panel B.
7
N N
HN
Br
N N
HN
SO3NaO3S
1a
ClNN
H2N
93%Cl
HO O
O
NBrN
POCl3
DMF
90%
Toluene, EtOHpyridine
70%
80%
DMF, 70°C
Br
Br
N
SO3
N Toluene, 96%
90%
ClNN
NaO3S SO3
EtOHpyridine
H2N
50%DMF, 50°C
OSOO
1b
2a
2b
a
b
c
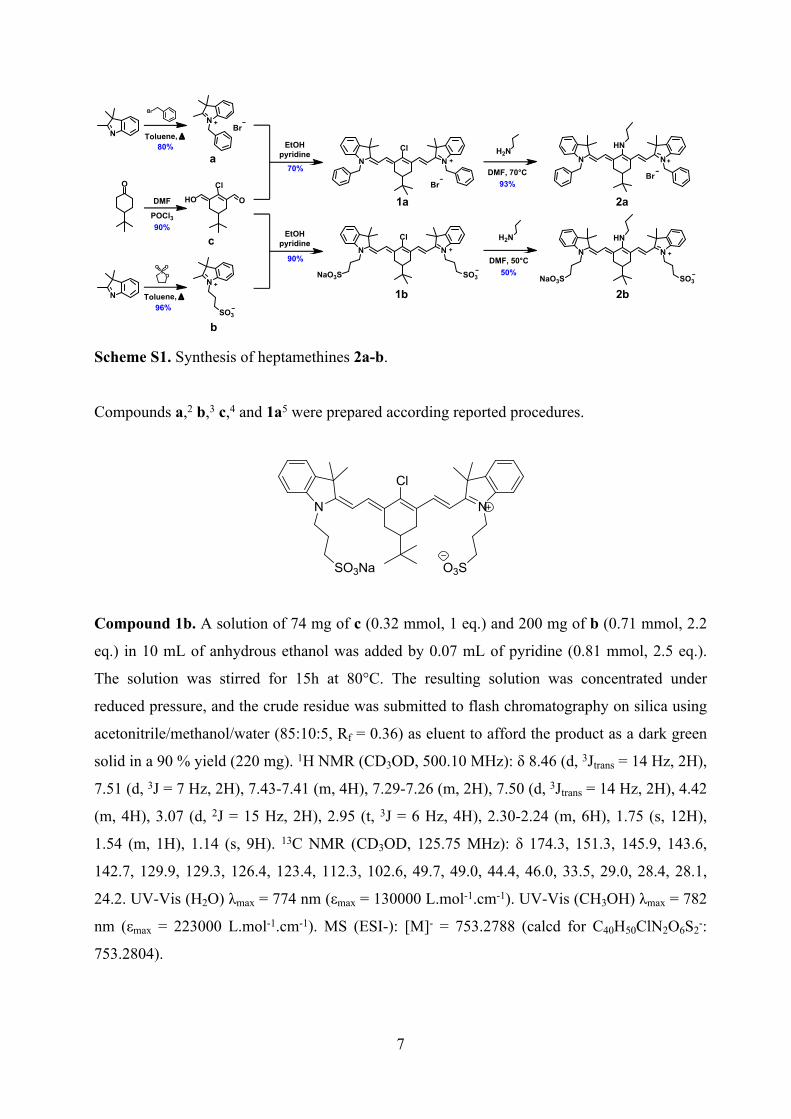
Scheme S1. Synthesis of heptamethines 2a-b.
Compounds a,2 b,3 c,4 and 1a5 were prepared according reported procedures.
Cl
NN
O3SSO3Na
Compound 1b. A solution of 74 mg of c (0.32 mmol, 1 eq.) and 200 mg of b (0.71 mmol, 2.2
eq.) in 10 mL of anhydrous ethanol was added by 0.07 mL of pyridine (0.81 mmol, 2.5 eq.).
The solution was stirred for 15h at 80°C. The resulting solution was concentrated under
reduced pressure, and the crude residue was submitted to flash chromatography on silica using
acetonitrile/methanol/water (85:10:5, Rf = 0.36) as eluent to afford the product as a dark green
solid in a 90 % yield (220 mg). 1H NMR (CD3OD, 500.10 MHz): δ 8.46 (d, 3Jtrans = 14 Hz, 2H),
7.51 (d, 3J = 7 Hz, 2H), 7.43-7.41 (m, 4H), 7.29-7.26 (m, 2H), 7.50 (d, 3Jtrans = 14 Hz, 2H), 4.42
(m, 4H), 3.07 (d, 2J = 15 Hz, 2H), 2.95 (t, 3J = 6 Hz, 4H), 2.30-2.24 (m, 6H), 1.75 (s, 12H),
1.54 (m, 1H), 1.14 (s, 9H). 13C NMR (CD3OD, 125.75 MHz): δ 174.3, 151.3, 145.9, 143.6,
142.7, 129.9, 129.3, 126.4, 123.4, 112.3, 102.6, 49.7, 49.0, 44.4, 46.0, 33.5, 29.0, 28.4, 28.1,
24.2. UV-Vis (H2O) λmax = 774 nm (εmax = 130000 L.mol-1.cm-1). UV-Vis (CH3OH) λmax = 782
nm (εmax = 223000 L.mol-1.cm-1). MS (ESI-): [M]- = 753.2788 (calcd for C40H50ClN2O6S2-:
753.2804).

8
NMR spectra

9

10

11
References
(1) Horobin, R.; Stockert, J.; Rashid-Doubell, F. Histochem Cell Biol 2006, 126, 165.
(2) Chen, X.; Peng, X.; Cui, A.; Wang, B.; Wang, L.; Zhang, R. J. Photochem. Photobiol.,
A 2006, 181, 79.
(3) Flanagan, J. H.; Khan, S. H.; Menchen, S.; Soper, S. A.; Hammer, R. P. Bioconjugate
Chem. 1997, 8, 751.
(4) Reynolds, G. A.; Drexhage, K. H. J. Org. Chem. 1977, 42, 885.
(5) Bouit, P.-A.; Wetzel, G.; Berginc, G.; Loiseaux, B.; Toupet, L.; Feneyrou, P.;
Bretonnière, Y.; Kamada, K.; Maury, O.; Andraud, C. Chem. Mater. 2007, 19, 5325.