supplementary material - springer static content server10.1007/s105… · web viewthe scenarios...
TRANSCRIPT

Supplementary material
Journal: Climatic Change
Paper Title: “Climate change and coffee: Assessing vulnerability by modeling future climate suitability in the Caribbean island of Puerto Rico”
Authors: Stephen J. Fain, Maya Quiñones, Nora L. Álvarez-Berríos, Isabel K. Parés-Ramos, William A. GouldCorresponding Author: Stephen FainEmail Address: [email protected]
Appendix I: Climate Projections for Puerto Rico
Discussion of Models and IPCC Emission ScenariosPuerto Rico is projected to experience increasing mean annual temperatures over the course of the 21st century. The range of increase projected varies according to the emission scenario and particular climate model used. Emission scenarios are built on a range of assumptions regarding global economic and technological development, the continued use of fossil fuels, and GHG mitigation policies1. The scenarios do not take into account implementation of the United Nations Framework Convention on Climate Change (UNFCCC) or the emissions targets of the Kyoto Protocol. The Intergovernmental Panel on Climate Change (IPCC) issued a Special Report on Emission Scenarios (SRES) in 2000 that resulted in four different narratives based on scientific literature that consistently describe the relationships between emission driving forces and their evolution and add context for the scenario quantification2. For each narrative, several different scenarios were developed using different modeling approaches to examine the range of outcomes arising from a range of models that use similar assumptions about driving forces. The resultant 40 SRES scenarios together encompassed the best understanding of future GHG emission uncertainties as of 2000. The range of temperature projections for Puerto Rico are the result of recent modeling efforts by scientists at the US Forest Service International Institute of Tropical Forestry (IITF) using the SRES A1B, A2, and B1 emissions scenarios3. The A2 scenario is representative of a heterogeneous world in which economic development is primarily regionally oriented and per capita economic growth and technological change are more fragmented and slower which results in greater temperature increases compared to other scenarios modeled for the region.
Karmalkar et al., (2013) used general circulation model (GCM) data included in the Coupled Model Intercomparison Project phase 3 (CMIP3) and the UK Hadley Centre regional climate model (RCM) data to provide both present-day and scenario-based future information on precipitation and temperature for individual island states within the Caribbean (Fig. 1 & 2) (Karmalkar et al. 2013).
1 IPCC Special Report on Emission Scenarios (2000) available at: https://www.ipcc.ch/pdf/special-reports/spm/sres-en.pdf2 Ibid3 Henareh et al., 2016- For a discussion of A1B, A2, and B1 emission scenarios see the IPCC SRES (2000) cited above
1
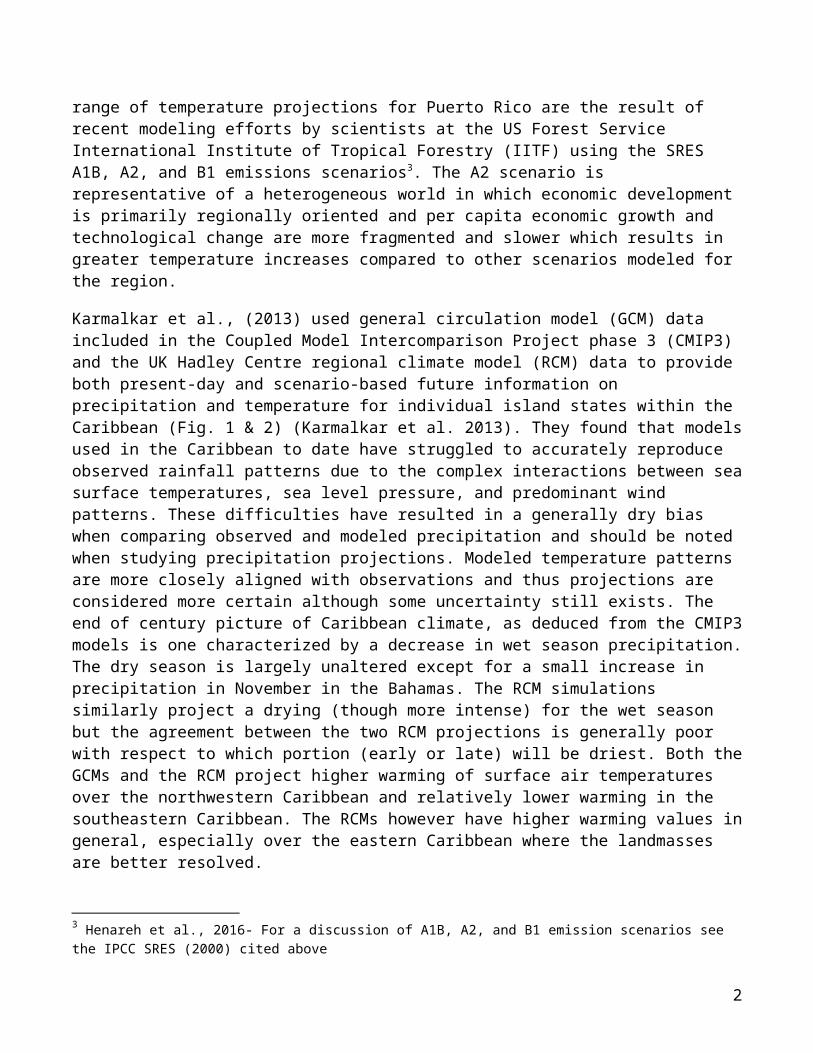
They found that models used in the Caribbean to date have struggled to accurately reproduce observed rainfall patterns due to the complex interactions between sea surface temperatures, sea level pressure, and predominant wind patterns. These difficulties have resulted in a generally dry bias when comparing observed and modeled precipitation and should be noted when studying precipitation projections. Modeled temperature patterns are more closely aligned with observations and thus projections are considered more certain although some uncertainty still exists. The end of century picture of Caribbean climate, as deduced from the CMIP3 models is one characterized by a decrease in wet season precipitation. The dry season is largely unaltered except for a small increase in precipitation in November in the Bahamas. The RCM simulations similarly project a drying (though more intense) for the wet season but the agreement between the two RCM projections is generally poor with respect to which portion (early or late) will be driest. Both the GCMs and the RCM project higher warming of surface air temperatures over the northwestern Caribbean and relatively lower warming in the southeastern Caribbean. The RCMs however have higher warming values in general, especially over the eastern Caribbean where the landmasses are better resolved.
2

Figure 1: Projected change in precipitation (percent) in the Caribbean region by the 2080s under the SRES A2 scenario based on the CMIP3 multi-model ensemble for the following seasons (a) MJJ (early wet season), (b) ASON (late wet season). Projected change is relative to the mean from 1970-89 (Taken from Kalmalkar et. al 2013).
3

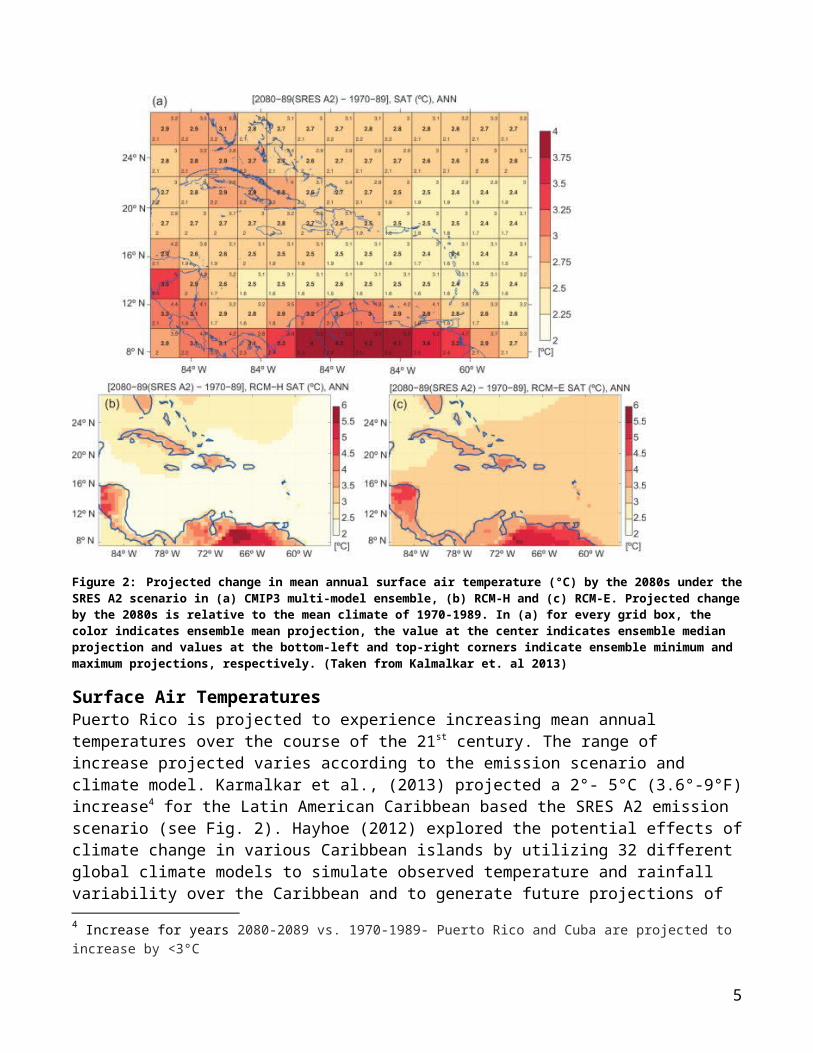
Figure 2: Projected change in mean annual surface air temperature (°C) by the 2080s under the SRES A2 scenario in (a) CMIP3 multi-model ensemble, (b) RCM-H and (c) RCM-E. Projected change by the 2080s is relative to the mean climate of 1970-1989. In (a) for every grid box, the color indicates ensemble mean projection, the value at the center indicates ensemble median projection and values at the bottom-left and top-right corners indicate ensemble minimum and maximum projections, respectively. (Taken from Kalmalkar et. al 2013)
Surface Air TemperaturesPuerto Rico is projected to experience increasing mean annual temperatures over the course of the 21st century. The range of increase projected varies according to the emission scenario and climate model. Karmalkar et al., (2013) projected a 2°- 5°C (3.6°-9°F) increase4 for the Latin American Caribbean based the SRES A2 emission scenario (see Fig. 2). Hayhoe (2012) explored the potential effects of climate change in various Caribbean islands by utilizing 32 different global climate models to simulate observed temperature and rainfall variability over the Caribbean and to generate future projections of temperature and precipitation for Puerto Rico. These future projections were analyzed in terms of model performance and changes projected for a range of global mean temperature targets, from +1 to +3°C relative to 1971-2000. For Puerto Rico, the projected changes were divided into two regions for temperature (hot coastal and more temperate inland) and three regions for precipitation (dry northern coast, dry southern coast, and wet inland locations)5.
4 Increase for years 2080-2089 vs. 1970-1989- Puerto Rico and Cuba are projected to increase by <3°C5 See supplemental materials for summary of Hayhoe (2013)
4
Summary of Temperature Projections from Hayhoe (2013),
Puerto Rico is expected to warm faster than the global average, with increases in both mean and extreme temperatures, including days per year over 95°F (35°C) and nights warmer than 85°F (~29°C).
With just one degree increase in global temperature, 60% of the wet seasons are projected to be warmer than the historical maximum and, on average, there would be 100 more days over 85°F (~29°C), 150 more days over 90°F (~32°C) and 35 more days over 95°F (35°C) each year.
With a two-degree increase in global temperature, every day would be warmer than the historical median, 350 days per year will be warmer than the historical 1-in-4 warmest days and 300 days per year will be warmer than the historical 1-in-10 warmest days.
For a global mean temperature increase of three degrees, Puerto Rico’s average daytime maximum temperature is projected to increase by up to +7°C in the dry season and +6°C in wet season.
Increases are projected to be greater for inland locations as compared to coastal and for nighttime temperatures (over +8°C) compared to daytime.
Per degree global mean temperature change, temperature on the warmest day of the year is projected to increase by +3°C while cooling degree-days (a measure of air conditioning demand) are projected to increase by +600. The range of daily temperature is expected to increase, particularly in the wet season.
Projected temperature changes are large enough to affect temperature sensitive crops, species, and ecosystems, while the combined effects of changes in temperature and precipitation are likely to increase the demand for energy, the risk of water stress and drought, and the risk of impacts from heavy rainfall events.
Following up on this work, Henareh et al. (2016) used Puerto Rico as a test case for studying the potential ecological and economic effects of climate change in tropical islands. Their analysis used outputs from 12 statistically downscaled general circulation models (GCMs) provided by Hayhoe (2013). Two strategies were used in selecting models for the study, first, the average of all available GCMs, then the average of the models that were able to reproduce the observed large-scale dynamics that control precipitation over the Caribbean. The projected means from the all-model ensemble showed increases of 7.5°–9°, 6.4°–7.6°, and 4.6°–5.4°C under the A2, A1B, and B1 scenarios respectively (Fig. 3).
Discussion of ImpactsAny scenario presented by Henareh et al. (2016) and Hayhoe (2013) presents acute challenges to the agricultural sector of Puerto Rico. Under high GHG emission scenario projections, climate controlled environments would almost assuredly be required for any viable agricultural operation. Such operations would necessitate massive investments in energy and water management infrastructure. If global efforts to limit average global warming to 1.5°C recently ratified at the Paris UNFCC COP are successful, Hayhoe (2013) indicates Puerto Rico may still experience a dramatic increase in total dry days and days that exceed historical temperature maximums (particularly in the w et season) (Hayhoe 2013). Prolonged dry periods are expected
5

to become more frequent with even 1°C of average global warming (Hayhoe 2013). Modeling indicates much of the mean temperature increase in Puerto Rico are due to increases in mean minimum temperatures indicating a narrower range of temperature variation (both annual and diurnal) and sustained higher temperatures(Karmalkar et al. 2013; Hayhoe 2013).
Increasing temperature trends can affect crops in a variety ways. An important aspect of increasing minimum temperatures is the affect such increases can have on the pollination stage of crops and other plants. The pollination stage is a critical period in which exposure to high temperatures can be particularly damaging to crops. Pollen release is related to development of fruit, grain, and/or fiber. Exposure to high temperatures during this period can greatly reduce crop yields and increase the risk of total crop failure. Plants exposed to high nighttime temperatures during the grain, fiber, or fruit production period experience lower productivity and reduced overall quality (Walthall et al. 2012).
Rising temperatures will also likely lead to increasing pressure from pests and disease, heat stress in animals, and unpredictable changes in the phenology of many plants. Heat stress among livestock and water shortages have already been voiced as a growing concern among many farmers in the US Caribbean and throughout the Latin American and the Caribbean countries (Gould et al. 2015). Higher temperatures can result in increased respiration rates in plants that in turn require greater soil moisture to maintain vitality and yields. Maintaining necessary moisture levels in light of increased temperatures and evapotranspiration rates will likely require a range of adaptation strategies including investment in water management infrastructure (irrigation, water storage, etc.) as well as a shift toward agroforestry and other agroecological practices that work to maintain soil moisture by increasing shade and decreasing ambient air temperatures (Gould et al. 2015). Rising temperatures are also likely to impact forest ecosystems throughout the Caribbean. Rising temperatures and other changes in climate are also expected to alter the distribution, population, and effects of existing forest pests and diseases and may lead to additional vulnerabilities to new pests and diseases or introduced invasive species.
6

Figure 3: Projected increase in mean temperature for Puerto Rico. From: Henareh et al., (2016).
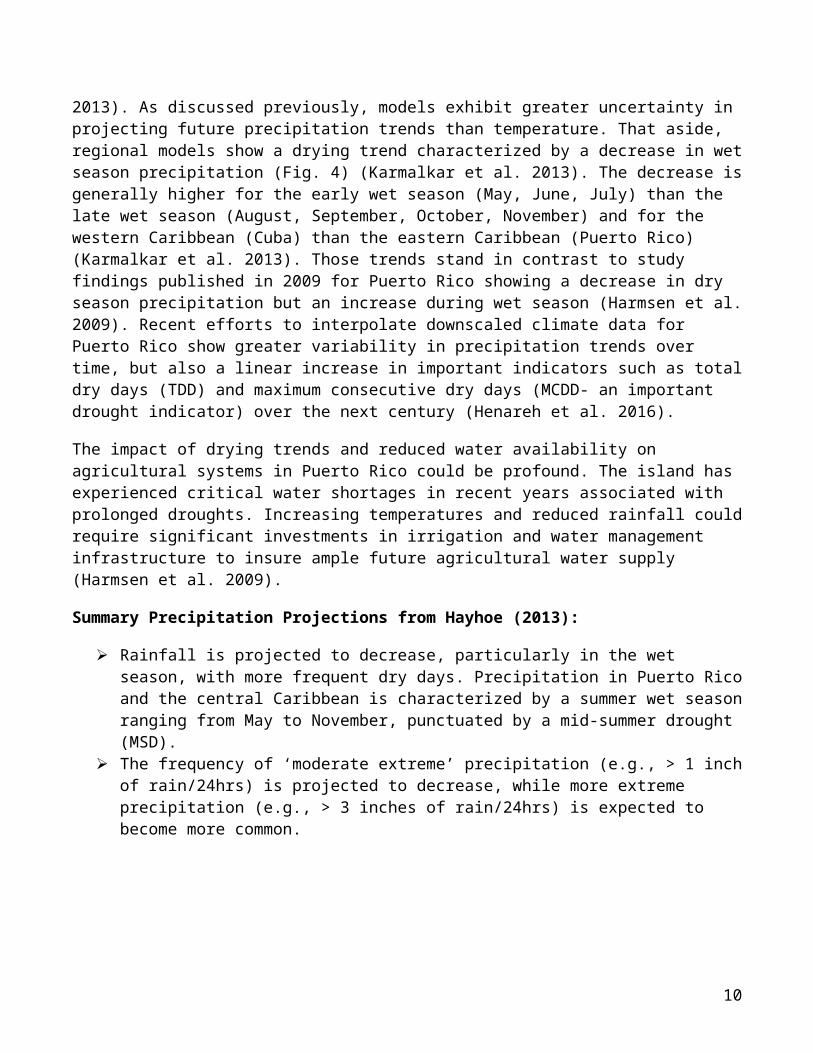
PrecipitationIncreasing mean surface air temperatures and sea-surface temperatures are tied to changes in larger global circulation patterns that correlate to rainfall patterns within the Caribbean (Karmalkar et al. 2013). As discussed previously, models exhibit greater uncertainty in projecting future precipitation trends than temperature. That aside, regional models show a drying trend characterized by a decrease in wet season precipitation (Fig. 4) (Karmalkar et al. 2013). The
7

decrease is generally higher for the early wet season (May, June, July) than the late wet season (August, September, October, November) and for the western Caribbean (Cuba) than the eastern Caribbean (Puerto Rico) (Karmalkar et al. 2013). Those trends stand in contrast to study findings published in 2009 for Puerto Rico showing a decrease in dry season precipitation but an increase during wet season (Harmsen et al. 2009). Recent efforts to interpolate downscaled climate data for Puerto Rico show greater variability in precipitation trends over time, but also a linear increase in important indicators such as total dry days (TDD) and maximum consecutive dry days (MCDD- an important drought indicator) over the next century (Henareh et al. 2016).
The impact of drying trends and reduced water availability on agricultural systems in Puerto Rico could be profound. The island has experienced critical water shortages in recent years associated with prolonged droughts. Increasing temperatures and reduced rainfall could require significant investments in irrigation and water management infrastructure to insure ample future agricultural water supply (Harmsen et al. 2009).
Summary Precipitation Projections from Hayhoe (2013):
Rainfall is projected to decrease, particularly in the wet season, with more frequent dry days. Precipitation in Puerto Rico and the central Caribbean is characterized by a summer wet season ranging from May to November, punctuated by a mid-summer drought (MSD).
The frequency of ‘moderate extreme’ precipitation (e.g., > 1 inch of rain/24hrs) is projected to decrease, while more extreme precipitation (e.g., > 3 inches of rain/24hrs) is expected to become more common.
8

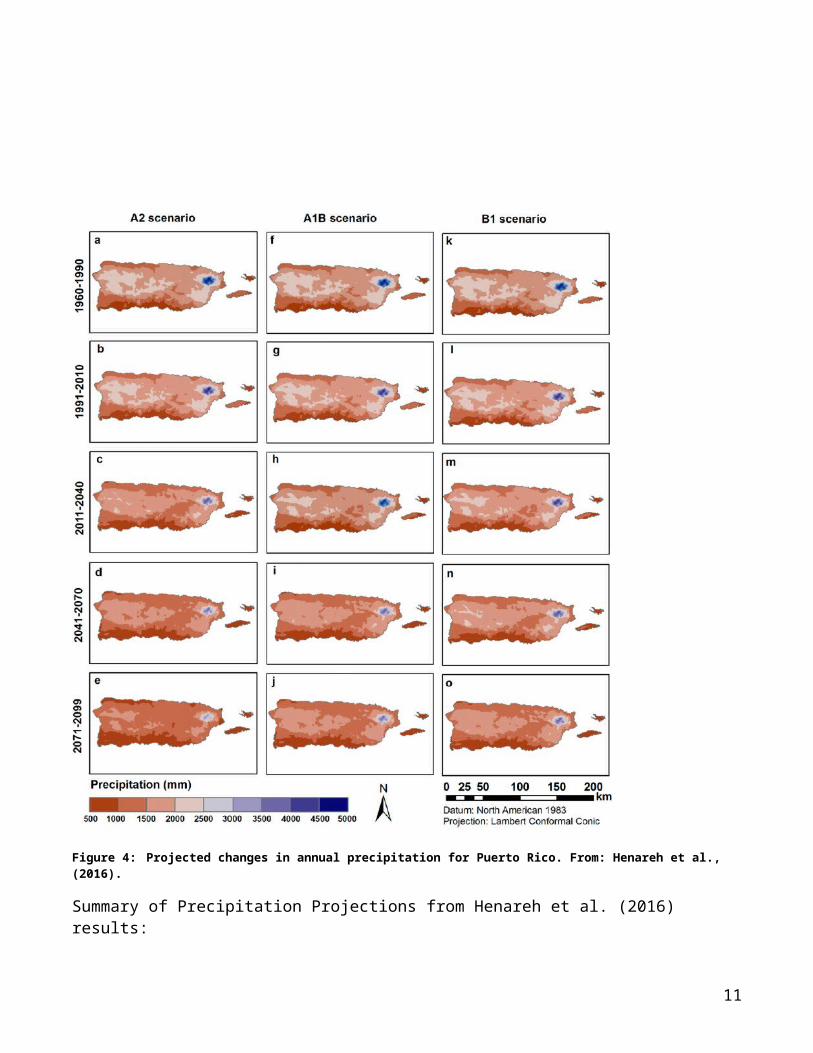
Figure 4: Projected changes in annual precipitation for Puerto Rico. From: Henareh et al., (2016).
Summary of Precipitation Projections from Henareh et al. (2016) results:
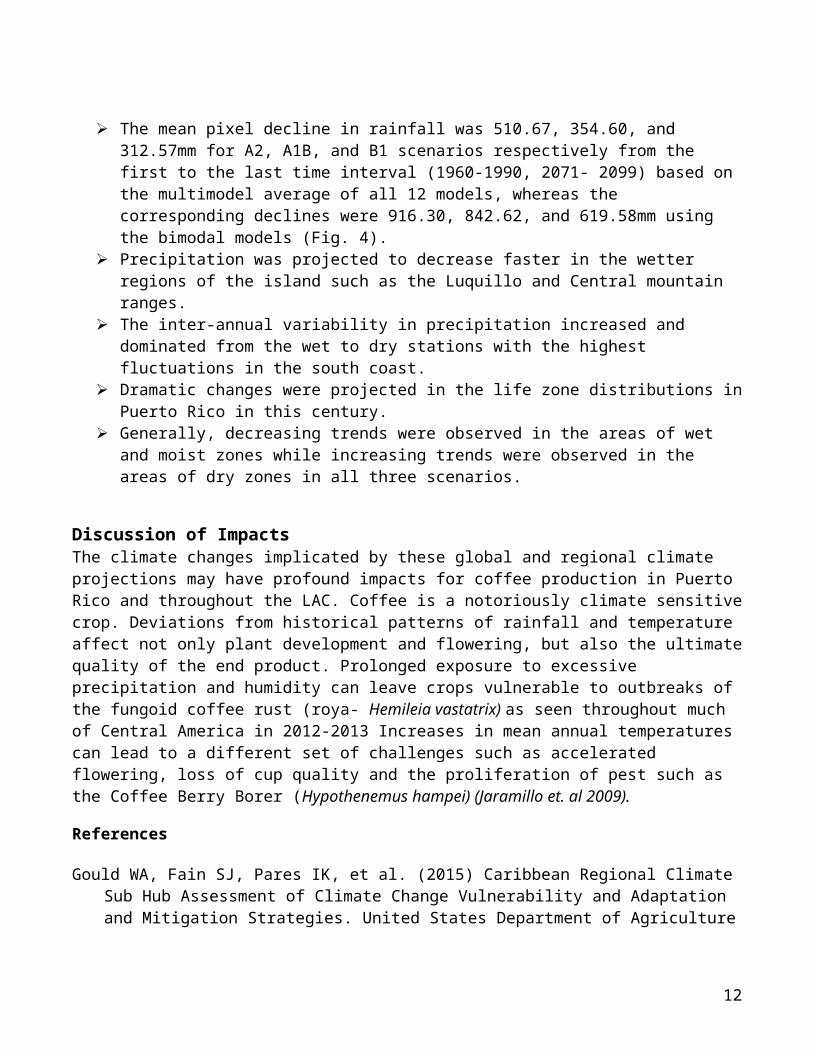
The mean pixel decline in rainfall was 510.67, 354.60, and 312.57mm for A2, A1B, and B1 scenarios respectively from the first to the last time interval (1960-1990, 2071- 2099) based on the multimodel average of all 12 models, whereas the corresponding declines were 916.30, 842.62, and 619.58mm using the bimodal models (Fig. 4).
Precipitation was projected to decrease faster in the wetter regions of the island such as the Luquillo and Central mountain ranges.
The inter-annual variability in precipitation increased and dominated from the wet to dry stations with the highest fluctuations in the south coast.
9
Dramatic changes were projected in the life zone distributions in Puerto Rico in this century.
Generally, decreasing trends were observed in the areas of wet and moist zones while increasing trends were observed in the areas of dry zones in all three scenarios.
Discussion of ImpactsThe climate changes implicated by these global and regional climate projections may have profound impacts for coffee production in Puerto Rico and throughout the LAC. Coffee is a notoriously climate sensitive crop. Deviations from historical patterns of rainfall and temperature affect not only plant development and flowering, but also the ultimate quality of the end product. Prolonged exposure to excessive precipitation and humidity can leave crops vulnerable to outbreaks of the fungoid coffee rust (roya- Hemileia vastatrix) as seen throughout much of Central America in 2012-2013 Increases in mean annual temperatures can lead to a different set of challenges such as accelerated flowering, loss of cup quality and the proliferation of pest such as the Coffee Berry Borer (Hypothenemus hampei) (Jaramillo et. al 2009).
References
Gould WA, Fain SJ, Pares IK, et al. (2015) Caribbean Regional Climate Sub Hub Assessment of Climate Change Vulnerability and Adaptation and Mitigation Strategies. United States Department of Agriculture
Harmsen EW, Miller NL, Schlegel NJ, Gonzalez JE (2009) Seasonal climate change impacts on evapotranspiration, precipitation deficit and crop yield in Puerto Rico. Agric Water Manag 96:1085–1095.
Hayhoe K (2012) Quantifying key drivers of climate variability and change for Puerto Rico and the Caribbean: Final report, Agreement.
Henareh A, Gould WA, Harmsen E, et al. (2016) Climate change implications for tropical islands: Interpolating and interpreting statistically downscaled GCM projections for management and planning. J Appl Meteorol Climatol 55:265–282.
Jaramillo J, Chabi-Olaye A, Kamonjo C, et al. (2009) Thermal tolerance of the coffee berry borer Hypothenemus hampei: Predictions of climate change impact on a tropical insect pest.
Karmalkar A V., Taylor MA, Campbell J, et al. (2013) A review of observed and projected changes in climate for the islands in the Caribbean. Atmósfera 26:283–309.
Walthall, CL, Hatfield, J, Backlund, P, Lengnick, L, Marshall, E, Walsh, M, Adkins, S, Aillery, M, Ainsworth, EA, Ammann, C, Anderson, CJ, Bartomeus, I, Baumgard, LH, Booker, F, Bradley, B, Blumenthal, DM, Bunce, J, Burkey, K, Dabney, SM, Delgado, JA, Dukes, J, Funk, A, Garrett, K, Glenn, M, Grantz, DA, Goodrich, D, Hu, S, Izaurralde, RC, Jones, RAC, Kim, S-H, Leaky, ADB, Lewers, K, Mader, TL, McClung, A, Morgan, J, Muth, DJ, Nearing, M, Oosterhuis, DM, Ort, D, Parmesan, C, Pettigrew, WT, Polley, HW, Rader, R, Rice, C, Rivington, M, Rosskopf, E, Salas,
10
WA, Sollenberger, LE, Srygley, R, Stöckle, C, Takle, ES, Timlin, D, White, JW, Winfree, R, Wright-Morton, L, & Ziska, LH. (2012). Climate Change and Agriculture in the United States: Effects and Adaptation. USDA Technical Bulletin 1935. (Technical Bulletin 1935). Washington, DC.
11
Appendix II: Coffee Harvest Statistics
Table 1: Coffee Supplies, Disposition and Consumption 1990/91-2013/2013 (Hundredweight). Source: Puerto Rico Planning Board, Agricultural Statistics Division, August 2015
12

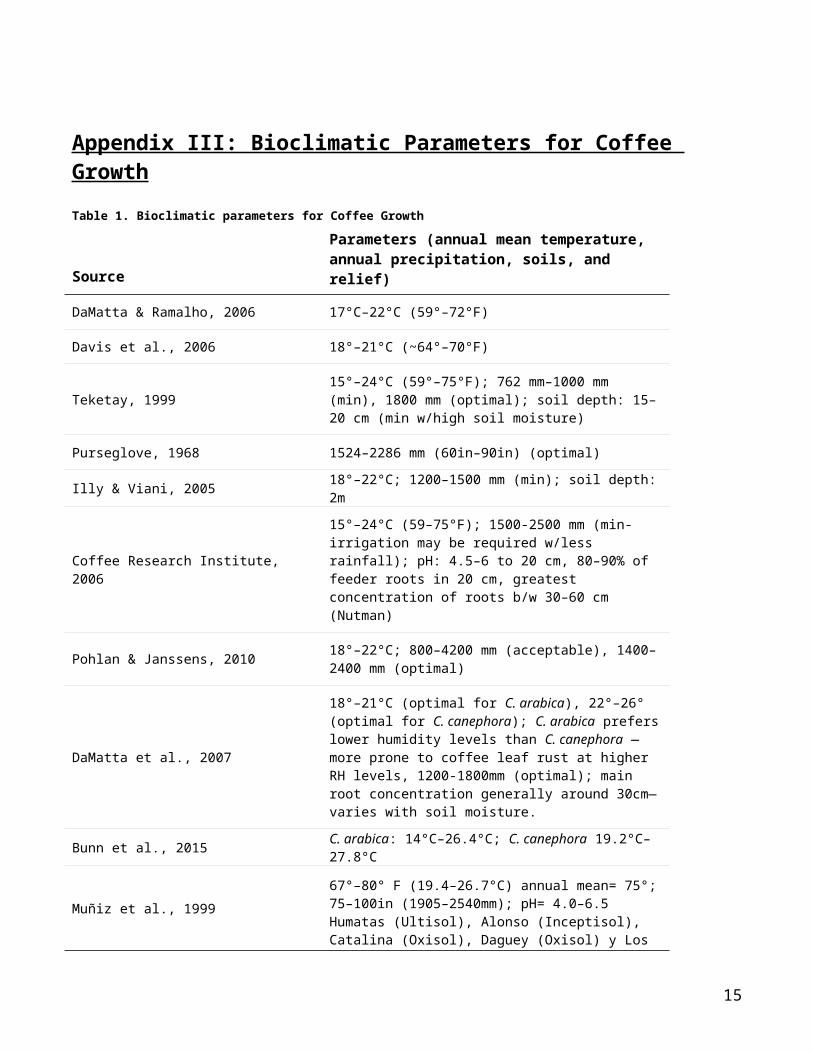
Appendix III: Bioclimatic Parameters for Coffee GrowthTable 1. Bioclimatic parameters for Coffee Growth
SourceParameters (annual mean temperature, annual precipitation, soils, and relief)
DaMatta & Ramalho, 2006 17°C–22°C (59°–72°F)
Davis et al., 2006 18°–21°C (~64°–70°F)
Teketay, 199915°–24°C (59°–75°F); 762 mm–1000 mm (min), 1800 mm (optimal); soil depth: 15–20 cm (min w/high soil moisture)
Purseglove, 1968 1524–2286 mm (60in–90in) (optimal)
Illy & Viani, 2005 18°–22°C; 1200–1500 mm (min); soil depth: 2m
Coffee Research Institute, 2006
15°–24°C (59–75°F); 1500-2500 mm (min-irrigation may be required w/less rainfall); pH: 4.5–6 to 20 cm, 80–90% of feeder roots in 20 cm, greatest concentration of roots b/w 30–60 cm (Nutman)
Pohlan & Janssens, 201018°–22°C; 800–4200 mm (acceptable), 1400–2400 mm (optimal)
DaMatta et al., 2007
18°–21°C (optimal for C. arabica), 22°–26° (optimal for C. canephora); C. arabica prefers lower humidity levels than C. canephora —more prone to coffee leaf rust at higher RH levels, 1200-1800mm (optimal); main root concentration generally around 30cm—varies with soil moisture.
Bunn et al., 2015 C. arabica: 14°C–26.4°C; C. canephora 19.2°C–27.8°C
Muñiz et al., 1999
67°–80° F (19.4–26.7°C) annual mean= 75°; 75–100in (1905–2540mm); pH= 4.0–6.5 Humatas (Ultisol), Alonso (Inceptisol), Catalina (Oxisol), Daguey (Oxisol) y Los Guineos (Oxisol);<= 50% slope between 600–3000ft (acceptable)1500–3000ft (optimal)
Table 2. Parameters used in the coffee suitability model
Source Parameters (annual mean temperature, annual precipitation, soils, and relief)
Natural Resources and Conservation Service (2016)
Soil series: Ultisol (Humatas), Inceptisol (Alonso), Oxisol (Catalina, Daguey, Los Guineos)
13

National Elevation Dataset, USGS (Gesch et al. 2002)
Elevation range: 182.99–914.4 mm (600–3000 feet)
Statistically downscaled climate data annual means (time blocks 1991–2010, 2001–2040, 2041–2070, 2071–2099), all model projections ensemble under three emissions scenarios (Henareh et al. 2016)
Precipitation (1991–2010 average): 1000–1905 mm, 1905–2540 mm Temperature (1991–2010 average): 18°–27° C
DiscussionAnnual precipitation of 1000 mm (~40in) is generally considered a minimum for C. arabica cultivation, although certain varieties have been document to grow in areas with annual rainfall totals as low as 762mm (30in) (Teketay 1999). Conditions considered optimal by some are provided by annual rainfall totals ranging from 1524–2286 mm (60in–90in) (Purseglove 1968); however, for most of the best coffee growing regions in Africa, Latin America and South-east Asia, rainfall totals are significantly above 1,800 mm (70in) annually. Precipitation should be well distributed throughout the year with a drier period (<70mm/month)(Illy & Viani 2005) of two to four months when surface feeding roots dry, growth slows, young wood hardens and flower buds develop (Van Hilten et. al 1992). Periods of rainfall after a dry spell can help synchronize flowering and therefore promote clearly defined harvesting seasons. Coffee producing countries with more than one wet and dry season will have correlating multiple harvesting seasons (CRI 2016).
As with temperature and precipitation, C. arabica has more particular soil requirements than that of C. canephora. Arabica prefers deep, well-drained soils that are slightly acidic. Soil profiles and drainage conditions are a critical factors in regional precipitation requirements as coffee is an evergreen and requires sub-soil water availability at all times (Teketay 1999). The degree to which water capacity and depth of soils are important are required correlates to rainfall, length of dry season, and potential evapotranspiration (PET) of a given area. Flowering usually coincides with the onset of rains following a dry period, and subsequent fruiting and flowering is very dependent on available soil moisture. Heavy clay soils can be difficult for deeper root penetration and lend themselves to flooding and waterlogging. Coffee will not tolerate long periods of inundation that create anaerobic soil conditions or limit oxygen intake by roots (Teketay 1999).
In regions where coffee is grown at the margins of its climatic niche (high temperature, low rainfall, longer dry season, etc.) deeper soils are necessary to maintain water supplies in times of high evapotranspiration, although any direct correlation has yet to be quantified, perhaps due to the dynamic nature of local factors that contribute to evapotranspiration. In the absence of deep soils, managing soil moisture can be accomplished through the use of cover crops, shade trees, or irrigation. Such management actions must be carefully monitored to prevent unnecessary competition with coffee crops.
Conversely, areas of abundant rainfall, high humidity and cloud cover, as well as a short dry season, have been documented to successfully grow Arabica in clay soils as shallow as 15 to 20cm (Teketay 1999). However, as with other crops, coffee grown in marginal soil conditions is more vulnerable to excessive rainfall or prolonged droughts, which can lead to reduced yields and
14
ultimately, increased mortality (Teketay 1999). These types of weather patterns are projected to increase in frequency in many coffee-producing regions of the Latin American and Caribbean countries and specifically Puerto Rico (Hayhoe 2012, Henareh 2016).
References:
Bunn C, Läderach P, Ovalle Rivera O, Kirschke D (2015) A bitter cup: climate change profile of global production of Arabica and Robusta coffee. Clim Change 129:89–101.
CRI-Coffee Research Institute Arabica and Robusta Coffee Plant. http://www.coffeeresearch.org/agriculture/coffeeplant.htm. Accessed 27 Jun 2016
DaMatta FM, Cochicho Ramalho JD (2006) Impacts of drought and temperature stress on coffee physiology and production: A review. Brazilian J. Plant Physiol. 18:55–81.
DaMatta FM, Ronchi CP, Maestri M, Barros RS (2007) Ecophysiology of coffee growth and production. Brazilian J. Plant Physiol. 19:485–510.
Davis AP, Gole TW, Baena S, Moat J (2012) The Impact of Climate Change on Indigenous Arabica Coffee (Coffea arabica): Predicting Future Trends and Identifying Priorities.
Gesch D, Oimoen M, Greenlee S, et al. (2002) The National Elevation Dataset.
Hayhoe K (2012) Quantifying key drivers of climate variability and change for Puerto Rico and the Caribbean: Final report, Agreement.
Henareh A, Gould WA, Harmsen E, et al. (2016) Climate change implications for tropical islands: Interpolating and interpreting statistically downscaled GCM projections for management and planning. J Appl Meteorol Climatol 55:265–282.
Malavolta E Nutrição Mineral, Calagem, Gessagem e Adubação do Careeiro. Summary in English.
Muñiz WG, Acin N, Hernández E, et al. (1999) CONJUNTO TECNOLOCICO PARA LA PRODUCCION DE CAFÉ. Universidad de Puerto Rico, Recinto Universitario de Mayaguez, Colegio de Ciencias Agrícolas, ESTACION EXPERIMENTAL AGRICOLA, San Juan, Puerto Rico
NRCS-Soil Survey Staff Web Soil Survey [Database]. In: Web Soil Surv. [Database]. http://websoilsurvey.nrcs.usda.gov/. Accessed 20 Jun 2007
Pohlan H, Janssens M (2010) Growth and production of coffee.
Purseglove JW (1968) Tropical Crops: Dicotyledons. Volumes 1 and 2.
Teketay D (1999) History, botany and ecological requirements of coffee. Walia 20:28–50.
15

Appendix VI: Change in area suitable for coffee growth in the top ten municipalities (Area in square kilometers)
16

ScenarioAM_1960_1990 Adjuntas Ciales Jayuya Lares Las Marías Maricao Orocovis San Sebastián Utuado Yauco Grand Total
0 15838.10 21937.48 21312.21 7678.15 2602.58 12634.54 14897.52 15635.57 16400.55 34768.50 163705.210.2 0.00 0.00 0.00 0.00 0.00 0.00 0.00 0.00 0.00 14776.24 14776.240.4 0.00 14064.28 0.00 62.13 27.52 0.00 58.00 10.58 6270.85 32710.90 53204.260.6 18645.37 38584.75 24527.73 33753.60 9954.03 3461.28 14770.71 60410.01 65406.79 54445.86 323960.120.8 65608.28 66551.02 37665.19 89390.42 66306.38 41099.81 106489.78 92255.80 168333.98 37677.20 771377.841 73683.79 31630.24 31837.20 28754.54 41556.09 37667.69 28958.81 16141.92 41612.08 3622.43 335464.79Grand Total 173775.54 172767.77 115342.32 159638.84 120446.60 94863.32 165174.82 184453.88 298024.25 178001.13 1662488.47
AM_A2_1991_2010 Adjuntas Ciales Jayuya Lares Las Marías Maricao Orocovis San Sebastián Utuado Yauco Grand Total
0 15838.10 21937.48 21312.21 7678.15 2602.59 12634.54 14897.52 15635.57 16400.55 34770.96 163707.670.2 0.00 0.00 0.00 0.00 0.00 0.00 0.00 0.00 0.00 17502.23 17502.230.4 0.00 16469.64 0.00 173.55 537.25 0.00 58.00 244.93 11381.97 30035.10 58900.440.6 29218.25 44593.59 28563.85 42018.64 11918.04 5868.44 22413.94 65465.53 91906.85 57323.44 399290.560.8 66041.09 58708.34 35418.78 82177.74 65717.54 42372.36 99623.56 87229.06 143288.38 34753.25 715330.101 62678.11 31058.71 30047.48 27590.75 39671.18 33987.97 28181.80 15878.79 35046.51 3616.16 307757.47Grand Total 173775.54 172767.77 115342.32 159638.84 120446.60 94863.32 165174.82 184453.88 298024.25 178001.13 1662488.47
AM_A2_2011_2040 Adjuntas Ciales Jayuya Lajas Las Marías Maricao Orocovis San Sebastián Utuado Yauco Grand Total
0 15838095.58 21937482.46 21312206.58 122455505.69 2602584.97 12634544.37 14897519.34 15635574.35 16400549.24 63117476.11 306831538.700.2 6677437.55 303920.72 4755946.85 103296.41 21607221.15 15517479.89 81373006.440.4 793997.03 14423260.06 1265989.32 3106044.64 7602865.84 670167.83 1062748.74 53945853.47 14554192.54 8659212.86 104226416.990.6 67932019.18 97168618.10 55271705.72 77929612.08 50682935.24 17581121.32 113993736.64 64241180.89 151790194.05 84240483.59 703165114.570.8 85565426.01 32548373.21 37038947.22 46701642.34 47742698.61 45666793.95 30686082.66 19408752.62 105180569.97 6392153.89 410229798.131 3646001.16 12603.48 453466.80 23919467.09 7059572.03 18207391.98 4534729.30 9615300.49 10098748.29 74326.29 53702139.83Grand Total 173775538.96 172767774.86 115342315.65 156678379.42 120446603.55 94863315.86 165174816.68 184453882.96 298024254.08 178001132.63 1659528014.66
AM_A2_2041_2070 Adjuntas Ciales Jayuya Lares Las Marías Maricao Orocovis San Sebastián Utuado Yauco Grand Total
0 15838.10 21937.48 21312.21 7678.15 2602.58 12634.54 14897.52 15635.57 16400.55 70086.91 199023.620.2 0.00 19581.14 0.00 369.74 9276.44 637.04 58.00 60420.59 14501.34 12497.68 117341.960.4 15292.68 95025.80 15019.40 108970.02 66376.99 32081.01 38828.33 92255.80 186681.23 71321.39 721852.640.6 66465.74 27784.12 57987.02 42591.78 42190.59 36123.23 85039.14 16141.92 65807.84 23162.54 463293.930.8 76179.02 8439.23 21023.69 29.15 0.00 13387.49 26351.83 0.00 14633.29 932.61 160976.32Grand Total 173775.54 172767.77 115342.32 159638.84 120446.60 94863.32 165174.82 184453.88 298024.25 178001.13 1662488.47
AM_A2_2071_2099 Adjuntas Ciales Jayuya Lares Las Marías Maricao Orocovis San Sebastián Utuado Yauco Grand Total
0 15838095.59 21937482.48 21312206.77 7678148.78 2602584.97 12634544.37 14897519.34 15635574.36 16400549.24 79207326.05 208144031.930.2 1245970.68 21072641.01 3769414.02 369735.43 9276436.69 702141.18 1627087.86 60420591.38 14554192.54 14645397.84 127683608.630.4 73062913.34 97425434.79 56990473.91 114890669.28 66387815.41 40316226.90 119321415.98 92255797.21 203581248.42 78961800.17 943193795.410.6 83628559.36 32332216.61 33270220.94 36700282.14 42179766.47 41210403.41 29328793.50 16141920.01 63488263.89 5186608.58 383467034.91Grand Total 173775538.97 172767774.88 115342315.64 159638835.63 120446603.55 94863315.86 165174816.68 184453882.96 298024254.09 178001132.64 1662488470.88
AM_A1B_1991_2010 Adjuntas Ciales Jayuya Lares Las Marías Maricao Orocovis San Sebastián Utuado Yauco Grand Total
0 173775538.93 172767774.84 115342315.65 159638835.68 120446603.57 94863315.95 165174816.67 184453882.78 298024254.22 178001132.64 1662488470.92Grand Total 173775538.93 172767774.84 115342315.65 159638835.68 120446603.57 94863315.95 165174816.67 184453882.78 298024254.22 178001132.64 1662488470.92
AM_A1B_2011_2040 Adjuntas Ciales Jayuya Lares Las Marías Maricao Orocovis San Sebastián Utuado Yauco Grand Total
0 15838095.59 21937482.46 21312206.57 7678148.78 2602584.97 12634544.37 14897519.34 15635574.35 16400549.23 55432102.03 184368807.680.2 8086963.62 369035.90 2574364.86 30895.06 2999196.58 1503168.30 24839172.41 40402796.740.4 1717.10 11788106.63 57854.81 5472687.71 9151972.78 640946.93 62595.31 69975043.63 14749527.43 5897266.91 117797719.230.6 44528630.97 71363792.76 38137282.11 48164918.59 17716315.75 11185458.70 59426528.96 58062619.92 118690578.30 64580985.72 531857111.780.8 76393942.01 35688787.25 39788662.26 71989695.76 56095079.08 45307452.28 65691556.37 34377947.23 117734654.01 24477741.75 567545518.001 37013153.30 23902642.12 16046309.90 25964348.88 32306286.14 25064018.52 25096616.71 3403501.26 28945776.81 2773863.83 220516517.47Grand Total 173775538.97 172767774.85 115342315.65 159638835.62 120446603.57 94863315.86 165174816.69 184453882.97 298024254.08 178001132.64 1662488470.89
AM_A1B_2071_2099 Adjuntas Ciales Jayuya Lares Las Marías Maricao Orocovis San Sebastián Utuado Yauco Grand Total
0 15838095.60 21937482.47 21312206.73 7678148.78 2602584.97 12634544.34 14897519.35 15635574.36 16400549.24 69506039.36 198442745.210.2 739532.48 19627717.57 1112448.03 369735.43 9276436.69 702141.18 963049.87 60420591.38 14554192.54 17313445.53 125079290.700.4 69554211.86 97818357.40 55710789.12 114890669.28 66386176.77 37316534.18 116419110.35 92201889.71 203441427.51 85906849.91 939646016.080.6 86709920.97 33157025.22 36054509.85 36700282.14 42179552.94 40637988.88 31448670.17 15642502.05 62953441.73 5274797.84 390758691.790.8 933778.05 227192.21 1152361.91 1852.17 3572107.28 1446466.93 553325.47 674643.07 8561727.11Grand Total 173775538.96 172767774.87 115342315.65 159638835.63 120446603.54 94863315.86 165174816.68 184453882.96 298024254.09 178001132.64 1662488470.88
Municipalities
17

AM_B1_1991_2010 Adjuntas Ciales Jayuya Lares Las Marías Maricao Orocovis San Sebastián Utuado Yauco Grand Total
0 15838095.29 21937482.32 21312206.65 7678148.79 2602585.25 12634544.16 14897519.33 15635574.30 16400549.34 34801744.49 163738449.930.2 18059141.17 18059141.170.4 16883678.85 1641.65 219376.59 667796.48 917.55 62595.31 432419.08 12593593.72 29511627.69 60373646.920.6 32250976.65 50522934.20 31793066.87 45135405.86 13925968.60 7819965.64 30334632.09 68235799.44 100341658.71 60250954.96 440611363.020.8 68107775.51 53524641.67 36973024.72 79275352.43 65011689.37 44329506.11 92081221.30 84277289.48 136070081.40 31913634.88 691564216.881 57578691.46 29899037.85 25262375.75 27330551.94 38238563.89 30078382.47 27798848.66 15872800.56 32618371.02 3464029.46 288141653.06Grand Total 173775538.92 172767774.89 115342315.64 159638835.61 120446603.59 94863315.94 165174816.69 184453882.86 298024254.19 178001132.65 1662488470.98
AM_B1_2011_2040 Adjuntas Ciales Jayuya Lares Las Marías Maricao Orocovis San Sebastián Utuado Yauco Grand Total
0 15838.10 21937.48 21312.21 7678.15 2602.58 12634.54 14897.52 15635.57 16400.55 56345.18 185281.890.2 0.00 3788.04 0.00 223.42 2191.60 0.00 0.00 3730.69 0.00 20799.30 30733.030.4 77.20 15814.49 78.10 2394.30 4735.79 364.46 63.03 58197.90 14472.34 6881.46 103079.080.6 49461.92 84153.15 41004.11 51078.22 18940.85 10984.03 70647.93 47890.53 123533.08 70853.81 568547.630.8 78005.19 27909.56 39038.69 72483.23 59765.78 46885.58 56494.95 44919.68 116263.65 20365.45 562131.781 30393.14 19165.05 13909.21 25781.51 32210.00 23994.70 23071.38 14079.51 27354.63 2755.93 212715.07Grand Total 173775.54 172767.77 115342.32 159638.84 120446.60 94863.32 165174.82 184453.88 298024.25 178001.13 1662488.47
AM_B1_2041_2070 Adjuntas Ciales Jayuya Lares Las Marías Maricao Orocovis San Sebastián Utuado Yauco Grand Total
0 15838.10 21937.48 21312.21 7678.15 2602.58 12634.54 14897.52 15635.57 16400.55 61778.86 190715.560.2 0.00 19581.14 0.00 369.74 9276.44 637.04 58.00 16670.52 14501.34 20620.57 81714.780.4 564.75 78064.69 701.89 31854.45 41295.18 2475.82 5471.93 87085.80 68754.84 45458.03 361727.370.6 65617.96 27718.08 53878.62 86703.75 50644.13 26258.37 98971.55 51200.44 128987.97 42927.12 632908.010.8 85613.23 25415.61 37062.58 28522.96 16067.23 41888.11 34229.89 13861.55 57685.09 6225.48 346571.731 6141.50 50.77 2387.02 4509.80 561.05 10969.43 11545.93 0.00 11694.46 991.07 48851.03Grand Total 173775.54 172767.77 115342.32 159638.84 120446.60 94863.32 165174.82 184453.88 298024.25 178001.13 1662488.47
AM_B1_2071_2099 Adjuntas Ciales Jayuya Lares Las Marías Maricao Orocovis San Sebastián Utuado Yauco Grand Total
0 15838.10 21937.48 21312.21 7678.15 2602.58 12634.54 14897.52 15635.57 16400.55 66256.34 195193.040.2 0.00 19581.14 0.00 369.74 9276.44 637.04 58.00 52510.03 14501.34 16288.80 113222.530.4 14746.62 95024.32 13272.55 105957.77 64970.20 23987.15 34424.61 86541.92 184020.11 70645.88 693591.130.6 64180.24 26581.85 57840.19 40322.39 42464.62 35082.89 88885.10 22073.09 63402.03 23774.34 464606.740.8 78523.66 9642.98 22898.52 5310.79 1132.76 22521.69 26909.60 7693.27 19700.22 1035.77 195369.251 486.92 0.00 18.85 0.00 0.00 0.00 0.00 0.00 0.00 0.00 505.77Grand Total 173775.54 172767.77 115342.32 159638.84 120446.60 94863.32 165174.82 184453.88 298024.25 178001.13 1662488.47
18

Appendix V: Change in area suitable for coffee growth in Puerto Rico
The following tables indicate the projected change in area within which mean annual temperatures are desirable for coffee growth. The tables indicate area values for the entirety of Puerto Rico.
Table 1: Change in area of suitable mean annual temperature for C. arabica along A2, A1B, and B1 IPCC SRES emissions scenarios.
Area of Temperature Suitability, C. arabica (18°-22°C)Emission Scenario 1960-
1990 (km2)
1991-2010 (km2)
2011-2040
(km2)
2041-2070
(km2)
2071-2099
(km2)A2 901 362 34 0 0A1B 901 336 23 0 0B1 901 355 36 1 0
Table 2: Change in area of suitable mean annual temperature for C. canephora along A2, A1B, and B1 IPCC SRES emissions scenarios
Area of Temperature Suitability, C. canephora (22°-27°C)Emission Scenario 1960-
1990 (km2)
1991-2010 (km2)
2011-2040
(km2)
2041-2070
(km2)
2071-2099
(km2)A2 8714 8438 4485 947 7A1B 8714 8350 4098 895 64B1 8714 8405 4752 2089 992
19