supplementary materials for - science...
TRANSCRIPT

advances.sciencemag.org/cgi/content/full/3/5/e1603055/DC1
Supplementary Materials for
Divergence of species responses to climate change
Songlin Fei, Johanna M. Desprez, Kevin M. Potter, Insu Jo, Jonathan A. Knott, Christopher M. Oswalt
Published 17 May 2017, Sci. Adv. 3, e1603055 (2017)
DOI: 10.1126/sciadv.1603055
This PDF file includes:
Supplementary Text
fig. S1. Average environmental conditions during the study period.
fig. S2. Relationships between changes in species abundance, PDSI, temperature,
and total tree basal area.
fig. S3. Box plots of functional trait values for species that experienced different
longitudinal shifts (E0, nonsignificantly eastward; E1, significantly eastward; W0,
nonsignificantly westward; W1, significantly westward).
fig. S4. Box plots of latitudinal and longitudinal stem density shifts by
physiological trait groups.
fig. S5. Box plots of functional trait values for species that experienced different
latitudinal shifts (N0, nonsignificantly northward; N1, significantly northward;
S0, nonsignificantly southward; S1, significantly southward).
fig. S6. Box plots of latitudinal and longitudinal stem density shifts by dispersal
trait groups.
fig. S7. Latitudinal species abundance shift mapped on a phylogram representing
evolutionary relationships among the 86 study species.
table S1A. Summary of shift percentage and distance by directions.
table S1B. Shift of species abundance for all trees during the last three decades.
table S1C. Shift of species abundance for sapling-sized trees during the last three
decades.
table S1D. Shift of species abundance for adult trees during the last three decades.
table S2. Linear mixed-effect model parameter estimates and significance for the
relationships between species relative density change and changes in
environmental variables and successional processes.
table S3. Description of functional traits used in the analysis.

table S4. Years during which the first inventory (T1) and second inventory (T2)
were completed for each state.
table S5. Species used in the study and their sample sizes and their mean density
at the first and second inventories.

Supplementary Text
1 Forest Inventory and Analysis (FIA) data
The FIA program monitors spatiotemporal patterns of forests resources at the national-level, using
a fixed grid of permanent plots. FIA provides a long-term dataset with a sampling intensity of
approximately one plot every 2,430 ha (6,000 ac). There are variations in the FIA program’s data
collection protocols over time and across states. Prior to 2000, all states were completely
surveyed periodically but asynchronously (i.e., there are variations in what years individual states
were sampled). After 2000, all states have been surveyed annually but partially using a rotating
panel system (i.e., only a portion of the states were surveyed annually) with plot remeasurement
occurring every 5-7 years in the east (see table S2 for the year of inventory for each state). During
the first inventory, some states in the south and southeastern U.S. recorded species information
only to the genus level for a group of species (see list below), but had species level identification
at the second inventory period.
2 Species selection criteria and related notes
• To be included, species needed to have data from a minimum of 300 plots across 50 hexagons
at both periods and to not have obvious spatial sampling biases.
• Species that were identified only at the genus level during the first inventory period were
aggregated and analyzed at the genus level even if species-level information was available for
the second inventory. This includes the following seven genera: Aesculus, Carya, Fraxinus,
Prunus, Salix, Tilia, Tsuga, and Ulmus.
• All non-native trees were excluded due to their rapid expansion.
• Acer nigrum (black maple, FIA species code 314) was combined with A. saccharum (sugar
maple, 318) since it is considered a sub-species of sugar maple; A. barbatum, also known as
A. floridanum (Florida maple, 311) was also combined with A. saccharum since it’s
considered a subspecies of sugar maple (A. saccharum subsp. floridanum).

• A. spicatum (mountain maple, 319) was excluded in our analysis due to its abnormally long
distance shift (159km/10yrs), potentially due to the miss-identification by field crew.
• Quercus texana (Nuttall oak, 828) was combined with Q. shumardii(Shumard oak, 834) since
they are closely related and geographically overlapping.
• Q. ellipsoidalis (northern pin oak, 809) was combined with Q. coccinea (scarlet oak, 806)
since the morphological similarity between them remains a source of confusion, especially in
Indiana and Illinois.
• Castanea dentata (American chestnut, 421), Cornus florida (flowering dogwood, 491) and
Juglans cinerea (butter nut, 601) were excluded as they were severely impacted by invasive
disease and are functionally eliminated from the eastern forests.
Final data used in this analysis are at Purdue University Research Repository
(doi:10.4231/R7FX77FC).
3 Calculation of weighted mean center
To investigate how the species abundances shifted between the two inventories, we calculated the
weighted mean center for each species/groups with the following equations
�̅� =∑ 𝑤𝑖𝑋𝑖
𝑛𝔦=1
∑ 𝑤𝑖𝑛𝑖=1
, �̅� =∑ 𝑤𝑖𝑌𝑖
𝑛𝔦=1
∑ 𝑤𝑖𝑛𝑖=1
where 𝑌 ̅is the mean abundance latitude and 𝑋 ̅is the mean abundance longitude, 𝑋𝑖 and 𝑌𝑖 are the
longitude and latitude for the centroid of each hexagon, and 𝑤𝑖 is the hexagon level total number
of stems by species. We used USA Contiguous Albers equal area conic projected system, which
better preserves areal calculation, to calculate the distance shifted between the two inventory
periods, and we used the GCS North America 1983 geographic coordinate system, which is more
accurate for directional calculations, to determine the shift direction.

4 Test of statistical significance of shift distance
Due to the non-normality of the distribution of many species’ abundances, a non-parametric
random permutation process was used to determine whether the distance between the weighted
centers at two inventory periods for each species was statistically significant. To conduct the
random permutation process, each centroid was randomly assigned with a “new” pair of weights
at T1 and T2 from all pairs of observed weights. Then the “new” weighted mean centers were
calculated for each inventory, and the distance between the two centers was calculated. A total of
10,000 permutations was run for each species, providing a probability function of distance
between weighted mean centers. A z-score and p-value were then calculated for the actual
observed shift distance between the two weighted mean centers for each species. Bearing between
the mean centers of the two inventory periods was also calculated for each species using
geosphere R package (Agostinelli C & Lund U (2013) R package circular: Circular Statistics
(version 0.4-7)).

fig. S1. Average environmental conditions during the study period. (A) Mean annual
temperature, (B) average total annual precipitation, (C) average Palmer Drought Severity Index
(PDSI) for the study period, and (D) change in PDSI between the recent past (1951-1980) and the
study period. Larger PDSI values indicate higher moisture availability. Temperature and
precipitation data were obtained from the PRISM Climate Group (http://prism.oregonstate.edu/),
and the PDSI data were obtained from WestWide Drought Tracker
(http://www.wrcc.dri.edu/wwdt/).
A B
C D
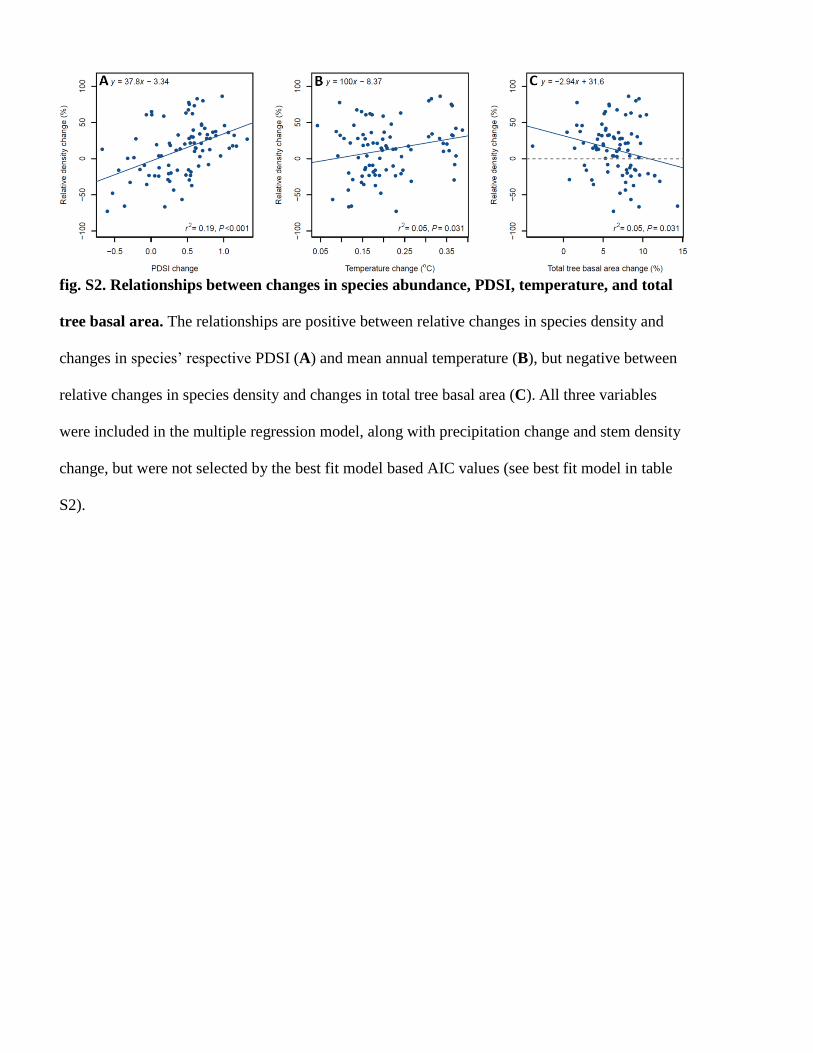
fig. S2. Relationships between changes in species abundance, PDSI, temperature, and total
tree basal area. The relationships are positive between relative changes in species density and
changes in species’ respective PDSI (A) and mean annual temperature (B), but negative between
relative changes in species density and changes in total tree basal area (C). All three variables
were included in the multiple regression model, along with precipitation change and stem density
change, but were not selected by the best fit model based AIC values (see best fit model in table
S2).

fig. S3. Box plots of functional trait values for species that experienced different longitudinal
shifts (E0, nonsignificantly eastward; E1, significantly eastward; W0, nonsignificantly
westward; W1, significantly westward). Median value is labeled for each group for each
variable. Kruskal-Wallis one-way analysis of variance was applied to each variable to test the
difference among the groups, where the groups were found be significantly different for
maximum precipitation, wood density, and seed weight with a p-value of 0.077, 0.039, and 0.012,
respectively. All other variables are not statistically different with a p-value >0.1.

fig. S4. Box plots of latitudinal and longitudinal stem density shifts by physiological trait
groups. Positive values indicate northward or eastward shift and negative values indicate
southward or westward shift. Median value is labeled for each group for each variable. Kruskal-
Wallis one-way analysis of variance was applied to each variable to test the difference between
the groups. All traits were non-significant (p-value >0.05) except for latitudinal and longitudinal
shifts for drought tolerance (p-value = 0.03 and 0.02, respectively)

fig. S5. Box plots of functional trait values for species that experienced different latitudinal
shifts (N0, nonsignificantly northward; N1, significantly northward; S0, nonsignificantly
southward; S1, significantly southward). Median value is labeled for each group for each
variable. Kruskal-Wallis one-way analysis of variance was applied to each variable to test the
difference among the groups, where the groups were found be significantly different for
maximum elevation, maximum precipitation, and wood density, with a P-value of 0.085, 0.002,
0.055 respectively. All other variables are not statistically different with a P-value >0.1.
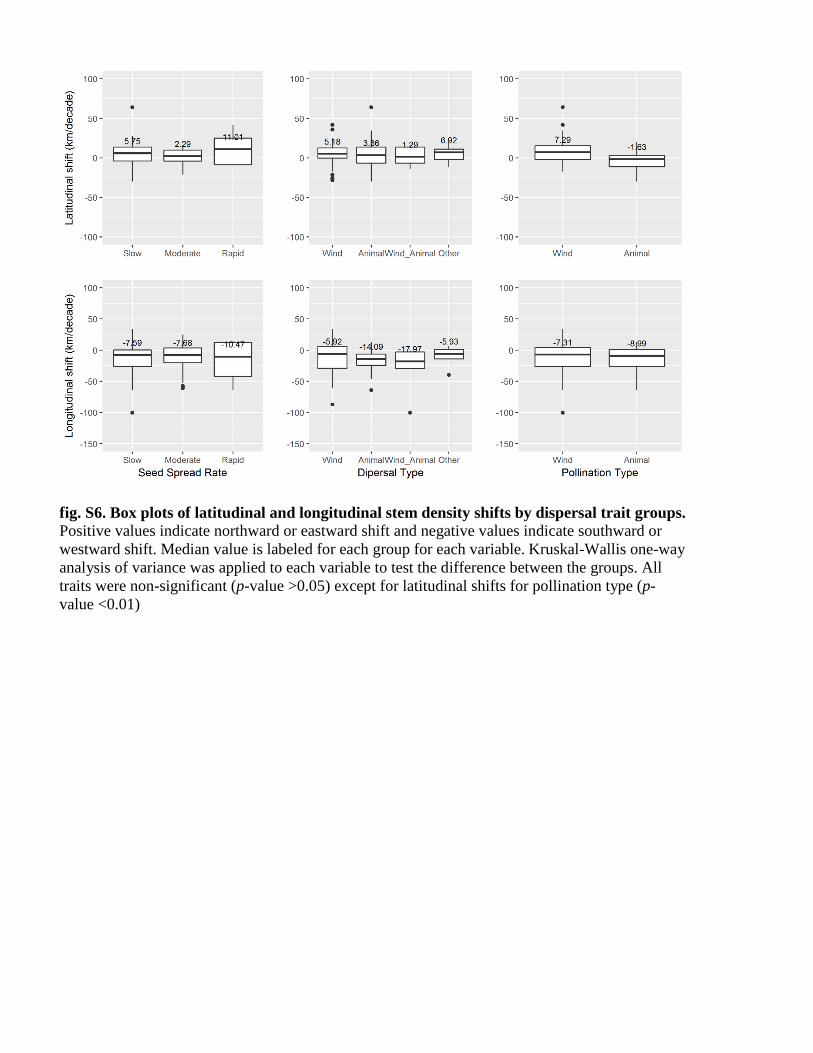
fig. S6. Box plots of latitudinal and longitudinal stem density shifts by dispersal trait groups. Positive values indicate northward or eastward shift and negative values indicate southward or
westward shift. Median value is labeled for each group for each variable. Kruskal-Wallis one-way
analysis of variance was applied to each variable to test the difference between the groups. All
traits were non-significant (p-value >0.05) except for latitudinal shifts for pollination type (p-
value <0.01)

fig. S7. Latitudinal species abundance shift mapped on a phylogram representing
evolutionary relationships among the 86 study species.
Pinus strobus
Pinus resinosaPinus banksiana
Pinus virginianaPinus taedaPinus rigidaPinus serotinaPinus echinata
Pinus ellio
ttii
Pinus palustr
is
Pinus g
labra
Picea
rube
ns
Picea
mar
iana
Pice
a gl
auca
Larix
laric
ina
Abi
es b
alsa
mea
Tsug
a ca
nade
nsis
Juni
peru
s vi
rgin
iana
Thu
ja o
ccid
enta
lis
Taxo
dium
dis
tichu
m
Taxo
dium
asc
ende
nsA
cer negundo
Acer rubrum
Acer saccharinum A
cer
sacc
haru
mA
cer pensylvanicum
Aesculus spp
Tilia spp
Robinia pseudoacacia
Gleditsia triacanthos
Cercis canadensis
Betula lenta
Betula alleghaniensis
Betula papyrifera
Betula populifolia
Ostrya virginiana
Carpinus carolinianaCarya sppJuglans nigraQuercus stellata
Quercus lyrata
Quercus macrocarpa
Quercus bicolor
Quercus michauxii
Quercus muehlenbergii
Quercus prinus
Quercus alba
Quercus virginiana
Que
rcus
laev
isQ
uerc
us fa
lcat
a
Quercus la
urifolia
Quercu
s nigr
a
Quercus p
hellos
Quercus pagoda
Que
rcus
shu
mar
dii
Quercus palustris
Que
rcus
rubr
a
Que
rcus
coc
cine
a
Quercus imbricaria
Querc
us m
arila
ndica
Que
rcus
vel
utin
a
Fagu
s gr
andi
folia
Pru
nus
spp
Ulm
us s
ppM
aclu
ra p
omife
raC
eltis sppP
opulus tremuloides
Populus grandidentata
Populus balsam
iferaP
opulus deltoidesS
alix sppLiquidam
bar styraciflua
Nyssa sylvatica
Nyssa aquatica
Oxydendrum
arboreum
Gordonia lasianthus
Diospyros virginiana
Ilex opaca
Fraxinus nigra
Fraxinus spp
Platanus occidentalis
Magnolia virginiana
Magnolia acuminata
Liriodendron tulipifera
Sassafras albidum
Persea borbonia
●●●●
●●
●●
●●
●●
●●
●●
●●●●●●●●●●
●●●
●●
●●
●●
●●
●●
●
●●●
●●●
●
●
● ●
●
●●
●
●
●
●●
●
●
●
● ● ● ● ● ● ● ● ● ●●
●●
●●
●●
●●●●●●●●
●●
●●
Northward, significantNorthward, not significant
Southward, significantSouthward, not significant
●●
●●
Northward, significantNorthward, not significant
Southward, significantSouthward, not significant

table S1A. Summary of shift percentage and distance by directions.
Measure North South East West All direction
% % Si* Median (km
dec-1)
% % Si Median (km
dec-1)
% % Si Median (km
dec-1)
% % Si Median (km
dec-1)
Median (km dec-
1)
All stems 61.6 54.7 11.0 38.4 42.4 8.5 26.7 21.7 7.0 73.3 65.1 15.4 19.9 Saplings 59.3 56.9 13.1 40.7 40.0 9.7 29.1 24.0 11.8 70.9 60.7 20.7 23.6 Adults 55.8 58.3 12.5 44.2 50.0 2.5 30.2 38.5 9.1 69.8 65.0 15.6 18.9
* Percentage of species that shifted significantly at P< 0.05 among all species shifted in the respective directions.

table S1B. Shift of species abundance for all size trees during the last three decades. Scientific name Long shift
(km dec-1) Long shift
P value Lat shift
(km dec-1) Lat shift P value
Azimuth (degree)
SN EW Rate (km dec-1)
Region
Abies balsamea -0.6 0.479 7.7 0.002 7 N W 7.7 210 Juniperus virginiana. -64.0 <0.001 -8.5 0.076 268 S W 64.6 220 Larix laricina -28.5 0.019 5.9 0.045 286 N W 29.1 210 Picea glauca -100.1 <0.001 -5.1 0.213 278 S W 100.2 210 Picea mariana 33.7 0.003 4.1 0.054 87 N E 33.9 210 Picea rubens 1.4 0.396 6.6 0.169 27 N E 6.7 210 Pinus banksiana 14.5 0.139 10.9 0.084 57 N E 18.1 210 Pinus echinata -52.4 <0.001 15.3 0.007 290 N W 54.6 230 Pinus elliottii -5.4 0.230 -10.4 0.004 215 S W 11.7 230 Pinus glabra 5.0 0.333 2.1 0.307 72 N E 5.5 230 Pinus palustris 28.7 0.002 14.7 0.006 69 N E 32.3 230 Pinus resinosa -46.8 <0.001 14.7 0.004 294 N W 49.1 210 Pinus rigida 29.0 0.009 19.1 0.077 68 N E 34.7 220 Pinus serotina 7.6 0.180 2.1 0.431 85 N E 7.9 230 Pinus strobus -44.8 <0.001 5.8 0.182 289 N W 45.2 210 Pinus taeda 4.1 0.165 -0.1 0.480 97 S E 4.1 230 Pinus virginiana -10.5 0.034 -9.1 0.033 238 S W 13.9 220 Taxodium distichum 7.0 0.306 23.4 0.002 22 N E 24.4 230 Taxodium ascendens -5.9 0.288 -2.1 0.420 259 S W 6.3 230 Thuja occidentalis 15.8 0.094 12.4 <0.001 60 N E 20.1 210 Tsuga canadensis 5.1 0.254 13.0 0.023 34 N E 14.0 210 Acer negundo -7.6 0.224 -5.9 0.252 237 S W 9.6 220 Acer pensylvanicum 5.6 0.287 2.4 0.394 80 N E 6.1 210 Acer rubrum -13.6 <0.001 4.6 0.079 297 N W 14.4 220 Acer saccharinum -30.4 0.022 -0.7 0.473 274 S W 30.4 250 Acer saccharum -7.9 0.025 -21.3 <0.001 209 S W 22.7 210 Aesculus -19.1 0.054 5.3 0.220 292 N W 19.8 220 Betula alleghaniensis 24.9 0.005 8.7 0.052 84 N E 26.4 210 Betula lenta -15.0 0.004 -17.3 0.005 233 S W 22.8 220 Betula papyrifera 14.4 0.077 11.0 <0.001 62 N E 18.1 210 Betula populifolia 12.7 0.074 25.0 0.003 42 N E 28.0 210 Carpinus caroliniana -0.5 0.462 15.8 0.003 5 N W 15.9 220 Carya spp. -11.9 <0.001 7.5 0.004 307 N W 14.1 220 Celtis spp. -19.1 0.005 17.3 0.003 315 N W 25.8 230 Cercis canadensis -10.1 0.111 -14.1 0.004 222 S W 17.3 220 Diospyros virginiana -26.8 <0.001 -10.9 0.007 253 S W 28.9 230 Fagus grandifolia -11.6 0.006 -11.2 0.015 238 S W 16.2 210 Fraxinus spp. -37.9 <0.001 35.9 <0.001 320 N W 52.2 220 Fraxinus nigra -6.5 0.228 9.8 0.001 332 N W 11.7 210 Gleditsia triacanthos -64.2 <0.001 -29.9 0.002 249 S W 70.8 220 Gordonia lasianthus -2.8 0.389 2.4 0.423 319 N W 3.7 230 Ilex opaca -14.9 0.014 -2.5 0.292 268 S W 15.1 230 Juglans nigra -8.0 0.168 15.3 0.002 337 N W 17.3 220 Liquidambar styraciflua 0.9 0.377 2.4 0.127 27 N E 2.6 230 Liriodendron tulipifera -7.3 0.024 -7.0 0.040 235 S W 10.1 220 Maclura pomifera -37.4 0.008 6.6 0.269 283 N W 38.0 220 Magnolia acuminata 12.8 0.118 20.2 0.061 41 N E 23.9 220 Magnolia virginiana -25.9 0.001 -7.1 0.106 262 S W 26.9 230 Nyssa aquatica -39.6 0.007 -11.7 0.115 260 S W 41.3 230 Nyssa sylvatica 11.3 0.003 13.5 <0.001 47 N E 17.6 220 Ostrya virginiana -30.7 <0.001 16.0 0.004 303 N W 34.6 220 Oxydendrum arboreum 1.1 0.385 6.9 0.009 17 N E 7.0 220 Persea borbonia -26.1 0.007 -2.9 0.337 272 S W 26.2 230 Platanus occidentalis -7.4 0.279 -12.0 0.090 218 S W 14.1 220 Populus balsamifera 2.1 0.443 0.3 0.478 87 N E 2.1 210 Populus deltoides -41.9 0.053 42.1 0.018 319 N W 59.4 220 Populus grandidentata -57.6 <0.001 16.5 0.003 294 N W 60.0 210 Populus tremuloides -61.1 <0.001 10.5 <0.001 285 N W 62.0 210 Prunus spp. -43.2 <0.001 -17.7 <0.001 256 S W 46.6 220

Quercus alba -15.4 <0.001 -7.6 0.019 250 S W 17.2 220 Quercus bicolor -14.1 0.293 34.5 0.020 344 N W 37.3 220 Quercus coccinea -27.9 0.001 64.0 <0.001 344 N W 69.9 220 Quercus falcata -14.9 0.003 -0.1 0.495 275 S W 14.9 230 Quercus pagoda -2.1 0.433 -2.9 0.315 220 S W 3.6 230 Quercus imbricaria -29.6 0.013 -1.8 0.381 270 S W 29.7 250 Quercus laevis -10.7 0.124 -6.0 0.214 249 S W 12.3 230 Quercus laurifolia -19.0 0.010 -9.7 0.022 250 S W 21.3 230 Quercus lyrata 3.4 0.434 -10.7 0.193 166 S E 11.2 230 Quercus macrocarpa -5.8 0.291 -0.3 0.490 268 S W 5.8 220 Quercus marilandica -46.1 <0.001 8.4 0.112 284 N W 46.8 230 Quercus michauxii -21.6 0.092 -12.0 0.125 247 S W 24.7 230 Quercus muehlenbergii 6.4 0.253 8.1 0.094 43 N E 10.3 220 Quercus nigra -22.6 <0.001 -5.6 0.012 262 S W 23.2 230 Quercus palustris -4.2 0.425 13.8 0.129 349 N W 14.5 220 Quercus phellos -7.0 0.251 6.9 0.121 319 N W 9.9 230 Quercus prinus 4.9 0.112 3.4 0.201 65 N E 5.9 220 Quercus rubra -2.6 0.283 16.6 <0.001 359 N W 16.8 220 Quercus shumardii -42.1 0.010 28.1 0.007 307 N W 50.6 230 Quercus stellata -11.2 0.013 12.9 <0.001 322 N W 17.1 230 Quercus velutina -1.3 0.403 20.5 <0.001 2 N W 20.5 220 Quercus virginiana -12.2 0.192 22.1 0.004 339 N W 25.2 230 Robinia pseudoacacia -20.4 0.042 11.0 0.087 306 N W 23.2 220 Salix spp. -87.1 <0.001 -25.3 0.119 261 S W 90.7 220 Sassafras albidum -11.7 0.031 0.9 0.420 281 N W 11.7 220 Tilia spp. -14.4 0.030 11.0 0.052 313 N W 18.1 220 Ulmus spp. -21.5 0.000 -28.4 <0.001 222 S W 35.6 220

table S1C. Shift of species abundance for sapling-sized trees during the last three decades. Scientific name Long shift
(km dec-1) Long shift
P value Lat shift
(km dec-1) Lat shift P value
Azimuth (degree)
SN EW Rate (km dec-1)
Abies balsamea -10.8 0.197 6.9 0.004 315 N W 12.8 Juniperus virginiana. -63.4 <0.001 -11.5 0.028 266 S W 64.5 Larix laricina -24.0 0.055 8.8 0.009 295 N W 25.6 Picea glauca -129.1 <0.001 -6.5 0.201 279 S W 129.2 Picea mariana 34.7 0.003 5.0 0.033 86 N E 35.1 Picea rubens 2.3 0.349 8.5 0.122 31 N E 8.8 Pinus banksiana 14.7 0.171 17.8 0.036 44 N E 23.1 Pinus echinata -52.8 <0.001 13.5 0.031 288 N W 54.5 Pinus elliottii -14.4 0.071 -9.7 0.054 243 S W 17.4 Pinus glabra -5.2 0.378 3.9 0.261 313 N W 6.5 Pinus palustris 36.7 0.002 16.6 0.011 72 N E 40.2 Pinus resinosa -75.7 0.001 20.9 0.010 292 N W 78.5 Pinus rigida 21.8 0.112 13.1 0.259 71 N E 25.5 Pinus serotina 12.8 0.121 8.5 0.314 67 N E 15.3 Pinus strobus -45.0 <0.001 13.5 0.053 298 N W 47.0 Pinus taeda 11.8 0.017 4.1 0.103 76 N E 12.5 Pinus virginiana -13.3 0.030 -10.8 0.037 240 S W 17.1 Taxodium distichum 20.1 0.191 39.8 0.002 33 N E 44.6 Taxodium ascendens -3.6 0.350 -4.2 0.342 228 S W 5.6 Thuja occidentalis 45.1 0.006 23.4 <0.001 71 N E 50.8 Tsuga canadensis 12.8 0.124 25.5 0.004 39 N E 28.5 Acer negundo -10.2 0.178 -13.4 0.104 222 S W 16.9 Acer pensylvanicum 5.8 0.272 2.7 0.400 79 N E 6.4 Acer rubrum -13.1 <0.001 6.0 0.061 303 N W 14.4 Acer saccharinum -48.5 0.008 -8.2 0.328 266 S W 49.1 Acer saccharum -5.4 0.134 -22.1 <0.001 202 S W 22.8 Aesculus -20.6 0.063 6.1 0.198 293 N W 21.5 Betula alleghaniensis 26.5 0.018 9.4 0.078 83 N E 28.2 Betula lenta -14.8 0.015 -15.4 0.028 236 S W 21.4 Betula papyrifera -12.9 0.161 8.4 0.005 314 N W 15.4 Betula populifolia 12.6 0.091 26.2 0.003 40 N E 29.0 Carpinus caroliniana -0.6 0.460 14.6 0.007 4 N W 14.6 Carya spp. -14.4 <0.001 3.5 0.152 289 N W 14.9 Celtis spp. -22.0 0.003 10.0 0.076 298 N W 24.2 Cercis canadensis -9.5 0.126 -14.0 0.004 221 S W 16.9 Diospyros virginiana -27.2 <0.001 -12.2 0.003 251 S W 29.8 Fagus grandifolia -13.1 0.006 -11.6 0.023 241 S W 17.4 Fraxinus spp. -41.2 <0.001 37.2 <0.001 319 N W 55.5 Fraxinus nigra -5.2 0.299 10.6 0.001 339 N W 11.8 Gleditsia triacanthos -68.9 <0.001 -56.3 <0.001 235 S W 89.0 Gordonia lasianthus -4.5 0.323 -0.4 0.492 274 S W 4.6 Ilex opaca -17.2 0.007 -3.9 0.187 265 S W 17.6 Juglans nigra 6.6 0.310 21.5 0.003 22 N E 22.5 Liquidambar styraciflua 0.0 0.492 1.7 0.229 7 N E 1.7 Liriodendron tulipifera -6.4 0.083 -4.6 0.165 243 S W 7.9 Maclura pomifera -36.7 0.022 15.2 0.127 295 N W 39.7 Magnolia acuminata 14.0 0.119 23.4 0.076 39 N E 27.2 Magnolia virginiana -27.8 0.001 -7.3 0.122 263 S W 28.7 Nyssa aquatica -49.5 0.048 -20.9 0.121 254 S W 53.8 Nyssa sylvatica 8.7 0.022 10.7 0.001 46 N E 13.8 Ostrya virginiana -29.3 <0.001 17.1 0.003 306 N W 33.9 Oxydendrum arboreum 2.7 0.257 7.6 0.011 28 N E 8.1 Persea borbonia -24.0 0.012 -2.2 0.374 273 S W 24.1 Platanus occidentalis -15.2 0.223 -22.8 0.044 220 S W 27.4 Populus balsamifera -10.4 0.306 -1.2 0.394 268 S W 10.5 Populus deltoides -34.7 0.221 -2.3 0.476 271 S W 34.7 Populus grandidentata -76.0 <0.001 18.6 0.012 292 N W 78.2 Populus tremuloides -69.7 <0.001 11.2 0.001 285 N W 70.6 Prunus spp. -47.3 <0.001 -14.7 0.008 261 S W 49.5 Quercus alba -16.6 0.002 -12.7 0.006 239 S W 20.9

Quercus bicolor -34.0 0.176 43.1 0.048 328 N W 54.9 Quercus coccinea -55.2 <0.001 89.2 <0.001 336 N W 104.9 Quercus falcata -20.8 0.001 -4.1 0.126 264 S W 21.2 Quercus pagoda -1.5 0.462 -5.1 0.252 200 S W 5.4 Quercus imbricaria -39.8 0.008 -3.4 0.312 269 S W 39.9 Quercus laevis -12.0 0.099 -7.1 0.192 247 S W 13.9 Quercus laurifolia -20.7 0.009 -8.9 0.043 254 S W 22.6 Quercus lyrata 9.2 0.388 -16.4 0.167 154 S E 18.8 Quercus macrocarpa 1.5 0.453 3.3 0.391 27 N E 3.6 Quercus marilandica -47.6 0.001 5.9 0.227 281 N W 48.0 Quercus michauxii -28.2 0.107 -16.2 0.100 247 S W 32.5 Quercus muehlenbergii 4.5 0.360 15.0 0.023 21 N E 15.7 Quercus nigra -26.6 <0.001 -5.6 0.018 264 S W 27.2 Quercus palustris 29.9 0.210 21.2 0.110 61 N E 36.6 Quercus phellos -4.2 0.378 10.9 0.056 344 N W 11.6 Quercus prinus 6.7 0.182 1.4 0.425 86 N E 6.9 Quercus rubra -17.7 0.012 28.8 <0.001 336 N W 33.8 Quercus shumardii -44.0 0.043 14.1 0.180 291 N W 46.2 Quercus stellata 4.1 0.267 8.8 0.009 29 N E 9.7 Quercus velutina 3.7 0.314 22.9 <0.001 15 N E 23.2 Quercus virginiana -15.7 0.099 31.0 0.001 341 N W 34.7 Robinia pseudoacacia -13.8 0.172 8.5 0.203 309 N W 16.2 Salix spp. -107.2 <0.001 -28.2 0.160 263 S W 110.8 Sassafras albidum -12.0 0.037 -1.4 0.390 270 S W 12.1 Tilia spp. -21.6 0.021 27.2 0.002 327 N W 34.7 Ulmus spp. -20.5 <0.001 -28.9 <0.001 220 S W 35.4

table S1D. Shift of species abundance for adult trees during the last three decades. Scientific name Long shift
(km dec-1) Long shift
P value Lat shift
(km dec-1) Lat shift P value
Azimuth (degree)
SN EW Rate (km dec-1)
Abies balsamea 55.1 <0.001 26.3 <0.001 91 N E 55.8 Juniperus virginiana. -60.7 <0.001 -3.4 0.420 274 S W 60.7 Larix laricina -33.8 0.005 -9.9 0.160 269 S W 33.9 Picea glauca -35.5 0.024 -5.6 0.344 276 S W 35.6 Picea mariana 34.7 0.005 1.1 0.443 95 N E 34.7 Picea rubens -4.0 0.196 -14.0 0.209 236 S W 6.2 Pinus banksiana 7.8 0.203 3.3 0.418 86 N E 7.9 Pinus echinata -55.4 <0.001 48.3 0.001 291 N W 57.7 Pinus elliottii 2.5 0.358 -36.4 <0.001 176 S E 12.6 Pinus glabra 14.9 0.058 -0.7 0.480 96 S E 14.9 Pinus palustris 21.3 0.003 32.1 0.007 70 N E 23.9 Pinus resinosa -34.6 0.001 43.4 0.001 299 N W 37.6 Pinus rigida 45.5 0.003 86.4 0.050 69 N E 54.1 Pinus serotina 6.9 0.189 1.2 0.483 97 N E 6.9 Pinus strobus -43.5 <0.001 -21.1 0.111 273 S W 44.1 Pinus taeda -11.0 0.003 -23.9 <0.001 240 S W 13.7 Pinus virginiana -3.5 0.181 -7.4 0.215 243 S W 4.3 Taxodium distichum -1.6 0.455 25.5 0.108 355 N W 8.8 Taxodium ascendens -10.9 0.094 8.9 0.360 294 N W 11.3 Thuja occidentalis -33.1 0.001 -17.5 0.012 269 S W 33.6 Tsuga canadensis -6.9 0.077 -23.1 0.028 234 S W 10.4 Acer negundo 0.3 0.491 45.2 0.025 6 N E 15.3 Acer pensylvanicum -19.4 0.093 -95.2 0.018 225 S W 37.6 Acer rubrum -18.3 <0.001 -19.1 0.015 261 S W 19.4 Acer saccharinum -5.3 0.330 19.2 0.243 326 N W 8.4 Acer saccharum -18.9 <0.001 -68.2 <0.001 229 S W 29.9 Aesculus -10.1 0.180 4.6 0.410 286 N W 10.2 Betula alleghaniensis 15.9 0.008 11.7 0.135 88 N E 16.4 Betula lenta -14.0 0.001 -64.6 <0.001 225 S W 26.0 Betula papyrifera 56.7 <0.001 26.5 <0.001 89 N E 57.4 Betula populifolia 9.0 0.124 40.6 0.056 48 N E 16.4 Carpinus caroliniana -13.6 0.030 12.2 0.275 292 N W 14.2 Carya spp. -9.0 0.001 39.0 <0.001 331 N W 16.0 Celtis spp. -9.7 0.094 119.8 <0.001 350 N W 41.8 Cercis canadensis -34.0 0.001 -38.7 0.033 255 S W 36.5 Diospyros virginiana -21.9 0.007 -2.4 0.453 273 S W 21.9 Fagus grandifolia -10.8 0.008 -48.6 <0.001 225 S W 19.7 Fraxinus spp. -26.9 <0.001 85.1 <0.001 324 N W 39.4 Fraxinus nigra -15.6 0.034 15.6 0.053 293 N W 16.5 Gleditsia triacanthos -54.8 <0.001 59.4 0.005 293 N W 58.4 Gordonia lasianthus 7.0 0.212 53.8 0.068 30 N E 19.5 Ilex opaca 20.9 0.025 57.5 0.001 55 N E 28.6 Juglans nigra -22.9 <0.001 25.1 0.018 296 N W 24.5 Liquidambar styraciflua 4.3 0.063 21.0 <0.001 37 N E 8.3 Liriodendron tulipifera -8.6 0.001 -24.8 0.004 234 S W 12.0 Maclura pomifera -40.8 <0.001 -68.4 0.003 244 S W 47.0 Magnolia acuminata 9.7 0.070 38.8 0.044 46 N E 16.4 Magnolia virginiana -9.1 0.118 -5.6 0.352 264 S W 9.3 Nyssa aquatica -26.4 0.011 -1.6 0.473 275 S W 26.4 Nyssa sylvatica 31.4 <0.001 100.0 <0.001 49 N E 46.2 Ostrya virginiana -27.2 <0.001 47.0 0.014 308 N W 31.5 Oxydendrum arboreum -6.2 0.060 12.0 0.114 311 N W 7.4 Persea borbonia -60.4 <0.001 -51.7 0.035 263 S W 62.9 Platanus occidentalis 1.2 0.435 18.2 0.119 17 N E 6.3 Populus balsamifera 28.1 0.019 -1.8 0.439 95 S E 28.1 Populus deltoides -45.6 0.005 237.3 <0.001 334 N W 92.5 Populus grandidentata -7.2 0.215 13.3 0.158 310 N W 8.5 Populus tremuloides -20.9 0.001 13.6 0.019 288 N W 21.4 Prunus spp. -30.5 <0.001 -109.3 <0.001 229 S W 48.0 Quercus alba -15.6 <0.001 -13.9 0.039 260 S W 16.3
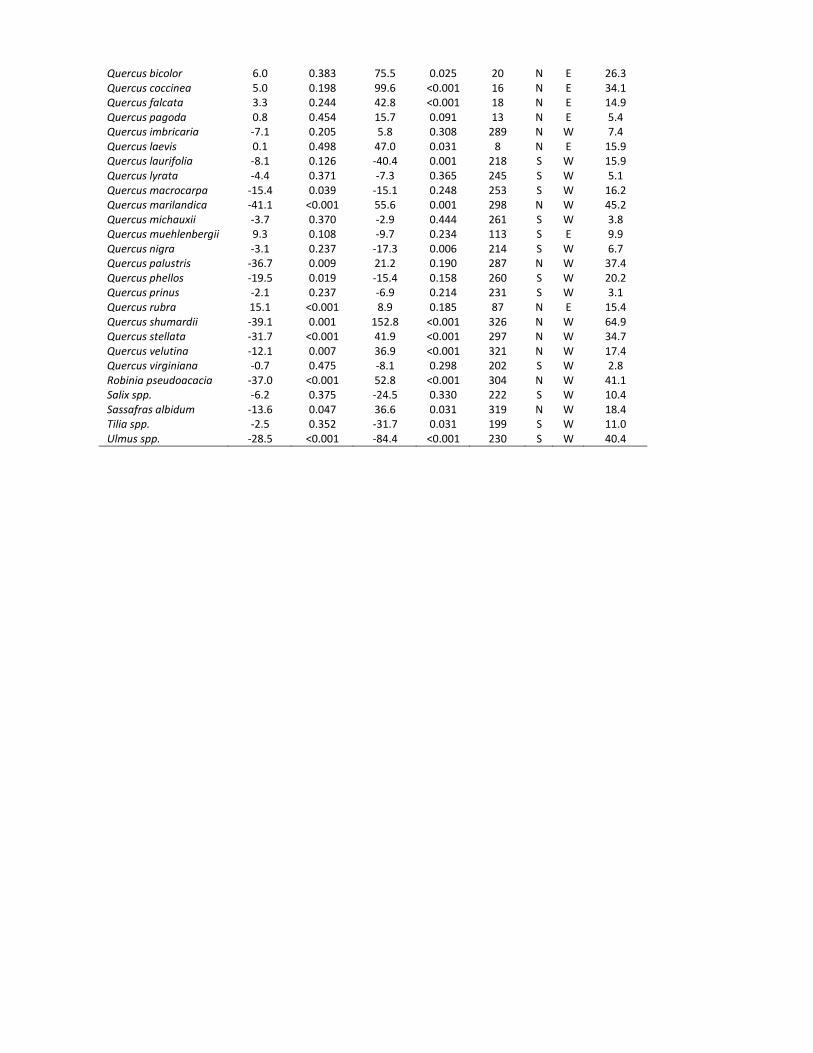
Quercus bicolor 6.0 0.383 75.5 0.025 20 N E 26.3 Quercus coccinea 5.0 0.198 99.6 <0.001 16 N E 34.1 Quercus falcata 3.3 0.244 42.8 <0.001 18 N E 14.9 Quercus pagoda 0.8 0.454 15.7 0.091 13 N E 5.4 Quercus imbricaria -7.1 0.205 5.8 0.308 289 N W 7.4 Quercus laevis 0.1 0.498 47.0 0.031 8 N E 15.9 Quercus laurifolia -8.1 0.126 -40.4 0.001 218 S W 15.9 Quercus lyrata -4.4 0.371 -7.3 0.365 245 S W 5.1 Quercus macrocarpa -15.4 0.039 -15.1 0.248 253 S W 16.2 Quercus marilandica -41.1 <0.001 55.6 0.001 298 N W 45.2 Quercus michauxii -3.7 0.370 -2.9 0.444 261 S W 3.8 Quercus muehlenbergii 9.3 0.108 -9.7 0.234 113 S E 9.9 Quercus nigra -3.1 0.237 -17.3 0.006 214 S W 6.7 Quercus palustris -36.7 0.009 21.2 0.190 287 N W 37.4 Quercus phellos -19.5 0.019 -15.4 0.158 260 S W 20.2 Quercus prinus -2.1 0.237 -6.9 0.214 231 S W 3.1 Quercus rubra 15.1 <0.001 8.9 0.185 87 N E 15.4 Quercus shumardii -39.1 0.001 152.8 <0.001 326 N W 64.9 Quercus stellata -31.7 <0.001 41.9 <0.001 297 N W 34.7 Quercus velutina -12.1 0.007 36.9 <0.001 321 N W 17.4 Quercus virginiana -0.7 0.475 -8.1 0.298 202 S W 2.8 Robinia pseudoacacia -37.0 <0.001 52.8 <0.001 304 N W 41.1 Salix spp. -6.2 0.375 -24.5 0.330 222 S W 10.4 Sassafras albidum -13.6 0.047 36.6 0.031 319 N W 18.4 Tilia spp. -2.5 0.352 -31.7 0.031 199 S W 11.0 Ulmus spp. -28.5 <0.001 -84.4 <0.001 230 S W 40.4

table S2. Linear mixed-effect model parameter estimates and significance for the
relationships between species relative density change and changes in environmental
variables and successional processes. The initial model included changes in precipitation,
temperature and drought index (PDSI), and changes in total stem density and basal area. Genus
was added as a random effect within each model. Only the best fit model, determined by AIC
values, is listed below. The significance of the parameters was accessed with maximum likelihood
ratio tests.
Response variable Predictor variable Coefficient estimate
SE t-value P-value
Species relative density change Precipitation change 0.593 0.157 3.78 <0.001
Total tree stem density change 0.710 0.282 2.52 0.017
table S3. Description of functional traits used in the analysis. The primary data sources are
from USDA NRCS Plant Database (http://plants.usda.gov/), Flora of North America
(http://floranorthamerica.org/), and Tree Functional Attributes and Ecological Database
(http://db.worldagroforestry.org/). The database we compiled are available at Purdue University
Research Repository (doi:10.4231/R7B8564P).
Traits Description
Physiological Tolerance Maximum Elevation (m) The maximum elevation where a species can be found, primarily as a
measure of temperature tolerance (USDA NRCS*). Minimum Temperature ( ̊C) The minimum tolerable temperature is the lowest temperature
recorded in the plant’s historical range (USDA NRCS). Minimum Precipitation (mm) A measure of minimum rainfall requirement, which is expressed as the
average annual minimum precipitation that occurs 20% of the time at the driest climate station within the known geographical range of the plant (USDA NRCS).
Maximum Precipitation (mm)
A measure of maximum tolerable rainfall, which is found by using the wettest climate stations within an individual species range and finding the average annual maximum precipitation (USDA NRCS).
Wood density (g cm-3) The specific gravity of wood, as an indicator of drought tolerance. Fire Tolerance The level that a plant can reestablish (resprout or regrow) from seeds
after a fire. The categories are none, low, medium, and high based on the USDA NRCS definition.
Drought Tolerance The relative tolerance of the plant to drought conditions compared to other species with the same growth habit from the same geographical region. The categories are none, low, medium, and high based on the USDA NRCS definition.
Shade Tolerance The relative tolerance of the plant to shade conditions compared to other species with the same growth habit from the same geographical region. The categories are none, low, medium, and high based on the USDA NRCS definition.
Moisture Use Ability to use (i.e., remove) available soil moisture relative to other species in the same (or similar) soil moisture availability region. The categories are low, medium, and high based on the USDA NRCS definition.
Dispersal Ability Seed Weight (mg seed-1) The weight of seeds, as a measure of seed mobility. Seed Spread Rate The capability of the plant to spread through its seed production
compared to other species with the same growth habit. The categories are slow, moderate, rapid, based on the USDA NRCS definition.
Seed Dispersal Type The dispersal agent for seeds. The categories are wind, animal, wind & animal, other.
Pollination type The pollination agent. The primary categories are wind, animal, wind & animal
*Description of USDA NRCS based traits can be found at https://plants.usda.gov/charinfo.html

table S4. Years during which the first inventory (T1) and second inventory (T2) were
completed for each state. Average inventory interval is 29.5 years between T1 and T2, with a
minimum of 20 years and maximum of 35 years. State T1 T2 Interval (yrs) Alabama 1982 2015 33 Arkansas 1988 2015 27 Connecticut 1985 2015 30 Delaware 1986 2015 29 Florida 1980 2014 34 Georgia 1982 2014 32 Illinois 1985 2015 30 Indiana 1986 2015 29 Iowa 1990 2015 25 Kansas 1981 2015 34 Kentucky 1988 2013 25 Louisiana 1984 2014 30 Maine 1995 2015 20 Maryland 1986 2015 29 Massachusetts 1985 2015 30 Michigan 1980 2015 35 Minnesota 1990 2015 25 Mississippi 1987 2015 28 Missouri 1989 2015 26 Nebraska 1983 2015 32 New Hampshire 1983 2015 32 New Jersey 1987 2015 28 New York 1993 2015 22 North Carolina 1984 2015 31 North Dakota 1980 2015 35 Ohio 1983 2015 32 Oklahoma 1986 2014 28 Pennsylvania 1989 2015 26 Rhode Island 1985 2015 30 South Carolina 1986 2015 29 South Dakota 1980 2015 35 Tennessee 1980 2013 33 Texas 1986 2014 28 Vermont 1983 2015 32 Virginia 1985 2014 29 West Virginia 1989 2015 26 Wisconsin 1983 2015 32

table S5. Species used in the study and their sample sizes and their mean density at the first
and second inventory. Species Code Scientific Name N1 N2 Density T1
(stems ha-1) Density T2
(stems ha-1) 12 Abies balsamea 352 360 327.8 567.7 68 Juniperus virginiana. 1005 1284 49.9 64.0 71 Larix laricina 302 306 32.4 56.7 94 Picea glauca 315 357 27.0 32.4 95 Picea mariana 262 250 97.6 129.5 97 Picea rubens 172 180 124.9 232.7
105 Pinus banksiana 212 178 67.3 47.5 110 Pinus echinata 755 669 85.4 28.8 111 Pinus elliottii 362 308 199.4 133.8 115 Pinus glabra 117 115 7.2 7.5 121 Pinus palustris 369 328 35.2 35.7 125 Pinus resinosa 415 418 30.2 33.5 126 Pinus rigida 239 214 29.0 19.9 128 Pinus serotina 183 126 42.1 11.5 129 Pinus strobus 731 796 43.8 58.7 131 Pinus taeda 771 852 218.2 351.0 132 Pinus virginiana 387 386 84.5 64.5 221 Taxodium distichum 398 382 17.1 15.5 222 Taxodium ascendens 187 179 110.0 57.6 241 Thuja occidentalis 317 311 119.3 131.6 261 Tsuga canadensis 536 532 51.6 67.3 313 Acer negundo 1009 1210 17.2 23.5 315 Acer pensylvanicum 292 299 50.0 89.8 316 Acer rubrum 1834 1860 163.4 185.3 317 Acer saccharinum 602 583 19.2 22.6 318 Acer saccharum 1391 1406 106.2 109.4 330 Aesculus 335 301 13.0 21.1 371 Betula alleghaniensis 546 530 48.8 59.2 372 Betula lenta 282 338 47.4 86.7 375 Betula papyrifera 501 486 88.3 80.8 379 Betula populifolia 165 153 50.7 52.7 391 Carpinus caroliniana 1208 1183 38.3 42.7 400 Carya spp. 1816 1827 80.1 65.5 460 Celtis spp. 1128 1365 23.2 33.9 471 Cercis canadensis 675 727 25.6 31.1 521 Diospyros virginiana 979 964 19.1 15.4 531 Fagus grandifolia 1155 1136 50.5 82.3 540 Fraxinus spp. 2263 2292 46.1 53.0 543 Fraxinus nigra 482 464 51.2 72.6 552 Gleditsia triacanthos 626 660 9.6 13.2 555 Gordonia lasianthus 118 109 50.2 56.6 591 Ilex opaca 517 569 36.6 58.9 602 Juglans nigra 1001 1102 9.5 12.6 611 Liquidambar styraciflua 963 976 173.4 207.1 621 Liriodendron tulipifera 962 964 45.1 71.5 641 Maclura pomifera 328 421 23.5 34.3 651 Magnolia acuminata 234 257 6.7 8.1 653 Magnolia virginiana 433 430 54.9 46.7 691 Nyssa aquatica 272 233 31.4 20.2 693 Nyssa sylvatica 1155 1215 60.8 55.1 701 Ostrya virginiana 1381 1374 33.3 49.2 711 Oxydendrum arboreum 520 517 70.5 54.2 721 Persea borbonia 297 277 36.8 37.0 731 Platanus occidentalis 937 897 4.3 7.3 741 Populus balsamifera 267 227 32.2 45.1 742 Populus deltoides 744 592 8.5 9.7 743 Populus grandidentata 662 604 27.6 35.3 746 Populus tremuloides 667 619 135.2 178.2 760 Prunus spp. 1983 2073 36.0 46.7

802 Quercus alba 1685 1546 58.7 45.1 804 Quercus bicolor 350 237 6.8 8.6 806 Quercus coccinea 968 901 22.2 18.6 812 Quercus falcata 884 828 34.2 25.9 813 Quercus pagoda 473 488 11.4 13.6 817 Quercus imbricaria 240 249 14.8 19.7 819 Quercus laevis 185 140 81.8 28.2 820 Quercus laurifolia 450 478 42.9 54.7 822 Quercus lyrata 380 303 9.6 6.8 823 Quercus macrocarpa 621 590 26.2 30.7 824 Quercus marilandica 620 428 31.8 13.9 825 Quercus michauxii 447 396 5.0 4.4 826 Quercus muehlenbergii 472 470 11.7 15.0 827 Quercus nigra 746 762 66.2 109.2 830 Quercus palustris 342 286 9.3 12.6 831 Quercus phellos 594 576 18.1 18.8 832 Quercus prinus 542 507 53.0 42.0 833 Quercus rubra 1572 1496 30.9 27.8 834 Quercus shumardii 375 402 5.4 9.7 835 Quercus stellata 1010 967 50.5 28.7 837 Quercus velutina 1399 1282 35.8 22.5 838 Quercus virginiana 194 216 34.3 28.8 901 Robinia pseudoacacia 624 705 25.5 21.5 920 Salix spp. 974 935 11.6 14.1 931 Sassafras albidum 1095 1059 34.4 26.6 950 Tilia spp. 1120 1041 17.8 20.1 970 Ulmus spp. 2112 2204 60.9 69.6