supplementary materials for - · supplementary materials for ... total rna was isolated from...
TRANSCRIPT

www.sciencemag.org/cgi/content/full/337/6102/1658/DC1
Supplementary Materials for
Mutations in the neverland Gene Turned Drosophila pachea into an
Obligate Specialist Species
Michael Lang, Sophie Murat, Andrew G. Clark, Géraldine Gouppil, Catherine Blais,
Luciano M. Matzkin, Émilie Guittard, Takuji Yoshiyama-Yanagawa, Hiroshi Kataoka,
Ryusuke Niwa, René Lafont, Chantal Dauphin-Villemant, Virginie Orgogozo*
*To whom correspondence should be addressed.
E-mail: [email protected]
Published 28 September 2012, Science 337, 1658 (2012)
DOI: 10.1126/science.1224829
This PDF file includes:
Materials and Methods
Supplementary Text
Figs. S1 to S13
Tables S1 to S11
References

Materials and methods
Drosophila strains and fly cultureThe 2-286-GAL4 (from C. S. Thummel) (18) and UAS-nvd-RNAi-IR-1 (9) lines were described previously. Line w1118 was used for in situ hybridization. Non-melanogaster Drosophila species were obtained from the San Diego Drosophila Stock Center (San Diego, CA, USA): D. pachea (15090-1698.01, -1698.02 and -1698.05), D. acanthoptera (15090-1693.00), D. nannoptera (15090-1692.01), D. wassermani (15090-11697.11), D. robusta (15020-1111.10) and D. mojavensis (15081-1352.22). The three D. pachea strains were collected in 1996 in El Cardonal (Sonora, Mexico), in 1997 in Organ Pipe National Monument (Arizona, US) and in 2007 in Punta Ohna (Sonora, Mexico). Flies were raised at 25°C on standard medium containing 83 g of dry baker's yeast, 83 g of maize flour, 11 g of agar and 25 mL of 10% methyl 4-hydroxybenzoate (dissolved in ethanol) in 1 L of water. Tubes containing standard fly food (10 g) were supplemented with 60 microliters of a 5-mg/mL 7DHC (Sigma, Saint Louis) solution or of a 1-mg/mL lathosterol (Sigma) solution. D. melanogaster transgenic flies were produced by FlyFacility, Clermont-Ferrand. We have raised D. pachea stock 15090-1698.02 on an artificial diet supplemented with 7DHC for more than four years (~60 generations) with no apparent defect. For the rescue experiment, we scored progeny flies according to sex and visible markers from more than 8 vials per food condition and per cross. More than 1000 progeny flies were scored in total for each condition (Table S4).
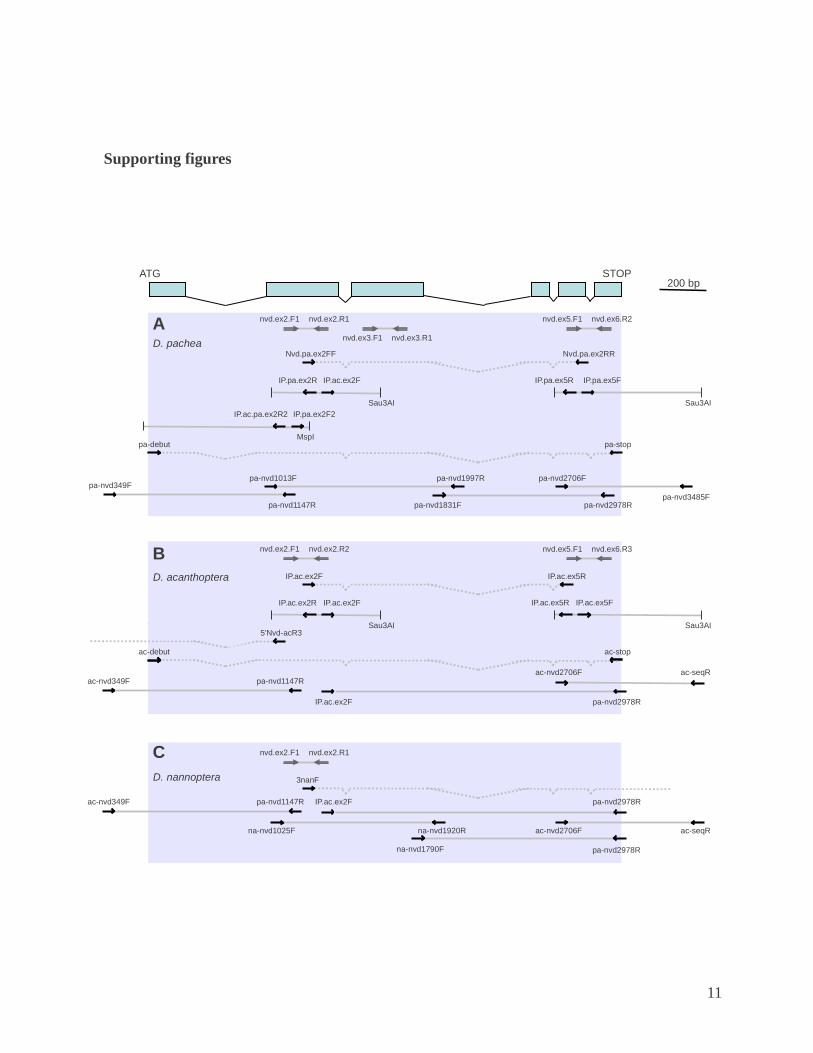
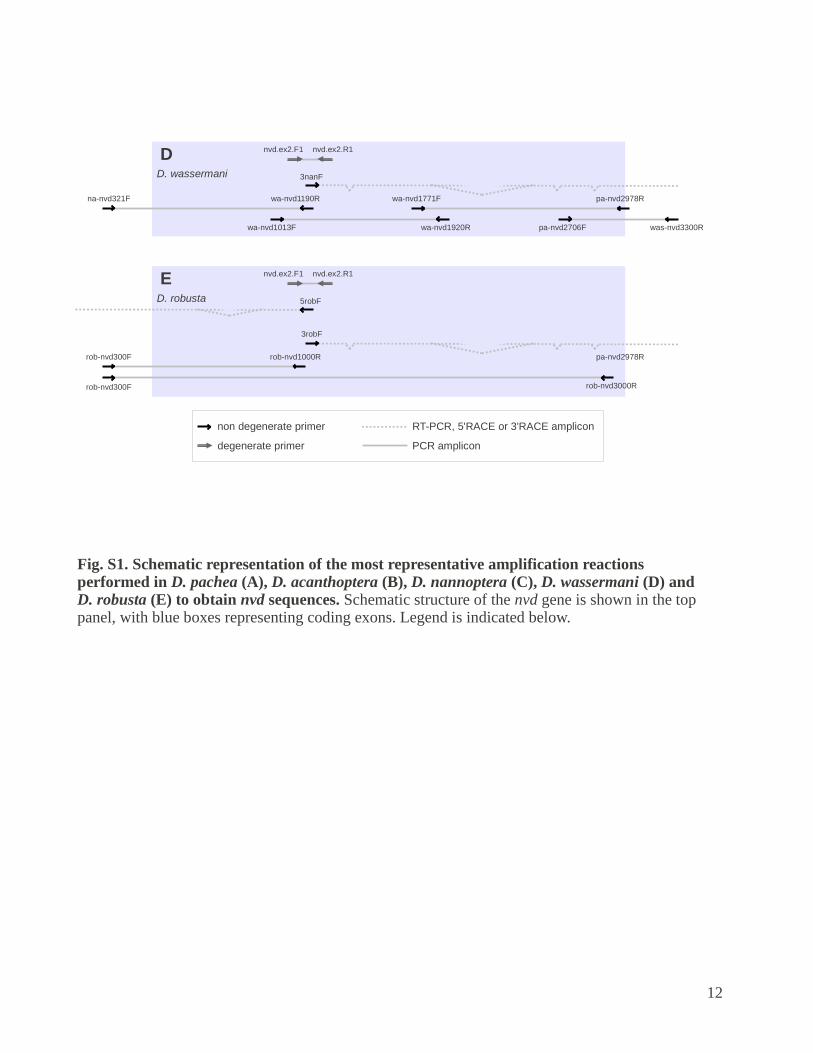
Sequencing of the nvd locus We used degenerate primers, inverse PCR, RT-PCR, 5’ RACE and 3’ RACE to sequence the nvd locus in various Drosophila species. To avoid potential PCR-induced errors, we determined DNA sequences from at least two independent PCR amplifications. See fig. S1 and Table S1 for amplification reactions and primers. Genomic DNA was isolated from adults using the DNeasy Tissue kit (QIAgen, Valencia). Part of exon 2 was amplified from D. acanthoptera with primers nvd.ex2.F1 and nvd.ex2.R2. Part of exon 2 was amplified from all the other nannoptera group species and from D. robusta with nvd.ex2.F1 and nvd.ex2.R1 primers. Part of exon 3 was amplified from D. pachea with primers nvd.ex3.F1 and nvd.ex3.R1. Part of exons 5 and 6 was amplified from D. pachea with nvd.ex5.F1 and nvd.ex6.R2 primers, and from D. acanthoptera with nvd.ex5.F1 and nvd.ex6.R3 primers. PCR fragments were purified and cloned into PGEMT-Easy (Promega, Madison) prior to sequencing. RT-PCR showed that the three non overlapping nvd exonic sequences that we amplified using degenerate primers in D. pachea were contiguous, suggesting that a single nvd gene is present in the D. pachea genome. Inverse PCR was performed to amplify the 5’ and 3’ nvd regions from D. pachea and D. acanthoptera. Genomic DNA was digested with MspI or Sau3AI and then ligated using T4 ligase (Promega) (19). Total RNA was isolated from adults using SV Total RNA Isolation System (Promega) following the manufacturer’s protocol. Reverse transcriptase reaction was performed with M-MLV retrotranscriptase (Promega) and oligo-dT primers. Subsequent 5’ and 3’ RACE were done using SMART™ RACE cDNA Amplification Kit (Clontech, Mountain View). Various PCR and RT-PCR were also performed to
2

sequence the entire nvd locus (fig. S1). For population genetics analysis, DNA was isolated from single flies with the DNeasy Tissue kit (QIAgen, Valencia) and the 3-kb nvd locus was amplified and sequenced using the primers reported in Table S1.
Analysis of nvd coding sequences in Diptera species Insect nvd gene regions were retrieved from NCBI database with TBLASTN and were annotated manually with Artemis (20) (Table S2). 5' RACE was performed as described above on D. mojavensis with the 5'Nvd-mojR primer and corroborated our gene annotation. Presumptive deleterious mutations were detected with SIFT (21) based on Drosophila and other insect NVD protein sequences. DNA sequences were aligned with ClustalW in BioEdit (22), with hand alignment of small indels based on amino acid sequences. Bayesian reconstruction of ancestral sequences and maximum likelihood analysis was performed with codeml in the PAML 4.2b package (23). We used the F3x4 model of codon frequencies. Global replacement changes per site (dN) / synonymous changes per site (dS) were calculated by a free-ratio model, which allows dN/dS to vary along different branches. To test whether the dN/dS ratio is higher in the D. pachea lineage, we used a branch model, where the null model is a single dN/dS ratio over the entire tree and the alternative model is two dN/dSs, one for the D. pachea lineage and one for the rest of the tree (Table S3).
In situ hybridizationPart of the nvd coding region was amplified by RT-PCR from D. pachea, D. acanthoptera and D. melanogaster using the following primers: pa.ex2.F3 and pa.finR, ac.ex2.F3 and ac.finR, Nvd.up2 and Nvd.do2 respectively. Fragments were purified, cloned into pGEMT-Easy and sequenced. The resulting plasmids were digested with ApaI or SacI and used as templates to generate sense and anti-sense in situ probes using the dNTP DIG RNA labeling mix (Roche) with T7 or SP6 polymerases (Promega). Wandering third instar larvae were dissected in PBT and fixed in 4% paraformaldehyde. In situ hybridization was carried out according to standard protocols.
Steroid hormone extraction and HPLC separationD. pachea flies were raised on regular fly food supplemented with 7DHC or with senita cactus pieces (see previous Methods section). For each condition, 100 wandering third instar larvae were homogenized in methanol and processed as described previously (13). Samples were then dissolved in HPLC mobile phase (a mix of dichloromethane/propan-2-ol/water, 125:30:1, v/v/v) and separated through a Zorbax® Sil column (250 x 4.6 mm i.d.) in an isocratic normal-phase mode using a Beckman HPLC apparatus (System Gold), a 1 mL min-1 flow rate and UV detection at 245 nm. From each collected fraction (700 microliters) we kept 175 microliters for nanoLC-MS/MS analyses and used the remaining part for enzyme immunoassay (EIA) detection of steroid hormones. All samples were evaporated to dryness.
Enzyme immunoassay detection of steroid hormonesSteroid hormones were detected with an enzyme immunoassay as described previously
3

(13). We used the polyclonal anti-ecdysone antiserum L2 (from M. De Reggi, Marseille), which displays the following cross-reactivities for reference steroids: ecdysone, 1.0 ; 20-hydroxyecdysone, 4.6 ; makisterone A, 50.0; makisterone C, 114.6. Calibration curves were generated with 20-hydroxyecdysone and results are given in 20-hydroxyecdysone equivalents.
NanoLC-tandem mass spectrometryFor nanoLC-MS/MS analyses, HPLC fractions corresponding to the two major immunoreactive peaks detected by EIA were pooled. Five fractions around the retention time of reference makisterone C were added to the pool of ecdysone/makisterone A zone fractions (see horizontal bars in fig. S5). Nano LC-MS/MS was performed at UPMC (Plate-forme de Spectrométrie de Masse et Protéomique, IFR 83, Paris) as described previously (13). Reference 20-hydroxyecdysone was given by J. Harmatha (Prague). Reference makisterone A and makisterone C were previously isolated from Ajuga iva (24) and Leuzea carthamoides (25), respectively. Reference ecdysone was purchased from Northern Biochemical Company, Russia. Their purity was higher than 97%.
Construction of plasmids for in vivo and in vitro assaysThe pUAST, pUAST-HA, UAS-GFP and UAS-HA-nvd-B.mori plasmids were described previously (9, 15, 26). The entire nvd coding region was amplified from D. pachea, D. acanthoptera and D. mojavensis cDNA using the following primers: pa-debut and pa-stop, ac-debut and ac-stop, moj-debut and moj-stop, respectively. Fragments were subcloned into pGEMT-Easy, digested with EcoRI and KpnI (D. pachea) or XhoI and XbaI (D. acanthoptera) or BglII and XbaI (D. mojavensis), and ligated into pUAST. The resulting pUAS-nvd-D. mojavensis plasmid contains part of the endogenous nvd 5' UTR. This construct gave the strongest NVD activity in our assay and was used as a reference in all our assays. A pUAS-nvd-D. mojavensis plasmid with no nvd 5'UTR was constructed using debut_pUAST3H_Dmoj_BamHI and pUASTR primers to amplify the nvd coding region and BglII/BamHI and XbaI as cloning sites into pUAST. The pGEMT-Easy vectors containing nvd inserts were used as templates for site-directed mutagenesis and mutants were generated with the QuickChange® Multi Site-Directed Mutagenesis kit according to the manufacturer's specifications (Stratagene, Europe). Primer sequences are indicated in Table S1. Then nvd inserts containing the mutations of interest were cloned into pUAST. D. pachea HA-nvd and D. mojavensis HA-nvd were amplified from pUAST-nvd constructs using the reverse primer pUASTR and a gene-specific forward primer (pacHAdebut and mojHAdebut), introducing a BamHI restriction site upstream of the start codon. The resulting PCR fragments were ligated into pGEMT, digested with BamHI and XbaI, and ligated into pUAST-HA linearized with BglII and XbaI. For preparation of HA-tagged D. mojavensis nvd constructs with mutations, pUAST-D. mojavensis HA-nvd was digested with EcoRI, releasing a HAtag-5´nvd coding sequence fragment and this fragment was ligated into the five pUAST-D. mojavensis HA-nvd constructs with mutations using the EcoRI site. For preparation of HA-tagged D. pachea nvd constructs with mutations, the same strategy was used, but digesting with RsrII and XbaI. The D. melanogaster Start1 cDNA was cloned as a XhoI-NheI fragment into the S2
4

expression vector pBRAcpA (from L. Cherbas), which contains an actin5C promoter. Maxiprep were performed using PureYield Plasmid Maxiprep System (Promega) following the manufacturer's instructions.
In vitro assayOur assay was adapted from refs. (15, 27). D. melanogaster S2 cells were maintained at 22 °C in Schneider medium (Invitrogen) supplemented with 10% heat-inactivated FCS and antibiotics (100 μg/mL streptomycin and 60 μg/mL penicillin). One day after subculture, cells were transfected using Effectene transfection reagent (QIAgen, Valencia) with the following three plasmids: Actin5C-GAL4 (from Yasushi Hiromi), UAS-GFP (26), Actin5C-Start1 (28), and one of our UAS-nvd plasmids. GFP served as a control for transfection efficiency. Transfected cells were incubated for 3 days at 22 °C to allow optimal protein expression. Then, 4 mL-cell culture solutions were incubated with 80 microliters of a cholesterol or lathosterol solution (1 mg/mL in 45% 2-hydroxypropyl--cyclodextrin) for 24 h. Both 2-hydroxypropyl--cyclodextrin (Sigma) and Actin5C-Start1-transfection are thought to facilitate cholesterol absorption (28, 29). Ethyl acetate extracts were analyzed by reverse phase-high pressure liquid chromatography (RP-HPLC) with a Waters 1525 HPLC system or an Ettan LC system. Conditions were as follows: C18 column (150 × 4.6 mm i.d. Advanced Chromatography Technologies), acetonitrile:isopropanol (5:2, vol/vol) solvent, 1 mL/min flow-rate, detection at 210 nm and 280 nm. NVD activity was measured as the amount of 7DHC produced (proportional to the corresponding peak surface). Since cell conditions can vary from day to day, the amount of 7DHC was always reported relative to the amount of 7DHC produced by cells transfected during the same assay with the very active UAS-nvd-D. moj construct. This construct contains part of the D. mojavensis nvd 5'UTR upstream of the start codon. At least three independent assays were performed for each condition.
Western blotFor each sample we used 1 mL of transfected S2 cell culture after sterol addition and just before sterol extraction. Cells were pelleted, resuspended in PBS buffer, pelleted again and resuspended in 1 mL RIPA buffer (50 mM Tris-Cl pH 7.4, 150 mM NaCl, 1% NP-40, 0.5% Na Deoxycholate, 0.1% SDS, protease inhibitors). Cell extracts were sonicated with three 5-s pulses at output level 2 using a Branson sonifier S-250 with a 3-mm microtip. Standard Western blot protocols were applied for detection of epitope tagged NVD enzyme and actin using the following antibodies: rat anti-HA monoclonal antibody 11867423001 (Roche) (1:2000 dilution), donkey anti-rat peroxydase 31470 (Pierce) (1:1000 dilution), mouse anti-actin monoclonal antibody 691001 (MP Biomedicals) (1:2000 dilution), anti-mouse IgG peroxydase A6782 (Sigma) (1:1000 dilution).
Fluorescent in situ hybridization (FISH) of polytene chromosomesPolytene chromosomes were prepared from D. pachea 15090-1698.02 third instar larva salivary glands by standard acid fixation squash procedures (30). For fixation, salivary glands were incubated in 45% acetic acid for 5 min, and then in 50% acetic acid and 16,67% lactic acid for 2 min. FISH probes were prepared with the FISH Tag DNA Green
5

Kit, Alexa Fluor 488 (Life Technologies). Each labeling was performed with an equimolar pool of five 1.5-to-2.5-kb PCR products corresponding to the amplification of 8 to 10 kb of the genomic region of interest (see Table S1 for primers). Hybridization of DNA probes to polytene chromosomes was carried out following the protocol of (30). As a control, we stained for the Acetyl-CoA carboxylase (ACC) locus in D. pachea and we observed that it localizes to a region that is different from the one detected with the nvd probe (fig. S12).
D. pachea whole genome sequencing and assembly The DNA of thirty individuals of the D. pachea 15090-1698.02 line was sequenced with the Illumina platform (Fasteris, Geneva, 2x100 bp, 134 million reads). The genome sequence was assembled with velvet 1.0.13 (31) using multiple hash lengths (k = 45, 49, 53, 57, 63). The assembly based on 49-kmers was chosen for further analysis. The N50 contig length of this assembly is 3,661 bp (minimum contig size = 100 bp). Then, 8 kb- and 20 kb- Long Jumping Distance (LJD) libraries (Eurofins MWG, Ebersberg) were constructed from a pool of genomic DNA from 120 adults of the D. pachea 5090-1698.02 line and sequenced with the Illumina platform (2x100 bp, 33 millions of reads paired with another read for the 8 kb-library and 33 million of reads paired with another read for the 20 kb-library). Reads were mapped to the genome assembly with bwa 0.5.5 (32). The mapping results were visualized with IGV (33) and contigs adjacent to the contig containing nvd were linked manually based on the LJD paired-end read information. This method allowed us to obtain a scaffold spanning approximately 40 kb on the 3' side of nvd and more than 150 kb on the other side (fig. S9). A better assembly of the D. pachea genome sequence is ongoing and will be published elsewhere. For gene annotation, we performed BLAST searches in Drosophila nucleotide sequences with tblastx and blastn and annotated coding sequences manually in Geneious (34).
Natural population sampling and initial processing of population genetics sequence dataInitially, we collected a population of 15 individuals from Guaymas (Sonora, Mexico) in 2003 and another one of 14 individuals from San Felipe (Baja California, Mexico) in 2008. On May 2011, we placed two bottles containing rotten senita cactus in a large cactus forest near San Felipe (Baja California, Mexico 114 53' 40.26" W, 31 06' 20.71" N). On May 14 we collected 34 D. pachea individuals: 13 were found in one bottle and 21 in another bottle located 5 meters away. We recorded the sex of each individual (Table S4). Genomic DNA was isolated from each individual fly using the DNeasy Tissue kit (QIAgen, Valencia). The 3-kb- nvd locus (from the start codon to the stop codon, including introns) was amplified and Sanger-sequenced in all the individuals (see Table S1 for primers). In addition, we amplified and sequenced seven genes located in the scaffold containing nvd and nine “control” genes that were chosen randomly across the genome from the 34 individuals collected in 2011 (fig. 4). The PCR amplicon length ranged from 1.5 to 3.5 kb and was sequenced with at least two sequencing primers (Table S1). We used Geneious 5.5.6 (34) and Indelligent (35) to find heterozygote nucleotide positions and infer heterozygote indels. Loci with heterozygote SNPs in males were inferred to be autosomal (acc, ddc, pis, RhoI, sad, Tpi and all the genes in the nvd
6
scaffold) whereas loci with no heterozygote nucleotides in males were inferred to be X-linked (dib, shade, smt3). Indels were removed manually from all the sequences. The sequences were then phased using the Stephens et al. PHASE tool (36), and the resulting haplotypes (68 haplotypes for each autosomal gene and 59 haplotypes for X-linked genes) were used in subsequent analysis.
Population StructureIf the San Felipe sample of 34 individuals came from a highly structured
population, this could present a challenge in interpretation of the other population genetic analysis. The control region data were subjected to analysis using STRUCTURE (37) and we also applied Principal Components Analysis (38) to assess whether these data look like a single panmictic population. We found no hint of clustering of any subset of lines (fig. S10), in agreement with the results of STRUCTURE (not shown), indicating no sign that this population has significant substructure. For subsequent analysis, we accepted the null hypothesis that the data behave as though the 34 sampled individuals are derived from a single panmictic population.
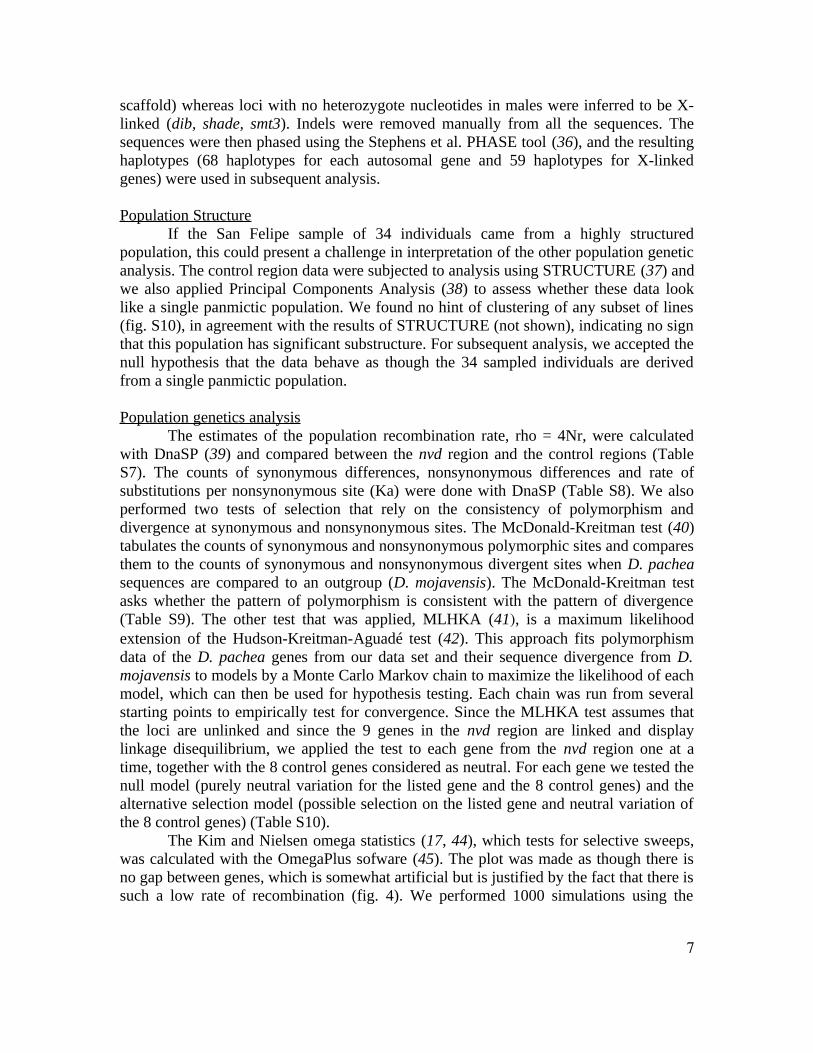
Population genetics analysisThe estimates of the population recombination rate, rho = 4Nr, were calculated
with DnaSP (39) and compared between the nvd region and the control regions (Table S7). The counts of synonymous differences, nonsynonymous differences and rate of substitutions per nonsynonymous site (Ka) were done with DnaSP (Table S8). We also performed two tests of selection that rely on the consistency of polymorphism and divergence at synonymous and nonsynonymous sites. The McDonald-Kreitman test (40) tabulates the counts of synonymous and nonsynonymous polymorphic sites and compares them to the counts of synonymous and nonsynonymous divergent sites when D. pachea sequences are compared to an outgroup (D. mojavensis). The McDonald-Kreitman test asks whether the pattern of polymorphism is consistent with the pattern of divergence (Table S9). The other test that was applied, MLHKA (41), is a maximum likelihood extension of the Hudson-Kreitman-Aguadé test (42). This approach fits polymorphism data of the D. pachea genes from our data set and their sequence divergence from D. mojavensis to models by a Monte Carlo Markov chain to maximize the likelihood of each model, which can then be used for hypothesis testing. Each chain was run from several starting points to empirically test for convergence. Since the MLHKA test assumes that the loci are unlinked and since the 9 genes in the nvd region are linked and display linkage disequilibrium, we applied the test to each gene from the nvd region one at a time, together with the 8 control genes considered as neutral. For each gene we tested the null model (purely neutral variation for the listed gene and the 8 control genes) and the alternative selection model (possible selection on the listed gene and neutral variation of the 8 control genes) (Table S10).
The Kim and Nielsen omega statistics (17, 44), which tests for selective sweeps, was calculated with the OmegaPlus sofware (45). The plot was made as though there is no gap between genes, which is somewhat artificial but is justified by the fact that there is such a low rate of recombination (fig. 4). We performed 1000 simulations using the
7

neutral coalescent simulator ms (46) and the average estimates of theta and rho for the region in order to calculate the significance level of omega (fig. 4). We conclude that there is evidence of at least one selective sweep in the nvd region.The haplotype bifurcation diagram was created with the SWEEP sofware developed by the Broad Institute (47). Input data for SWEEP was the concatenated and phased data for the nvd region spanning from C952 to SpdS. Linkage disequilibrium (LD) estimates were based on genotypic correlations calculated from unphased sequences using Zaykin's mcld program (48). The LD heat map was constructed using the LDheatmap R package (49).
8
Supporting Text
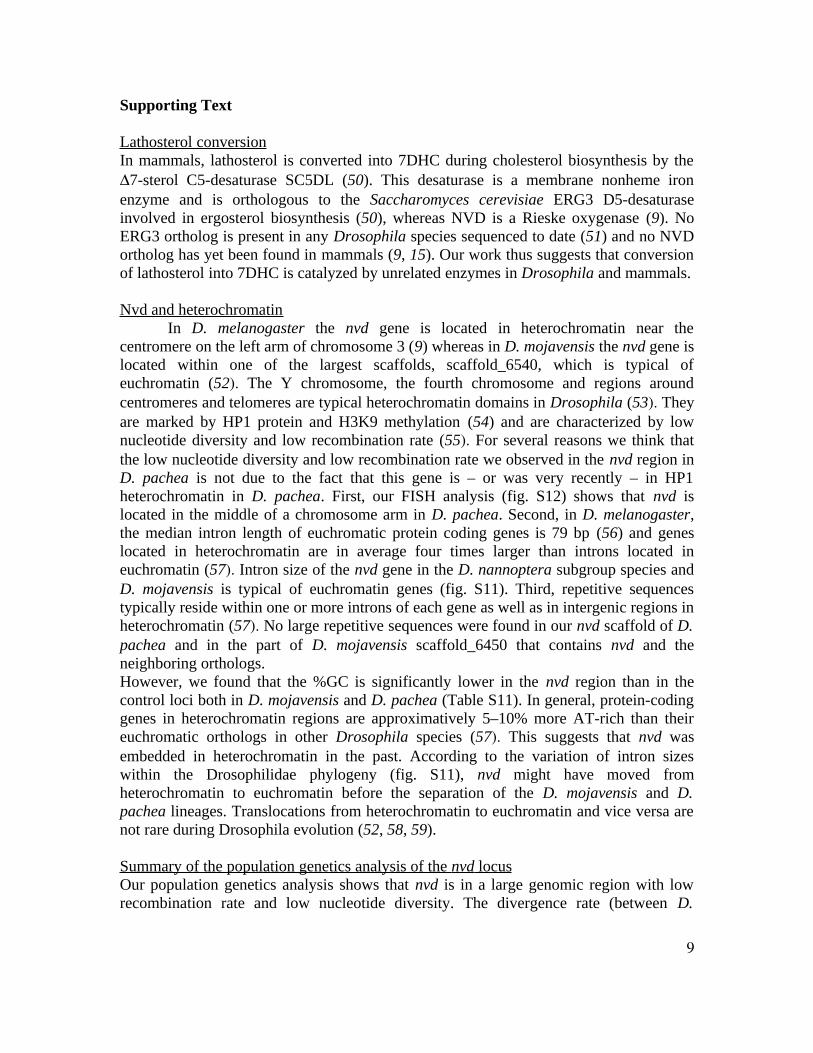
Lathosterol conversionIn mammals, lathosterol is converted into 7DHC during cholesterol biosynthesis by the 7-sterol C5-desaturase SC5DL (50). This desaturase is a membrane nonheme iron enzyme and is orthologous to the Saccharomyces cerevisiae ERG3 D5-desaturase involved in ergosterol biosynthesis (50), whereas NVD is a Rieske oxygenase (9). No ERG3 ortholog is present in any Drosophila species sequenced to date (51) and no NVD ortholog has yet been found in mammals (9, 15). Our work thus suggests that conversion of lathosterol into 7DHC is catalyzed by unrelated enzymes in Drosophila and mammals.
Nvd and heterochromatinIn D. melanogaster the nvd gene is located in heterochromatin near the
centromere on the left arm of chromosome 3 (9) whereas in D. mojavensis the nvd gene is located within one of the largest scaffolds, scaffold_6540, which is typical of euchromatin (52). The Y chromosome, the fourth chromosome and regions around centromeres and telomeres are typical heterochromatin domains in Drosophila (53). They are marked by HP1 protein and H3K9 methylation (54) and are characterized by low nucleotide diversity and low recombination rate (55). For several reasons we think that the low nucleotide diversity and low recombination rate we observed in the nvd region in D. pachea is not due to the fact that this gene is – or was very recently – in HP1 heterochromatin in D. pachea. First, our FISH analysis (fig. S12) shows that nvd is located in the middle of a chromosome arm in D. pachea. Second, in D. melanogaster, the median intron length of euchromatic protein coding genes is 79 bp (56) and genes located in heterochromatin are in average four times larger than introns located in euchromatin (57). Intron size of the nvd gene in the D. nannoptera subgroup species and D. mojavensis is typical of euchromatin genes (fig. S11). Third, repetitive sequences typically reside within one or more introns of each gene as well as in intergenic regions in heterochromatin (57). No large repetitive sequences were found in our nvd scaffold of D. pachea and in the part of D. mojavensis scaffold_6450 that contains nvd and the neighboring orthologs.However, we found that the %GC is significantly lower in the nvd region than in the control loci both in D. mojavensis and D. pachea (Table S11). In general, protein-coding genes in heterochromatin regions are approximatively 5–10% more AT-rich than their euchromatic orthologs in other Drosophila species (57). This suggests that nvd was embedded in heterochromatin in the past. According to the variation of intron sizes within the Drosophilidae phylogeny (fig. S11), nvd might have moved from heterochromatin to euchromatin before the separation of the D. mojavensis and D. pachea lineages. Translocations from heterochromatin to euchromatin and vice versa are not rare during Drosophila evolution (52, 58, 59).
Summary of the population genetics analysis of the nvd locus Our population genetics analysis shows that nvd is in a large genomic region with low recombination rate and low nucleotide diversity. The divergence rate (between D.
9

mojavensis and D. pachea) of the coding sequences present in the nvd region is not significantly different from genes located in unlinked regions of the genome (Table S8). Regions of lower recombination rates are expected to diverge faster (60, 61) but this is not the case here, suggesting that the low recombination rate and low nucleotide diversity of the nvd region is a relatively recent phenomena that appeared after the separation of the D. mojavensis and D. pachea lineages. Such a low diversity and recombination rate over several dozens of kilobases in a Drosophila species can be the result of recent and strong positive selection. The Kim and Nielsen omega statistics does indeed show evidence for a selective sweep (fig. 4). A recent selective sweep would generate a strong linkage disequilibrium (LD) over a group of segregating sites, which is not the case here (fig. S13). The pattern of linkage disequilibrium that we observe (a low level of LD background with a few sites of high LD) rather suggests that the nvd region is recovering from one or several selective sweeps. Together, our data are consistent with an old selective sweep in a low recombination region, or with multiple recent selective sweeps targeting neighboring loci in the nvd region. Because of the low level of polymorphism of the nvd region, neither the date of the selective sweep nor the precise target gene of the selective sweep can be inferred.
10
ATG
D. pachea
pa-nvd349F
pa-nvd1147R
pa-nvd1013F pa-nvd1997R
pa-nvd1831F pa-nvd2978R
pa-nvd2706F
pa-nvd3485F
na-nvd1025F na-nvd1920R
na-nvd1790F pa-nvd2978R
ac-nvd349F pa-nvd1147R
IP.ac.ex2F pa-nvd2978R
ac-nvd2706F ac-seqR
STOP200 bp
nvd.ex2.F1 nvd.ex2.R1
nvd.ex3.F1 nvd.ex3.R1
nvd.ex5.F1 nvd.ex6.R2
Nvd.pa.ex2FF Nvd.pa.ex2RR
IP.pa.ex5R IP.pa.ex5F
Sau3AI
IP.pa.ex2R IP.ac.ex2F
Sau3AI
IP.ac.pa.ex2R2 IP.pa.ex2F2
MspI
D. acanthoptera
nvd.ex2.F1 nvd.ex2.R2 nvd.ex5.F1 nvd.ex6.R3
IP.ac.ex2F
IP.ac.ex5R IP.ac.ex5F
Sau3AI
IP.ac.ex2R IP.ac.ex2F
Sau3AI
ac-debut ac-stop
pa-debut pa-stop
ac-nvd349F pa-nvd1147R IP.ac.ex2F pa-nvd2978R
ac-nvd2706F ac-seqR
D. nannoptera
nvd.ex2.F1 nvd.ex2.R1
3nanF
IP.ac.ex5R
Supporting figures
A
B
C
5'Nvd-acR3
11
non degenerate primer
degenerate primer
RT-PCR, 5'RACE or 3'RACE amplicon
PCR amplicon
wa-nvd1013F wa-nvd1920R
wa-nvd1771F pa-nvd2978Rna-nvd321F wa-nvd1190R
pa-nvd2706F was-nvd3300R
D. wassermani
nvd.ex2.F1 nvd.ex2.R1
3nanF
pa-nvd2978Rrob-nvd300F rob-nvd1000R
rob-nvd3000R
D. robusta
nvd.ex2.F1 nvd.ex2.R1
3robF
5robF
rob-nvd300F
Fig. S1. Schematic representation of the most representative amplification reactions performed in D. pachea (A), D. acanthoptera (B), D. nannoptera (C), D. wassermani (D) and D. robusta (E) to obtain nvd sequences. Schematic structure of the nvd gene is shown in the top panel, with blue boxes representing coding exons. Legend is indicated below.
D
E
12
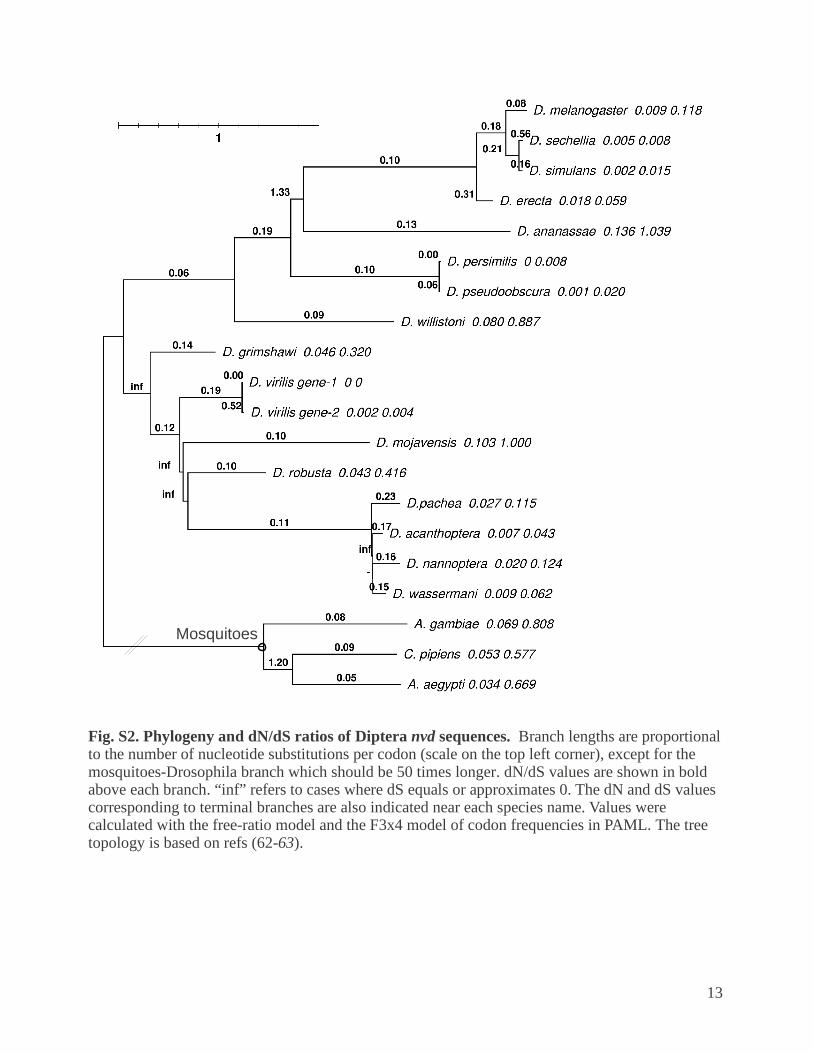
Fig. S2. Phylogeny and dN/dS ratios of Diptera nvd sequences. Branch lengths are proportional to the number of nucleotide substitutions per codon (scale on the top left corner), except for the mosquitoes-Drosophila branch which should be 50 times longer. dN/dS values are shown in bold above each branch. “inf” refers to cases where dS equals or approximates 0. The dN and dS values corresponding to terminal branches are also indicated near each species name. Values were calculated with the free-ratio model and the F3x4 model of codon frequencies in PAML. The tree topology is based on refs (62-63).
Mosquitoes
13
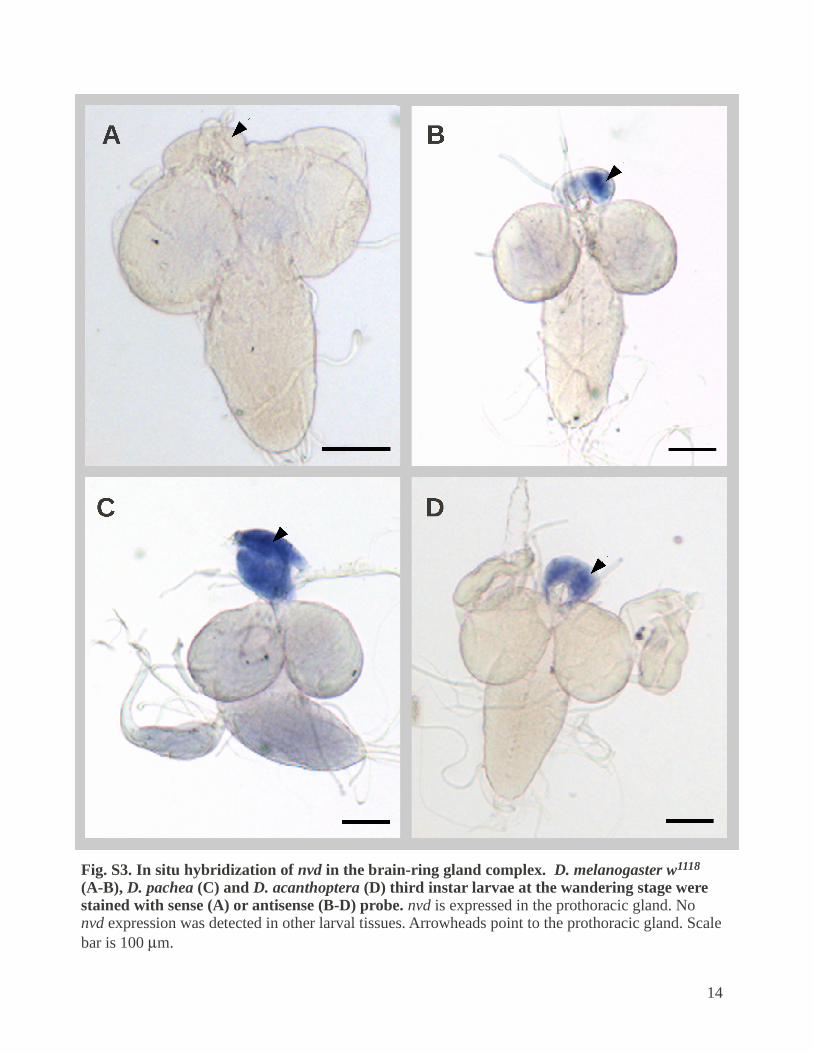
Fig. S3. In situ hybridization of nvd in the brain-ring gland complex. D. melanogaster w1118 (A-B), D. pachea (C) and D. acanthoptera (D) third instar larvae at the wandering stage were stained with sense (A) or antisense (B-D) probe. nvd is expressed in the prothoracic gland. No nvd expression was detected in other larval tissues. Arrowheads point to the prothoracic gland. Scale bar is 100 m.
14

Fig. S4. Putative D. pachea steroid hormone metabolic pathways. The senita cactus contains lathosterol, campestenol and schottenol as putative precursors (7). Owing to their inability to dealkylate 24-alkylsterols, insects are thought to produce various steroid hormones, depending on available dietary sterols (13).
lathosterol
Senita cactus
HO
cholesterol
7-dehydro-cholesterol
X
20-hydroxy-ecdysone
HO
NVD
makisterone A
7-dehydro-campesterol
HO
campestenol schottenol
makisterone C
7-dehydro-schottenol
HO
15

Retention time [min]
Re
lativ
e ab
unda
nce
[%]
0 5 10 15 20 25 30 35 400,0
0,5
1,0
1,5
2,0
2,5A
Fig. S5. Biochemical analysis of D. pachea steroid hormones.A, NP-HPLC-EIA analysis of steroids extracted from D. pachea raised on regular fly food supplemented with senita cactus (black line) or with 7DHC (dotted line). Arrows indicate retention times of reference steroids. Ecdysone and makisterone A have the same retention time in this HPLC system. Brackets indicate fractions that were pooled and analyzed further by LC-MS/MS. (B-C) MS/MS spectra of steroids present in pooled HPLC fractions from D. pachea raised on senita cactus. (B) MS/MS spectrum at m/z 465 from pool 1. This spectrum is similar to the MS/MS spectrum of ecdysone (13). No characteristic fragments corresponding to makisterone C or A at m/z 509 or 495, respectively, were detected. (C) MS/MS spectrum at m/z 481 from pool 2. This spectrum is similar to the MS/MS spectrum of 20-hydroxyecdysone (13).
20-
hyd
roxy
ecdy
sone
equ
iva
lent
[pm
ol/fr
actio
n]
ecdysonemakisterone A 20Emakisterone C
B C m/z 481m/z 465
50
0300 350 400 450 500
429.2
411.2393.2
447.4 465.4
Pool 1 Pool 1 Pool 2
m/z
300 350 400 450 500
50
0
445.3
371.2
427.3
409.2
331.2
301.2 353.3463.3
481.3
m/z
16

0,03333333 1,2 2,366667 3,533333 4,7 5,866667 7,033333 8,2 9,366667 10,53333 11,7 12,86667 14,03333 15,2
-10
490
990
1490
1990 GFP
210 nm280 nm
volume [ml]
no
rm. A
bso
rptio
n [m
AU
]
0,03333333 1,2 2,366667 3,533333 4,7 5,866667 7,033333 8,2 9,366667 10,53333 11,7 12,86667 14,03333 15,2
-10
490
990
1490
1990 D. mojavensis nvd210 nm280 nm
volume [ml]
no
rm. A
bso
rptio
n [m
AU
]
2000
1500
1000
500
Ab
sorp
tion
[mA
U]
0,03333333 1,2 2,366667 3,533333 4,7 5,866667 7,033333 8,2 9,366667 10,53333 11,7 12,86667 14,03333 15,2
-10
490
990
1490
1990 D. acanthoptera nvd210 nm280 nm
volume [ml]
no
rm. A
bso
rptio
n [m
AU
]
2000
1500
1000
500
0
Abs
orpt
ion
[mA
U]
0,03333333 1,2 2,366667 3,533333 4,7 5,866667 7,033333 8,2 9,366667 10,53333 11,7 12,86667 14,03333 15,2
-10
490
990
1490
1990 D. pachea nvd
210 nm280 nm
volume [ml]
no
rm. A
bso
rptio
n [m
AU
]
2000
1500
1000
500
0
Abs
orp
tion
[mA
U]
2000
1500
1000
500
0Abs
orp
tion
[mA
U]
0
Time [min]2 4 6 12 148 100 16
Time [min]2 4 6 12 148 10 16
Time [min]2 4 6 12 148 10 16
Time [min]2 4 6 12 148 10 16
0
0
0
Fig. S6. RP-HPLC analysis after S2 cell incubation with cholesterol. Cells were transfected with a GFP negative control (A), with D. mojavensis nvd (B), with D. acanthoptera nvd (C), or with D. pachea nvd (D). Absorption was measured at 280 nm (black line) and 210 nm (dotted line) simultaneously. Cholesterol absorbs preferentially at 210 nm and 7DHC at 280 nm. Retention time of cholesterol and 7DHC reference compounds are indicated with arrows. In our assays, D. mojavensis NVD typically converts about 20% of total cholesterol or lathosterol into 7-dehydrocholesterol.
A
B
C
D
7-dehydrocholesterol cholesterol
17
HA
-NV
D
HA
-NV
D A
250G
HA
-NV
D C
290
R
HA
-NV
D I
330
L
HA
-NV
D T
376A
G3
77E
HA
-NV
D
A2
50G
T3
76A
G37
7E
HA
-NV
D
A25
0G I3
30L
T3
76A
G37
7E
NV
D
0
anti-HA
anti-Actin
NV
D
HA
-NV
D
HA
-NV
D G
250
A
HA
-NV
D L
330I
HA
-NV
D G
376
T
HA
-NV
D P
290
R
HA
-NV
D E
377
G
20
40
0
20
60 D. pacheaD. mojavensis
CBD
. pac
hea
HA
-NV
D
D. m
oja
ven
sis
NV
D
D. m
oja
ven
sis
HA
-NV
D
A
80
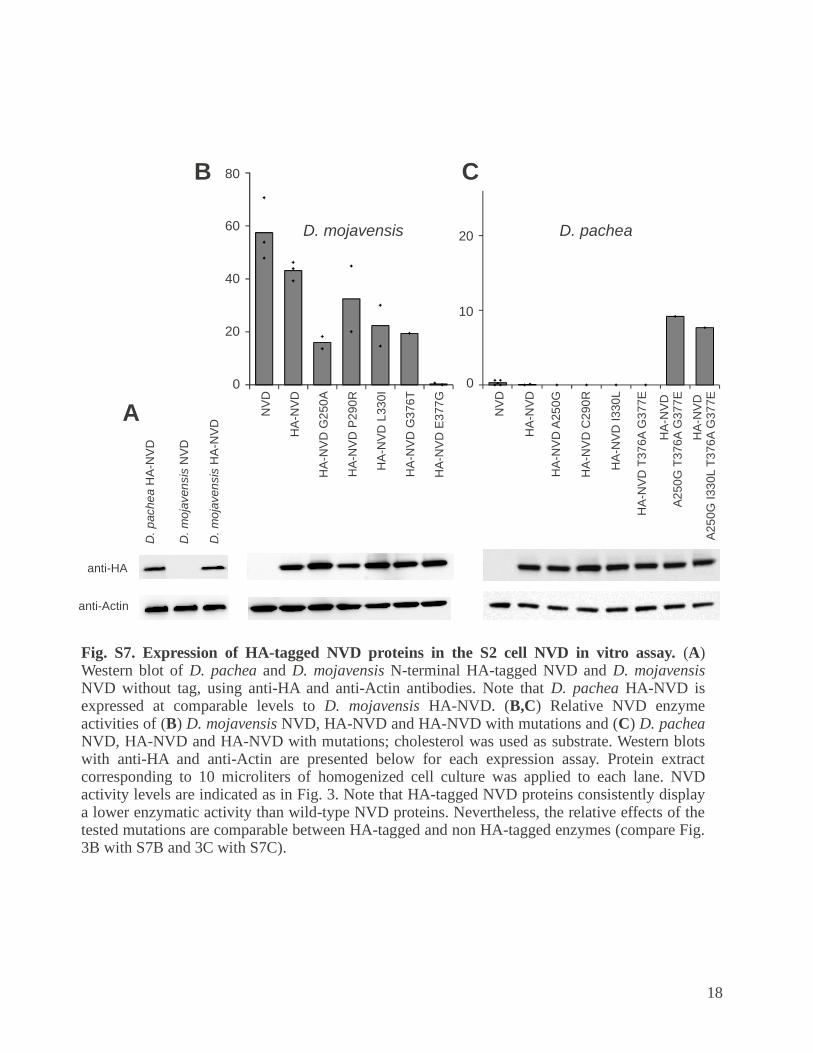
Fig. S7. Expression of HA-tagged NVD proteins in the S2 cell NVD in vitro assay. (A) Western blot of D. pachea and D. mojavensis N-terminal HA-tagged NVD and D. mojavensis NVD without tag, using anti-HA and anti-Actin antibodies. Note that D. pachea HA-NVD is expressed at comparable levels to D. mojavensis HA-NVD. (B,C) Relative NVD enzyme activities of (B) D. mojavensis NVD, HA-NVD and HA-NVD with mutations and (C) D. pachea NVD, HA-NVD and HA-NVD with mutations; cholesterol was used as substrate. Western blots with anti-HA and anti-Actin are presented below for each expression assay. Protein extract corresponding to 10 microliters of homogenized cell culture was applied to each lane. NVD activity levels are indicated as in Fig. 3. Note that HA-tagged NVD proteins consistently display a lower enzymatic activity than wild-type NVD proteins. Nevertheless, the relative effects of the tested mutations are comparable between HA-tagged and non HA-tagged enzymes (compare Fig. 3B with S7B and 3C with S7C).
10
18

Rieske motif
10 20 30 40 50 60 70 80 90 100 ....|....|....|....|....|....|....|....|....|....|....|....|....|....|....|....|....|....|....|....|C. elegans MLLEQIWGFLTAHPISVVTTILIVYLIHITLKPLNRVRRLGDVGLFFGKPELKGFY D. pulex YLRLDKYGQTRRQLANEV S. littoralis MESCSQTTDGVLDKYLHGDCQNGYTKQHIKEMIVSYLNLTFAFTLTVLELIYDYSSYILLAVALYFLLLILYRSYVNPIIFKKEFTEIGFEHIPPGPD B. mori MADRQHFPSAITEAVSSNTACPDTGPKAETTNIFLLLQRNITIESSKHVFSSIVEYILILTLMFAFSAILYVIYKSYISPVFYKKELTEVGFDHIPQGPD A. aegypti MIVANSSHDFELKKISWFCTDTAEKVSAFLCIMFRNHAFVPFVHFVPDLTDIGYNHVLDNEKISRNDKK A. gambiae MEYRLKTFTGWMGRSGNGTLEELLNDACDTLVLWPWVTVLWYGGLGLVLSYGLYLFYYQVLVW C. pipiens MLFLVFVPSTAHYKVIILFNSQDLTDIGYNHVLDNEGIRRGRAGDKR D. melanogaster MTSYSLFWMSLLKNNWKPISNDFVICLWTLAVTFIRIYWIFFVPLEWKKDLDNEKWSFLRKTENVVCYNH D. sechellia MASYSLFWMLLLKNNWKLISNDFVIYLWTLAVTVIRIYWIFFVPLVWKKDLDNEKCSFLRKTENAVGGYNP D. simulans MASYSLFWMLLLKNNWKLISNDFVIYLWTLAVTLIRIYWIFFVPLVWKKDLDNEKCSFLRKTENAVGYNP D. erecta MASYSLFWMSLLKNYWKSIGNDFVIYLWILAVTVLWIYWIFCVPLIWKKDLDNEKYSFLRKTENVIRYNP D. ananassae RYSLHAGKESILRNDT D. pseudoobscura YLDDVSYSKVSLTEGFCRNDQ D. persimilis YLDDVSYSKVTLTEGFCRNDQ D. willistoni MDLQSYSLLFLQLGELIEYINLSVVLTLFVVILTTILFYWMFYVPFNWTKHMNDVSYSEVLKSENLSSGAH D. grimshawi MYSVLFKLKSLIECDQWLTIMPHVRLNIYAVLTLVIVISLCLYWVFFIPLDWTKPMDDSTGWQFINNANKLRSKD D. virilisgene1 MNYLQHKFLLVLFKMKSLQNYDQSLIIMSHVYLKSFVVISLAILLTFVFYWVFCVPINLTKHMDNITDWQVLCTSKNVRCKS D. virilisgene2 MNYLQHKFLLVLFKMKSLQNYDQSLIIMSHVYLKSFVVISLAILLTFVFYWVFCVPINLTKHMDNITDWQVLCTSKNVRCKS D. mojavensis MDFEKNNFLSFLYGLKSIIKYDQWLIILSHIDLKTIIVIASLIFLCGFLYWLAFVPLSWIKDIDQTGRGIKSNG D. robusta HIDDINDWKILSTKKNWHSKS D. nannoptera MNLPNTNFSKILMDLNTILGHDNFFTILSYTPSVKVLCSIIFLILLLYWLFYIPLNWTWYKDQWEDYGSDKRINCKS D. wassermani MDLSTSNFSTILMDNVKTMLGHDNFPTILLYTPSVKVLCSIIFLILLLYWLFFIPLNWTWYKDQWGDYSNDKGINCNS D. acanthoptera MDLTTTNFSTILMELNTMLGHDHFLTILLYTPSFKVLCSIVFVILLLYWLFYIPLNWTWYKDQWGDYGNDKGINCNS D. pachea.01 MDLPTSNFSTILMDLKTMLGHDNFSTILFYTPCVKVLCSIICVILLLYWLFFIPLNWTWYKDQWEDDVNDNGINCNS D. pachea.02 MDLPTSNFSTILMDLKTMLGHDNFSTILFYTPCVKVLCSIICVILLLYWLFFIPLNWTWYKDQWEDDVNDNGINCNS D. pachea.06 MDLPTSNFSTILMDLKTMLGHDNFSTILFYTPCVKVLCSIICVILLLYWLFFIPLNWTWYKDQWEDDVNDNGINCNS
110 120 130 140 150 160 170 180 190 200 ....|....|....|....|....|....|....|....|....|....|....|....|....|....|....|....|....|....|....|....|C. elegans RERQLERLKLLRRVGDMPPVFPNGWYCVCESEKLANNQIMEITVLGQFLSLIRSESGAVYITDSYCPHIGANFNIGGRVVRDNCIQCPFHGWIFSAE D. pulex RRRKKVGGIPPVFPNGWFALCESDDVKDGQVRAVDALGEHFVVFRTEKGVASVLDAYCPHLGAHLGIGSRVIGDCVECPFHGWQFRGE S. littoralis RDRIISRAQTAKKIGSKTPPPFPNGWFAVAESRELKNGGVLSIDALGQNLCIYRGEDGVARVVDAYCPHLGANLGIAGTVSGSCIECPFHKWRFGE B. mori KGRRISRAQASRRMGSKLPPPYPNGWFAVAETRELKVGSALSIDALGQNLCVYRGEDGLARCVDAYCPHLGANLAVGGTVRGSCIECPFHKWRFNA A. aegypti RAHTINRLRRLRKTGQRIPPPYPNGWYGVLESEALAVGQAKSVDCLGQNFVVFRGETGEVNVLDAYCPHLGANLGVGGVVRGDCIECPFHHWSFSGR A. gambiae KRDTINRARRLRKIGDRLPPPYPNGWFSVLESENLTRGEAKSVDCLGQNLVVFRTEAGEVNVLDAYCPHLGANLGVGGIVRGDCIECPFHHWSFSGQ C. pipiens RAHTINRLRRLRKVGQRIPPPFPNGWFGILESEQLATGQARAVDCLGQNFVVFRASDSGQVSVLDAYCPHLGANLGVGGIVRGDCIECPFHHWSFSGR D. melanogaster KRDTINRLRKLKIQKIIELPPPYPNGWYGILKSSQLKAGEATCVSCLGEDLVIFRSKKDIVFILDAYCPHLGANLGIGGSVADDCVICPFHQWKFRGT D. sechellia KRDTINRLRKLKIQKITELPPPYPNGWYGILKSSQLKAGEATCVSCLGEDLVIFRTKKNIVFILDAYCPHLGANLGIGGSVADDCVICPFHQWKFRGT D. simulans KRDTINRLRKLKIQKIIELPPPYPNGWYGILKSSQLKAGEATCVSCLGEDLVIFRTKKNIVFILDAYCPHLGANLGIGGSVADDCVICPFHQWKFRGT D. erecta KRDTINRLRKVKIQKIIELPPPYPNGWYGILKSSQLKAGETTCVSCLGEDLVIFRTQKGIVFILDAYCPHLGANLGVGGSVVDDCVICPFHKWSFRGT D. ananassae KRLTINRFRKAKQHSSNKMPPPYPNGWYGILESCLLKVSEAIFISCLGEQLVVYRTQNNKVFIVDAYCPHLGANLGVGGRVDGDCIVCPFHQWSFRGS D. pseudoobscura KRDAINRIRKAKKNSSNEMPSPFPNGWYGILESSKLQPGDAKFIACLGEKLVVYRTHEHNVFILDAYCPHLGANLGIGGRVVGDNIECPFHQWSFRGE D. persimilis KRDAINRIRKAKKNSSNEMPPPFPNGWYGILESSKLQPGDAKFIACLGEKLVVYRTHEHNVFILDAYCPHLGANLGIGGRVVGDNIECPFHQWSFRGE D. willistoni KRDAINRLRKARKIGSKELPPPFPNGWYGILESSNLKPGGVKYVSCLGEHFVVYRTETNEVFILDAYCPHLGANLGIGGRVVGDSIECPFHQWRFGGT D. grimshawi KRDTINRLRKSRKIGSKELPPPYPNGWYGVLESSKLKAGESTYLSCLGEHFIIYRSQKHKVFILDAYCPHLGANLAVGGRVIGDNIECPFHQWSFRGT D. virilisgene1 KLAGVNRLRNSRLIGAKELPPPYPNGWYGILESSKLKAGESTHMSCLGEHLIIYRSQGNKIYILDAYCPHLGANLGIGGRVVGDNIECPFHQWSFRGS D. virilisgene2 KLAGVNRLRNSRLIGAKELPPPYPNGWYGILESSKLKAGESTHMSCLGEHLIIYRSQGNKIYILDAYCPHLGANLGIGGRVVGDNIECPFHQWSFRGS D. mojavensis KRAAINRLRKSRTIGVKELPPPYPNGWYGILESSNLSPGESTHVSCLGEQFAVFRTLKNEVFVVDAYCPHLGANLGIGGRVVGDNIECPFHHWRFRGT D. robusta KRATINRLKKTRIIGSKELPPPYPNGWYGILESSTLKAGESTQISCLGEQFIIYRSQKNEVFILDAYCPHLGANLGIGGRVIGDNIECPFHKWSFRGT D. nannoptera KRSAINRLRSNRRIGTKELPPPYPNGWYGILESSKLSAGESKHISCLGEQLVVFRSETGEVYILDAYCPHLGANLSKGGRVIGDNIECPFHHWSFRGS D. wassermani KRSAINRLRSTRRIGAKELPPPYPNGWYGILESSKLRAGESKHISCLGEQFIVFRSQAGEVYILDAYCPHLGANLSKGGRVIGDNIECPFHHWSFRGS D. acanthoptera KRSAINRLRSTRRIGTKELPPPYPNGWYGILESSKLSAGESKHISCLGEQLIVFRSQTGEVYILDAYCPHLGANLSKGGRVIGDNIECPFHHWSFRGS D. pachea.01 KRSAINRLRSTRLRNNKELPPPYPNGWYGILESSKLRAGESKHISCLGEQLIVFRSQAGEVYILDAYCPHLGANLSKGGRVIGDNIECPFHHWSFRGS D. pachea.02 KRSAINRLRSTRLRNNKELPPPYPNGWYGILESSKLRAGESKHISCLGEQLIVFRSQAGEVYILDAYCPHLGANLSKGGRVIGDNIECPFHHWSFRGS D. pachea.06 KRSAINRLRSTRLRNNKELPPPYPNGWYGILESSKLRAGESKHISCLGEQLIVFRSQAGEVYILDAYCPHLGANLSKGGRVIGDNIECPFHHWSFRGS
210 220 230 240 250 260 270 280 290 300 ....|....|....|....|....|....|....|....|....|....|....|....|....|....|....|....|....|....|....|....|C. elegans TGKCVEVPYDEGRIPEQAKVTTWPCIERNNNIYLWYHCDGAEPEWEIPEITEITDGFWHLGGRTEHEVMCHIQEIPENGADIAHLNYLHKSAPPVTKGS D. pulex DGQCTSIPYATGKIPQSARVKAWPSDEVNGFILVWYHAEQEEPSWKPPQIPEIAAKKWFYGGRSEYRVNAHIQEIPENGSDVAHLECLHGPSILYGS S. littoralis NGACVSVPGVEHAPKGVSIKHWTTVERDGAVWIWYDAEGRDPLWIVPELPELKSWGYRGRNEYVVSAHIQEIPENGADVAHLNAVHTMSLLSGL B. mori AGTCVSLPGSDIAPKGVSIRTWCVVETDGAVWIWHDAEGREPLWEITDPPELKEFGYRGRNEFEVSAHIQEIPENGADVPHLNAVHSSSLLSDL A. aegypti DGQCTNIPYMKSGSIPKMAKLKKWKSLEANGFIFVWHHVDESVEPWEMKIVPEVEDGQWVYYGRNEFLVNAHIQDIPENGADVAHLSAVHGPNCMSGS A. gambiae DGQCTNIPYSKSGTVPKVARLRKWRSLEVNGFIFVWHHVDPEVEPWTINVVQEIEDGRWVYYGKNEFLVNCHIQDVPENGADVAHLSAVHGPNMISGS C. pipiens DGQCVNIPYSKSGTVPKVAKVKKWTSMEANGFIFVWHHVDEGVEPWPMMVVPEVEDGRWVYYGKNEFLVNAHIQDIPENGADVAHLSAVHGPNCLSGS D. melanogaster DGLCINIPYSTSVPKGSKLKKWISQEVDGFIFIWYHAEQTELPWDLPVPMGEIDDTFVYHGHNEFYINCHIQEIPENGADIAHFNAIHKKNFINGS D. sechellia DGLCINIPYSTSVPKGSKVKKWISQEVDGFIFIWYHAEQTELPWDLREPMGEIDDAFVYHGHNEFYINCHIQEIPENGADIAHFNAIHKKNFINGS D. simulans DGLCINIPYSTSVPKGSKVKKWISQEVNGFIFIWYHAEQTELPWDLRVPMGEIDDAFVYHGHNEFYINCHIQEIPENGADIAHFDAIHKKNFINGS D. erecta DGLCINIPYSTSVPKGSKVKKWISKEVDGFIFIWYHAEPTELPWDLPLPMGEVDNTFIYHGHNEFYINCHIQEIPENGADIAHFNAIHKNSFLNDT D. ananassae DGKCAKIPYSASVPRSAQVKSWTSQEINGFIFVWYHVDSTEKPWSLPLTINDDQFIYHGRNEFFVNCHIREIPENGADNIHFNSIHNECFMSGK D. pseudoobscura DGGCNNIPYSTSIPRGTNVKKWISQEVNDFIFIWYHAESSEPWELPVPMEAQKKNVYHGRNEFYINCHIQEIPENGADMAHFAAIHNESFLAGS D. persimilis DGGCNNIPYSTSIPRGTNVKKWISQEVNDFIFIWYHAESSEPWELPVPMEAQKKNVYHGRNEFYINCHIQEIPENGADMAHFAAIHNESFLAGS D. willistoni DGKCKHIPYSTSVPQGSKVRKWTSQEFNDFIFVWYHADTTEKPWDLVASVNKMNNDFVFHGRNEFYVNCHIQEIPENGADLAHFGAIHNESIFAGS D. grimshawi DGMCTNIPYSNCVPPATKVKKWNSTEMNGFVFVWYSVEGSEIPWTLPKSVELQSNQFVYHGRNEFYINCHIQEIPENGADLAHFKAIHNDNIIAGG D. virilisgene1 DGVCTNIPYSTCVPPATKIKKWTSTEVNGFVFVWYSVEGSEIPWAIPKSVEVESNKLIYHGRNEFYVHCHIQEIPENGADLAHFRAIHNDNIVAEC D. virilisgene2 DGVCTNIPYSTCVPPATKIKKWTSTEVNGFVFVWYSVEGSEIPWAIPKSVEVESNKLIYHGRNEFYVHCHIQEIPENGADLAHFRAIHNDNIVAEC D. mojavensis DGVCTNIPYSTCVPPATKIKKWISKEAHGYIFVWYSAEASELPWDIPESKEVENKTIVYQGRNEFHVRCHIQEIPENGADLAHFRAIHNDNIITGT D. robusta DGMCTNIPYSTCVPPATKIKKWISAEVDGFVFVWYSVEESDIPWDIPKSFEVQTNKLTYHGRNEFYVHCHIQEIPENGADLAHFEAIHNDNVVTGC D. nannoptera DGMCTNIPYSSNIHSSTKTKTWTSTEVNGFIFLWYSVEGSEVPWNIPKSIGVANNELVYLGRNEFYVNCHIQEIPENGADLGHFQAIHDDNVVCGY D. wassermani DGMCTNIPYSNNIHSSTRTKKWTSTEVNGFIFLWYNVEESEVPWNIPKSVGVAKDELIYLGRNEFYVNCHIQEIPENGADLGHFQAIHDDNVICGY D. acanthoptera DGMCTNIPYSTNIHSSTKTKKWTSTEVNGFIFLWYNVEVSEVPWNIPKSVGVAKDELIYLGRNEFYVNCHIQEIPENGADLGHFQAIHDDNVICGY D. pachea.01 DGMCTNIPYSSNIHSSTKTKKWTSTEVNGFIFLWYNVEESEVPWNIPKSVGVAKNELIYLGRSEFYVNCHIQEIPENAADLGHFQAIHDDNVVCGY D. pachea.02 DGMCTNIPYSSNIHSSTKTKKWTSTEVNGFIFLWYNVEESEVPWNIPKSVGVAKNELIYLGRSEFYVNCHIQEIPENAADLGHFQAIHDDNVVCGY D. pachea.06 DGMCTNIPYSSNIHSSTKTKKWTSTEVNGFIFLWYNVEESEVPWNIPKSVGVAKNELIYLGRSEFYVNCHIQEIPENAADLGHFQAIHDDNVVCGY
Fe(II) motifG250A
19
310 320 330 340 350 360 370 380 390 400 ....|....|....|....|....|....|....|....|....|....|....|....|....|....|....|....|....|....|....|....|C. elegans DIIKTDLSDPQPAVQHVWDGKWEVKSEEDRHCGVMHLNQFMTFWGYKVPLTSSKLVAEQHGPGIVHMLFDFGIWGKGVVFQTVTPEEALLQRV D. pulex DLKATLNGKSVNGFAPFMQHHWSVKWETDPEEKHVAVSRLHHEIRIFGRLSCISVDVEAKQIGPGLVYLTFTSPLFGRCILFETVTPVEPMVQRV S. littoralis GEKYPLLNDLIGCHVWSATWTRNEDHTATMTLTHDYKIMKCDLGHVDVKVTQIGPGHVRLFLSTPVGPILVSQSVTPLGPNLQKV B. mori GERYPVLHEIIGRHVWNADWTKSDDHTSLMHITQEYKVLKYDLARIDVKVTQIGPGHVRLFLKTSVGPFYIVQSVTPLGPLLQKV A. aegypti DLRYARPAWAEFGMHAWNASWFAPEESDPPHIARMDLKHSFKFFKKFEFCTVDVKAYQIGPGYVQLMMQTGLGPMVALQTVTPVEPLVQKV A. gambiae DIRYSRPAWADFGMHSWFARWKAPEEGEPMHIAKMDLVHSFRIFNKFEMGKIDVRAYQIGPGYVQLMMNTSMGPFVVLQTVTPIEPLVQKV C. pipiens DIRYSRPAWAEFGMHAWHASWHAPSEENDDPPHIARMDLKHSFRFFNKLEVCTVDVKAYQIGPGYVQLAMQTGLGPMVALQTVTPVEPLVQKV D. melanogaster WAQKKRLFGLGSHHWKARWSPFTGKLKYLAEVNLSHTFKLFGKFGCFRMEVSGKQIGPSIVCLEVNSYTFGKIKVFQYITPIEPMLQKV D. sechellia WVQKKRLFGLGSHHWKARWSPLVGKLKYLAEVNLNHYFKLFGKFDCFRMEVSGKQIGPSIVCLEVNSYTFGKIKVVQYITPIEPLLQKV D. simulans WVQKKRLFGLGSHHWKARWSPLVGKLKYLAEVNLNHYFKLFGKFGCFRMEVSGKQIGPSIVCLEVNSYTFGKIKVVQYITPIEPLLQKV D. erecta WVQKKSVFGLGSHNWKARWSPFVGKLKYLAEVNLSHTLQLFGKFCCFRMEVSGKQIGPSCVCLEVNSYTFGKIIVFQYITPIEPLFQKV D. ananassae MGKSSKFFQYCHHKWNSSWIPSKNYKHFAEIKLSHALQIFGKFYCFRMDISGLQVGPAYVCMEINSSIFGTFRIYQTITPIEPLLQKV D. pseudoobscura LAPRISVLSRFGCHKWNASWFPTTGKDKHIAEIALTHSLKIIGKVNCFQMKVSGKQIGPSYVYLTMNSSIFGQIQILQTITPIEPLLQKV D. persimilis LAPRISVLSRFGCHKWNASWFPTTGKDKHIAEIALTHSLKIIGKVNCFQMKVSGKQIGPSYVYLTMNSSIFGQIQILQTITPIEPLLQKV D. willistoni LTPKTSMLSRFGYHLWAASWSSSKGPDKHIAEVTLSHKLEIFKNLYCFQMDVSGKQIGPSYVNLALYSPTLGHFRILQTITPVEPLMQKV D. grimshawi FHIKQSIVRYLGYHQWQASWNVAEDKHIAEIKLNHSFNLFGNFRCSQMNVTGKQIGPAYVHMFLHSPTFGHFQIFQTITPIKPLLQKV D. virilisgene1 RNRKKNLLHWLGYHQWQASWSPLEDRHIAETRLNHIFKLFGKIQCFSMDVIGKQIGPAYVHLVLHSPTFGNFQIFQTITPVEPLLQKV D. virilisgene2 RNRKKNLLHWLGYHQWQASWSPLEDRHIAETRLNHIFMLFGKIQCFSMDVIGKQIGPAYVHLVLHSPTFGNFQIFQTITPVEPLLQKV D. mojavensis SDQKHSIFSWLGYHQWQASWSPSEAKHISEIQMSHVFELFGKFKCFQMTIVGKQIGPAYVHLTLHSPTIGSFQIFQTVTPVEPLLQKV D. robusta IKKKSSILRTLGNHQWQASWNLSADKHIAETKLSHTFKLFGNFQCFRMNVIGKQIGPSYVHLFLHSPTFGNFQIFQTITPVEPLLQKV D. nannoptera WNQKRSIFRRLGYHKWTASWKRTDLSHVAELKISHTFHLFEKFKCFRMNVIGKQIGPSYVHLILNSPTFGDVEIFQTIIPVEPLVQKV D. wassermani WNQKRSIFSRLGYHNWTASWNRTDLSHVAELKINHTFDLFGKFKCFRMNVIGKQIGPSYVHLILNSPTFGDVEIFQTIIPVEPLVQKV D. acanthoptera WNQKRSIFSRLGYHKWTASWDRTDLSHVAELKISHTFDLFGKFKCFRMNVVGKQIGPAYVHLILNSPTFGDVEIFQTIIPVEPLVQKV D. pachea.01 WNQKRSIFSILGYHKWTASWNCTDLSHVAELNISHTFNLFGKLKCLRMNVIGKQIGPSYVHIILKSPTFGDVEIFQTIIPVEPLVQKV D. pachea.02 WNQKRSIFSILGYHKWTASWNCTDLSHVAELNISHTFNLFGKLKCLRMNVIGKQIGPSYVHIILKSPTFGDVEIFQTIIPVEPLVQKV D. pachea.06 WNQKRSIFSILGYHKWTASWNCTDLSHVAELNISHTFNLFGKLKCLRMNVIGKQIGPSYVHIILKSPTFGDVEIFQTIIPVEPLVQKV
410 420 430 440 450 460 470 480 ....|....|....|....|....|....|....|....|....|....|....|....|....|....|....|....|....|.C. elegans RFRIFSNIPWFFVKFFMTVEAMQFERDVFIWSNKKYIKSPLLVKNDGPIQKHRRWFSQFYTENSPKMLKDGSLSNQAKSIFDW D. pulex LHRLYAPLPMMGPLAKFIVWGEAVQFERDVVIWNNKTFIKSPILVAEDRAINLYRRWFQQFYSENSPLFDFQGNKDNEITNW S. littoralis IHRMFSPTYNAPFAALSVKAEGAMFERDIVIWNSKRFVSAPAYVKTDKTIRAFRNWFAQFYSENSIPFREALQNPLDW B. mori IHRVYSPAYNAPVGAFLVRCEAYMFERDVTIWNSKRFVSAPAYVKTDKTIRTFRNWFGQFYSEHSLGFRDALQNPLDW A. aegypti IHRFYAPRNLGNAFFQKFAIWAESVMFERDMMIWNHKQFIDSPLLIKEDRLIKSYRKWYSQFYSENSTSYTLAKENLDW A. gambiae IHRFYAPRSMWNAIFQKFAILAESIMFERDMMVWNHKQFIDNPLLIKEDRLIKSYRKWYSQFYSENSMSFTMAKEKLDW C. pipiens IHRFYAPRTIGNAFFQKFAVWAESVMFERDMMIWNHKQFVDTPLLIKEDRLIKAYRKWYSQFYSENSTSYSVAKESLDW D. melanogaster VHEFYGPRWIAPLMKIFIYGESLMFERDIKIWNHKVFNRNPILAKEDASIKKFRLWFSQFYSSNSKIYSEATNIGW D. sechellia VHEFYGPRWIAPLMKIFIYGESLMFERDISIWNHKVFHRNPILAKEDASIKKFRLWFSQFYSSNSKLYSETTNIGW D. simulans VHEFYGPRWIAPLMKIFIYGESLMFERDISIWNHKVFHRNPILAKEDASIKKFRLWFSQFYSSNSKLYSEATNIGW D. erecta VHQFYGPRWIAPLMKIFIYGESLMFERDINIWNHKVFHRNPILAKEDTSIKKFRLWFSQFYSSNSKSYSEATNMGW D. ananassae IHRFYGPRWLAPFMKIFILGESIMFQRDVTIWNHKDLLQNPVLAKEDTSIKKFRMWYSQFYTSNSKSLTDEAISIW D. pseudoobscura VHRFYGPRWLGPLLKVFIYGESIMFERDINMWNHKVFRRNPILAKEDTSIKQFRVWYSQFYTSNSKQFSDVTNVDW D. persimilis VHRFYGPRWLGPLLKVFIYGESIMFERDINMWNHKVFRRNPILAKEDTSIKQFRVWYSQFYTSNSKQFSDVTNVDW D. willistoni VHRFYGPRWMGPLMKIFIFGESVMFERDMNMWNHKVYRKNPLLVKEDMSLKQFRLWFAQFYENSKSYPEVTNVGW D. grimshawi VHRFYATRLMAPFMKILICGESIMFERDINIWNHKTYRNNPLLVLEESSIKKFRKWYAQFYTVNSKSFQLANNPSW D. virilisgene1 VHRFYASRFMAPIMKFLIFGETVMFERDLNIWNHKMYRNNPMLLMEESSLKKFRKWYAQFYTVNSKSFQLETNTNW D. virilisgene2 VHRFYASRFMAPIMKFIIFGETVMFERDLNIWNHKMYRNNPMLLMEESSLKKFRKWYAQFYTVNSKSFQLETNTNW D. mojavensis VHRFYGNPKITALMKFLIFGETVMFERDMNLWNHKMYRSNPLLVAEESPLKKFRKWYSQFYSDNSKSFQSANSQDW D. robusta VHRFYSTRLMAPIMKFVIYGETIMFERDINIWNHKIYRNNPLLVLEESSLKKFRKWYSQFYTVNSKSFQLSCNQNW D. nannoptera IHRFYSTRKMAPIMKFFVFAESVMFQRDMNIWNHKQYRRNPMLVLEEAPLKKFRKWYAQFYTVNSKSFQVANNYDW D. wassermani IHRFYSTRKMAPIMKFFVFAESVMFQRDMNIWNHKQYRSNPMLVLEEAPLKKFRKWYAQFYTVNSKTFQVANNHDW D. acanthoptera IHRFYSTRKMAPIMKFFVFAESVMFQRDMNIWNHKQYRSNPMLVLEEAPLKKFRKWYAQFYTVNSKSFQVANNHDW D. pachea.01 IHRFYSSRKMAPITKFFVFTGSVMFQRDMSIWNHKQYRSNPMLVLEETPLKKFRKWYAQFYTVNSKSFQVANNHDW D. pachea.02 IHRFYSSRKMAPITKFFVFTGSVMFQRDMSIWNHKQYRSNPMLVLEETPLKKFRKWYAQFYTVNSKSFQVANNHDW D. pachea.06 IHRFYSSRKMAPITKFFVFTGSVMFQRDMSIWNHKQYRSNPMLVLEETPLKKFRKWYAQFYTVNSKSFQVANNHDW
A376T
R290C L330I
E377G
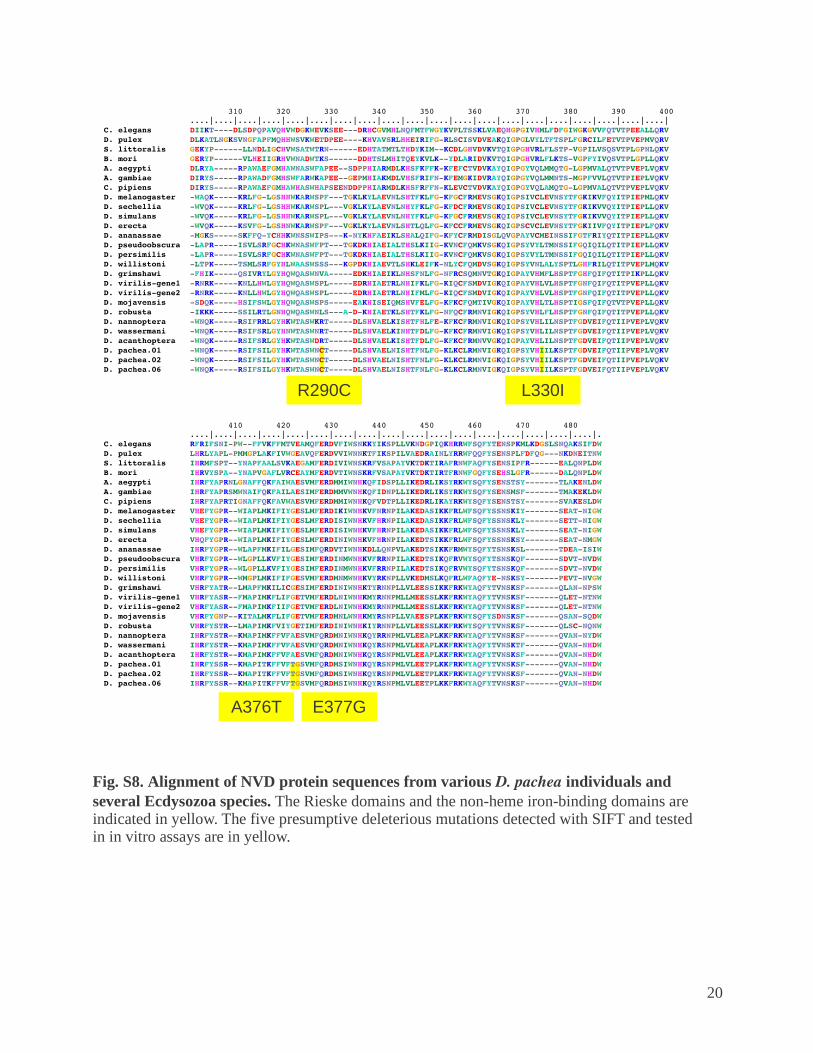
Fig. S8. Alignment of NVD protein sequences from various D. pachea individuals and several Ecdysozoa species. The Rieske domains and the non-heme iron-binding domains are indicated in yellow. The five presumptive deleterious mutations detected with SIFT and tested in in vitro assays are in yellow.
20

Fig. S9. Reconstructed D. pachea nvd scaffold. Each contig is shown as a blue rectangle. Contigs were linked together when more than three non-overlapping reads were paired with reads mapping to another contig. Small brackets correspond to 8-kb-long jumping distance reads and large brackets to 20-kb-long jumping distance reads. Annotated genes are shown in red and orange. The PCR fragments that were sequenced for the population genetics analysis are indicated as black rectangles.
Fig. S10. Principal Component Analysis of the sequences obtained from 34 D. pachea individuals. No clustering of any subset of lines is found, indicating that the population looks like a single panmictic population.
21

Intron 1 Intron 2 Intron 3 Intron 4 Intron 5
D. pachea 387 62 775 60 54
D. wassermani 499 62 672 58 62
D. acanthoptera 571 66 637 62 52
D. nannoptera 576 89 729 68 50
D. mojavensis 571 64 55 72 56
D. virilis - gene1 31764 68 37858 55 65
D. virilis - gene2 31764 68 86226 55 65
D. grimshawi 2946 54 1144 60 55
D. willistoni 449 57 166 59 62
D. pseudoobscura 5685 63 1928 52 67
D. persimilis 5303 73 1546 53 67
D. ananassae 2411 29044 60200 58 56
D. erecta 14242 23551 5499 46 60
D. yakuba 70252 ? ? 54 54
D. sechellia 14796 12641 3932 83 60
D. simulans 13105 18092 3490 53 60
D. melanogaster 23127 17037 34787 54 60
A. gambiae 0 108 0 90
C. pipiens 0 3439 0 63
A. aegypti 30 0 57 0 61
B. mori 508* 0 480 917
N. vitripennis - gene1 110* 0 0 0
N. vitripennis - gene2 569* 2621* 0 0 0
N. vitripennis - gene3 11910* 82* 0 0 0
A. mellifera 0 305* 0
P. humanus 0 0 0 0 0
D. pulex – gene1 222* 93 0 0 63
D. pulex - gene2 86* 91 0 0 70
22
Fig. S11. Intron size of the nvd gene accross several insect species. The five introns of the D. melanogaster nvd gene are located at the following amino acid positions: first, 50; second, 180; third, 280; fourth, 319; fifth, 378. All are in phase 0 (splicing between codons) except the second and third intron which are in phase 1 (splicing between the first nucleotide of the codon and the second) and 2 (splicing between the second nucleotide of the codon and the third), respectively. * indicates introns which are located at a slightly different position and/or with another phase. ?: intron annotation is unclear. Introns whose size is greater than 2 kb are shown in yellow and those whose size is greater than 10 kb are in red. The nvd gene lies in heterochromatin in D. melanogaster (9). Transitions between small size and large size introns might be associated with euchromatin-heterochromatin translocations.
23

Fig. S12. Localization of the nvd locus (A-A'') and the acc locus (B-B') on D. pachea polytene chromosomes. Polytene chromosomes are shown in inverse colors in A,B. (A',A'') magnification of the framed region. DNA is stained with DAPI (red in A',A'',B') and the nvd (A',A'') and acc (B') loci with an Alexa488 DNA probe (magenta). The nvd locus is within a band whereas acc is near a band (white arrowheads). Scale bar is 20 m.
A A''A'
B B'
24

Fig. S13. Linkage Disequilibrium (LD) heat map of the 272 polymorphic sites identified in 8 loci in the nvd region and in 9 control loci for 34 individuals. No block of nucleotides in high LD is detected in the nvd region (red line triangle). The nvd region displays a low background level of LD with a few sites in high LD, suggesting that the nvd region is recovering from one or several selective sweeps.
25

Supporting Tables
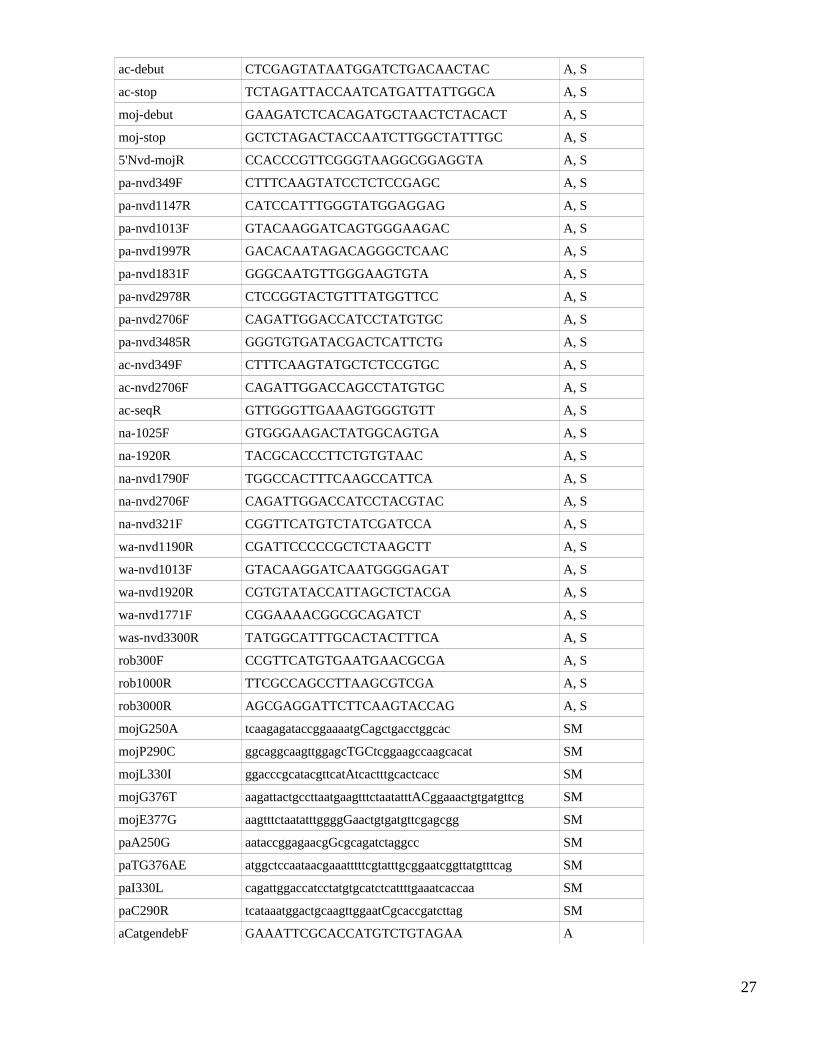
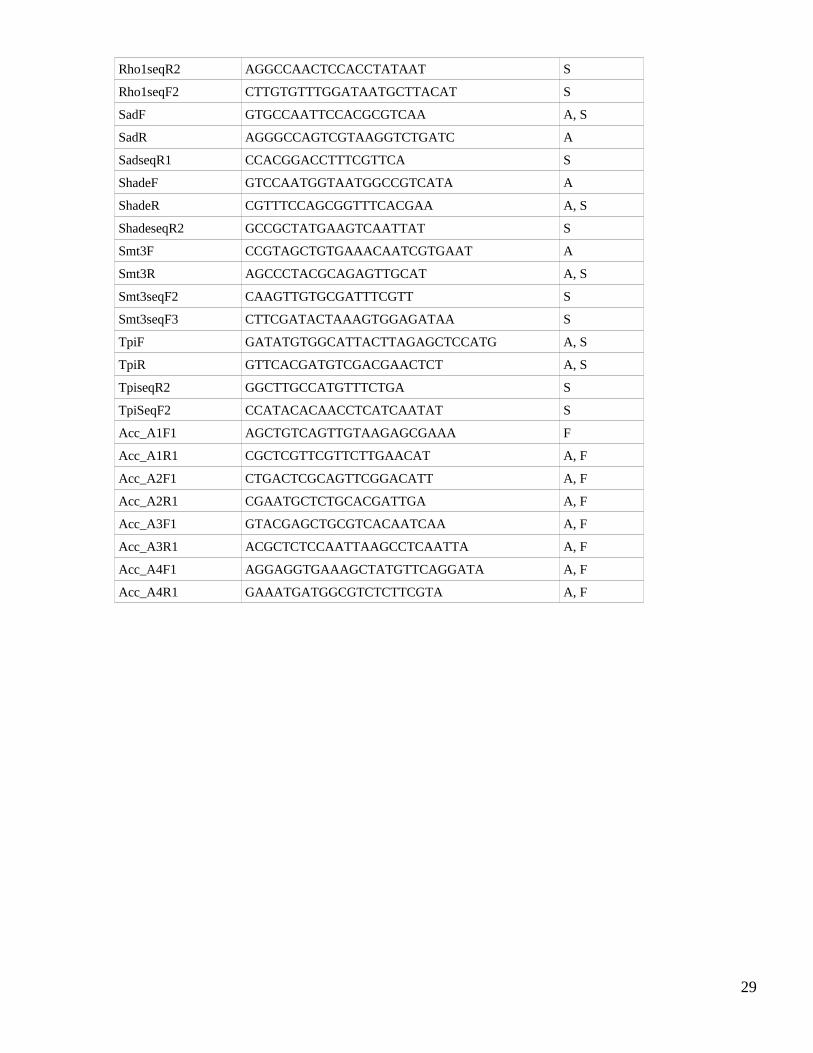
Table S1. PCR primers used in this study. See fig. S1 and Materials and Methods for details. A: PCR amplification, S: sequencing, SM: site-directed mutagenesis, F: probe synthesis for Fluorescent in situ hybridization of polytene chromosomes.
primer name primer sequence Used for
Nvd.ex2.F1 CCICCITWYCCNAAYGGNTGGTA A, S
Nvd.ex2.R1 CCANTGRTGRAANGGRCATTC A, S
Nvd.ex2.R2 CCANTGRTGRAANGGRCACTC A, S
Nvd.ex3.F1 CCIGCIACIAARRTNAARAARTGG A, S
Nvd.ex3.R1 TCIGGDATYTCYTGDATRTGACA A, S
Nvd.ex5.F1 GARCCIYTIYTNCARAAGGT A, S
Nvd.ex5.F3 GARCCIYTIATGCARAARGT A, S
Nvd.ex6.R2 CKRWACATYTTRTGRTTCCA A, S
Nvd.pa.ex2FF GGATGCGTATTGCCCGCACT A, S
Nvd.pa.ex2RR GGAGCCATCTTTCGGCTAGAGT A, S
iP.ac.ex5R TGGCGCCATCTTTCGGGTAGAGT A, S
iP.ac.ex5F CCACAATAGTTTCAGCGCGATATGA A, S
iP.pa.ex5R AATTTTACTCACCATAACCGATC A, S
iP.pa.ex5F TAATAGTTTCAGCGCGATATGAGT A, S
iP.ac.ex2F AAGGGAGGTCGAGTTATAGGAGAT A, S
iP.ac.ex2R TTTCGATTCCCCAGCACTAAGCTT A, S
iP.pa.ex2R CTTCGATTCCCCCGCTCTAAGCTT A, S
iP.ac.pa.ex2R2 CATTTGGGTATGGAGGAGGCA A, S
iP.pa.ex2F2 GTCCCTTTCACCACTGGAGCT A, S
5'Nvd-acR3 GCACCCAAGTGCGGGCAATATGCATCC A, S
5robF GCTCCCAAGTGTGGGCAATATGCATCC A, S
3nanF GGATGCATACTGCCCGCACTTGGGTGCT A, S
3robF GGATGCATATTGCCCACACTTGGGAGC A, S
pa.finR CCATATTTATGGCCTTCATAACA A, S
pa.ex2F3 AAGACGATGTCAATGATAATGGA A, S
ac.finR GCATACGATTTACATTACTTTCA A, S
ac.ex2F3 AGACTATGGCAATGATAAAGGA A, S
Nvd.up2 TAATAATATGGCGAGCTACAGTTT A, S
Nvd.do2 AATATTGGTTGCTTCAGAATATAT A, S
pa-debut GGAATTCATAATGGATCTGCCAACTAG A, S
pa-stop GGGGTACCTTACCAATCATGATTATTGGCA A, S
26
ac-debut CTCGAGTATAATGGATCTGACAACTAC A, S
ac-stop TCTAGATTACCAATCATGATTATTGGCA A, S
moj-debut GAAGATCTCACAGATGCTAACTCTACACT A, S
moj-stop GCTCTAGACTACCAATCTTGGCTATTTGC A, S
5'Nvd-mojR CCACCCGTTCGGGTAAGGCGGAGGTA A, S
pa-nvd349F CTTTCAAGTATCCTCTCCGAGC A, S
pa-nvd1147R CATCCATTTGGGTATGGAGGAG A, S
pa-nvd1013F GTACAAGGATCAGTGGGAAGAC A, S
pa-nvd1997R GACACAATAGACAGGGCTCAAC A, S
pa-nvd1831F GGGCAATGTTGGGAAGTGTA A, S
pa-nvd2978R CTCCGGTACTGTTTATGGTTCC A, S
pa-nvd2706F CAGATTGGACCATCCTATGTGC A, S
pa-nvd3485R GGGTGTGATACGACTCATTCTG A, S
ac-nvd349F CTTTCAAGTATGCTCTCCGTGC A, S
ac-nvd2706F CAGATTGGACCAGCCTATGTGC A, S
ac-seqR GTTGGGTTGAAAGTGGGTGTT A, S
na-1025F GTGGGAAGACTATGGCAGTGA A, S
na-1920R TACGCACCCTTCTGTGTAAC A, S
na-nvd1790F TGGCCACTTTCAAGCCATTCA A, S
na-nvd2706F CAGATTGGACCATCCTACGTAC A, S
na-nvd321F CGGTTCATGTCTATCGATCCA A, S
wa-nvd1190R CGATTCCCCCGCTCTAAGCTT A, S
wa-nvd1013F GTACAAGGATCAATGGGGAGAT A, S
wa-nvd1920R CGTGTATACCATTAGCTCTACGA A, S
wa-nvd1771F CGGAAAACGGCGCAGATCT A, S
was-nvd3300R TATGGCATTTGCACTACTTTCA A, S
rob300F CCGTTCATGTGAATGAACGCGA A, S
rob1000R TTCGCCAGCCTTAAGCGTCGA A, S
rob3000R AGCGAGGATTCTTCAAGTACCAG A, S
mojG250A tcaagagataccggaaaatgCagctgacctggcac SM
mojP290C ggcaggcaagttggagcTGCtcggaagccaagcacat SM
mojL330I ggacccgcatacgttcatAtcactttgcactcacc SM
mojG376T aagattactgccttaatgaagtttctaatatttACggaaactgtgatgttcg SM
mojE377G aagtttctaatatttggggGaactgtgatgttcgagcgg SM
paA250G aataccggagaacgGcgcagatctaggcc SM
paTG376AE atggctccaataacgaaatttttcgtatttgcggaatcggttatgtttcag SM
paI330L cagattggaccatcctatgtgcatctcattttgaaatcaccaa SM
paC290R tcataaatggactgcaagttggaatCgcaccgatcttag SM
aCatgendebF GAAATTCGCACCATGTCTGTAGAA A
27

aCatmidR CGTCTAATTTCACGTACTCCATCGTAA A
aCatseqR1 AATAAAATCATTCTCGTCAACAT A, S, F
aCatseqF4 TGTGATGCAGTCAATACTATTAG A, S
aCatseqF5 GACATTACAACCATTGATGACTT S, F
C3665F1 CGTCAGACAATGGAAAAGTTACATGAATAT A, F
C3665R1 GGACGCCATTATCAGTGTTATAGTCTTCAT A, S, F
C3665seqR2 CCCATATTTAATTTACATCTATCTGAA A, F
C952_654F1 TTCCCAAGTCCTATTAACTGATCCTTGT A
C952_654R1 GCGTGGATGCTTACTGCTCAT A
C952_654SeqF1 GAATTATGAAGAAGCTGAATACTT S
C952_655F1 AATGCGATGACAGCGTAACTGAA A, S
C952_655R1 TTGTCGACCAATAAGCACCTTGAAT A, S
CG12950F1 ATGCTGTAATGCTAAGAATGCCTGAA A, S, F
CG12950R2 ACTCTGCCGGATTGACCTTGT A, S, F
CKIIalphaF1 GCGTTTTAACTGCGTGATCTGA A, S, F
CKIIalphaR1 AACCGTGCTGAATCGACATCTAA A, S, F
nACRa80BF1 TGCAGGTTACTCTCTCAATCTCAATTCT A, S
nACRa80BR1 TAAGGACGACAATCAACTGCAGAATAA A, S
Nvd_deb TACAAGTTTCGATTACACTTTCAAGTAT A
nvdgenstop CGTGACATGCTATTTAATTATTCAAT A
NVDFL ACTCTGACGGACGGGCGGACAC S
SpdSF1 AATTATGGCCGGGACAATCATT S
SpdSF2 TTGACAACGTACAAATAGAATTGAACTCTT A
SpdSR1 CGGCATGGATTTCACTTGTGTAGTAT A
SpdSSeqR2 GAACACTTTAATAGATACGTAAGTA S
ACC-F TGGTCACGCCTGAGGATCTGAA A, F
ACC-R CCGAACTGCGAGTCAGCAAACT A, S, F
ACCseqF1 CTGTGCGATTCTCAAGTCAA S
DdcF ATGCGACGGCTCGAATCGCAAT A
DdcR AGACGGCCATGCGCAAGAAGT A, S
DdcseqR2 TGGCCGTGCCTTGAATGA S
DibF TTGTAATTCGAGGCAATGCACGTT A, S
DibR CGTTCGACCACGCCAGATGA A
DibseqF2 TCCTTGATTTCCAGCTACATT S
PisF GGCCATAGCCGAGCACGATAA A, S
PisR CTCCCTTTCGCCTTATTTCTATTCCAATT A
PisseqR1 ACAGAGATCAGAGCCTTCA S
Rho1F ATGACGACGATTCGCAAGAAATTGGTAA A
Rho1R AGCCCTAGTTGCTGTCTCGAA A, S
28
Rho1seqR2 AGGCCAACTCCACCTATAAT S
Rho1seqF2 CTTGTGTTTGGATAATGCTTACAT S
SadF GTGCCAATTCCACGCGTCAA A, S
SadR AGGGCCAGTCGTAAGGTCTGATC A
SadseqR1 CCACGGACCTTTCGTTCA S
ShadeF GTCCAATGGTAATGGCCGTCATA A
ShadeR CGTTTCCAGCGGTTTCACGAA A, S
ShadeseqR2 GCCGCTATGAAGTCAATTAT S
Smt3F CCGTAGCTGTGAAACAATCGTGAAT A
Smt3R AGCCCTACGCAGAGTTGCAT A, S
Smt3seqF2 CAAGTTGTGCGATTTCGTT S
Smt3seqF3 CTTCGATACTAAAGTGGAGATAA S
TpiF GATATGTGGCATTACTTAGAGCTCCATG A, S
TpiR GTTCACGATGTCGACGAACTCT A, S
TpiseqR2 GGCTTGCCATGTTTCTGA S
TpiSeqF2 CCATACACAACCTCATCAATAT S
Acc_A1F1 AGCTGTCAGTTGTAAGAGCGAAA F
Acc_A1R1 CGCTCGTTCGTTCTTGAACAT A, F
Acc_A2F1 CTGACTCGCAGTTCGGACATT A, F
Acc_A2R1 CGAATGCTCTGCACGATTGA A, F
Acc_A3F1 GTACGAGCTGCGTCACAATCAA A, F
Acc_A3R1 ACGCTCTCCAATTAAGCCTCAATTA A, F
Acc_A4F1 AGGAGGTGAAAGCTATGTTCAGGATA A, F
Acc_A4R1 GAAATGATGGCGTCTCTTCGTA A, F
29

Table S2. Annotations of nvd sequences from various insect species. Note that D. virilis genes 1 and 2 share exons 1, 2 and 3. The D. yakuba genome assembly (12-AUG-2009) contains a translocation within the nvd locus.
Species Genome assembly scaffold/accession numberposition of first coding nucleotide
position of last coding nucleotide
orientation
Aedes aegypti 31-JAN-2009 NW_001811298/supercont1.551 198965 201009 forward
Anopheles gambiae 22-APR-2009 chromosome X/CM000360.1 unknown 19963922 reverse
Apis mellifera 27-JUL-2006 NW_001253669/Amel_4.0 GroupUn.476 unknown 15463 reverse
Bombyx mori - NM_001044161.1 - - -
Caenorhabditis elegans - NM_073228 - - -
Culex pipiens 01-DEC-2009 NW_001886820/supercont3.120 639128 631341 reverse
Drosophila ananassae 31-JUL-2008 NW_001939302/scaffold_13082 unknown 3003627 reverse
Drosophila erecta 02-AUG-2008 NW_001956549/scaffold_4784 23612898 23657602 forward
Drosophila grimshawi 17-SEP-2008 NW_001961684/scaffold_15116 744437 738868 reverse
Drosophila melanogaster - NM_001104200.2 - - -
Drosophila mojavensis 03-AUG-2008 NW_001979112/scaffold_6540 4131970 4129862 reverse
Drosophila persimilis 17-SEP-2008 NW_001985956/scaffold_3 unknown 932498 forward
Drosophila pseudoobscura 11-SEP-2008 NW_001589869/Unknown_group_7 unknown 123764 forward
Drosophila sechellia 22-APR-2009 NW_001999694/scaffold_5 141512 108741 reverse
Drosophila simulans 06-AUG-2008 NW_002044460/chr3h_Mrandom_013 83021 119107 forward
Drosophila virilis (gene 1) 04-AUG-2008 NW_002014449/scaffold_12958 2296970 2416466 forward
Drosophila virilis (gene 2) 04-AUG-2008 NW_002014449/scaffold_12958 2296970 2368098 forward
Drosophila willistoni 17-SEP-2008 NW_002032853/scf2_1100000004902 6054308 6056387 forward
Nasonia vitripennis 12-SEP-2007 NW_001819348/SCAFFOLD52 303605 308332 forward
Nasonia vitripennis 12-SEP-2007 NW_001819903/SCAFFOLD57 unknown 812375 reverse
Spodoptera littoralis 01-FEB-2011 GU391576 - - -
30
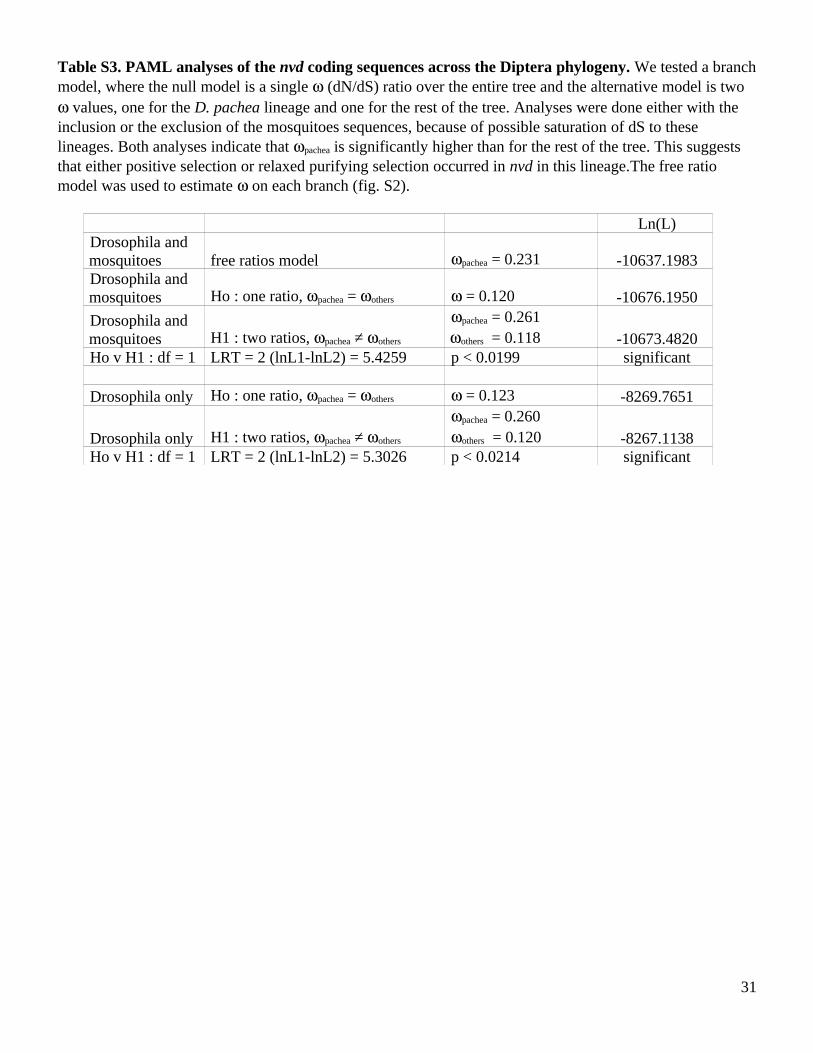
Table S3. PAML analyses of the nvd coding sequences across the Diptera phylogeny. We tested a branch model, where the null model is a single (dN/dS) ratio over the entire tree and the alternative model is two values, one for the D. pachea lineage and one for the rest of the tree. Analyses were done either with the inclusion or the exclusion of the mosquitoes sequences, because of possible saturation of dS to these lineages. Both analyses indicate that pachea is significantly higher than for the rest of the tree. This suggests that either positive selection or relaxed purifying selection occurred in nvd in this lineage.The free ratio model was used to estimate on each branch (fig. S2).
Ln(L)Drosophila and mosquitoes free ratios model pachea = 0.231 -10637.1983Drosophila and mosquitoes Ho : one ratio, pachea = others = 0.120 -10676.1950
Drosophila and mosquitoes H1 : two ratios, pachea ≠ others
pachea = 0.261others = 0.118 -10673.4820
Ho v H1 : df = 1 LRT = 2 (lnL1-lnL2) = 5.4259 p < 0.0199 significant
Drosophila only Ho : one ratio, pachea = others = 0.123 -8269.7651
Drosophila only H1 : two ratios, pachea ≠ others
pachea = 0.260others = 0.120 -8267.1138
Ho v H1 : df = 1 LRT = 2 (lnL1-lnL2) = 5.3026 p < 0.0214 significant
31

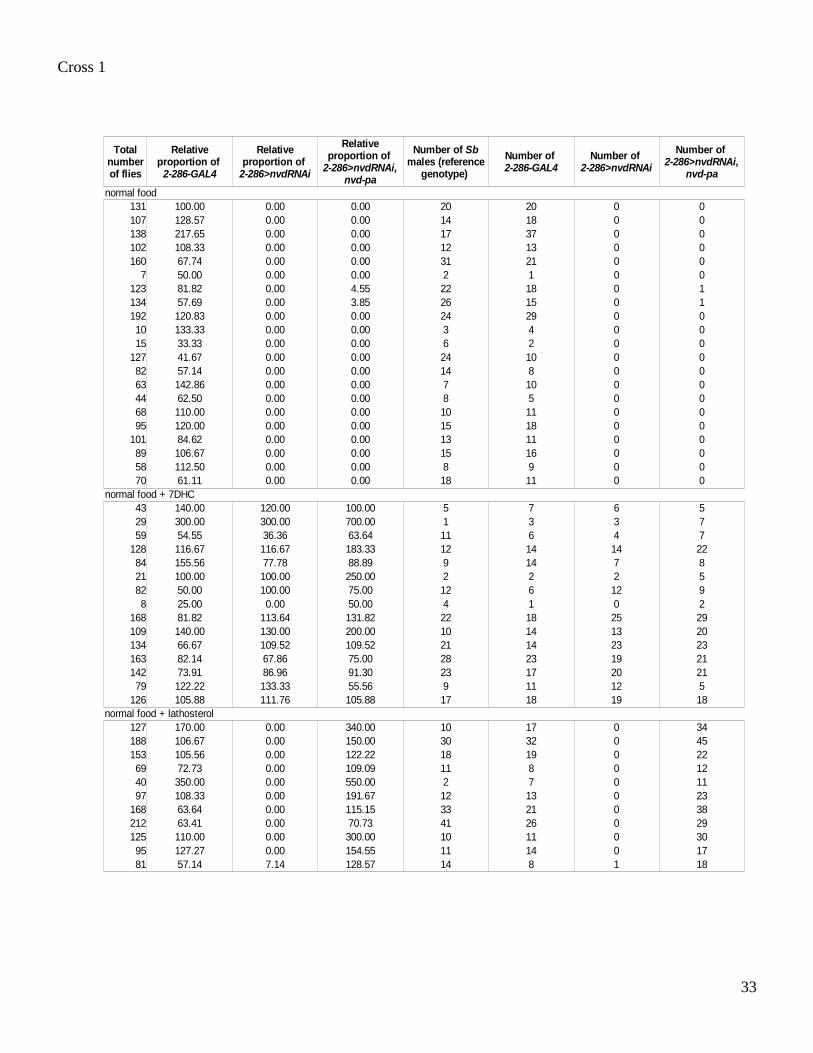
Table S4. Progeny number of the rescue experiments of D. melanogaster nvd RNAi flies.The number of adult progeny flies from two crosses is shown. The 2-286-GAL4 line (18) allows specific expression of the D. melanogaster nvd RNAi construct (UAS-nvd-RNAi-IR-1 (9) noted here UAS-nvd RNAi) and the D. pachea nvd constructs (UAS-nvd-pa or UAS-nvd-pa A250G I330L T376A G377E, noted here UAS-nvd-pa-4mut) in the prothoracic gland. Cross 1: D. melanogaster females UAS-nvd-RNAi/CyO x males UAS-nvd-pa/Y; 2-286-GAL4/TM3 Sb. Cross 2: D. melanogaster females UAS-nvd-RNAi/CyO x males UAS-nvd-pa-4mut/Y; 2-286-GAL4/TM3 Sb. The relative number of flies of each genotype was calculated relative to the number of UAS-nvd RNAi Sb male siblings. For the statistical analysis (see main paper) and for Fig. 2, only tubes where the total number of progeny exceeded 50 were considered. Wild-type control flies in Fig. 2 are CyO; 2-286-GAL4 males (noted here 2-286-GAL4). Note that cholesterol is the preferred sterol used by wild-type D. melanogaster flies for ecdysone production, even when food medium such as ours contains trace amounts of cholesterol (13,43).
32
Cross 1
33
normal food131 100.00 0.00 0.00 20 20 0 0107 128.57 0.00 0.00 14 18 0 0138 217.65 0.00 0.00 17 37 0 0102 108.33 0.00 0.00 12 13 0 0160 67.74 0.00 0.00 31 21 0 0
7 50.00 0.00 0.00 2 1 0 0123 81.82 0.00 4.55 22 18 0 1134 57.69 0.00 3.85 26 15 0 1192 120.83 0.00 0.00 24 29 0 010 133.33 0.00 0.00 3 4 0 015 33.33 0.00 0.00 6 2 0 0
127 41.67 0.00 0.00 24 10 0 082 57.14 0.00 0.00 14 8 0 063 142.86 0.00 0.00 7 10 0 044 62.50 0.00 0.00 8 5 0 068 110.00 0.00 0.00 10 11 0 095 120.00 0.00 0.00 15 18 0 0
101 84.62 0.00 0.00 13 11 0 089 106.67 0.00 0.00 15 16 0 058 112.50 0.00 0.00 8 9 0 070 61.11 0.00 0.00 18 11 0 0
normal food + 7DHC43 140.00 120.00 100.00 5 7 6 529 300.00 300.00 700.00 1 3 3 759 54.55 36.36 63.64 11 6 4 7
128 116.67 116.67 183.33 12 14 14 2284 155.56 77.78 88.89 9 14 7 821 100.00 100.00 250.00 2 2 2 582 50.00 100.00 75.00 12 6 12 98 25.00 0.00 50.00 4 1 0 2
168 81.82 113.64 131.82 22 18 25 29109 140.00 130.00 200.00 10 14 13 20134 66.67 109.52 109.52 21 14 23 23163 82.14 67.86 75.00 28 23 19 21142 73.91 86.96 91.30 23 17 20 2179 122.22 133.33 55.56 9 11 12 5
126 105.88 111.76 105.88 17 18 19 18
127 170.00 0.00 340.00 10 17 0 34188 106.67 0.00 150.00 30 32 0 45153 105.56 0.00 122.22 18 19 0 2269 72.73 0.00 109.09 11 8 0 1240 350.00 0.00 550.00 2 7 0 1197 108.33 0.00 191.67 12 13 0 23
168 63.64 0.00 115.15 33 21 0 38212 63.41 0.00 70.73 41 26 0 29125 110.00 0.00 300.00 10 11 0 3095 127.27 0.00 154.55 11 14 0 1781 57.14 7.14 128.57 14 8 1 18
Total number of flies
Relative proportion of
2-286-GAL4
Relative proportion of
2-286>nvdRNAi
Relative proportion of
2-286>nvdRNAi, nvd-pa
Number of Sb males (reference
genotype)
Number of 2-286-GAL4
Number of 2-286>nvdRNAi
Number of 2-286>nvdRNAi,
nvd-pa
normal food + lathosterol

Cross 2
34
normal food170 118.18 0.00 118.18 22 26 0 2635 180.00 0.00 80.00 5 9 0 467 112.50 0.00 75.00 8 9 0 672 33.33 0.00 60.00 15 5 0 945 120.00 0.00 40.00 5 6 0 2
158 113.04 0.00 82.61 23 26 0 19150 157.14 0.00 121.43 14 22 0 1781 56.25 0.00 68.75 16 9 0 11
101 180.00 0.00 150.00 10 18 0 1590 76.47 0.00 82.35 17 13 0 14
102 78.57 0.00 121.43 14 11 0 17138 61.11 0.00 105.56 18 11 0 19
normal food + 7DHC293 87.80 92.68 87.80 41 36 38 36204 90.91 104.55 122.73 22 20 23 27116 366.67 277.78 44.44 9 33 25 477 41.67 83.33 91.67 12 5 10 11
192 71.43 82.14 96.43 28 20 23 27163 105.56 166.67 138.89 18 19 30 25193 64.00 120.00 88.00 25 16 30 22
72 130.00 0.00 120.00 10 13 0 1281 64.71 0.00 47.06 17 11 0 8
102 78.95 0.00 73.68 19 15 0 14194 91.43 0.00 102.86 35 32 0 36291 118.60 2.33 106.98 43 51 1 46130 71.43 0.00 133.33 21 15 0 2868 40.00 0.00 140.00 10 4 0 1466 41.67 0.00 116.67 12 5 0 14
137 80.77 0.00 100.00 26 21 0 2642 54.55 0.00 109.09 11 6 0 12
Total number of flies
Relative proportion of
2-286-GAL4
Relative proportion of
2-286>nvdRNAi
Relative proportion of
2-286>nvdRNAi, nvd-pa-4-mut
Number of Sb males (reference
genotype)
Number of 2-286-GAL4
Number of 2-286>nvdRNAi
Number of 2-286>nvdRNAi,
nvd-pa-4-mut
normal food + lathosterol

Table S5. Sex of the 34 individuals used for population genetics analysis.
Individual name
Alternative name
Bottle from which it was collected Sex
1_1 1 1 male
1_2 2 1 male
1_3 3 1 male
1_4 4 1 male
1_5 5 1 female
1_7 7 1 female
1_8 8 1 female
1_9 9 1 female
1_10 10 1 female
1_11 11 1 female
1_12 12 1 female
1_13 13 1 female
1_14 14 1 female
2_1 15 2 male
2_2 16 2 female
2_3 17 2 male
2_4 18 2 male
2_5 19 2 male
2_6 20 2 female
2_7 21 2 female
2_8 22 2 female
2_9 23 2 female
2_10 24 2 female
2_11 25 2 female
2_12 26 2 female
2_13 27 2 female
2_14 28 2 female
2_15 29 2 female
2_16 30 2 male
2_17 31 2 female
2_18 32 2 female
2_19 33 2 female
2_20 34 2 female
2_21 35 2 female
35

Table S6. Polymorphism statistics of the sequences obtained from the 34 D. pachea individuals. There is a 10 fold difference in nucleotide diversity between the eight genes that are within the nvd scaffold and the nine control genes. All three of the simple tests of selection (Tajima's D, and the two Fu and Li tests) show that there is evidence for purifying selection and/or recovery from a selective sweep in the nvd region and not across the control regions. The column headings are: Nchrom: number of chromosomes in the test (34 individuals yielded 68 phased haplotypes for autosomal genes and 59 phased haplotypes for sex-linked genes). Seg. Sites: number of segregating sites; TotSites: total number of sites sequenced; rho: estimate of rho = 4NR per site. NA: not applicable. References for nucleotide diversity (, Watterson's theta or mutation rate (w), Tajima's D, Fu and Li D*, Fu and Li F*, Zns and rho statistics can be found in (39). Values in grey background are significant (p < 0.05).
36
Gene rho
C952 68 7 1733 0.00034 + 0.00006 0.00084 -1.48866 -2.07172 -2.21526 0.0568 0.0390C952-654 68 7 1235 0.00026 + 0.00007 0.00118 -1.95324 -2.07172 -2.39493 0.0005 0.0390C3665 68 1 1565 0.00002 + 0.00002 0.00013 -1.07049 -1.92845 -1.94484 NA NA
nACR80B 68 6 874 0.00048 + 0.00012 0.00143 -1.5953 -0.6593 -1.13221 0.0187 0.025268 0 1489 0 0.00000 0 0 0 NA NA68 16 2669 0.00071 + 0.00009 0.00124 -1.27579 -1.71606 -1.85416 0.0483 0.002168 3 1247 0.00007 + 0.00005 0.00050 -1.66053 -3.20311 -3.18649 0.3335 068 2 1384 0.00016 + 0.00007 0.00030 -0.76772 0.71782 0.31425 1.0000 0
68 34 1295 0.00427 + 0.00024 0.00564 -0.78703 0.63404 0.11975 0.0300 0.122968 34 1522 0.00246 + 0.00018 0.00466 -1.52499 -2.63026 -2.64712 0.0434 0.0406
Pis 68 15 731 0.00257 + 0.00027 0.00457 -1.29247 -1.24062 -1.49579 0.0360 0.141168 20 777 0.00324 + 0.00038 0.00564 -1.30812 -0.21446 -0.72619 0.0698 0.0142
sad 68 41 1511 0.00339 + 0.00025 0.00594 -1.41375 -1.96955 -2.10248 0.0443 0.157768 16 657 0.00349 + 0.00180 0.00508 -0.92787 -0.76517 -0.97747 0.0411 0.1460
59 29 1519 0.00341 + 0.00076 0.00411 -0.55079 -0.48075 -0.60324 0.0416 0.2029shade 59 25 1600 0.00175 + 0.00067 0.00336 -1.60505 -1.36803 -1.73092 0.0359 0.0713smt3 59 32 1482 0.00278 + 0.00080 0.00436 -1.24455 -1.43877 -1.63087 0.0454 0.0831
NchromsSeg.Sites
TotSites + SD w Tajima_D FuLi_D* FuLi_F* ZnS
CKIIalphanvdacatSpdS
accddc
Rhol
Tpi
dib
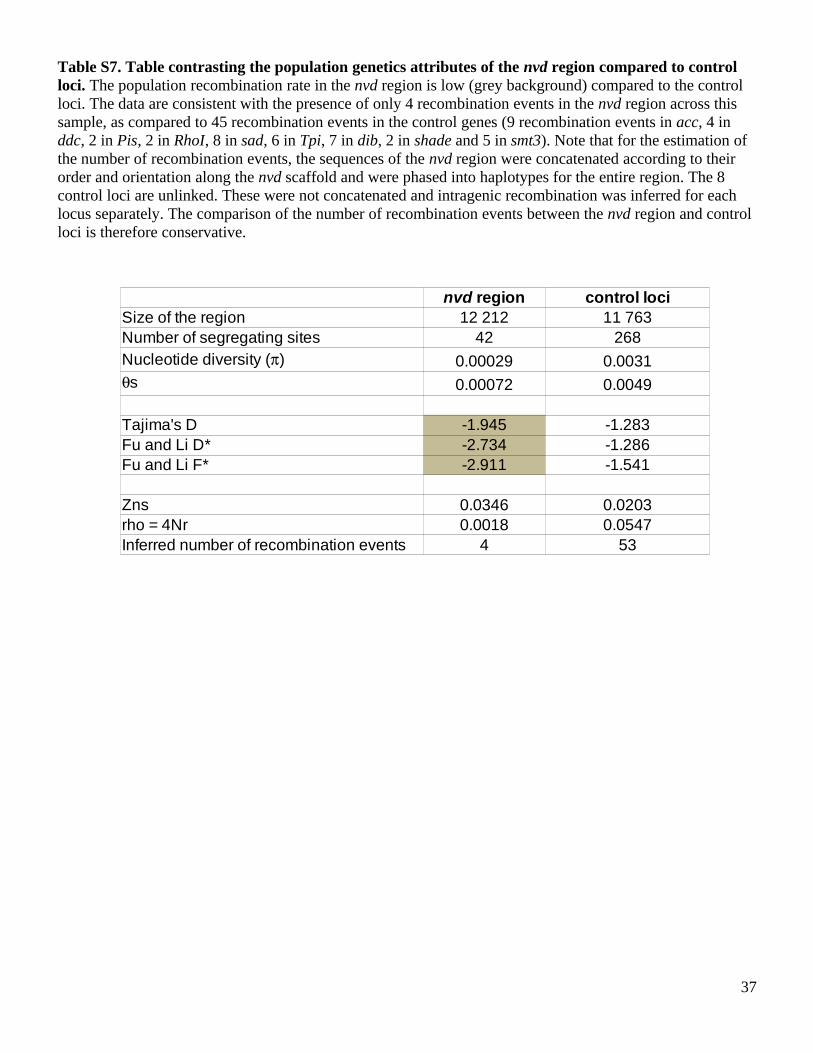
Table S7. Table contrasting the population genetics attributes of the nvd region compared to control loci. The population recombination rate in the nvd region is low (grey background) compared to the control loci. The data are consistent with the presence of only 4 recombination events in the nvd region across this sample, as compared to 45 recombination events in the control genes (9 recombination events in acc, 4 in ddc, 2 in Pis, 2 in RhoI, 8 in sad, 6 in Tpi, 7 in dib, 2 in shade and 5 in smt3). Note that for the estimation of the number of recombination events, the sequences of the nvd region were concatenated according to their order and orientation along the nvd scaffold and were phased into haplotypes for the entire region. The 8 control loci are unlinked. These were not concatenated and intragenic recombination was inferred for each locus separately. The comparison of the number of recombination events between the nvd region and control loci is therefore conservative.
37
42 268
0.00029 0.0031
0.00072 0.0049
-1.945 -1.283-2.734 -1.286-2.911 -1.541
0.0346 0.0203rho = 4Nr 0.0018 0.0547
4 53
nvd region control lociSize of the region 12 212 11 763Number of segregating sitesNucleotide diversity ()
s
Tajima's DFu and Li D*Fu and Li F*
Zns
Inferred number of recombination events
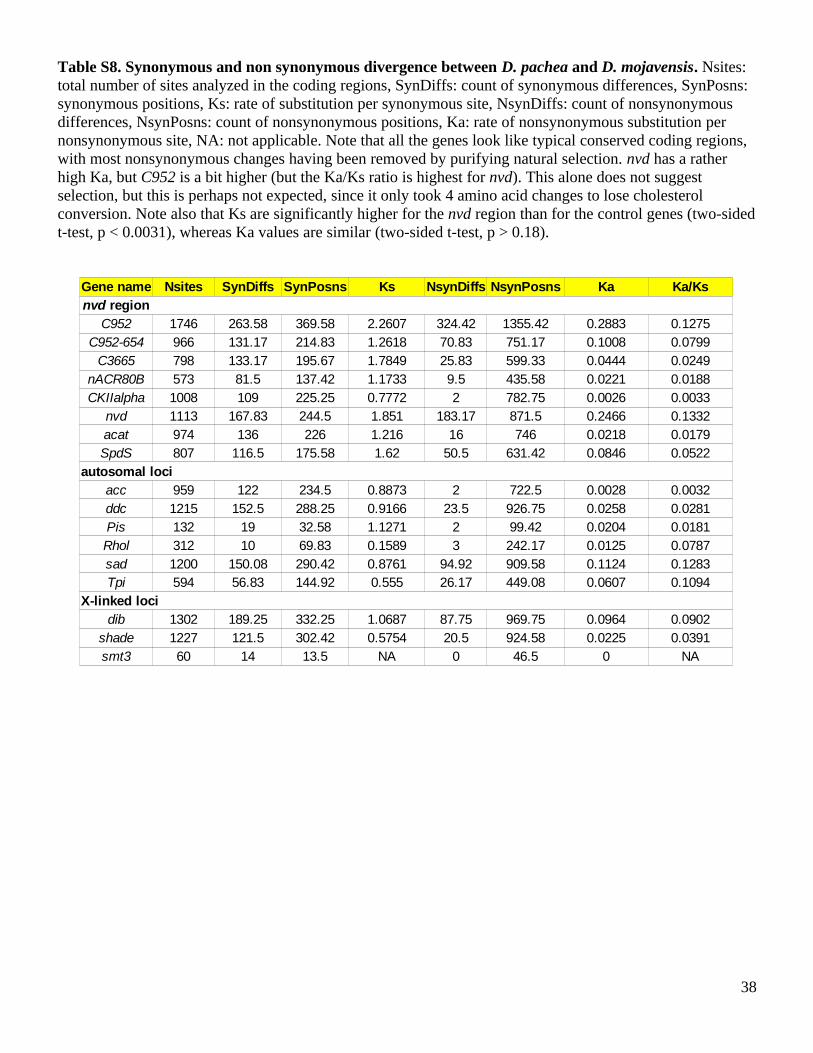
Table S8. Synonymous and non synonymous divergence between D. pachea and D. mojavensis. Nsites: total number of sites analyzed in the coding regions, SynDiffs: count of synonymous differences, SynPosns: synonymous positions, Ks: rate of substitution per synonymous site, NsynDiffs: count of nonsynonymous differences, NsynPosns: count of nonsynonymous positions, Ka: rate of nonsynonymous substitution per nonsynonymous site, NA: not applicable. Note that all the genes look like typical conserved coding regions, with most nonsynonymous changes having been removed by purifying natural selection. nvd has a rather high Ka, but C952 is a bit higher (but the Ka/Ks ratio is highest for nvd). This alone does not suggest selection, but this is perhaps not expected, since it only took 4 amino acid changes to lose cholesterol conversion. Note also that Ks are significantly higher for the nvd region than for the control genes (two-sided t-test, p < 0.0031), whereas Ka values are similar (two-sided t-test, p > 0.18).
38
C952 1746 263.58 369.58 2.2607 324.42 1355.42 0.2883 0.1275C952-654 966 131.17 214.83 1.2618 70.83 751.17 0.1008 0.0799C3665 798 133.17 195.67 1.7849 25.83 599.33 0.0444 0.0249
nACR80B 573 81.5 137.42 1.1733 9.5 435.58 0.0221 0.01881008 109 225.25 0.7772 2 782.75 0.0026 0.00331113 167.83 244.5 1.851 183.17 871.5 0.2466 0.1332974 136 226 1.216 16 746 0.0218 0.0179807 116.5 175.58 1.62 50.5 631.42 0.0846 0.0522
959 122 234.5 0.8873 2 722.5 0.0028 0.00321215 152.5 288.25 0.9166 23.5 926.75 0.0258 0.0281
Pis 132 19 32.58 1.1271 2 99.42 0.0204 0.0181312 10 69.83 0.1589 3 242.17 0.0125 0.07871200 150.08 290.42 0.8761 94.92 909.58 0.1124 0.1283594 56.83 144.92 0.555 26.17 449.08 0.0607 0.1094
1302 189.25 332.25 1.0687 87.75 969.75 0.0964 0.09021227 121.5 302.42 0.5754 20.5 924.58 0.0225 0.0391
smt3 60 14 13.5 NA 0 46.5 0 NA
Gene name Nsites SynDiffs SynPosns Ks NsynDiffs NsynPosns Ka Ka/Ksnvd region
CKIIalphanvdacatSpdS
autosomal lociaccddc
RholsadTpi
X-linked locidib
shade

Table S9. MacDonald-Kreitman scores in D. pachea. Ncodons: number of codons, SynPoly: number of synonymous polymorphic sites within D. pachea, SynDifs: number of fixed synonymous differences between D. pachea and D. mojavensis, NsynPoly: number of nonsynonymous polymorphic sites within D. pachea, NsynDifs: number of fixed nonsynonymous differences between D. pachea and D. mojavensis. The genes in the nvd region have low levels of polymorphism (see also Table S7) and only NAcR80B attains nominal significance, but this is not significant after correcting for the fact that 17 tests were performed. None of the control loci yield a signature of natural selection either.
39
C952 251 3 137 1 60 0.7533C952-654 322 4 135 0 64 0.4081C3665 217 0 117 1 11 1.0000
NAcR80B 165 2 70 3 8 0.0124336 0 109 0 2 1.0000207 1 154 1 69 0.8513227 1 97 1 10 0.4800222 1 110 1 28 0.8803
329 13 117 1 2 0.7260397 13 146 4 20 0.3378
Pis 44 3 18 0 2 0.599077 1 9 0 1 0.1356151 8 61 5 29 0.8952151 6 45 2 15 0.6638
357 17 152 5 51 0.9900411 16 121 0 18 0.2631
smt3 20 1 12 0 0 1.0000Total
1947 12 929 8 252 0.08261937 78 681 17 138 0.9124
Gene name Ncodons SynPoly SynDifs NsynPoly NsynDifs P valuenvd region
CKIIalphanvdacatSpdS
autosomal lociaccddc
RholsadTpi
X-linked locidib
shade
nvd regioncontrol loci

Table S10. Results of the MLHKA tests. For each gene we tested the null model (purely neutral variation for the listed gene and the 8 control genes) and the alternative selection model (possible selection on the listed gene and neutral variation of the 8 control genes). The likelihoods and corresponding chi-square and P-values indicate that every gene has sufficient data to suggest selection except NAcR80B. The k-values represent the estimated factor by which the diversity is decreased (when k < 1) compared to strict neutrality. Most k-values are within the same range, i.e. 6-10% of the expected neutral diversity. These MLHKA tests provide strong evidence for selection in the nvd region, but these tests alone cannot distinguish which gene(s) are under selection.
Gene Null likelihood Selection likelihood k Chi-square Probability
C952-654 66.636 59.712 0.098 13.849 1.97 x 10⁻⁴
C952 69.453 57.807 0.101 23.292 1.39 x 10⁻⁶
C3665 66.296 57.050 0.063 18.492 1.71 x 10⁻⁵
NAcR80B 58.736 57.285 0.396 2.901 0.088
CKIIalpha 64.828 56.881 0.061 15.896 6.70 x 10⁻⁵
nvd 69.043 58.582 0.056 20.922 4.78 x 10⁻⁶
acat 62.951 57.050 0.063 11.802 5.92 x 10⁻⁴
SpdS 65.243 57.176 0.090 16.135 5.90 x 10⁻⁵
40

Table S11. GC content in D. pachea and D. mojavensis coding genes. The coding regions that were sequenced in the 34 D. pachea individuals were aligned to D. mojavensis sequences and we calculated the percentage of GC in the aligned regions from D. pachea and D. mojavensis. The percentage of GC is significantly different between the nvd region and the control loci (Wilcoxon rank test, p < 0.0018).
D. pachea D. mojavensis
Gene name Length CG% Length CG%
nvd region
C952 1743 0.45 1728 0.36
C952-654 966 0.40 966 0.36
C952 1743 0.45 1728 0.36
C3665 798 0.47 795 0.42
nAcR80B 573 0.42 573 0.42
CKIIalpha 1008 0.44 1008 0.42
nvd 1116 0.43 1308 0.37
acat 974 0.46 1095 0.41
SpdS 807 0.42 744 0.36
average 9728 0.44 9945 0.39
control loci
acc 959 0.58 959 0.58
ddc 1215 0.57 1215 0.60
dib 1307 0.57 1304 0.57
pis 133 0.47 133 0.48
RhoI 312 0.45 312 0.45
sad 1208 0.55 1202 0.55
shade 1227 0.58 1235 0.57
smt3 61 0.59 72 0.43
Tpi_1 152 0.42 149 0.42
Tpi_2 596 0.61 596 0.59
average 7170 0.54 7177 0.52
41

42
References
1. A. Lwoff, L’Évolution physiologique: Étude des pertes de fonctions chez les
microorganismes (Hermann, Paris, 1944).
2. P. Romero et al., Computational prediction of human metabolic pathways from the
complete human genome. Genome Biol. 6, R2 (2005). doi:10.1186/gb-2004-6-1-
r2 Medline
3. D. Voet, Biochemistry (Wiley, Somerset, 1995).
4. X. Huang, J. T. Warren, L. I. Gilbert, New players in the regulation of ecdysone
biosynthesis. J. Genet. Genomics 35, 1 (2008). doi:10.1016/S1673-
8527(08)60001-6 Medline
5. W. B. Heed, H. W. Kircher, Unique sterol in the ecology and nutrition of Drosophila
pachea. Science 149, 758 (1965). doi:10.1126/science.149.3685.758 Medline
6. J. C. Fogleman, P. B. Danielson, Chemical interactions in the cactus microorganism
Drosophila model system of the Sonoran Desert. Am. Zool. 41, 877 (2001).
doi:10.1668/0003-1569(2001)041[0877:CIITCM]2.0.CO;2
7. C. E. Campbell, H. W. Kircher, Senita cactus: A plant with interrupted sterol
biosynthetic pathways. Phytochemistry 19, 2777 (1980). doi:10.1016/S0031-
9422(00)83969-2
8. Information on materials and methods is available on Science Online.
9. T. Yoshiyama, T. Namiki, K. Mita, H. Kataoka, R. Niwa, Neverland is an
evolutionally conserved Rieske-domain protein that is essential for ecdysone
synthesis and insect growth. Development 133, 2565 (2006).
doi:10.1242/dev.02428 Medline
10. V. Rottiers et al., Hormonal control of C. elegans dauer formation and life span by a
Rieske-like oxygenase. Dev. Cell 10, 473 (2006).
doi:10.1016/j.devcel.2006.02.008 Medline
11. S. Pitnick, W. B. Heed, New species of cactusbreeding Drosophila (Diptera:
Drosophilidae) in the Nannoptera species group. Ann. Entomol. Soc. Am. 87, 307
(1994).
12. R. Lafont, C. DauphinVillemant, J. T. Warren, H. H. Rees, in Comprehensive
Molecular Insect Science, L. I. Gilbert, K. Iatrou, S. Gill, Eds. (Oxford, 2005),
vol. 3, pp. 125–195.
13. C. Blais, T. Blasco, A. Maria, C. DauphinVillemant, R. Lafont, Characterization of
ecdysteroids in Drosophila melanogaster by enzyme immunoassay and
nanoliquid chromatographytandem mass spectrometry. J. Chromatogr. B Analyt.
Technol. Biomed. Life Sci. 878, 925 (2010). doi:10.1016/j.jchromb.2010.02.018
Medline

43
14. K. C. Goodnight, H. W. Kircher, Metabolism of lathosterol by Drosophila pachea.
Lipids 6, 166 (1971). doi:10.1007/BF02533031 Medline
15. T. Yoshiyama-Yanagawa et al.; T. YoshiyamaYanagawa et al, The conserved Rieske
oxygenase DAF-36/Neverland is a novel cholesterol-metabolizing enzyme. J.
Biol. Chem. 286, 25756 (2011). doi:10.1074/jbc.M111.244384 Medline
16. O. Mittapalli et al., Tissue-specific transcriptomics of the exotic invasive insect pest
emerald ash borer (Agrilus planipennis). PLoS ONE 5, e13708 (2010).
doi:10.1371/journal.pone.0013708 Medline
17. Y. Kim, R. Nielsen, Linkage disequilibrium as a signature of selective sweeps.
Genetics 167, 1513 (2004). doi:10.1534/genetics.103.025387 Medline
18. L. Timmons et al., Green fluorescent protein/β-galactosidase double reporters for
visualizing Drosophila gene expression patterns. Dev. Genet. 20, 338 (1997).
doi:10.1002/(SICI)1520-6408(1997)20:4<338::AID-DVG5>3.0.CO;2-8 Medline
19. A. M. Huang, E. J. Rehm, G. M. Rubin, Recovery of DNA sequences flanking
Pelement insertions in Drosophila: Inverse PCR and plasmid rescue. Cold Spring
Harb. Protoc. 2009, t5199 (2009). doi:10.1101/pdb.prot5199
20. K. Rutherford et al., Artemis: Sequence visualization and annotation. Bioinformatics
16, 944 (2000). doi:10.1093/bioinformatics/16.10.944 Medline
21. P. C. Ng, S. Henikoff, SIFT: Predicting amino acid changes that affect protein
function. Nucleic Acids Res. 31, 3812 (2003). doi:10.1093/nar/gkg509 Medline
22. T. Hall, BioEdit: A userfriendly biological sequence alignment editor and analysis
program for Windows 95/98/NT. Nucleic Acids Symposium Series 41, 95 (1999).
23. Z. Yang, PAML 4: Phylogenetic analysis by maximum likelihood. Mol. Biol. Evol.
24, 1586 (2007). doi:10.1093/molbev/msm088 Medline
24. M. Wessner et al., Ecdysteroids from Ajuga iva. Phytochemistry 31, 3785 (1992).
doi:10.1016/S0031-9422(00)97527-7
25. J. P. Girault et al., Ecdysteroids from Leuzea carthamoides. Phytochemistry 27, 737
(1988). doi:10.1016/0031-9422(88)84085-8
26. R. Niwa et al., CYP306A1, a cytochrome P450 enzyme, is essential for ecdysteroid
biosynthesis in the prothoracic glands of Bombyx and Drosophila. J. Biol. Chem.
279, 35942 (2004). doi:10.1074/jbc.M404514200 Medline
27. J. T. Warren et al., Molecular and biochemical characterization of two P450 enzymes
in the ecdysteroidogenic pathway of Drosophila melanogaster. Proc. Natl. Acad.
Sci. U.S.A. 99, 11043 (2002). doi:10.1073/pnas.162375799 Medline
28. G. E. Roth et al., The Drosophila gene Start1: a putative cholesterol transporter and
key regulator of ecdysteroid synthesis. Proc. Natl. Acad. Sci. U.S.A. 101, 1601
(2004). doi:10.1073/pnas.0308212100 Medline

44
29. A. E. Christian, M. P. Haynes, M. C. Phillips, G. H. Rothblat, Use of cyclodextrins
for manipulating cellular cholesterol content. J. Lipid Res. 38, 2264 (1997).
Medline
30. S. Lavrov, J. Déjardin, G. Cavalli, Combined immunostaining and FISH analysis of
polytene chromosomes. Methods Mol. Biol. 247, 289 (2004). Medline
31. D. R. Zerbino, E. Birney, Velvet: Algorithms for de novo short read assembly using
de Bruijn graphs. Genome Res. 18, 821 (2008). doi:10.1101/gr.074492.107
Medline
32. H. Li, R. Durbin, Fast and accurate short read alignment with Burrows-Wheeler
transform. Bioinformatics 25, 1754 (2009). doi:10.1093/bioinformatics/btp324
Medline
33. J. T. Robinson et al., Integrative genomics viewer. Nat. Biotechnol. 29, 24 (2011).
doi:10.1038/nbt.1754 Medline
34. A. Drummond et al., Geneious (2011); http://www.geneious.com.
35. D. A. Dmitriev, R. A. Rakitov, Decoding of superimposed traces produced by direct
sequencing of heterozygous indels. PLOS Comput. Biol. 4, e1000113 (2008).
doi:10.1371/journal.pcbi.1000113 Medline
36. M. Stephens, N. J. Smith, P. Donnelly, A new statistical method for haplotype
reconstruction from population data. Am. J. Hum. Genet. 68, 978 (2001).
doi:10.1086/319501 Medline
37. J. K. Pritchard, M. Stephens, P. Donnelly, Inference of population structure using
multilocus genotype data. Genetics 155, 945 (2000). Medline
38. D. Reich, A. L. Price, N. Patterson, Principal component analysis of genetic data. Nat.
Genet. 40, 491 (2008). doi:10.1038/ng0508-491 Medline
39. P. Librado, J. Rozas, DnaSP v5: A software for comprehensive analysis of DNA
polymorphism data. Bioinformatics 25, 1451 (2009).
doi:10.1093/bioinformatics/btp187 Medline
40. J. H. McDonald, M. Kreitman, Adaptive protein evolution at the Adh locus in
Drosophila. Nature 351, 652 (1991). doi:10.1038/351652a0 Medline
41. S. I. Wright, B. Charlesworth, The HKA test revisited: A maximum-likelihood-ratio
test of the standard neutral model. Genetics 168, 1071 (2004).
doi:10.1534/genetics.104.026500 Medline
42. R. R. Hudson, M. Kreitman, M. Aguadé, A test of neutral molecular evolution based
on nucleotide data. Genetics 116, 153 (1987). Medline
43. M. F. Feldlaufer, G. F. Weirich, R. B. Imberski, J. A. Svoboda, Ecdysteroid
production in Drosophila melanogaster reared on defined diets. Insect Biochem.
Mol. Biol. 25, 709 (1995). doi:10.1016/0965-1748(95)00009-K Medline

45
44. Y. Kim, W. Stephan, Detecting a local signature of genetic hitchhiking along a
recombining chromosome. Genetics 160, 765 (2002). Medline
45. P. Pavlidis, N. Alachiotis, OmegaPlus 2.0.0 software (2012) (available at
http://sco.hits. org/exelixis/software/OmegaPlus_Manual.pdf).
46. R. R. Hudson, Generating samples under a Wright-Fisher neutral model of genetic
variation. Bioinformatics 18, 337 (2002). doi:10.1093/bioinformatics/18.2.337
Medline
47. P. Sabeti, Sweep software (available at
http://www.broadinstitute.org/mpg/sweep/index.html).
48. D. V. Zaykin, A. Pudovkin, B. S. Weir, Correlation-based inference for linkage
disequilibrium with multiple alleles. Genetics 180, 533 (2008).
doi:10.1534/genetics.108.089409 Medline
49. J. H. Shin, S. Blay, B. McNeney, J. Graham, LDheatmap: An R Function for
Graphical Display of Pairwise Linkage Disequilibria Between Single Nucleotide
Polymorphisms, Journal of Statistical Software 16 (available at
http://rgm2.lab.nig.ac.jp/RGM2/func.php?rd_id=LDheatmap:LDheatmap).
50. S. Nishi, H. Nishino, T. Ishibashi, cDNA cloning of the mammalian sterol C5-
desaturase and the expression in yeast mutant. Biochim. Biophys. Acta 1490, 106
(2000). doi:10.1016/S0167-4781(99)00248-1 Medline
51. G. Vinci, X. Xia, R. A. Veitia, Preservation of genes involved in sterol metabolism in
cholesterol auxotrophs: facts and hypotheses. PLoS ONE 3, e2883 (2008).
doi:10.1371/journal.pone.0002883 Medline
52. S. W. Schaeffer et al., Polytene chromosomal maps of 11 Drosophila species: Tthe
order of genomic scaffolds inferred from genetic and physical maps. Genetics
179, 1601 (2008). doi:10.1534/genetics.107.086074 Medline
53. M. D. Adams et al., The genome sequence of Drosophila melanogaster. Science 287,
2185 (2000). doi:10.1126/science.287.5461.2185 Medline
54. G. J. Filion et al., Systematic protein location mapping reveals five principal
chromatin types in Drosophila cells. Cell 143, 212 (2010).
doi:10.1016/j.cell.2010.09.009 Medline
55. R. A. Hoskins et al., Sequence finishing and mapping of Drosophila melanogaster
heterochromatin. Science 316, 1625 (2007). doi:10.1126/science.1139816
Medline
56. S. M. Mount et al., Splicing signals in Drosophila: Intron size, information content,
and consensus sequences. Nucleic Acids Res. 20, 4255 (1992).
doi:10.1093/nar/20.16.4255 Medline

46
57. J. C. Yasuhara, B. T. Wakimoto, Oxymoron no more: The expanding world of
heterochromatic genes. Trends Genet. 22, 330 (2006).
doi:10.1016/j.tig.2006.04.008 Medline
58. J. C. Yasuhara, C. H. DeCrease, B. T. Wakimoto, Evolution of heterochromatic genes
of Drosophila. Proc. Natl. Acad. Sci. U.S.A. 102, 10958 (2005).
doi:10.1073/pnas.0503424102 Medline
59. S. R. Schulze et al., Heterochromatic genes in Drosophila: A comparative analysis of
two genes. Genetics 173, 1433 (2006). doi:10.1534/genetics.106.056069 Medline
60. T. F. C. Mackay et al., The Drosophila melanogaster Genetic Reference Panel.
Nature 482, 173 (2012). doi:10.1038/nature10811 Medline
61. R. J. Kulathinal, S. M. Bennett, C. L. Fitzpatrick, M. A. F. Noor, Fine-scale mapping
of recombination rate in Drosophila refines its correlation to diversity and
divergence. Proc. Natl. Acad. Sci. U.S.A. 105, 10051 (2008).
doi:10.1073/pnas.0801848105 Medline
62. A. G. Clark et al.; Drosophila 12 Genomes Consortium, Evolution of genes and
genomes on the Drosophila phylogeny. Nature 450, 203 (2007).
doi:10.1038/nature06341 Medline
63. B. L. Ward, W. B. Heed, Chromosome phylogeny of Drosophila pachea and related
species. J. Hered. 61, 248 (1970). Medline