supplementary methods estimation of tmrca using …flmendez/papers/mendez_2011_suppl.pdf ·...
TRANSCRIPT
Supplementary methods
Estimation of TMRCA using BATWING
The program Bayesian Analysis of Trees With Internal Node Generation (BATWING)
(Wilson et al. 2003) was run using a model of a single population with a period of constant
size followed by exponential growth. The BATWING run consisted of 700,000 sampled
points, following 50,000 steps of warmup. The parameters Nbetasamp and Treebetn were set
to 20 and 15, respectively. The results were qualitatively the same for a run half as long.
The states of several SNPs were used to condition the genealogy. The SNPs
considered were M91, M42, M60, M168, M96, M35, P143, M216, P14, M201, P123, M304,
M9, M526, P326, M20, M184, M70, L131, PS21, P77, M214, M45, M242, M207, M267,
M172, P321, and P322. To estimate the age of individual branches, the minimum time of the
mutations defining a branch was extracted from the output of BATWING and the distribution
of those times was used in downstream analyses. The distributions of ratios of branch ages
were obtained analogously. These ratios were seen to be rather independent of the priors on
effective size (data not shown). Median and mean values, and 95% confidence intervals were
obtained for the age of the mutations (Tables 1 and 2).
Method of estimating TMRCA using the distribution of SNPs in the genealogy
Mutations ascertained in a single lineage were examined, determining their temporal
distribution in the genealogy of haplogroup T. This distribution was used to calculate the
likelihoods of the relative branching times within the genealogy, which can be converted into
absolute times by the use of an appropriate calibration point. We used as a calibration point
the TMRCA of K haplogroup, considering both 47.4 Ky (Karafet et al. 2008) and 48.1Ky
(according to BATWING results).
1

For uniformly ascertained mutations (in only one chromosome of the haplogroup) the
probability distribution for the time of occurrence is uniform. Let us consider a branching
time extending back a fraction p of the TMRCA of this lineage with the closest lineage in the
ascertainment sample, and call proximal mutations those more recent than this branching
time. If during the ascertainment process n mutations were ascertained to this lineage, the
conditional probability of observing k proximal out of n mutations is
P K=k∣n , p = n!k !⋅n−k !
⋅pk⋅1−pn−k
The likelihood of p is proportional to a Beta function with parameters k+1 and n-k+1. The
log-likelihood can be written as
ln L p=ck⋅ln pn−k ⋅ln 1−p ,
where c is a constant.
For example, using 47.4 Ky the TMRCA of haplogroup K, we would obtain
ln Lt =ck⋅ln t47.4 n−k ⋅ln 1− t
47.4 ,
where t is the TMRCA of the internal node of interest expressed in thousands of years.
This method can be extended to the joint estimation of several nodes along a lineage
by extending the approach to a multidimensional case. Branching events divide the history of
a lineage in different periods, and the number of mutations follows a multinomial distribution
in which the parameters are proportional to the length of those periods. Then, the probability
of observing k1,..., km mutations in the m periods determined by the m-1 branching points is
P K1=k1 ,... , K m=km∣∑i=1
mk i , p1 , ... , pm−1=∑i=1
mk i!
∏i=1
mk i!
⋅∏i=1
m−1p i
k⋅1−∑i=1
m−1p i
n−k
The likelihood function follows a Dirichlet distribution. Correspondingly, the log-likelihood
can be written as
2
ln L p1, ... , pm=c∑i=1
m−1k i⋅ln pikm⋅ln 1−∑i=1
m−1pi
Joint use of SNPs and STRs
The estimation of the TMRCA involving STRs and SNPs uses the likelihood calculated from
SNPs and an approximation of the likelihood given by STRs. The approximation takes the
posterior distribution of TMRCA obtained from BATWING, bins the range of the TMRCA
and uses the frequency of data points within each bin of TMRCA as an estimation of the
likelihood corresponding to the bin. The relative value of the likelihood is assigned to the
middle point of the bin. As the mutational processes in SNPs and STRs are independent, the
log-likelihoods can be added.
Estimation of TMRCA for haplogroups T and L
Most mutations in haplogroup T and the mutation P326 were not discovered by uniform
ascertainment of SNPs. We made some considerations on how the ascertainment process
influence the estimated likelihoods for the relative ages of the branching events.
Ascertainment bias is unlikely to affect the relative number of mutations observed in the
branch containing M184, M272, M193, L206 and PS129 compared with the branch
containing M70 and PS78 (Figure 1), because the frequency of T* is extremely low. Given
that the mutation P326 was discovered while sequencing samples in haplogroup T, the branch
containing it should not have an excess of discovered mutations. The question of how many
mutations are expected between the MRCA of T1 and a tip in the tree was addressed by
considering that in Rozen et al. (2009) one sample has two mutations, PS2 and PS21, and the
other has none. We chose 1 as the expected value. We repeated the calculation using nine
mutations to estimate the TMRCA values of TL, T and T1, and then combined the likelihood
with those coming from BATWING.
3
References
Rozen, S., J. D. Marszalek, R. K. Alagappan et al. 2009. Remarkably little variation in
proteins encoded by the Y chromosome's single copy genes, implying effective purifying
selection. Am J Hum Genet 85: 923-928
Karafet, T. M., F. L. Mendez, M. B. Meilerman et al. 2008. New binary polymorphisms
reshape and increase resolution of the human Y chromosomal haplogroup tree. Genome
Res 18: 830-838.
Wilson, I. J., Weale, M. E., Balding, D. J. 2003. Inferences from DNA data: population
histories, evolutionary processes and forensic match probabilities. J Roy Stat Soc:
Series A 166: 155-188.
4

Table S1. Sample sizes from each population in the three sets of genotyped samples
Population Set1a Set 2b Set 3c
Egyptians (Egy) 150 122 10
Tunisians (Tun) 34 - -
Ethiopians (Eth) 58 - 2
Palestinians (Pal) 115 111 6
Bedouins (Bed) 28 27 -
Druze (Dru) 39 35 3
Jordanians (Jor) 187 181 5
Lebanese (Leb) 34 26 -
Syrians (Syr) 95 90 3
Turks (Tur) 284 122 3
Assyrians (Asr) 31 31 4
Iraqis (Irq) 36 31 2
Iranians (Irn) 73 60 1
Saudi Arabians (Sau) 33 32 -
Yemeni (Yem) 18 17 -
Moroccan Jews (MorJ) 54 26 4
Tunisian Jews (TunJ) 10 9 -
Ethiopian Jews (EthJ) 21 - 1
Kurdish Jews (KurJ) 50 13 8
Iraqi Jews (ItqJ) 32 30 6
Iranian Jews (IrnJ) 22 - 2
Yemenite Jews (YemJ) 44 32 3
Uzbeki Jews (UzbJ) 9 - -
Bulgarian Jews (BulJ) 42 41 2
Turkish Jews (TurJ) 34 34 2
Roman Jews (RomJ) 53 43 3
Ashkenazi Jews (AshJ) 587 139 6
Bulgarians (Bul) 29 27 -
Lemba (Lem) 34 - 6
Israeli Jew - - 1
Dutch - - 1
French - - 1
German - - 1
Italians - - 4
Total 2236 1279 90a Samples used to estimate the frequency of haplogroup T and its sub-branchesb Samples run in BATWING for populations that are treated as a single population
and genotyped for at least 10 Y-STRsc Samples belonging to haplogroup T and genotyped for at least 24 Y-STRs
5
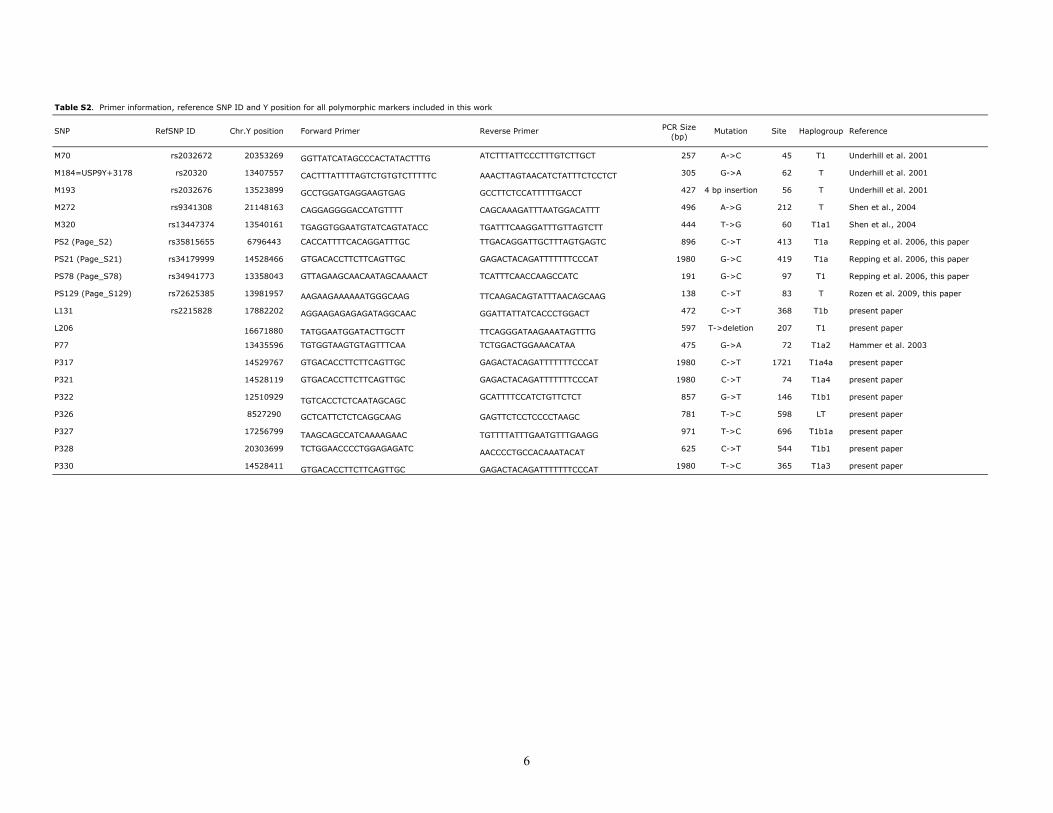
Table S2. Primer information, reference SNP ID and Y position for all polymorphic markers included in this work
SNP RefSNP ID Chr.Y position Forward Primer Reverse Primer PCR Size (bp)
Mutation Site Haplogroup Reference
M70 rs2032672 20353269 GGTTATCATAGCCCACTATACTTTG ATCTTTATTCCCTTTGTCTTGCT 257 A->C 45 T1 Underhill et al. 2001
M184=USP9Y+3178 rs20320 13407557 CACTTTATTTTAGTCTGTGTCTTTTTC AAACTTAGTAACATCTATTTCTCCTCT 305 G->A 62 T Underhill et al. 2001
M193 rs2032676 13523899 GCCTGGATGAGGAAGTGAG GCCTTCTCCATTTTTGACCT 427 4 bp insertion 56 T Underhill et al. 2001
M272 rs9341308 21148163 CAGGAGGGGACCATGTTTT CAGCAAAGATTTAATGGACATTT 496 A->G 212 T Shen et al., 2004
M320 rs13447374 13540161 TGAGGTGGAATGTATCAGTATACC TGATTTCAAGGATTTGTTAGTCTT 444 T->G 60 T1a1 Shen et al., 2004
PS2 (Page_S2) rs35815655 6796443 CACCATTTTCACAGGATTTGC TTGACAGGATTGCTTTAGTGAGTC 896 C->T 413 T1a Repping et al. 2006, this paper
PS21 (Page_S21) rs34179999 14528466 GTGACACCTTCTTCAGTTGC GAGACTACAGATTTTTTTCCCAT 1980 G->C 419 T1a Repping et al. 2006, this paper
PS78 (Page_S78) rs34941773 13358043 GTTAGAAGCAACAATAGCAAAACT TCATTTCAACCAAGCCATC 191 G->C 97 T1 Repping et al. 2006, this paper
PS129 (Page_S129) rs72625385 13981957 AAGAAGAAAAAATGGGCAAG TTCAAGACAGTATTTAACAGCAAG 138 C->T 83 T Rozen et al. 2009, this paper
L131 rs2215828 17882202 AGGAAGAGAGAGATAGGCAAC GGATTATTATCACCCTGGACT 472 C->T 368 T1b present paper
L206 16671880 TATGGAATGGATACTTGCTT TTCAGGGATAAGAAATAGTTTG 597 T->deletion 207 T1 present paper
P77 13435596 TGTGGTAAGTGTAGTTTCAA TCTGGACTGGAAACATAA 475 G->A 72 T1a2 Hammer et al. 2003
P317 14529767 GTGACACCTTCTTCAGTTGC GAGACTACAGATTTTTTTCCCAT 1980 C->T 1721 T1a4a present paper
P321 14528119 GTGACACCTTCTTCAGTTGC GAGACTACAGATTTTTTTCCCAT 1980 C->T 74 T1a4 present paper
P322 12510929 TGTCACCTCTCAATAGCAGC GCATTTTCCATCTGTTCTCT 857 G->T 146 T1b1 present paper
P326 8527290 GCTCATTCTCTCAGGCAAG GAGTTCTCCTCCCCTAAGC 781 T->C 598 LT present paper
P327 17256799 TAAGCAGCCATCAAAAGAAC TGTTTTATTTGAATGTTTGAAGG 971 T->C 696 T1b1a present paper
P328 20303699 TCTGGAACCCCTGGAGAGATC AACCCCTGCCACAAATACAT 625 C->T 544 T1b1 present paper
P330 14528411 GTGACACCTTCTTCAGTTGC GAGACTACAGATTTTTTTCCCAT 1980 T->C 365 T1a3 present paper
6

Supplementary Figure Legends
Supplementary Figure 1.
Two-dimensional plots based on a principal component decomposition of the kinship R matrix
derived from the Y chromosome haplogroup frequencies: (a) 28 populations; (b) 27 populations;
(c) 26 populations;(d) 25 populations;(e) 24 populations;(f) 23 populations. The population codes
are as follows: Assyr (Assyrians), Bed (Bedouins), Bulg (Bulgarians), Druze (Druze), Egypt
(Egyptians), Iran (Iranians), Iraq (Iraqis), Jor (Jordanians), Leb (Lebanese), Lemba (Lemba), Eth
(Ethiopians), Palest (Palestinians), Saudi (Saudi Arabians), Syr (Syrians), Tun (Tunisians), Turks
(Turks), Ash (Ashkenazi Jews), BulJ (Bulgarian Jews), IranJ (Iranian Jews), IraqJ (Iraqi Jews),
KurdJ (Kurdish Jews) MorJ (Moroccan Jews), RomJ (Roman Jews), TunJ (Tunisian Jews), TurkJ
(Turkish Jews), UzbJ (Uzbeki Jews), Yem (Yemenis), YemJ (Yemenite Jews).
7

8