supplementary methods · web viewftnd and the c ategorical n icotine d ependence p henotype. as in...
TRANSCRIPT

Supplementary Methods
Nicotine dependence studies. Our study included European/European American (EUR)
and African American (AA) ever-smokers from 15 independent studies with data obtained from
original study investigators and/or the database of Genotypes and Phenotypes (dbGaP). Five of
the studies (total N=17,074 EUR) were included in our prior GWAS meta-analysis of nicotine
dependence:1 Collaborative Genetic Study of Nicotine Dependence (COGEND)2; Chronic
Obstructive Pulmonary Disease Gene (COPDGene)3; deCODE Genetics; Environment and
Genetics in Lung Cancer Etiology Study (EAGLE)4, 5; and Study of Addiction: Genetics and
Environment (SAGE)6. The present study included another 10 studies: African American
Nicotine Dependence (AAND); COGEND2; Center for Oral Health Research in Appalachia 1
(COHRA1)7; Finnish Twin Cohort (FTC); Genetic Association Information Network (GAIN)
GWAS of schizophrenia8; Jackson Heart Study (JHS) / Atherosclerosis Risk in Communities
(ARIC); Molecular Genetics of Schizophrenia—nonGAIN study; Netherlands Twin Registry
(NTR); University of Wisconsin-Transdisciplinary Tobacco Use Research Center (UW-
TTURC)9; and Yale-Penn. Ever-smokers were defined by having reported smoking 100 or more
cigarettes in their lifetime, unless otherwise stated. As before,1 our analyses centered around
studies with Fagerström Test for Nicotine Dependence (FTND) data available.10, 11
AAND. AAND was designed as an AA-focused, community-based study
to compare nicotine dependent smokers with smokers who never developed
nicotine dependence symptoms. Its participants were recruited from the
Chicago area between 2010 and 2013 and administered the FTND to
determine study eligibility. Genotyping was conducted using the Illumina
Omni Express array. After applying our standard QC steps, the final analysis
1

data set included 1,687 AAs with data on the FTND phenotype and
covariates (age, sex, and principal component [PC] eigenvectors computed
to remove any residual bias due to population stratification).
COGEND. AAND was modeled after COGEND, a case–control study that began
in 2001 comparing nicotine dependent smokers to smokers who never developed dependence.2
COGEND recruited participants aged 25 to 44 years old from St. Louis and Detroit and
administered the FTND to determine study eligibility. Current smokers with an FTND score of
>4 were recruited as nicotine dependent cases, while smokers who reported >100 cigarettes
during their lifetime but FTND score <1 were recruited as controls. Participants were genotyped
as part of (1) the Study of Addiction: Genetics and Environment (SAGE)6 using the Illumina
Human1M-Duo array (dbGaP accession number phs000092.v1.p1) or (2) Gene Environment
Association Studies Initiative (GENEVA)12 using the Illumina HumanOmni2.5 array (dbGaP
accession number phs000404.v1.p1). In each subset, we retained genotyped SNPs with a call rate
>98% and HWE P>1×10⁻⁴. We then combined the subsets and removed duplicated participants
and first-degree relatives. We carried forward only the SNPs genotyped at the intersection of the
different arrays to circumvent potential bias from combining participants genotyped on different
arrays.13 We applied our standard QC procedures on the combined COGEND subsets, resulting
in 1,935 EAs and 704 AAs with FTND phenotype and covariate (age, sex, and PC eigenvectors)
data for analysis.
COGEND2. COGEND2 was carried out for new recruitment following the COGEND
study design. The EA and AA participants were ascertained between 2011 and 2014 and were
genotyped on the Illumina Omni Express array, alongside the AAND participants.
2

Following our standard QC, there were 292 EAs and 313 AAs for analysis with FTND
phenotype and covariate (age, sex, and PC eigenvectors) data.
COHRA1. COHRA1 represents one of a four-site study designed to conduct genome-
wide association study (GWAS) analyses of dental caries.7 COHRA1 had FTND data available,
unlike the other dental caries GWAS studies. COHRA1 recruitment began in 2003 from four
rural Appalachian counties, two in West Virginia and two in Pennsylvania, and an urban
Appalachian region. Families with at least one adult and one biological child residing in the same
household were recruited. Genotyping was conducted using the Illumina Human610 array. We
obtained their genotyping data from dbGaP accession number phs000095.v2.p1 and their FTND
data from the original study investigators. In families with FTND data available on both
parent(s) and child, our QC step for relatedness entailed selecting a single family member based
first on FTND data availability and secondly on highest call rate if more than one family member
had FTND data available. Following QC, there were 243 EAs with FTND phenotype and
covariate (age, sex, and PC eigenvectors) data used for analysis. Of these, 12 participants were
<18 years old.
COPDGene. COPDGene is a multicenter observational study of COPD cases and
controls from across the United States.3 Participants were aged 45 to 80 years old and reported a
history of smoking (currently or past) and 10 or more cigarette pack-years. The present study
included Non-Hispanic white (henceforth referred to as EUR) and AA current smokers with
FTND data available. Among the COPD cases, the Global Initiative for Chronic Obstructive
Lung Disease (GOLD) criteria were used to stage disease severity based on post-bronchodilator
pulmonary function measures. COPD controls had pulmonary function measures in the normal
range for their sex, age and height. Acute and chronic respiratory disease, cancer and other
3

conditions were used as exclusion criteria. Participants were genotyped on the Illumina
HumanOmni1-Quad array and made available via dbGaP (accession number phs000765.v1.p2).
Following QC, we analyzed 2,211 EAs and 2,115 AAs with FTND phenotype and covariate
(age, sex, disease severity [stages of 0, 1-2, and 3-4], and PC eigenvectors) data.
deCODE Genetics. deCODE Genetics, a large population-based study from Iceland
collected over 18 years (1996–2014), included participants that were originally recruited for
different genetic studies of smoking-related and other phenotypes along with population controls.
The deCODE Genetics study was approved by the Data Protection Commission of Iceland and
the National Bioethics Committee of Iceland. The participants’ cigarette smoking data, as
previously described,14 were gathered using questionnaire data on cigarettes per day (CPD) and
the other FTND components. A third-party system was used to encrypt personal identifiers
associated with phenotypic information and blood samples.15 As used before,1 the present study
included 9,090 smokers who were genotyped using Illumina SNP array chips in one of several
GWAS conducted by deCODE Genetics. Their QC steps were previously described.16 Among
those classified as having mild dependence, 1,558 had FTND data and another 4,313 were low-
intensity smokers who had CPD data available (see “Categorical nicotine dependence
phenotype” for additional details) as well as age and sex to include as covariates.
EAGLE. The population-based EAGLE study recruited newly diagnosed lung cancer
cases and matched controls, aged 35 to 79 years old, from the Italian region of Lombardy.4, 5
EAGLE participants were genotyped on the Illumina HumanHap550v3 array, as part of
GENEVA.12 Their data were deposited in the database of Genotypes and Phenotypes (dbGaP;
accession number phs000093.v2.p2), where we obtained their genome-wide SNP genotypes,
overall FTND score among current and former smokers, and other phenotype and covariate data.
4

Specific FTND item analyses were conducted by the original study investigators. After applying
all participant-level and SNP-level quality control (QC) procedures that were recommended in
the dbGaP release as well as our own set of standard QC procedures, the final analysis data set
for EAGLE included 3,006 participants with FTND phenotype and covariate (age, sex, lung
cancer case/control status, and PC eigenvectors) data. As before,1 since FTND data were
collected based on lifetime and not current smoking habits, lung cancer case/control status was
not included as a covariate.
FTC. Participants originated from the following sub-cohorts of the FTC: (i) the Nicotine
Addiction Genetics (NAG) study of adult twins, who were born between 1938 and 1957 and
were concordant for ever smoking, and their family members (mainly siblings); (ii) a population-
based longitudinal study of five consecutive Finnish twin birth cohorts (1983–1987,
FinnTwin12); and (iii) a population‐based longitudinal study of five consecutive Finnish twin
birth cohorts (1975–1979, FinnTwin16).17, 18 Genotyping was conducted on the Illumina
Human670-QuadCustom or HumanCoreExome array. Their QC procedures have been
previously described.19 The FTC sub-cohorts were imputed separately by genotyping array and
then all available SNPs were merged for analysis with altogether 2,374 participants having
FTND phenotype and covariate (age, sex, birth cohort, and PC eigenvectors) data.
GAIN. The GAIN originated from the U.S.-based Molecular Genetics of Schizophrenia
study.8 Their genotyping was conducted separately using the Affymetrix 6.0 array. We obtained
the data from the Molecular Genetics of Schizophrenia study participants genotyped under the
auspices of GAIN via dbGaP accession number phs000021.v3.p2. Using only the schizophrenia
controls, we applied our standard QC procedures, resulting in the inclusion of 774 EAs and 477
AAs with FTND phenotype and covariate (age, sex, and PC eigenvectors) data.
5

JHS/ARIC. JHS is a longitudinal cohort study of AAs from the Jackson, Mississippi
metropolitan area.20 AAs aged 35 to 84 years old were recruited from the general population,
along with family members aged 21 to 34 years old. Its study design was an extension of the
ARIC longitudinal cohort study that ascertained EA and AA participants (aged 45–64) from four
U.S. communities (Jackson, Mississippi; Forsyth County, North Carolina; suburbs of
Minneapolis, Minnesota; and Washington County, Maryland).21 In both JHS and ARIC, ever-
smokers were defined by report of smoking 400 or more cigarettes in their lifetime. Our study
focused on AA ever-smokers across JHS and ARIC. Like the approach taken in deCODE, we
used the participants with FTND data (all from JHS), supplemented with low-intensity smokers
from ARIC with only CPD data available (see “Categorical nicotine dependence phenotype” for
additional details).
We obtained genome-wide SNP genotype data, generated on the Affymetrix 6.0 array via
dbGaP accession numbers phs000090.v1.p1 for ARIC and phs000286.v3.p1 for JHS. After
applying our standard QC, there were 1,143 with FTND or CPD phenotype and covariate (age,
sex, and PC eigenvectors) data (N=628 from JHS and 515 from ARIC). JHS included
participants originally recruited under ARIC and others recruited under JHS only, but our QC
confirmed that there were no duplicated participants across the JHS and ARIC subsets used for
analysis (as confirmed by identity-by-state <0.9).
nonGAIN. The nonGAIN study originated from the same U.S.-based Molecular Genetics
of Schizophrenia study, as the GAIN study. Genotyping data from the remainder of the
Molecular Genetics of Schizophrenia study8 participants (denoted nonGAIN) were obtained via
dbGaP accession number phs000167.v1.p1. We used only the schizophrenia controls, applied
6

our standard QC, and included 471 EAs with complete FTND and covariate (age, sex, and PC
eigenvectors) data in the final analysis data set.
NTR. Established in 1987, the NTR recruited twins and other multiple birth siblings for
longitudinal research in two collections: the Adult NTR including twins and their family
members, and the Young NTR including twins recruited at birth or in early life and their parents
and sibs.22A subset of NTR participants have genome-wide genotype data derived from various
Affymetrix and Illumina arrays.23, 24 QC procedures have been described elsewhere.24 SNPs that
passed all QC checks were merged across different arrays and used for imputation. NTR filtered
out imputed SNPs with MAF<0.5%, HWE P<1×10⁻⁵, Rsq<0.3, Mendelian error rate<2%, or
absolute reference frequency allele difference>0.15 between NTR and 1000 Genomes (1000G).
We analyzed data from 3,599 NTR participants who passed QC and had FTND25 and covariate
information (age, sex, dummy variables to correct for genotyping array, and PC eigenvectors)
available.
SAGE*. SAGE encompasses three U.S.-based case–control studies of addictive disorders
that were ascertained in the United States: COGEND, the Collaborative Study on the Genetics of
Alcoholism,26 and the Family Study of Cocaine Dependence.27 COGEND participants were
removed to avoid redundancy in our study; the remaining participants (henceforth referred to as
SAGE*) were analyzed together as done in prior GWAS analyses.1, 6 We obtained their Illumina
Human1M-Duo genotype and phenotype data via dbGaP (accession number phs000092.v1.p1)
and applied our standard QC procedures, leaving 832 EAs and 633 AAs for analysis with FTND
phenotype data and covariates (age, sex, DSM-IV-defined cocaine dependence, DSM-IV-defined
alcohol dependence, and PC eigenvectors)
7

UW-TTURC. Beginning in 2001, UW-TTURC recruited smokers in Madison and
Milwaukee, Wisconsin for smoking cessation treatment clinical trials.9 Participants smoked at
least 10 CPD and reported being motived to quit smoking. We obtained their Illumina
HumanOmni2.5 genotypes, FTND scores and other phenotypic data via dbGaP accession
number phs000404.v1.p1. After applying standard QC, there were 1,534 EAs and 247 AAs
included in our study with FTND phenotype and covariate (age, sex, and PC eigenvectors).
Yale-Penn. The Yale-Penn study included unrelated individuals (mostly) and small
nuclear families who were recruited from the eastern United States to carry out genetic studies
for alcohol, cocaine or opioid dependence.28-30 Nicotine dependence was not used as a basis for
subject selection, but FTND data were collected among smokers. Genotyping was conducted on
the Illumina HumanOmni1-Quad array. Following QC as previously described,31 there were
2,116 EAs and 2,115 AAs for analysis with the FTND phenotype and covariates (age, sex, DSM-
IV-defined cocaine dependence, and DSM-IV-defined alcohol dependence, and PC
eigenvectors).
QC. Unless otherwise stated, we applied our own standard set of QC procedures to
remove participants with a missing rate >3%, sample duplication (identity-by-state >90%), first-
degree relatedness (identity-by-descent >40%), gender discordance (FST <0.2 for chromosome
X SNPs to confirm females and FST >0.8 to confirm males), excessive homozygosity (FST >0.5
or FST <-0.2), or chromosomal anomalies and to remove SNPs with a missing rate >3% or Hardy-
Weinberg equilibrium (HWE) P<1×10⁻⁴. Across all studies, participants with missing covariate
or phenotype data were excluded prior to genome-wide association study (GWAS) analysis.
Supplementary Table 1 provides additional details on the numbers of genotyped SNPs and
participants passing QC and included for imputation and GWAS analysis.
8

1000G imputation. Autosomal SNPs passing QC were used as input to pre-phase study
genotypes using SHAPEIT2 and then to perform imputation, using IMPUTE232 (except where
indicated in Supplementary Table 1) with reference to the 1000G ALL phase I integrated variant
set, as previously described.1 NTR excluded imputed SNPs prior to meta-analysis with a
composite quality measure that included a check for Mendelian inconsistencies. For all other
studies, we used the software-generated quality metrics to evaluate the SNP/indel imputation
quality post hoc rather than imposing an a priori imputation quality filter.
FTND and the categorical nicotine dependence phenotype. As in our previous study,1
our analyses focused on nicotine dependence as defined by the FTND. The FTND is a six-item
questionnaire that queries (1) time to first cigarette in the morning, (2) refraining from smoking
in forbidden places, (3) cigarette most hated to give up, (4) CPD, (5) smoking during the first
hours after waking vs. the rest of the day, and (6) smoking while ill. FTND scores range from 0
(no dependence) to 10 (highest dependence level). We used lifetime FTND10, 11 collected among
current and former smokers (score based on the time period that the participants reported
smoking the most) in AAND, EAGLE, COGEND, COGEND2, deCODE, FTC, GAIN,
nonGAIN, NTR, SAGE*, and Yale-Penn and current FTND (score at the time of interview
among current smokers) in COHRA1, COPDGene, and UW-TTURC. For these studies, we
defined nicotine dependence categorically using the FTND: scores of 0 to 3 for mild, 4 to 6 for
moderate, and 7 to 10 for severe. Two of the 15 studies (JHS/ARIC and deCODE) included
participants who had FTND data available and supplemented with additional low-intensity
smoker participants who had only CPD data that we used as a proxy measure to define mild
dependence (CPD <10) as we did before.1 For JHS/ARIC, we included 352 JHS participants with
FTND score 0–3 and another 4,313 smokers from ARIC with no FTND data available but with
9

CPD <10 reported. For deCODE, we included 1,558 participants with FTND score 0–3 and
another 4,313 smokers with no FTND data available but with CPD <10 reported. Moderate and
severe dependence was defined solely by FTND scores, because of our examination of. the
concordance of our FTND and CPD categories among participants in two studies (4,947
deCODE, 5,803 COGEND EA, and 2,075 COGEND AA participants); all COGEND
participants were included in this phenotype analysis, compared to the subset included in our
GWAS analysis with genotypes available. Overall, we found high concordance between a report
of CPD <10 and FTND scores 0–3 (86.4%). We observed lower concordance between CPD=11–
20 and FTND scores 4–6 (52.7%) and between CPD >21 and FTND scores (50.4%), which
largely resulted from classifying participants at a higher level of dependence (e.g., classifying
participants as severe according to CPD, when many would be classified as moderate according
to FTND) (Supplementary Figure 8). These results suggest that CPD can be used as a proxy to
increase sample size with little misclassification under the mild dependence category. Any
observed phenotype misclassification would be expected to underestimate the SNP associations
with dependence (i.e., conservatively bias results), reducing statistical power and attenuating
effect size estimates.33, 34
Statistical analyses. In each ancestry group and study separately, we used linear
regression to test SNP/indel associations with categorical nicotine dependence (mild=0 /
moderate=1 / severe=2). Covariates included age, sex, principal components (the number needed
to account for >75% of the variability in nicotine dependence among the first 10 components),
and study-specific covariates, as needed, to account for the original study’s ascertainment
scheme (COPD disease severity in COPDGene, lung cancer case/control status in EAGLE, birth
10

cohort in FTC, and DSM-IV-defined alcohol and cocaine dependence in SAGE* and Yale-
Penn).
Three studies included relatives and thus required adjustment for family structure—FTC,
NTR, and Yale-Penn. For FTC and Yale-Penn, kinship matrices were computed and then used to
take into account relatedness when conducting GWAS analyses with the –mmscore option in
ProbAbel.35 We observed deflation of test statistics resulting from this conservative adjustment in
Yale-Penn, and we used genomic control to reverse this deflation as recommended by the
ProbAbel developers.36 The third family-based study, NTR, performed GWAS analyses in
PLINK37 using a sandwich correction to account for familial relatedness.
Fetal brain study used for SNP-methylation association analysis. This study included
166 fetal brain samples, encompassing both males and females and ranging from 56 to 169 days
post-conception, were obtained from the Human Developmental Biology Resource and UK
Medical Research Council Brain Banks network. We used their previously published results to
assess SNP associations with DNA methylation (DNAm). Genotyping was conducted using the
Illumina HumanOmniExpress BeadChip and was used as input for 1000G (phase 3) imputation.
DNAm was measured using the Illumina HumanMethylation450 BeadChip. As previously
described,38 methylation quantitative trait locus (meQTL) results were generated using linear
regression modeling with additive SNP genotype as the predictor, DNAm β value as the
outcome, and covariates for age, sex and the first two genotype-derived principal components.
SNP-methylation association results at P<1×10⁻⁸ were made available at
http://epigenetics.essex.ac.uk/mQTL/.
Postmortem brain studies used for SNP-expression association analyses. To assess
top nicotine dependence-associated variation for expression QTL (eQTL) effects,, we used the
11

Genotype-Tissue Expression (GTEx) project39, 40 (v6p release) that includes 1000G (phase I)-
imputed genotype data and RNA sequencing (RNAseq) measures across 13 postmortem human
brain tissues—amygdala (N=62 with genotype and RNAseq data), anterior cingulate cortex
(N=72), caudate (N=100), cerebellar hemisphere (N=89), cerebellum (N=103), cortex (N=96),
frontal cortex (N=92), hippocampus (N=81), hypothalamus (N=81), nucleus accumbens (N=93),
putamen (N=82), spinal cord (N=59), and substantia nigra (N=56). Gene RNA expression
(RNAexp) levels by tissue sample were measured as reads per kilobase transcript per million
reads (RPKM). Genotype data were derived from the Illumina Omni2.5 or Omni5 array and
obtained via dbGaP accession number phs000424.v6.p1. This GTEx release was comprised of
adults (20+ years old); 34.4% females; and 84.3% EAs, 13.7% AAs, 1.0% Asian, and 1.0%
unreported ancestry. The most common cause of death was traumatic injury among the youngest
subjects (54.3%, 20–39 years old) and heart disease among the oldest subjects (37.6%, 60–71
years old). Other causes of death included cerebrovascular, liver, renal, respiratory, and
neurological diseases. Smoking data were not available. Their QC, RNAseq pre-processing and
quantification, and analyses were previously described elsewhere.40, 41 Briefly, linear regression
models were used to test associations of SNP genotypes with reads per kilobase transcript per
million reads (RPKM)-based and normalized RNAexp levels of nearby genes (+/- 1Mb around
the transcription start sites), adjusting for 3 genotyping principal components, genotyping array,
gender, and probabilistic estimation of expression residuals (PEER) factors to account for
technical artifacts in the RNAseq data. Tissues with a sample size <70 were not included in the
eQTL analysis for this release, resulting in 10 of the 13 brain tissues being used for analysis.
We followed up SNPs significantly associated with RNAexp from GTEx for independent
replication in the Brain eQTL Almanac (http://www.braineac.org/) data set to evaluate their
12

associations with RNAexp probes that were measured across 10 postmortem human brain
tissues, many of which overlap with the tissues represented in GTEx—cerebellar cortex (outer
layer of the cerebellum), frontal cortex, hippocampus, inferior olivary nucleus, intralobular white
matter, occipital cortex, putamen, substantia nigra, temporal cortex, and thalamus.42 The
postmortem measurements were made in the UK Brain Expression Consortium, comprised of
134 EUR decedents who were mostly adults free of neurodegenerative disorders. No data were
available on their smoking or any other substance use histories. Illumina Omni1-Quad and
Immunochip array were used for SNP genotyping, which was followed by 1000G (phase I)
imputation. RNAexp levels were measured using Affymetrix Human Exon 1.0 ST arrays. As
previously described,42 for SNPs within +/- 1Mb of each gene’s transcription start site, genotypes
were tested for association with RNAexp levels that had been normalized and adjusted for brain
bank, gender and batch effects.
Acknowledgements
AAND was supported by R01 DA025888 (Co-PIs Eric Johnson and Laura Bierut).
COGEND and COGEND2 were supported by grants from the National Cancer Institute
(NCI; grant number P01 CA089392, PI: Laura Bierut) and NIDA (R01 DA036583 and R01
DA025888, PI: Laura Bierut), both of NIH. Genotype data are available via dbGaP as part of the
“Genetic Architecture of Smoking and Smoking Cessation” (accession number
phs000404.v1.p1) and “Study of Addiction: Genetics and Environment (SAGE)” (accession
number phs000092.v1.p1). Funding support for genotyping, which was performed at CIDR, was
provided by 1 X01 HG005274-01 and by the NIH Genes, Environment and Health Initiative
[GEI] (U01 HG004422). CIDR is fully funded through a federal contract from the NIH to The
13

Johns Hopkins University, contract number HHSN268200782096C. Assistance with genotype
cleaning, as well as with general study coordination, was provided by the GENEVA
Coordinating Center (U01 HG004446).
Funding support for the Center for Oral Health Research in Appalachia (COHRA) Dental
Caries GWAS study (cohort designation COHRA1) was provided by the NIH, National Institute
of Dental and Craniofacial Research (NIDCR) grant number U01 DE018903 (PI: MLM). Data
and samples were provided by COHRA, a collaboration of the University of Pittsburgh and West
Virginia University funded by NIDCR R01 DE014899 (PIs: MLM and DWM). Genotype and
phenotype data are available through dbGaP (accession number phs000095.v2.p1).
The COPDGene® project was supported by award numbers R01 HL089897 and R01
HL089856 from the NHLBI. Research reported in this publication was also supported by the
NHLBI award number K01 HL125858. The content is solely the responsibility of the authors
and does not necessarily represent the official views of the National Institutes of Health. The
content is solely the responsibility of the authors and does not necessarily represent the official
views of NHLBI or NIH. The COPDGene® project is also supported by the COPD Foundation
through contributions made to an Industry Advisory Board comprised of AstraZeneca,
Boehringer Ingelheim, Novartis, Pfizer, Siemens, Sunovion, and GlaxoSmithKline. The authors
acknowledge investigators of the COPDGene® project core units: Administrative (James Crapo
[Principal Investigator] and Edwin Silverman [Principal Investigator]), Barry Make, and
Elizabeth Regan); Genetic Analysis (Terri Beaty, Nan Laird, Christoph Lange, Michael Cho,
Stephanie Santorico, Dawn DeMeo, Nadia Hansel, Craig Hersh, Peter Castaldi, Merry-Lynn
McDonald, Emily Wan, Megan Hardin, Jacqueline Hetmanski, Margaret Parker, Marilyn
Foreman, Brian Hobbs, Robert Busch, Adel El-Bouiez, Megan Hardin, Dandi Qiao, Elizabeth
14

Regan, Eitan Halper-Stromberg, Ferdouse Begum, Sungho Won); Imaging (David Lynch,
Harvey Coxson, MeiLan Han, Eric Hoffman, Stephen Humphries Francine Jacobson, Philip
Judy, Ella Kazerooni, John Newell, Jr., Elizabeth Regan, James Ross, Raul San Jose Estepar,
Berend Stoel, Juerg Tschirren, Eva van Rikxoort, Bram van Ginneken, George Washko, Carla
Wilson, Mustafa Al Qaisi, Teresa Gray, Alex Kluiber, Tanya Mann, Jered Sieren, Douglas
Stinson, Joyce Schroeder, Edwin Van Beek); Pulmonary Function Testing Quality Assurance
(Robert Jensen); Data Coordinating Center and Biostatistics (Douglas Everett, Anna Faino, Matt
Strand, Carla Wilson); and Epidemiology (Jennifer Black-Shinn, Gregory Kinney, Katherine
Pratte). The authors also acknowledge the clinical center investigators: Jeffrey Curtis, Carlos
Martinez, Perry G. Pernicano, Nicola Hanania, Philip Alapat, Venkata Bandi, Mustafa Atik,
Aladin Boriek, Kalpatha Guntupalli, Elizabeth Guy, Amit Parulekar, Arun Nachiappan, Dawn
DeMeo, Craig Hersh, George Washko, Francine Jacobson, R. Graham Barr, Byron Thomashow,
John Austin, Belinda D’Souza, Gregory D.N. Pearson, Anna Rozenshtein, Neil MacIntyre, Jr.,
Lacey Washington, H. Page McAdams, Charlene McEvoy, Joseph Tashjian, Robert Wise, Nadia
Hansel, Robert Brown, Karen Horton, Nirupama Putcha, Richard Casaburi, Alessandra Adami,
Janos Porszasz, Hans Fischer, Matthew Budoff, Dan Cannon, Harry Rossiter, Amir
Sharafkhaneh, Charlie Lan, Christine Wendt, Brian Bell, Marilyn Foreman, Gloria Westney,
Eugene Berkowitz, Russell Bowler, David Lynch, Richard Rosiello, David Pace, Gerard Criner,
David Ciccolella, Francis Cordova, Chandra Dass, Robert D’Alonzo, Parag Desai, Michael
Jacobs, Steven Kelsen, Victor Kim, A. James Mamary, Nathaniel Marchetti, Aditti Satti, Kartik
Shenoy, Robert M. Steiner, Alex Swift, Irene Swift, Gloria Vega-Sanchez, Mark Dransfield,
William Bailey, J. Michael Wells, Surya Bhatt, Hrudaya Nath, Joe Ramsdell, Paul Friedman,
Xavier Soler, Andrew Yen, Alejandro Cornellas, John Newell, Jr., Brad Thompson, MeiLan
15

Han, Ella Kazerooni, Fernando Martinez, Joanne Billings, Tadashi Allen, Frank Sciurba, Divay
Chandra, Joel Weissfeld, Carl Fuhrman, Jessica Bon, Antonio Anzueto, Sandra Adams, Diego
Maselli-Caceres, and Mario Ruiz.
The deCODE work was supported in part by NIDA by grants R01 DA035825 (Principal
Investigator [PI]: Dana Hancock) and R01 DA017932 (PI: Kari Stefansson). deCODE thanks the
participants in the genetic studies whose contributions made this work possible.
Funding support for the Environment and Genetics in Lung Cancer Etiology (EAGLE)
study was provided through the NIH GEI (Z01 CP 010200). The human participants
participating in this study and its companion “Prostate, Lung Colon and Ovary Screening Trial”
are supported by intramural resources of the NCI. Assistance with phenotype harmonization and
genotype cleaning, as well as with general study coordination, was provided by the GENEVA
Coordinating Center (U01 HG004446). Assistance with data cleaning was provided by the
National Center for Biotechnology Information. Funding support for genotyping, which was
performed at The Johns Hopkins University’s Center for Inherited Disease Research (CIDR),
was provided by the NIH GEI (U01 HG004438). The datasets used for the analyses described in
this manuscript were obtained from the database of Genotypes and Phenotypes (dbGaP,
http://www.ncbi.nlm.nih.gov/gap) through accession number phs000093.v2.p2.
The FTC authors warmly thank the participating twin pairs and their family members of
the Finnish Twin Cohort Study for their contribution. We would like to express our appreciation
to the skilled study interviewers A-M Iivonen, K Karhu, H-M Kuha, U Kulmala-Gråhn, M
Mantere, K Saanakorpi, M Saarinen, R Sipilä, L Viljanen, and E Voipio. Anja Häppölä and
Kauko Heikkilä are acknowledged for their valuable contribution in recruitment, data collection,
and data management. Phenotyping and genotyping of the Finnish twin cohorts was supported by
16

the Academy of Finland Center of Excellence in Complex Disease Genetics (grants 213506,
129680), the Academy of Finland (grants 100499, 205585, 118555, 141054, 265240, 263278 and
264146 to Jaakko Kaprio), NIH/NIAAA (grant numbers R37 AA012502, K05 AA000145, and
R01 AA009203 to R. J. Rose and R01 AA015416 and K02 AA018755 to D. M. Dick),
NIH/NIDA (grant number R01 DA012854, PI: Pamela A. F. Madden), Sigrid Juselius
Foundation (to Jaakko Kaprio), Global Research Award for Nicotine Dependence, Pfizer Inc. (to
Jaakko Kaprio), and the Welcome Trust Sanger Institute, UK. Antti-Pekka Sarin and Samuli
Ripatti are acknowledged for genotype data quality controls and imputation. Association
analyses were run at the ELIXIR Finland node hosted at CSC – IT Center for Science for ICT
resources.
Funding support for the Genetic Association Information Network (GAIN) Genome-
Wide Association of Schizophrenia Study was provided by the National Institute of Mental
Health (NIMH) (R01 MH67257, R01 MH59588, R01 MH59571, R01 MH59565, R01
MH59587, R01 MH60870, R01 MH59566, R01 MH59586, R01 MH61675, R01 MH60879, R01
MH81800, U01 MH46276, U01 MH46289 U01 MH46318, U01 MH79469, and U01 MH79470)
and the genotyping of samples was provided through GAIN. The datasets used for the analyses
described in this manuscript were obtained from dbGaP through accession number
phs000021.v3.p2. Samples and associated phenotype data for the Genome-Wide Association of
Schizophrenia Study were provided by the Molecular Genetics of Schizophrenia Collaboration
(PI: Pablo V. Gejman, Evanston Northwestern Healthcare (ENH) and Northwestern University,
Evanston, IL, USA).
JHS (dbGaP accession no. phs000286.v3.p1) is supported and conducted in collaboration
with Jackson State University (HHSN268201300049C and HHSN268201300050C), Tougaloo
17

College (HHSN268201300048C), and the University of Mississippi Medical Center
(HHSN268201300046C and HHSN268201300047C) contracts from the NHLBI and the
National Institute for Minority Health and Health Disparities (NIMHD). Funding for genotyping
was provided by NHLBI contract N01-HC-65226. ARIC (dbGaP accession number
phs000090.v1.p1) is carried out as a collaborative study supported by National Heart, Lung, and
Blood Institute (NHLBI) contracts N01-HC-55015, N01-HC-55016, N01-HC-55018, N01-HC-
55019, N01-HC-55020, N01-HC-55021, N01-HC-55022, R01 HL087641, R01 HL59367 and
R01 HL086694; National Human Genome Research Institute (NHGRI) contract U01 HG004402;
and National Institutes of Health (NIH) contract HHSN268200625226C. The authors thank the
staff and participants of the ARIC study for their important contributions. Infrastructure was
partly supported by grant UL1RR025005, a component of the NIH and NIH Roadmap for
Medical Research. Genotyping was conducted by GENEVA. Funding for GENEVA was
provided by NHGRI grant U01 HG004402 (E. Boerwinkle).
Funding support for the Molecular Genetics of Schizophrenia - nonGAIN study, was
provided by Genomics Research Branch at NIMH, and the genotyping and analysis of samples
was also provided through GAIN and under the MGS U01s: MH79469 and MH79470.
Assistance with data cleaning was provided by NCBI. The dataset used for the analyses
described in this manuscript were obtained via dbGaP accession number phs000167.v1.p1.
Samples and associated phenotype data for the nonGAIN study were collected under the
following grants: NIMH Schizophrenia Genetics Initiative U01s: MH46276 (CR Cloninger),
MH46289 (C Kaufmann), and MH46318 (MT Tsuang); and MGS Part 1 (MGS1) and Part 2
(MGS2) R01s: MH67257 (NG Buccola), MH59588 (BJ Mowry), MH59571 (PV Gejman),
MH59565 (Robert Freedman), MH59587 (F Amin), MH60870 (WF Byerley), MH59566 (DW
18

Black), MH59586 (JM Silverman), MH61675 (DF Levinson), and MH60879 (CR Cloninger).
Further details of collection sites, individuals, and institutions may be found in data supplement
Table 1 of Sanders et al. (2008; PMID: 18198266) and at the study dbGaP pages.
We thank all NTR participants whose data we analyzed in this study. Camelia C. Minica
and Michael M. Neale are supported by the NIDA grant R01 DA018673. We acknowledge the
Netherlands Organisation for Scientific Research (NWO) and the Netherlands Organisation for
Health Research and Development (ZonMW Addiction 31160008; ZonMW 940-37-024;
NWO/SPI 56-464-14192; NWO-400-5-717; NWO-MW 904-61-19; NWO-MagW 480-4-004;
NWO-Veni 016-115-035), the EMGO + Institute for Health and Care Research, the
Neuroscience Campus Amsterdam, BBMRI–NL (184.021.007: Biobanking and Biomolecular
Resources Research Infrastructure), the Avera Institute, Sioux Falls, South Dakota (USA) and
the European Research Council (230374, 284167) for support. Genotyping was funded in part by
grants from the National Institutes of Health (4R37DA018673-6, RC2 MH089951). The
statistical analyses were carried out on the Genetic Cluster Computer
(http://www.geneticcluster.org) which is supported by the Netherlands Scientific Organization
(NWO 480-5-003), the Dutch Brain Foundation and the Department of Psychology and
Education of the VU University Amsterdam.
Funding support for SAGE was further provided through the NIH GEI (U01 HG004422).
Assistance with phenotype harmonization and genotype cleaning, as well as with general study
coordination, was provided by the GENEVA Coordinating Center (U01 HG004446). Assistance
with data cleaning was provided by the National Center for Biotechnology Information. Support
for collection of datasets and samples was provided by the Collaborative Study on the Genetics
of Alcoholism (COGA; U10 AA008401) and the Family Study of Cocaine Dependence (FSCD;
19

R01 DA013423, PI: Laura Bierut). Funding support for genotyping, which was performed at
CIDR, was provided by the NIH GEI (U01HG004438), the National Institute on Alcohol Abuse
and Alcoholism (NIAAA), NIDA, and the NIH contract "High throughput genotyping for
studying the genetic contributions to human disease" (HHSN268200782096C). The datasets used
for the analyses described in this manuscript were obtained via dbGaP accession number
phs000092.v1.p1.
The University of Wisconsin-Transdisciplinary Tobacco Use Research Center (UW-
TTURC) study was accessed via dbGaP as part of “Genetic Architecture of Smoking and
Smoking Cession” (accession number phs000404.v1.p1). Funding support for collection of the
UW-TTURC dataset and samples was provided by P50 DA019706 and P50 CA084724. Funding
support for genotyping, which was performed at CIDR, was provided by 1 X01 HG005274-01.
CIDR is fully funded through a federal contract from NIH to The Johns Hopkins University,
contract number HHSN268200782096C. Assistance with genotype cleaning, as well as with
general study coordination, was provided by the GENEVA Coordinating Center (U01
HG004446).
The Yale-Penn study was supported by NIH grants RC2 DA028909 (PI: Joel Gelernter),
R01 DA012690 (PI: Joel Gelernter), R01 DA012849 (PI: Joel Gelernter), R01 DA018432 (PI:
Henry Kranzler), R01 AA011330 (PI: Joel Gelernter), R01 AA017535 (PI: Joel Gelernter), and
the VA Connecticut and Philadelphia VA MIRECCs. Genotyping services for a part of the Yale-
Penn GWAS were provided by CIDR and Yale University (Center for Genome Analysis). CIDR
is fully funded through a federal contract from NIH to The Johns Hopkins University (contract
number N01-HG-65403). We are grateful to Ann Marie Lacobelle, Catherine Aldi, and Christa
Robinson for their excellent technical assistance, to the SSADDA interviewers, led by Yari
20

Nuñez and Michelle Slivinsky, who devoted substantial time and effort to phenotype the study,
and to John Farrell and Alexan Mardigan for database management assistance.
21

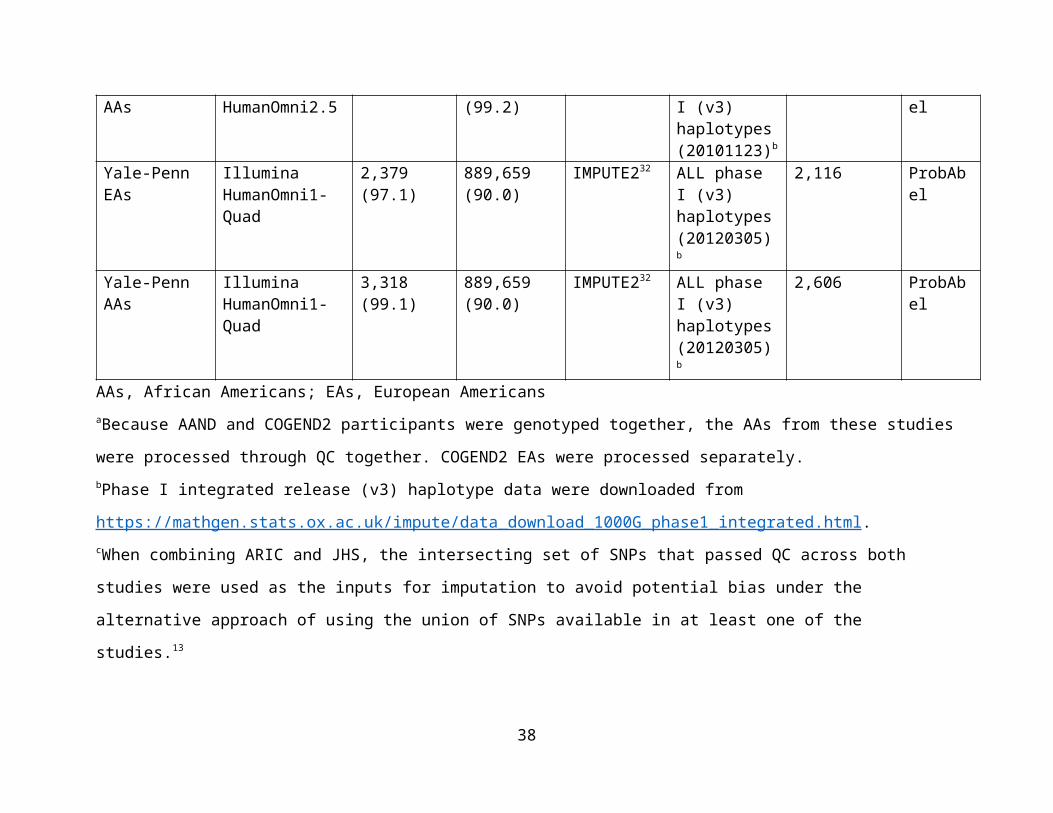
Supplementary Table 1. Details of single nucleotide polymorphism (SNP) genotyping, quality control (QC), imputation, and
statistical analysis across the 15 independent studies.
Study and ancestry group
Genotyping platform
N (%) genotyped participants passing QC and used for imputation
N (%) autosomal genotyped SNPs passing QC and used for imputation
Imputation software
1000 Genomes reference panel for imputation
N imputed participants with complete phenotype and covariate data
GWAS statistical analysis software
AAND and COGEND2 AAsa
Illumina Omni Express
2,047 (99.4) 921,133 (99.5) IMPUTE232 ALL phase I (v3) haplotypes (20101123)b
AAND: 1,687 COGEND2: 313
ProbAbel
COGEND EAs Illumina Human1M-Duo or HumanOmni2.5
1,952 (99.5) 587,486 (99.9) IMPUTE232 ALL phase I (v3) haplotypes (20101123)b
1,935 ProbAbel
COGEND AAs Illumina Human1M-Duo or HumanOmni2.5
709 (99.6) 587,483 (99.8) IMPUTE232 ALL phase I (v3) haplotypes (20101123)b
704 ProbAbel
COGEND2 EAs
Illumina Omni Express
411 (100) 921,123 (99.5) IMPUTE232 ALL phase I (v3) haplotypes (20101123)b
292 ProbAbel
COHRA1 EAs Illumina Human610
1,964 (59.3)d 558,483 (97.6) IMPUTE232 ALL phase I (v3) haplotypes (20101123)b
243c ProbAbel
COPDGene EAs
Illumina HumanOmni1-Quad
6,664 (99.9) 622,037 (99.0) IMPUTE232 ALL phase I (v3) haplotypes (20101123)b
2,211 ProbAbel
COPDGene AAs
Illumina HumanOmni1-Quad
3,298 (99.9) 674,808 (99.0) IMPUTE232 ALL phase I (v3) haplotypes (20101123)b
2,115 ProbAbel
deCODE Illumina SNP 9,090c 697,913e Long-range Variant set 9,090 ProbAbel
22

Icelanders arrays phasing using the same model as used by IMPUTE
from whole-genome sequencing of 2,636 Icelanders
EAGLE Italians Illumina HumanHap550v3
3,879 (99.5) 536,319 (98.0) IMPUTE232 ALL phase I (v3) haplotypes (20101123)b
3,006 ProbAbel
FTC Finns Illumina Human670-QuadCustom or HumanCoreExome array
670 subset I: 2,373 (99)670 subset II: 128 (99)CoreExome: 1,803 (95)
670 subset I: 521,493 (89)670 subset II: 467,103 (88)CoreExome: 342,370 (68)
IMPUTE232 ALL phase I (v3) haplotypes (20130917)
2,374 ProbAbel
GAIN EAs Affymetrix 6.0 2,560 (99.6) 775,889 (96.7) IMPUTE232 ALL phase I (v3) haplotypes (20101123)b
774f ProbAbel
GAIN AAs Affymetrix 6.0 1,890 (99.3) 799,209 (96.7) IMPUTE232 ALL phase I (v3) haplotypes (20101123)b
477f ProbAbel
JHS/ARIC AAs Affymetrix 6.0 JHS: 1,967 (89.9)ARIC: 2,412 (99.5)
JHS: 835,368 (95.8)c
ARIC: 746,334 (99.9)c
IMPUTE232 ALL phase I (v3) haplotypes (20101123)b
JHS: 628ARIC: 515
ProbAbel
nonGAIN EAs Affymetrix 6.0 2,482 (98.7) 706,194 (94.0) IMPUTE232 ALL phase I (v3) haplotypes (20101123)b
471e ProbAbel
NTR Dutch Illumina and Affymetrix SNP arrays
12,240 (99.8) 1,422,177 (99.9)
MACH12 ALL phase1 release v3 20101123 as the first
3,599 PLINK
23

reference set and Genome of the Netherlands (GoNL) version 4 as the second reference set
SAGE* EAs Illumina Human1M-Duo
1,471 (98.3) 935,356 (99.6) IMPUTE232 ALL phase I (v3) haplotypes (20101123)b
832 ProbAbel
SAGE* AAs Illumina Human1M-Duo
981 (96.7) 935,355 (99.6) IMPUTE232 ALL phase I (v3) haplotypes (20101123)b
633 ProbAbel
UW-TTURC EAs
Illumina HumanOmni2.5
1,566 (99.6) 2,182,770 (99.2)
IMPUTE232 ALL phase I (v3) haplotypes (20101123)b
1,534 ProbAbel
UW-TTURC AAs
Illumina HumanOmni2.5
257 (100) 2,182,669 (99.2)
IMPUTE232 ALL phase I (v3) haplotypes (20101123)b
247 ProbAbel
Yale-Penn EAs Illumina HumanOmni1-Quad
2,379 (97.1) 889,659 (90.0) IMPUTE232 ALL phase I (v3) haplotypes (20120305) b
2,116 ProbAbel
Yale-Penn AAs Illumina HumanOmni1-Quad
3,318 (99.1) 889,659 (90.0) IMPUTE232 ALL phase I (v3) haplotypes (20120305) b
2,606 ProbAbel
AAs, African Americans; EAs, European AmericansaBecause AAND and COGEND2 participants were genotyped together, the AAs from these studies were processed through QC
together. COGEND2 EAs were processed separately. bPhase I integrated release (v3) haplotype data were downloaded from
https://mathgen.stats.ox.ac.uk/impute/data_download_1000G_phase1_integrated.html.
24

cWhen combining ARIC and JHS, the intersecting set of SNPs that passed QC across both studies were used as the inputs for
imputation to avoid potential bias under the alternative approach of using the union of SNPs available in at least one of the studies.13
dCOHRA1 is comprised of families, and most of the removed participants were due to selecting only one participant with FTND data
available from each relative pair/cluster. eDue to multiple chips being used at deCODE, the participant and SNP numbers used for genotyping varies. See Gudbjartsson et al.
for further details of the QC methods.43
fOur final analysis data sets were restricted to only the schizophrenia controls from the GAIN and nonGAIN studies.
25

Supplementary Table 2. Characteristics of European/European American and African American participants across 15
studies used for genome-wide association study (GWAS) meta-analysis of nicotine dependence.
StudyTotal
NMale, N (%)
Mean age (SD)
N (%) of Europeans/European Americansa
N (%) of African Americansa
Mild dependence
Moderate dependence
Severe dependence
Mild dependence
Moderate dependence
Severe dependence
AAND 1,687 718 (42.6)
35.4 (6.11)
0 0 0 526 (31.2) 830 (49.2) 331 (19.6)
COGEND 2,639 1,011 (38.3)
36.6 (5.57)
941 (48.6) 521 (26.9) 473 (24.4) 248 (35.2) 283 (40.2) 173 (24.6)
COGEND2 605 281 (46.4)
34.4 (5.87)
60 (20.5) 91 (31.2) 141 (48.3) 13 (4.1) 137 (43.8) 163 (52.1)
COHRA1 243 114 (46.9)
32.1 (9.1) 79 (32.5) 127 (52.3) 37 (15.2) 0 0 0
COPDGene 4,326 2,463 (56.9)
55.6 (7.41)
666 (30.1) 964 (43.6) 581 (26.3) 603 (28.5) 960 (45.4) 552 (26.1)
deCODE 9,090 4,253 (46.8)
54.2 (16.7)
5,871 (64.6) 2,074 (22.8) 1,145 (12.6) 0 0 0
EAGLE 3,006 2,528 (84.1)
Not availableb
1,416 (47.1) 1,027 (34.2) 563 (18.7) 0 0 0
FTC 2,374 1,314 (55.3)
45.9 (15.6)
1,345 (56.7) 793 (33.4) 236 (9.9) 0 0 0
GAIN 1,251 596 (47.6)
52 (15.2) 327 (42.3) 280 (36.2) 167 (21.6) 221 (46.3) 176 (36.9) 80 (16.8)
JHS/ARIC 1,143 502 (43.9)
52.9 (9.2) 0 0 0 867 (75.9) 218 (19.0) 58 (5.1)
nonGAIN 671 349 (52.0)
52.9 (15.5)
298 (44.4) 234 (34.9) 139 (20.7) 0 0 0
NTR 3,599 2,197 (61.0)
46.3 (14.9)
2,246 (62.4) 1,063 (29.5) 290 (8.1) 0 0 0
SAGE* 1,465 816 40 (9.88) 243 (29.2) 295 (35.5) 294 (35.3) 211 (33.3) 272 (43.0) 150 (23.7)
26

(55.7)UW-TTURC 1,781 741
(41.6)43.4 (11.2)
311 (20.2) 723 (47.1) 500 (32.6) 40 (16.2) 119 (48.2) 88 (35.6)
Yale-Penn 4,722 2,672 (56.6)
39.9 (9.9) 381 (18.0) 1,014 (47.9) 721 (34.1) 883 (33.9) 1,326 (50.9) 397 (15.2)
AAND, African American Nicotine Dependence; ARIC, Atherosclerosis Risk in Communities; COGEND, Collaborative Genetic
Study of Nicotine Dependence; COHRA1, Center for Oral Health Research in Appalachia 1; COPDGene, Chronic Obstructive
Pulmonary Disease Gene Study; EAGLE, Environment and Genetics in Lung Cancer Etiology Study; FTC, Finnish Twin Cohort;
GAIN, Genetic Association Information Network GWAS of schizophrenia; JHS, Jackson Heart Study; nonGAIN, Molecular Genetics
of Schizophrenia—nonGAIN; NTR, Netherlands Twin Registry; SAGE*, Study of Addiction: Genetics and Environment (* indicates
that overlapping COGEND participants were excluded); SD, standard deviation; UW-TTURC, University of Wisconsin-
Transdisciplinary Tobacco Use Research Center.
aFagerström Test for Nicotine Dependence (FTND) scores were used to categorize nicotine dependence as mild (FTND score 0–3),
moderate (FTND score 4–6) or severe (FTND score 7–10). For deCODE only, the mild category included 1,558 participants with
FTND score 0–3 and an additional set of 4,313 low-intensity smokers with no FTND data available but with <10 cigarettes per day
(CPD) reported. For ARIC only, FTND data were not available, and CPD was used as a proxy measure to define mild (CPD <10),
moderate (CPD=11–20), and severe (CPD>21) ND. bAverage age could not be calculated in EAGLE, because age was only available
as a categorical variable: 23.2% aged 59 or less, 18.2% aged 60–64, 22.4% aged 65–69, 21.4% aged 70–74 and 14.8% aged 75–79.
27

Supplementary Table 3. Study-specific associations of the rs910083-C allele in DNMT3B with each of the six specific
Fagerström Test for Nicotine Dependence (FTND) items. The items were tested separately in regression models (logistic regression
models for items 1, 3, and 4, or linear regression models for items 2, 5, and 6) with rs910083 genotype dosage as the predictor and
age, sex, principal component eigenvectors (if applicable), and other study-specific variables (if applicable) as covariates.
Study (and
ancestry if more
than one)
Item 1:
How soon after
you wake up
do/did you smoke
your first
cigarette?
Item 2:
Do/Did you find
it difficult to
refrain from
smoking in
places where it
is forbidden?
Item 3:
Which
cigarette
would you
hate most to
give up?
Item 4:
How many
cigarettes per
day do/did you
smoke?
Item 5:
Do/did you smoke
more frequently
during the first
hours after waking
than during the
rest of the day?
Item 6:
Do/did you
smoke if you
are so ill that
you are in bed
most of the
day?
β P β P β P β P β P β P
AAND 0.053 0.22 0.10 0.30 0.056 0.56 0.029 0.27 0.022 0.81 0.22 0.024
COGEND AA -0.051 0.54 -0.070 0.61 -0.047 0.72 -0.046 0.44 0.11 0.42 -0.074 0.57
COGEND EA 0.041 0.32 0.038 0.61 0.070 0.32 0.026 0.47 0.11 0.16 0.063 0.38
COGEND2 AA -0.071 0.32 -0.19 0.38 0.19 0.44 0.012 0.89 0.40 0.056 0.074 0.74
COGEND2 EA 0.11 0.22 0.077 0.65 0.0072 0.97 0.057 0.51 0.14 0.43 0.32 0.088
COPDGene AA 0.081 0.039 0.13 0.12 0.15 0.074 0.0032 0.92 0.17 0.042 0.13 0.13
COPDGene EA 0.086 0.0092 -0.058 0.42 -0.053 0.44 0.016 0.51 -0.0016 0.98 -0.055 0.44
deCODE 0.013 0.52 -0.0048 0.92 0.012 0.80 0.028 0.11 0.014 0.77 0.028 0.52
COHRA1 -0.016 0.86 1.2×10⁻⁵ 1.00 b b 0.037 0.60 0.31 0.11 0.052 0.80
EAGLE 0.0085 0.77 0.027 0.64 0.13 0.80 0.031 0.23 0.13 0.065 0.033 0.58
28

FTC -0.0012 0.97 0.040 0.64 -0.041 0.53 -0.0088 0.69 -0.081 0.26 -0.0082 0.90
GAIN AA 0.10 0.22 -0.16 0.38 0.10 0.50 0.094 0.14 0.23 0.18 -0.22 0.16
GAIN EA 0.11 0.067 0.15 0.27 0.068 0.53 0.055 0.31 0.0044 0.98 0.085 0.47
JHS 0.15 0.070 0.27 0.27 -0.019 0.89 0.12 0.056 0.16 0.29 0.33 0.10
nonGAIN -0.047 0.45 -0.32 0.020 0.11 0.51 -0.011 0.86 b b 0.029 0.82
SAGE* AA 0.11 0.14 0.17 0.27 0.040 0.79 -0.016 0.81 -0.11 0.49 0.19 0.20
SAGE* EA 0.10 0.051 0.16 0.13 0.032 0.77 0.075 0.13 0.16 0.14 0.036 0.74
UW-TTURC AA 0.11 0.18 0.46 0.064 0.19 0.43 0.037 0.62 0.043 0.84 -0.14 0.50
UW-TTURC EA 0.066 0.036 0.14 0.11 0.027 0.72 0.050 0.070 0.20 0.0070 0.11 0.12
Yale-Penn AA 0.00065 0.99 -0.012 0.85 -0.16 0.024 0.025 0.25 0.12 0.12 0.069 0.31
Yale-Penn AA 0.012 0.70 0.045 0.54 -0.024 0.70 0.0082 0.69 0.0028 0.96 -0.045 0.50
Meta-analysis 0.035 1.2×10⁻⁴ 0.031 0.13 0.021 0.27 0.023 0.0011 0.060 0.0029 0.041 0.030aAll European and African ancestry participants with FTND data in each study were included, except for NTR. bThe regression model
did not converge due to a high number of missing responses. The meta-analysis results for this FTND item reflect the cohorts with
available results.
29

Supplementary Table 4. Nicotine dependence associations of 140 meQTL SNPs, located in
DNMT3B and across its 100kb flanking region. All 140 SNPs were associated with probe
cg13636640 methylation levels at P<3.69×10⁻¹³, based on Bonferroni correction for genome-
wide testing of all SNP-probe pairs in Hannon et al.38 (N=166 fetal brain samples). meQTL
results were obtained at http://epigenetics.essex.ac.uk/mQTL/. Results are sorted by nicotine
dependence GWAS meta-analysis p-values across EUR and AA studies (total N=38,602), with β
estimates corresponding to the coded allele. NCBI build 37 positions are indicated.
Chr. 20
position meQTL P SNP
Nicotine dependence meta-analysis
Coded allele β Standard error P
31378690 2.3×10⁻²⁶ rs910083 C 0.032 0.0057 3.7×10⁻⁸
31378343 5.9×10⁻²⁶ rs73621668 CT 0.033 0.0062 1.0×10⁻⁷
31385814 5.8×10⁻²² rs2424921 T 0.031 0.0059 1.3×10⁻⁷
31389518 4.5×10⁻²⁴ rs2424929 G 0.030 0.0058 2.1×10⁻⁷
31389009 4.5×10⁻²⁴ rs2065576 T 0.030 0.0058 2.2×10⁻⁷
31363774 3.4×10⁻³⁴ rs6087999 G 0.030 0.0057 2.2×10⁻⁷
31388461 7.3×10⁻²¹ rs6058892 T 0.029 0.0056 2.5×10⁻⁷
31381690 5.8×10⁻²² rs6057647 T 0.031 0.0059 2.5×10⁻⁷
31388636 4.5×10⁻²⁴ rs2424928 C 0.030 0.0058 2.7×10⁻⁷
31383530 7.7×10⁻²⁸ rs875041 T 0.029 0.0057 2.8×10⁻⁷
31386347 5.8×10⁻²² rs6058891 C 0.030 0.0059 3.0×10⁻⁷
31385452 5.2×10⁻²¹ rs2424920 C 0.030 0.0059 3.0×10⁻⁷
31387954 3.0×10⁻¹⁹ rs1997797 G 0.029 0.0056 3.0×10⁻⁷
31385269 4.7×10⁻²⁷ rs992472 T 0.029 0.0056 3.3×10⁻⁷
31386449 5.8×10⁻²² rs2424922 C 0.030 0.0059 3.3×10⁻⁷
31392777 2.1×10⁻²⁴ rs6058893 T 0.029 0.0056 3.9×10⁻⁷
31378448 9.0×10⁻²³ rs2424915 T 0.028 0.0055 3.9×10⁻⁷
31380072 5.7×10⁻²³ rs1040553 T 0.028 0.0055 4.6×10⁻⁷
31337487 3.3×10-43 rs1883730 A 0.029 0.0058 5.2×10⁻⁷
31380201 5.7×10⁻²³ rs1040555 T 0.028 0.0055 5.4×10⁻⁷
31376490 5.0×10⁻²³ rs4911260 C 0.030 0.0059 5.5×10⁻⁷
31380931 9.8×10⁻²² rs11480729 AT 0.028 0.0055 5.6×10⁻⁷
30

31381229 9.8×10⁻²² rs993419 A 0.027 0.0055 6.7×10⁻⁷
31343543 3.3×10-43 rs2424899 C 0.029 0.0058 7.5×10⁻⁷
31345752 1.5×10-41 rs1007124 C 0.029 0.0058 7.7×10⁻⁷
31348750 1.5×10-41 rs6058869 T 0.029 0.0058 8.0×10⁻⁷
31365719 5.0×10⁻²³ rs6058883 C 0.029 0.0059 9.6×10⁻⁷
31374520 5.0×10⁻²³ rs2424914 G 0.030 0.006 9.8×10⁻⁷
31387525 5.8×10⁻²² rs1855350 T 0.029 0.006 1.1×10⁻⁶
31391360 5.8×10⁻²² rs4911261 G 0.029 0.006 1.1×10⁻⁶
31390533 5.8×10⁻²² rs2064350 C 0.029 0.006 1.2×10⁻⁶
31359819 5.0×10⁻²³ rs2424907 T 0.029 0.006 1.3×10⁻⁶
31330413 3.8×10-36 rs4911105 A 0.028 0.0058 1.5×10⁻⁶
31335978 1.3×10⁻²⁶ rs2424895 C 0.029 0.006 1.7×10⁻⁶
31367079 8.6×10⁻³⁰ rs1569686 T 0.028 0.006 1.9×10⁻⁶
31357844 1.0×10⁻²³ rs4911256 G 0.029 0.006 2.0×10⁻⁶
31361861 8.6×10⁻³⁰ rs2424909 C 0.028 0.006 2.0×10⁻⁶
31354935 2.7×10⁻²⁷ rs6087992 C 0.029 0.0061 2.1×10⁻⁶
31374991 1.7×10⁻²⁹ rs4911107 A 0.028 0.0059 2.1×10⁻⁶
31352585 1.3×10⁻²⁶ rs4911253 G 0.029 0.0061 2.2×10⁻⁶
31330612 3.8×10-36 rs6119279 G 0.027 0.0058 2.3×10⁻⁶
31366598 8.6×10⁻³⁰ rs1003521 C 0.028 0.0059 2.3×10⁻⁶
31382770 3.6×10⁻²⁷ rs2424918 T 0.026 0.0056 2.6×10⁻⁶
31368560 2.3×10⁻²³ rs1003522 C 0.028 0.0059 2.6×10⁻⁶
31363193 8.6×10⁻³⁰ rs1883729 A 0.028 0.0059 2.7×10⁻⁶
31346001 1.3×10⁻²⁶ rs1007122 T 0.028 0.006 2.7×10⁻⁶
31336676 2.8×10-37 rs12329424 T 0.028 0.006 2.7×10⁻⁶
31330115 3.8×10-36 rs4911252 T 0.027 0.0058 2.8×10⁻⁶
31393352 1.6×10⁻²⁷ rs4911262 A 0.028 0.006 2.9×10⁻⁶
31361249 8.6×10⁻³⁰ rs1333469 T 0.028 0.0059 3.0×10⁻⁶
31361709 8.6×10⁻³⁰ rs11367842 T 0.028 0.0059 3.1×10⁻⁶
31383353 1.6×10⁻²⁸ rs910085 G 0.028 0.0059 3.3×10⁻⁶
31376282 6.5×10⁻²⁶ rs4911259 G 0.026 0.0056 3.5×10⁻⁶
31

31331330 3.8×10-36 rs4911106 G 0.027 0.0058 3.6×10⁻⁶
31358253 1.3×10⁻²⁶ rs6087995 C 0.028 0.006 3.7×10⁻⁶
31370544 1.7×10⁻²⁹ rs11469084 C 0.025 0.0055 3.8×10⁻⁶
31359391 8.6×10⁻³⁰ rs6087420 A 0.026 0.0056 3.9×10⁻⁶
31398105 8.2×10⁻²⁰ rs6058897 C 0.026 0.0057 4.1×10⁻⁶
31369136 1.7×10⁻²⁹ rs3835238 A 0.025 0.0055 4.3×10⁻⁶
31380073 5.7×10⁻²³ rs1040554 T 0.025 0.0055 4.8×10⁻⁶
31392366 3.0×10⁻²⁵ rs4911110 G 0.027 0.0059 5.3×10⁻⁶
31346581 1.5×10-41 rs6119281 G 0.026 0.0058 5.8×10⁻⁶
31350664 2.9×10-37 rs742630 G 0.027 0.0059 5.9×10⁻⁶
31358356 2.5×10⁻³⁴ rs8115823 A 0.025 0.0056 6.9×10⁻⁶
31357097 1.8×10-45 rs1855349 T 0.026 0.0057 7.4×10⁻⁶
31344512 5.2×10-36 rs2424901 G 0.027 0.006 7.5×10⁻⁶
31344342 5.2×10-36 rs2424900 C 0.027 0.006 7.7×10⁻⁶
31336960 2.8×10-37 rs6058860 C 0.027 0.006 7.7×10⁻⁶
31348445 5.2×10-36 rs6058868 C 0.027 0.006 8.2×10⁻⁶
31346925 5.2×10-36 rs2377667 G 0.027 0.006 8.3×10⁻⁶
31345840 5.2×10-36 rs1007123 A 0.027 0.006 8.4×10⁻⁶
31335157 1.4×10⁻³¹ rs6058859 G 0.027 0.0059 8.7×10⁻⁶
31375572 5.6×10⁻²⁵ rs4911109 A 0.024 0.0054 9.5×10⁻⁶
31352316 2.9×10-37 rs2424904 C 0.027 0.006 9.6×10⁻⁶
31352927 1.8×10⁻³¹ rs2424905 C 0.026 0.0059 9.8×10⁻⁶
31349315 5.2×10-36 rs2424903 T 0.027 0.006 9.9×10⁻⁶
31384136 1.5×10⁻²⁵ rs998382 G 0.024 0.0055 1.0×10⁻⁵
31382860 6.7×10⁻²⁶ rs6088008 G 0.024 0.0054 1.2×10⁻⁵
31349908 1.8×10-45 rs6087990 C 0.025 0.0057 1.3×10⁻⁵
31353785 2.9×10-37 rs6058874 G 0.026 0.0059 1.3×10⁻⁵
31387737 3.4×10⁻²⁵ rs72269343 C 0.024 0.0056 1.5×10⁻⁵
31371677 1.3×10⁻²⁵ rs2889702 A 0.025 0.0058 1.7×10⁻⁵
31340997 1.4×10⁻³¹ rs6087989 G 0.026 0.0059 1.8×10⁻⁵
31336533 2.0×10-41 rs61542599 CAG 0.030 0.0071 1.8×10⁻⁵
32

31379184 3.9×10⁻¹⁸ rs2889703 A 0.023 0.0055 1.9×10⁻⁵
31373782 2.4×10⁻²⁶ rs2377668 G 0.024 0.0056 2.1×10⁻⁵
31374259 5.5×10⁻¹⁹ rs2424913 T 0.023 0.0055 2.3×10⁻⁵
31369479 1.7×10⁻²⁷ rs4911258 A 0.024 0.0056 2.7×10⁻⁵
31375311 2.4×10⁻²⁶ rs4911108 G 0.025 0.006 2.8×10⁻⁵
31368960 1.7×10⁻²⁷ rs6141814 A 0.023 0.0056 3.1×10⁻⁵
31359109 1.2×10⁻²⁵ rs2424906 C 0.024 0.0058 3.4×10⁻⁵
31390840 1.0×10⁻²⁶ rs17123658 A 0.024 0.0058 3.7×10⁻⁵
31380309 2.0×10⁻²⁶ rs1474738 A 0.023 0.0055 4.1×10⁻⁵
31353564 2.9×10-37 rs6058873 T 0.030 0.0072 4.4×10⁻⁵
31379665 7.2×10⁻²⁶ rs910084 T 0.022 0.0054 4.5×10⁻⁵
31353231 5.0×10⁻³⁵ rs14827544
2
T 0.028 0.0071 7.1×10⁻⁵
31351623 3.1×10-38 rs2018002 T 0.023 0.0058 8.2×10⁻⁵
31400673 8.6×10⁻²⁶ rs6058900 C 0.023 0.006 1.0×10⁻⁴
31329704 2.8×10⁻³⁰ rs6119946 A 0.023 0.006 1.3×10⁻⁴
31340800 3.8×10⁻¹⁶ rs6087988 T 0.023 0.006 1.5×10⁻⁴
31335246 1.8×10⁻¹³ rs6087984 A 0.025 0.0065 1.7×10⁻⁴
31359574 3.0×10⁻²² rs4911257 C 0.022 0.006 1.8×10⁻⁴
31353790 3.1×10-38 rs6058875 G 0.022 0.0058 2.1×10⁻⁴
31397258 8.0×10⁻²² rs3092509 GATTC 0.022 0.006 2.8×10⁻⁴
31357579 5.2×10-36 rs4911254 A 0.021 0.006 3.9×10⁻⁴
31357580 5.2×10-36 rs4911255 T 0.021 0.006 4.0×10⁻⁴
31356095 1.4×10⁻¹⁵ rs11907740 A 0.023 0.0065 5.0×10⁻⁴
31337822 1.8×10⁻¹³ rs6141802 A 0.021 0.0061 5.8×10⁻⁴
31360383 4.7×10⁻¹⁴ rs2424908 T 0.020 0.006 0.0011
31337755 3.8×10⁻¹⁴ rs2424896 T 0.020 0.0062 0.0011
31398876 6.3×10⁻¹⁴ rs8118663 G 0.021 0.0065 0.0015
31420757 3.5×10⁻¹⁴ rs853854 A 0.018 0.0058 0.0018
31346525 3.2×10⁻¹⁴ rs12481172 G 0.020 0.0064 0.0021
31465374 2.5×10⁻¹⁴ rs6058925 G 0.017 0.0059 0.0030
33

31334245 3.7×10⁻¹⁴ rs11484368 GA 0.019 0.0065 0.0031
31460076 2.5×10⁻¹⁴ rs11697394 G 0.017 0.0059 0.0032
31464467 2.5×10⁻¹⁴ rs6058924 G 0.017 0.0059 0.0033
31465450 2.5×10⁻¹⁴ rs6058926 T 0.017 0.0059 0.0033
31459562 2.5×10⁻¹⁴ rs13037833 C 0.017 0.0059 0.0036
31470484 3.2×10⁻¹³ rs13038717 G 0.018 0.006 0.0036
31460718 2.5×10⁻¹⁴ rs12625153 C 0.017 0.0059 0.0037
31458773 2.5×10⁻¹⁴ rs6058922 G 0.017 0.0059 0.0044
31333787 6.5×10⁻¹⁴ rs6087982 G 0.019 0.0067 0.0051
31355998 3.4×10-40 NA NA NA NA NA
31343904 1.7×10-38 NA NA NA NA NA
31338098 3.8×10-36 NA NA NA NA NA
31356108 5.2×10-36 NA NA NA NA NA
31347512 2.7×10⁻²⁹ NA NA NA NA NA
31353232 2.0×10⁻²⁸ NA NA NA NA NA
31361418 2.9×10⁻²⁸ NA NA NA NA NA
31397019 2.6×10⁻²⁷ NA NA NA NA NA
31358416 1.3×10⁻²⁶ NA NA NA NA NA
31394631 8.4×10⁻²⁶ NA NA NA NA NA
31372847 1.3×10⁻²⁰ NA NA NA NA NA
31360923 4.1×10⁻²⁰ NA NA NA NA NA
31373668 1.1×10⁻¹⁹ NA NA NA NA NA
31385471 1.9×10⁻¹⁷ NA NA NA NA NA
31342224 9.0×10⁻¹⁵ NA NA NA NA NA
31458665 2.5×10⁻¹⁴ NA NA NA NA NA
31460244 2.5×10⁻¹⁴ NA NA NA NA NA
NA, not available
34

Supplementary Table 5. Associations of the rs910083-C allele with DNMT3B gene
expression across the brain tissues in GTEx. Results are sorted by p-value.
Brain tissue N with RNA-sequencing and
SNP genotype data available
β (SE) P
Cerebellar hemisphere 89 0.44 (0.081) 7.0×10⁻⁷
Cerebellum 103 0.50 (0.099) 3.0×10⁻⁶
Anterior cingulate cortex 72 0.38 (0.095) 2.0×10⁻⁴
Hypothalamus 81 0.39 (0.11) 5.8×10⁻⁴
Frontal cortex 92 0.31 (0.11) 6.6×10⁻³
Nucleus accumbens 93 0.26 (0.10) 0.015
Cortex 96 0.24 (0.12) 0.052
Caudate (basal ganglia) 100 0.18 (0.099) 0.080
Hippocampus 81 0.22 (0.13) 0.095
Putamen (basal ganglia) 82 -0.019 (0.12) 0.87
Amygdalaa 62 NA NA
Spinal cord (cervical c-1)a 59 NA NA
Substantia nigraa 56 NA NA
aGTEx did not conduct eQTL testing for tissues with fewer than 70 samples in version 6p.
Associations were presented in these tissues in version 6; rs910083 was not associated with
DNMT3B expression in amygdala (P=0.26), spinal cord (P=0.93), or substantia nigra (P=0.58).
35

Supplementary Table 6. Associations of the rs910083-C allele that surpassed the significance threshold (false discovery rate
<0.05) in GTEx for any nearby gene in any tissue. Results are sorted by p-value.
Gene Tissuea N with RNA-sequencing and
SNP genotype data available
β (SE) P
MAPRE1 Skin - Sun Exposed (Lower leg) 302 0.40 (0.045) 7.3×10⁻¹⁷
MAPRE1 Esophagus – Mucosa 241 0.33 (0.037) 1.8×10⁻¹⁶
MAPRE1 Skin - Not Sun Exposed (Suprapubic) 196 0.38 (0.051) 4.0×10⁻¹²
MAPRE1 Whole Blood 338 0.20 (0.030) 1.1×10⁻¹⁰
DNMT3B Brain - Cerebellar Hemisphere 89 0.44 (0.081) 7.0×10⁻⁷
COMMD7 Colon – Transverse 169 0.31 (0.061) 1.0×10⁻⁶
COMMD7 Nerve – Tibial 256 0.23 (0.047) 1.2×10⁻⁶
COMMD7 Esophagus - Muscularis 218 0.20 (0.041) 2.0×10⁻⁶
COMMD7 Artery – Tibial 285 0.19 (0.039) 2.5×10⁻⁶
DNMT3B Brain – Cerebellum 103 0.50 (0.099) 3.0×10⁻⁶
MAPRE1 Pancreas 149 0.23 (0.049) 1.0×10⁻⁵
COMMD7 Testis 157 0.21 (0.045) 1.3×10⁻⁵
DNMT3B Esophagus - Muscularis 218 0.26 (0.059) 1.8×10⁻⁵
36

DNMT3B Colon - Transverse 169 0.33 (0.073) 1.8×10⁻⁵
BPIFB4 Artery - Tibial 285 -0.30 (0.072) 5.4×10⁻⁵
aSNP-expression associations were tested in the 44 GTEx tissues with more than 70 samples available.
37
Supplementary Table 7. DNMT3B and DBH SNP associations with lung cancer.
Associations were assessed overall (N=27,349 cases and 54,472 controls) and by histological
subtype (N=10,487 cases and 53,505 controls for adenocarcinoma and N=6,937 cases and
53,649 controls for squamous cell lung carcinoma). Participants were all of European/European
American ancestry.
SNP allele (Gene) Lung cancer type P OR (95% CI)
rs910083-C (DNMT3B) All 0.082 1.02 (1.00–1.05)
Adenocarcinoma 0.47 0.99 (0.96–1.02)
Squamous cell carcinoma 0.0095 1.05 (1.01–1.09)
rs56116178-G (DBH) All 7.9×10⁻⁴ 1.08 (1.03–1.12)
Adenocarcinoma 0.59 1.02 (0.96–1.08)
Squamous cell carcinoma 5.4×10⁻⁴ 1.13 (1.06–1.22)
38

Supplementary Table 8. DNMT3B and DBH SNP associations with squamous cell carcinoma, with and without adjustment for
smoking, in N up to 50,994 (5,783 cases and 45,211 controls) of the 60,586 that comprised the GWAS meta-analysis for this
subtype. Analyses were carried out in the Transdisciplinary Research for Cancer in Lung of the International Lung Cancer
Consortium (TRICL-ILCCO) Oncoarray and previous lung cancer GWAS (MDACC, IARC, SLRI, GERMAN, Harvard, and
deCODE) studies with smoking data readily available. Among these studies, more than 90% had the data available to enable smoking-
adjusted analyses.
SNP allele
(Gene)
Squamous cell carcinoma ~ SNP + age + sex + PCs
Squamous cell carcinoma ~ SNP + age + sex + PCs +
smoking history (ever/never) + pack-years for ever-smokers
(0 for never-smokers)
P OR (95% CI) P OR (95% CI)
rs910083-C
(DNMT3B)
0.026 1.05 (1.01–1.10) 0.17 1.03 (0.99–1.09)
rs56116178-G
(DBH)
0.011 1.10 (1.02–1.19) 0.29 1.05 (0.96–1.14)
CI, confidence interval; OR, odds ratio; PCs, principal components
39

Supplementary Table 9. HapMap-imputed SNPs implicated at P<5×10⁻⁷ in our cross-
ancestry GWAS meta-analysis of nicotine dependence (N=38,602 ever-smokers) and tested
for association with cigarettes per day (CPD, N=38,181 ever-smokers) and smoking
initiation (N=74,035 ever- vs never-smokers) in the Tobacco and Genetics (TAG)
consortium. SNPs are sorted by their nicotine dependence meta-analysis P value. NCBI build 37
positions are indicated. Linkage disequilibrium is presented with the top nicotine dependence-
associated SNP rs910083. β estimates were derived from linear regression models for nicotine
dependence and CPD and a logistic regression model for smoking initiation.
SNP
Chr. 20
position
Code
d
allele
r2 / D’
with
rs910083
in
1000G
EUR
r2 / D’
with
rs91008
3 in
1000G
AFR
Nicotine
dependence
meta-analysis
CPD meta-
analysis (TAG
consortium)
Smoking
initiation
meta-analysis
(TAG
consortium)
β (SE) P β (SE) P β (SE) P
rs242492
1
31,385,814 T 0.97 /
0.99
0.55 / 1 0.031
(0.0059)
1.3×10⁻⁷ 0.16
(0.082)
0.055 0.012
(0.012)
0.29
rs206557
6
31,389,009 T 0.99 / 1 0.56 /
0.90
0.030
(0.0058)
2.2×10⁻⁷ 0.15
(0.082)
0.059 0.011
(0.012)
0.33
rs242492
8
31,388,636 T 0.99 / 1 0.56 /
0.90
-0.030
(0.0058)
2.7×10⁻⁷ -0.16
(0.082)
0.052 -0.014
(0.012)
0.21
rs605889
1
31,386,347 T 0.99 / 1 0.52 / 1 -0.030
(0.0059)
3.0×10⁻⁷ -0.16
(0.082)
0.054 -0.012
(0.012)
0.30
40

rs199779
7
31,387,954 C 0.99 /
0.99
0.76 /
0.99
-0.029
(0.0056)
3.0×10⁻⁷ -0.16
(0.082)
0.056 -0.012
(0.012)
0.31
rs992472 31,385,269 T 0.78 /
0.99
0.39 /
0.89
0.029
(0.0056)
3.3×10⁻⁷ 0.19
(0.084)
0.027 0.023
(0.012)
0.049
rs242492
2
31,386,449 T 0.99 / 1 0.52 / 1 -0.030
(0.0059)
3.3×10⁻⁷ -0.16
(0.082)
0.051 -0.015
(0.012)
0.20
rs605889
3
31,392,777 T 0.83 /
0.99
0.68 /
0.97
0.029
(0.0056)
3.9×10⁻⁷ 0.17
(0.083)
0.044 0.018
(0.012)
0.13
rs242491
5
31,378,448 T 0.97 / 1 0.29 / 1 0.028
(0.0055)
3.9×10⁻⁷ 0.16
(0.082)
0.044 0.011
(0.012)
0.34
41

Supplementary Figure 1. Quantile-quantile plots of p-values from GWAS meta-analyses of
nicotine dependence across 15 studies. Results are shown for the meta-analyses of (A) all
studies, (B) European/European American ancestry-only studies, and (C) African American-only
studies. The observed vs expected meta-analysis p-values (black dots) are plotted along the
identity line (red) with the corresponding genomic inflation factor (λ) indicated.
(A)
42

(B)
(C)
43

Supplementary Figure 2. Manhattan plots of SNP and indel associations with nicotine
dependence from ancestry-specific GWAS meta-analyses. (A) The European/European
American ancestry-only meta-analysis included 13 studies (total N=28,677), and (B) the African
American-only meta-analysis included 9 studies (total N=9,925). The –log10 meta-analysis p-
values are plotted by chromosomal position of SNPs (depicted as circles) and indels (depicted as
triangles). The genome-wide statistical significance threshold (P<5x10⁻⁸) is shown as a solid
black line.
(A)
44

(B)
45

Supplementary Figure 3. DNMT3B SNP associations with severe vs mild nicotine dependence across studies. Associations are
shown for the rs910083-C allele across European/European American and African American participants. Open diamonds indicate the
nicotine dependence association results, sorted by the size of the originating study, and the black-filled diamond indicates the meta-
analysis result. AAs, African Americans; EAs, European Americans.
46

Supplementary Figure 4. SNPs, located in DNMT3B and across its 100kb flanking region, that were significantly associated
with DNA methylation levels in fetal brain (N=166). Genotyped and 1000 Genomes-imputed SNPs (blue lines) were tested for
association with Illumina HumanMethylation450K probes (red lines). Associations at P<3.69×10⁻¹³, based on Bonferroni correction
for genome-wide testing of all SNP-probe pairs in Hannon et al.38, are marked as black lines to designate the SNP and DNA
methylation probe positions. NCBI build 37 positions are indicated. Results were plotted at http://epigenetics.essex.ac.uk/mQTL/.
47

Supplementary Figure 5. DNMT3B gene expression across all 13 brain tissues available in
GTEx. RNA expression levels are presented as log10 reads per kilobase transcript per million
reads (RPKM). The sample size for each brain tissue with RNA expression data is presented.
48

Supplementary Figure 6. DNMT3B RNA transcript expression across all 10 tissues available in the Brain eQTL Almanac.
RNA expression levels are presented as log-transformed normalized intensity values. Tissues include the following: cerebellar cortex
(CRBL), intralobular white matter (WHMT), substantia nigra (SNIG), temporal cortex (TCTX), frontal cortex (FCTX), inferior
olivary nucleus (sub-dissected from the medulla, MEDU), thalamus (THAL), occipital cortex (OCTX), hippocampus (HIPP), and
putamen (PUTM).
49

Supplementary Figure 7. DBH SNP associations with severe vs mild nicotine dependence across studies. Associations are
shown for the rs56116178-G allele across European/European American participants, as the allele had very low frequency among
African Americans and was thus not included in the meta-analysis. Open diamonds indicate the nicotine dependence association
results, sorted by the size of the originating study, and the black-filled diamond indicates the meta-analysis result. EAs, European
Americans.
50

Supplementary Figure 8. Cigarettes per day (CPD) reported in each dependence category,
as defined by the Fagerström Test for Nicotine Dependence (FTND). Data were combined
across all COGEND (N=7,878) and deCODE (N=4,947) participants with phenotype data
available to calculate concordance.
0 to 3 4 to 6 7 to 100
5001,0001,5002,0002,5003,0003,5004,000
CPD <= 10 CPD = 11–20 CPD >= 21
FTND score
51

References1. Hancock DB, Reginsson GW, Gaddis NC, Chen X, Saccone NL, Lutz SM et al. Genome-
wide meta-analysis reveals common splice site acceptor variant in CHRNA4 associated
with nicotine dependence. Transl Psychiatry 2015; 5: e651.
2. Bierut LJ, Madden PA, Breslau N, Johnson EO, Hatsukami D, Pomerleau OF et al. Novel
genes identified in a high-density genome wide association study for nicotine
dependence. Hum Mol Genet 2007; 16(1): 24-35.
3. Regan EA, Hokanson JE, Murphy JR, Make B, Lynch DA, Beaty TH et al. Genetic
epidemiology of COPD (COPDGene) study design. COPD 2010; 7(1): 32-43.
4. Landi MT, Chatterjee N, Yu K, Goldin LR, Goldstein AM, Rotunno M et al. A genome-
wide association study of lung cancer identifies a region of chromosome 5p15 associated
with risk for adenocarcinoma. Am J Hum Genet 2009; 85(5): 679-691.
5. Landi MT, Consonni D, Rotunno M, Bergen AW, Goldstein AM, Lubin JH et al.
Environment And Genetics in Lung cancer Etiology (EAGLE) study: an integrative
population-based case-control study of lung cancer. BMC Public Health 2008; 8: 203.
6. Rice JP, Hartz SM, Agrawal A, Almasy L, Bennett S, Breslau N et al. CHRNB3 is more
strongly associated with Fagerstrom Test for Cigarette Dependence-based nicotine
dependence than cigarettes per day: phenotype definition changes genome-wide
association studies results. Addiction 2012; 107(11): 2019-2028.
7. Shaffer JR, Wang X, Feingold E, Lee M, Begum F, Weeks DE et al. Genome-wide
association scan for childhood caries implicates novel genes. J Dent Res 2011; 90(12):
1457-1462.
52

8. Manolio TA, Rodriguez LL, Brooks L, Abecasis G, Ballinger D, Daly M et al. New
models of collaboration in genome-wide association studies: the Genetic Association
Information Network. Nat Genet 2007; 39(9): 1045-1051.
9. Baker TB, Piper ME, McCarthy DE, Bolt DM, Smith SS, Kim SY et al. Time to first
cigarette in the morning as an index of ability to quit smoking: implications for nicotine
dependence. Nicotine Tob Res 2007; 9 Suppl 4: S555-570.
10. Fagerstrom KO. Measuring degree of physical dependence to tobacco smoking with
reference to individualization of treatment. Addict Behav 1978; 3(3-4): 235-241.
11. Heatherton TF, Kozlowski LT, Frecker RC, Fagerstrom KO. The Fagerstrom Test for
Nicotine Dependence: a revision of the Fagerstrom Tolerance Questionnaire. Br J Addict
1991; 86(9): 1119-1127.
12. Laurie CC, Doheny KF, Mirel DB, Pugh EW, Bierut LJ, Bhangale T et al. Quality
control and quality assurance in genotypic data for genome-wide association studies.
Genet Epidemiol 2010; 34(6): 591-602.
13. Johnson EO, Hancock DB, Levy JL, Gaddis NC, Saccone NL, Bierut LJ et al. Imputation
across genotyping arrays for genome-wide association studies: assessment of bias and a
correction strategy. Hum Genet 2013; 132: 509-522.
14. Thorgeirsson TE, Geller F, Sulem P, Rafnar T, Wiste A, Magnusson KP et al. A variant
associated with nicotine dependence, lung cancer and peripheral arterial disease. Nature
2008; 452(7187): 638-642.
53

15. Gulcher JR, Kristjansson K, Gudbjartsson H, Stefansson K. Protection of privacy by
third-party encryption in genetic research in Iceland. Eur J Hum Genet 2000; 8(10): 739-
742.
16. Sulem P, Gudbjartsson DF, Walters GB, Helgadottir HT, Helgason A, Gudjonsson SA et
al. Identification of low-frequency variants associated with gout and serum uric acid
levels. Nat Genet 2011; 43(11): 1127-1130.
17. Kaprio J. The Finnish Twin Cohort Study: an update. Twin Res Hum Genet 2013; 16(1):
157-162.
18. Kaprio J. Twin studies in Finland 2006. Twin Res Hum Genet 2006; 9(6): 772-777.
19. Loukola A, Buchwald J, Gupta R, Palviainen T, Hallfors J, Tikkanen E et al. A Genome-
wide association study of a biomarker of nicotine metabolism. PLoS Genet 2015; 11(9):
e1005498.
20. Sempos CT, Bild DE, Manolio TA. Overview of the Jackson Heart Study: a study of
cardiovascular diseases in African American men and women. Am J Med Sci 1999;
317(3): 142-146.
21. The Atherosclerosis Risk in Communities (ARIC) Study: design and objectives. The
ARIC investigators. Am J Epidemiol 1989; 129(4): 687-702.
22. Boomsma DI, de Geus EJ, Vink JM, Stubbe JH, Distel MA, Hottenga JJ et al.
Netherlands Twin Register: from twins to twin families. Twin Res Hum Genet 2006; 9(6):
849-857.
54

23. Willemsen G, de Geus EJ, Bartels M, van Beijsterveldt CE, Brooks AI, Estourgie-van
Burk GF et al. The Netherlands Twin Register biobank: a resource for genetic
epidemiological studies. Twin Res Hum Genet 2010; 13(3): 231-245.
24. Minica CC, Dolan CV, Hottenga JJ, Pool R, Genome of the Netherlands C, Fedko IO et
al. Heritability, SNP- and Gene-Based Analyses of Cannabis Use Initiation and Age at
Onset. Behav Genet 2015; 45(5): 503-513.
25. Vink JM, Willemsen G, Beem AL, Boomsma DI. The Fagerstrom Test for Nicotine
Dependence in a Dutch sample of daily smokers and ex-smokers. Addict Behav 2005;
30(3): 575-579.
26. Edenberg HJ. The collaborative study on the genetics of alcoholism: an update. Alcohol
Res Health 2002; 26(3): 214-218.
27. Bierut LJ, Strickland JR, Thompson JR, Afful SE, Cottler LB. Drug use and dependence
in cocaine dependent subjects, community-based individuals, and their siblings. Drug
Alcohol Depend 2008; 95(1-2): 14-22.
28. Gelernter J, Kranzler HR, Sherva R, Almasy L, Koesterer R, Smith AH et al. Genome-
wide association study of alcohol dependence:significant findings in African- and
European-Americans including novel risk loci. Mol Psychiatry 2014; 19(1): 41-49.
29. Gelernter J, Sherva R, Koesterer R, Almasy L, Zhao H, Kranzler HR et al. Genome-wide
association study of cocaine dependence and related traits: FAM53B identified as a risk
gene. Mol Psychiatry 2014; 19(6): 717-723.
55
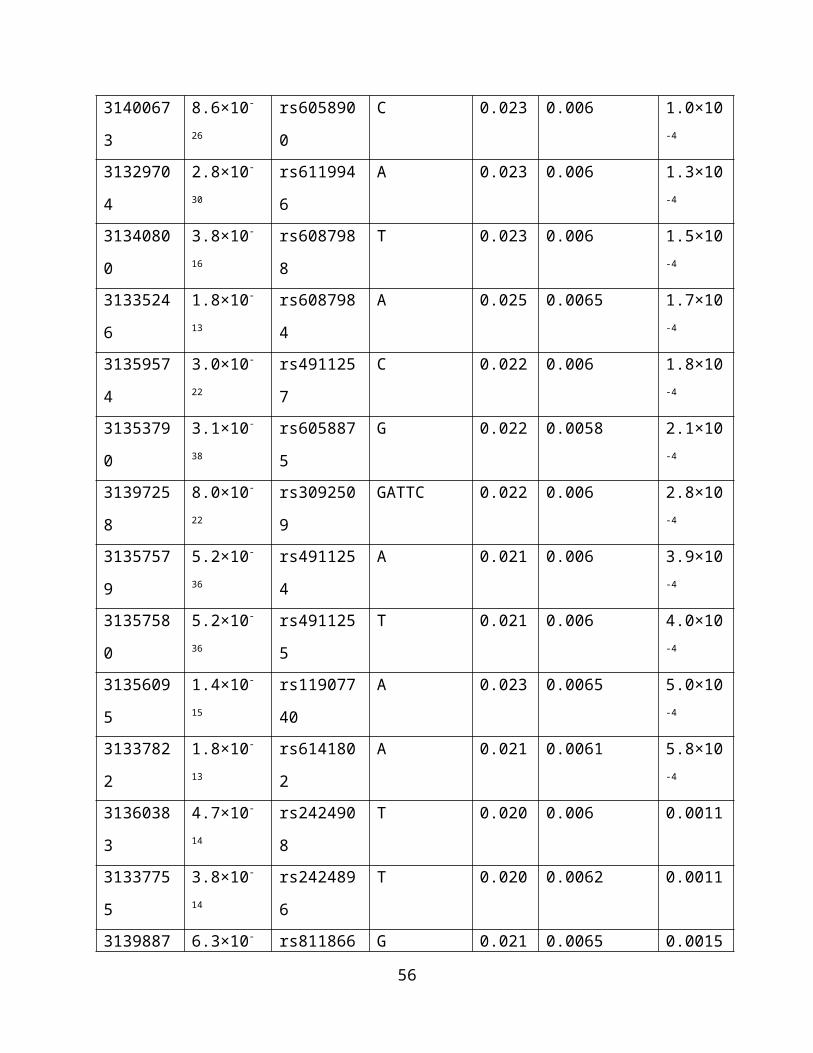
30. Gelernter J, Kranzler HR, Sherva R, Koesterer R, Almasy L, Zhao H et al. Genome-wide
association study of opioid dependence: multiple associations mapped to calcium and
potassium pathways. Biol Psychiatry 2014; 76(1): 66-74.
31. Gelernter J, Kranzler HR, Sherva R, Almasy L, Herman AI, Koesterer R et al. Genome-
wide association study of nicotine dependence in American populations: identification of
novel risk loci in both African-Americans and European-Americans. Biol Psychiatry
2015; 77(5): 493-503.
32. Howie B, Marchini J, Stephens M. Genotype imputation with thousands of genomes. G3
(Bethesda) 2011; 1(6): 457-470.
33. Gordon D, Finch SJ, Nothnagel M, Ott J. Power and sample size calculations for case-
control genetic association tests when errors are present: application to single nucleotide
polymorphisms. Hum Heredity 2002; 54(1): 22-33.
34. Sinnott JA, Dai W, Liao KP, Shaw SY, Ananthakrishnan AN, Gainer VS et al. Improving
the power of genetic association tests with imperfect phenotype derived from electronic
medical records. Hum Genet 2014; 133(11): 1369-1382.
35. Aulchenko YS, Struchalin MV, van Duijn CM. ProbABEL package for genome-wide
association analysis of imputed data. BMC Bioinformatics 2010; 11: 134.
36. GenABEL tutorial. http://www.genabel.org/sites/default/files/pdfs/GenABEL-
tutorial.pdf, 2014.
56

37. Purcell S, Neale B, Todd-Brown K, Thomas L, Ferreira MA, Bender D et al. PLINK: a
tool set for whole-genome association and population-based linkage analyses. Am J Hum
Genet 2007; 81(3): 559-575.
38. Hannon E, Spiers H, Viana J, Pidsley R, Burrage J, Murphy TM et al. Methylation QTLs
in the developing brain and their enrichment in schizophrenia risk loci. Nat Neurosci
2016; 19(1): 48-54.
39. GTEx Consortium. The Genotype-Tissue Expression (GTEx) project. Nat Genet 2013;
45(6): 580-585.
40. GTEx Consortium. Human genomics. The Genotype-Tissue Expression (GTEx) pilot
analysis: multitissue gene regulation in humans. Science 2015; 348(6235): 648-660.
41. Mele M, Ferreira PG, Reverter F, DeLuca DS, Monlong J, Sammeth M et al. Human
genomics. The human transcriptome across tissues and individuals. Science 2015;
348(6235): 660-665.
42. Ramasamy A, Trabzuni D, Guelfi S, Varghese V, Smith C, Walker R et al. Genetic
variability in the regulation of gene expression in ten regions of the human brain. Nat
Neurosci 2014; 17(10): 1418-1428.
43. Gudbjartsson DF, Helgason H, Gudjonsson SA, Zink F, Oddson A, Gylfason A et al.
Large-scale whole-genome sequencing of the Icelandic population. Nat Genet 2015;
47(5): 435-444.
57