supplementary appendix supplementary methods extended ages and stages questionnaire the child...
TRANSCRIPT
Supplementary appendixThis appendix formed part of the original submission and has been peer reviewed. We post it as supplied by the authors.
Supplement to: Stewart CP, Kariger P, Fernald L, et al. Effects of water quality, sanitation, handwashing, and nutritional interventions on child development in rural Kenya (WASH Benefits Kenya): a cluster-randomised controlled trial. Lancet Child Adolesc Health 2018; published online Feb 12. http://dx.doi.org/10.1016/S2352-4642(18)30025-7.
1
Supplementary Information for the WASH Benefits Kenya Child Development Paper
TABLE OF CONTENTS Supplementary methods ...................................................................................................................2
Table S1: Nutrient Content of the Lipid-based Nutrient Supplement (LNS) used in WASH Benefits compared to the WHO/FAO Recommended Nutrient Intakes (RNI)1 for children 1-3 years .................................................................................................................................................3
Table S2: Uptake of target behaviors at baseline and after one and two years after the start of intervention delivery ........................................................................................................................4
Table S3: Comparison of the rate of motor milestone attainment between groups, adjusted for potential covariates ......................................................................................................................... 5 Table S4: Differences between groups in scores on the Extended Ages and Stages Questionnaire, adjusted for potential covariates ..................................................................................................... 6 Table S5: Standardized differences in scores on the communication, gross motor, and personal social scales of the Extended Ages and Stages Questionnaire using inverse probability of censoring weighted (IPCW) analysis ...............................................................................................7 Table S6: Effect modification with child gender .............................................................................8 Table S7: Effect modification with maternal parity ....................................................................... 9 Table S8: Effect modification with maternal age ......................................................................... 10 Table S9: Effect modification with maternal education ............................................................... 11 Table S10: Effect modification with food insecurity .....................................................................12 Table S11: Effect modification with socioeconomic status .......................................................... 13 Table S12: CONSORT Abstract checklist ....................................................................................14 Table S13: CONSORT Checklist (Extension for cluster designs) ............................................... 15
2
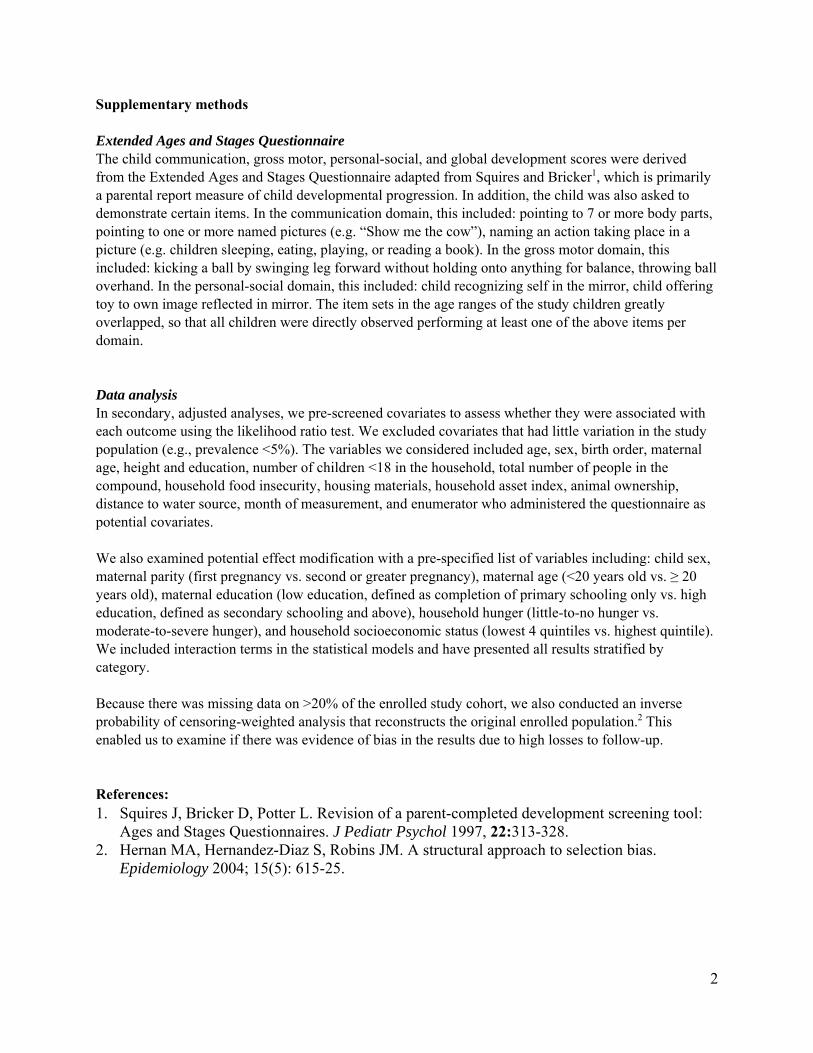
Supplementary methods Extended Ages and Stages Questionnaire The child communication, gross motor, personal-social, and global development scores were derived from the Extended Ages and Stages Questionnaire adapted from Squires and Bricker1, which is primarily a parental report measure of child developmental progression. In addition, the child was also asked to demonstrate certain items. In the communication domain, this included: pointing to 7 or more body parts, pointing to one or more named pictures (e.g. “Show me the cow”), naming an action taking place in a picture (e.g. children sleeping, eating, playing, or reading a book). In the gross motor domain, this included: kicking a ball by swinging leg forward without holding onto anything for balance, throwing ball overhand. In the personal-social domain, this included: child recognizing self in the mirror, child offering toy to own image reflected in mirror. The item sets in the age ranges of the study children greatly overlapped, so that all children were directly observed performing at least one of the above items per domain. Data analysis In secondary, adjusted analyses, we pre‐screened covariates to assess whether they were associated with each outcome using the likelihood ratio test. We excluded covariates that had little variation in the study population (e.g., prevalence <5%). The variables we considered included age, sex, birth order, maternal age, height and education, number of children <18 in the household, total number of people in the compound, household food insecurity, housing materials, household asset index, animal ownership, distance to water source, month of measurement, and enumerator who administered the questionnaire as potential covariates. We also examined potential effect modification with a pre‐specified list of variables including: child sex, maternal parity (first pregnancy vs. second or greater pregnancy), maternal age (<20 years old vs. ≥ 20 years old), maternal education (low education, defined as completion of primary schooling only vs. high education, defined as secondary schooling and above), household hunger (little‐to‐no hunger vs. moderate‐to‐severe hunger), and household socioeconomic status (lowest 4 quintiles vs. highest quintile). We included interaction terms in the statistical models and have presented all results stratified by category. Because there was missing data on >20% of the enrolled study cohort, we also conducted an inverse probability of censoring-weighted analysis that reconstructs the original enrolled population.2 This enabled us to examine if there was evidence of bias in the results due to high losses to follow-up. References: 1. Squires J, Bricker D, Potter L. Revision of a parent-completed development screening tool:
Ages and Stages Questionnaires. J Pediatr Psychol 1997, 22:313-328. 2. Hernan MA, Hernandez-Diaz S, Robins JM. A structural approach to selection bias.
Epidemiology 2004; 15(5): 615-25.

3
Table Supplementary Table 1. Nutrient Content of the Lipid-based Nutrient Supplement (LNS) used in WASH Benefits compared to the WHO/FAO Recommended Nutrient Intakes (RNI)1 for children 1-3 years
Nutrient Unit RNI
LNS Nutrient Content
Content % RNI Chemical form
Daily Dose‡ g 20
Energy kcal 118
Fat g 9.6
Linoleic acid g 4.46
Alpha-linolenic acid g 0.58
Ratio of LA to ALA 7.7
Protein g 2.6
Vitamins
Vitamin A μg 400 400 100% Retyinyl acetate
Vitamin D μg 5 5 100% Cholecalciferol (D3)
Vitamin E mg 5 6 120% DL-alpha-tocopherol acetate
Vitamin K μg 15 30 200% Phylloquinone 5%
Vitamin C mg 30 30 100% L-ascorbic acid
Biotin μg 8 NA
Folic acid μg 150 150 100% Pteroyl monoglutamic acid
Thiamine (B1) mg 0.5 0.5 100% Thiamin hydrochloride
Riboflavin (B2) mg 0.5 0.5 100% Riboflavin
Niacin mg 6 6 100% Niacinamide
Pantothenic acid (B5) mg 2 2 100% Calcium pantothenate
Vitamin B6 mg 0.5 0.5 100% Pyridoxine hydrochloride
Vitamin B12 μg 0.9 0.9 100% Cyanocobalamin (0.1%)
Minerals
Calcium§ mg 500 280 56% Tri-calcium phosphate
Copper¶ mg 0.34 0.34 100% Encapsulated copper sulfate
Iodine μg 90 90 100% Potassium iodate
Iron** mg 11.6 9 78% Encapsulated ferrous sulfate (Bangladesh) Ferrous
fumarate (Kenya) ‡‡
Magnesium§ mg 60 40 67% Magnesium citrate
Manganese mg 1.2 1.2 100% Manganeze sulfate
Phosphorous§ mg 460 190 41% Tri-calcium phosphate & Di-potassium phosphate
Potassium mg 200 Di-potassium phosphate & potassium chloride
Selenium μg 17 20 118% Sodium selenite 1.5%
Zinc** mg 8.3 8 96% Zinc sulfate
*RNI=Recommended Nutrient Intake; LNS=Lipid-based nutrient supplement; RDA=Recommended Dietary Allowance; WHO = World Health Organization; FAO = Food and Agriculture Organization of the United Nations ‡ In malaria endemic areas, it is recommended that the supplement be split into two 10 g servings in one day to reduce the iron consumed in a single bolus dose. Although malaria is less common in Bangladesh, we recommended that children consume two 10 g sachets per day in both trials.
§ The calcium, phosphorus, and magnesium content of LNS do not meet 100% of the RNI for technical reasons
¶ The Institute of Medicine RDA level for copper for infants 1-3 y is shown here.2 ** The RNI for iron and zinc is that assumed under a diet of low bioavailability. ‡‡ WASH Benefits Bangladesh used encapsulated ferrous sulfate, similar to other LNS products on the market. Ferrous fumarate was used in Kenya due to an interaction between ferrous sulfate and polyphenols in the commonly consumed millet flour.
References: 1. WHO and FAO, Vitamin and Mineral Requirements in Human Nutrition. Second Edition ed. 2004, Geneva, Switzerland:
World Health Organization.2. Institute of Medicine, Dietary Reference Intakes: The essential guide to nutrient requirements. 2006, Washington, DC:
National Academies Press.
4
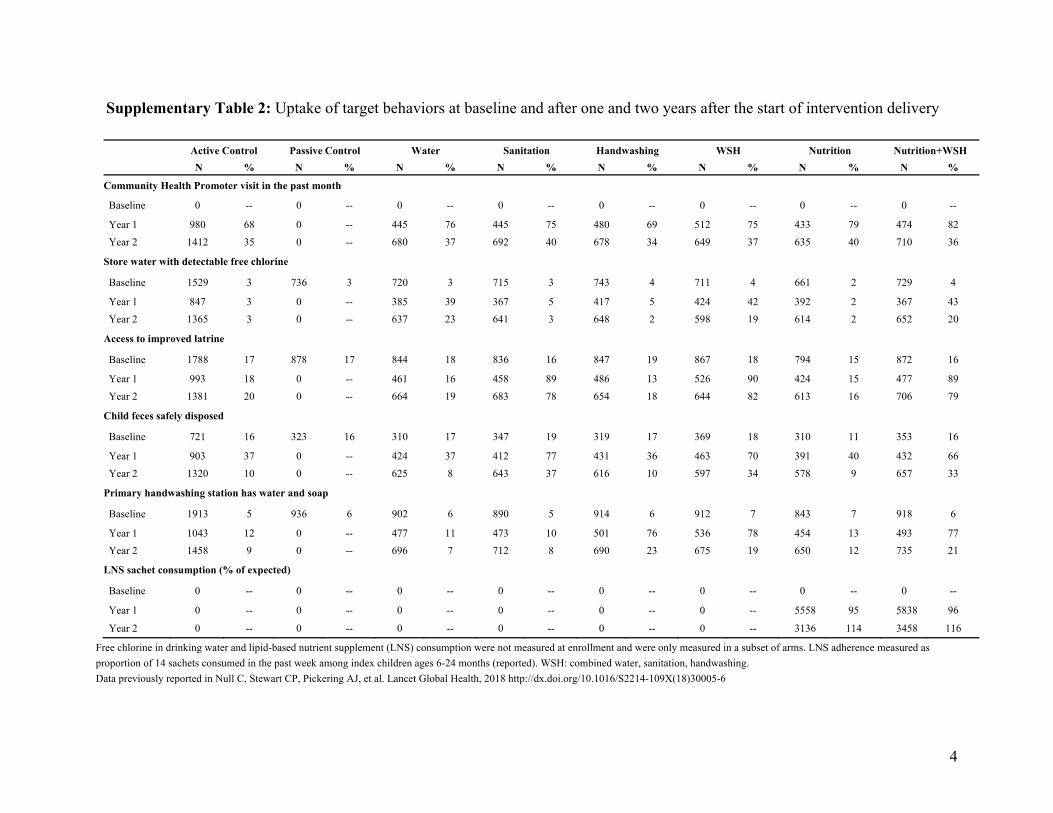
Supplementary Table 2: Uptake of target behaviors at baseline and after one and two years after the start of intervention delivery
Active Control Passive Control Water Sanitation Handwashing WSH Nutrition Nutrition+WSH
N % N % N % N % N % N % N % N %
Community Health Promoter visit in the past month
Baseline 0 ‐‐ 0 ‐‐ 0 ‐‐ 0 ‐‐ 0 ‐‐ 0 ‐‐ 0 ‐‐ 0 ‐‐
Year 1 980 68 0 ‐‐ 445 76 445 75 480 69 512 75 433 79 474 82
Year 2 1412 35 0 ‐‐ 680 37 692 40 678 34 649 37 635 40 710 36
Store water with detectable free chlorine
Baseline 1529 3 736 3 720 3 715 3 743 4 711 4 661 2 729 4
Year 1 847 3 0 ‐‐ 385 39 367 5 417 5 424 42 392 2 367 43
Year 2 1365 3 0 ‐‐ 637 23 641 3 648 2 598 19 614 2 652 20
Access to improved latrine
Baseline 1788 17 878 17 844 18 836 16 847 19 867 18 794 15 872 16
Year 1 993 18 0 ‐‐ 461 16 458 89 486 13 526 90 424 15 477 89
Year 2 1381 20 0 ‐‐ 664 19 683 78 654 18 644 82 613 16 706 79
Child feces safely disposed
Baseline 721 16 323 16 310 17 347 19 319 17 369 18 310 11 353 16
Year 1 903 37 0 ‐‐ 424 37 412 77 431 36 463 70 391 40 432 66
Year 2 1320 10 0 ‐‐ 625 8 643 37 616 10 597 34 578 9 657 33
Primary handwashing station has water and soap
Baseline 1913 5 936 6 902 6 890 5 914 6 912 7 843 7 918 6
Year 1 1043 12 0 ‐‐ 477 11 473 10 501 76 536 78 454 13 493 77
Year 2 1458 9 0 ‐‐ 696 7 712 8 690 23 675 19 650 12 735 21
LNS sachet consumption (% of expected)
Baseline 0 ‐‐ 0 ‐‐ 0 ‐‐ 0 ‐‐ 0 ‐‐ 0 ‐‐ 0 ‐‐ 0 ‐‐
Year 1 0 ‐‐ 0 ‐‐ 0 ‐‐ 0 ‐‐ 0 ‐‐ 0 ‐‐ 5558 95 5838 96
Year 2 0 ‐‐ 0 ‐‐ 0 ‐‐ 0 ‐‐ 0 ‐‐ 0 ‐‐ 3136 114 3458 116
Free chlorine in drinking water and lipid-based nutrient supplement (LNS) consumption were not measured at enrollment and were only measured in a subset of arms. LNS adherence measured as
proportion of 14 sachets consumed in the past week among index children ages 6-24 months (reported). WSH: combined water, sanitation, handwashing. Data previously reported in Null C, Stewart CP, Pickering AJ, et al. Lancet Global Health, 2018 http://dx.doi.org/10.1016/S2214-109X(18)30005-6
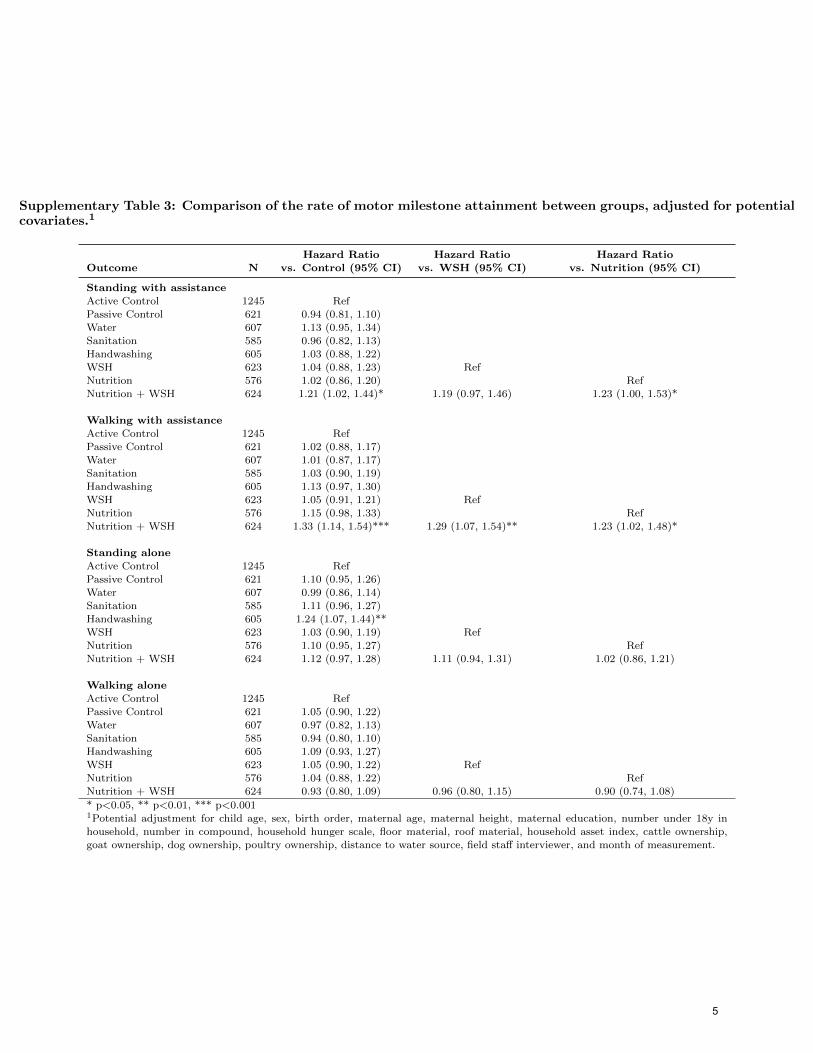
Supplementary Table 3: Comparison of the rate of motor milestone attainment between groups, adjusted for potentialcovariates.1
Hazard Ratio Hazard Ratio Hazard Ratio
Outcome N vs. Control (95% CI) vs. WSH (95% CI) vs. Nutrition (95% CI)
Standing with assistanceActive Control 1245 Ref
Passive Control 621 0.94 (0.81, 1.10)
Water 607 1.13 (0.95, 1.34)Sanitation 585 0.96 (0.82, 1.13)
Handwashing 605 1.03 (0.88, 1.22)
WSH 623 1.04 (0.88, 1.23) RefNutrition 576 1.02 (0.86, 1.20) Ref
Nutrition + WSH 624 1.21 (1.02, 1.44)* 1.19 (0.97, 1.46) 1.23 (1.00, 1.53)*
Walking with assistance
Active Control 1245 RefPassive Control 621 1.02 (0.88, 1.17)
Water 607 1.01 (0.87, 1.17)
Sanitation 585 1.03 (0.90, 1.19)Handwashing 605 1.13 (0.97, 1.30)
WSH 623 1.05 (0.91, 1.21) Ref
Nutrition 576 1.15 (0.98, 1.33) RefNutrition + WSH 624 1.33 (1.14, 1.54)*** 1.29 (1.07, 1.54)** 1.23 (1.02, 1.48)*
Standing aloneActive Control 1245 Ref
Passive Control 621 1.10 (0.95, 1.26)Water 607 0.99 (0.86, 1.14)
Sanitation 585 1.11 (0.96, 1.27)
Handwashing 605 1.24 (1.07, 1.44)**WSH 623 1.03 (0.90, 1.19) Ref
Nutrition 576 1.10 (0.95, 1.27) Ref
Nutrition + WSH 624 1.12 (0.97, 1.28) 1.11 (0.94, 1.31) 1.02 (0.86, 1.21)
Walking alone
Active Control 1245 RefPassive Control 621 1.05 (0.90, 1.22)
Water 607 0.97 (0.82, 1.13)
Sanitation 585 0.94 (0.80, 1.10)Handwashing 605 1.09 (0.93, 1.27)WSH 623 1.05 (0.90, 1.22) RefNutrition 576 1.04 (0.88, 1.22) RefNutrition + WSH 624 0.93 (0.80, 1.09) 0.96 (0.80, 1.15) 0.90 (0.74, 1.08)
* p<0.05, ** p<0.01, *** p<0.0011Potential adjustment for child age, sex, birth order, maternal age, maternal height, maternal education, number under 18y inhousehold, number in compound, household hunger scale, floor material, roof material, household asset index, cattle ownership,
goat ownership, dog ownership, poultry ownership, distance to water source, field staff interviewer, and month of measurement.
1
5
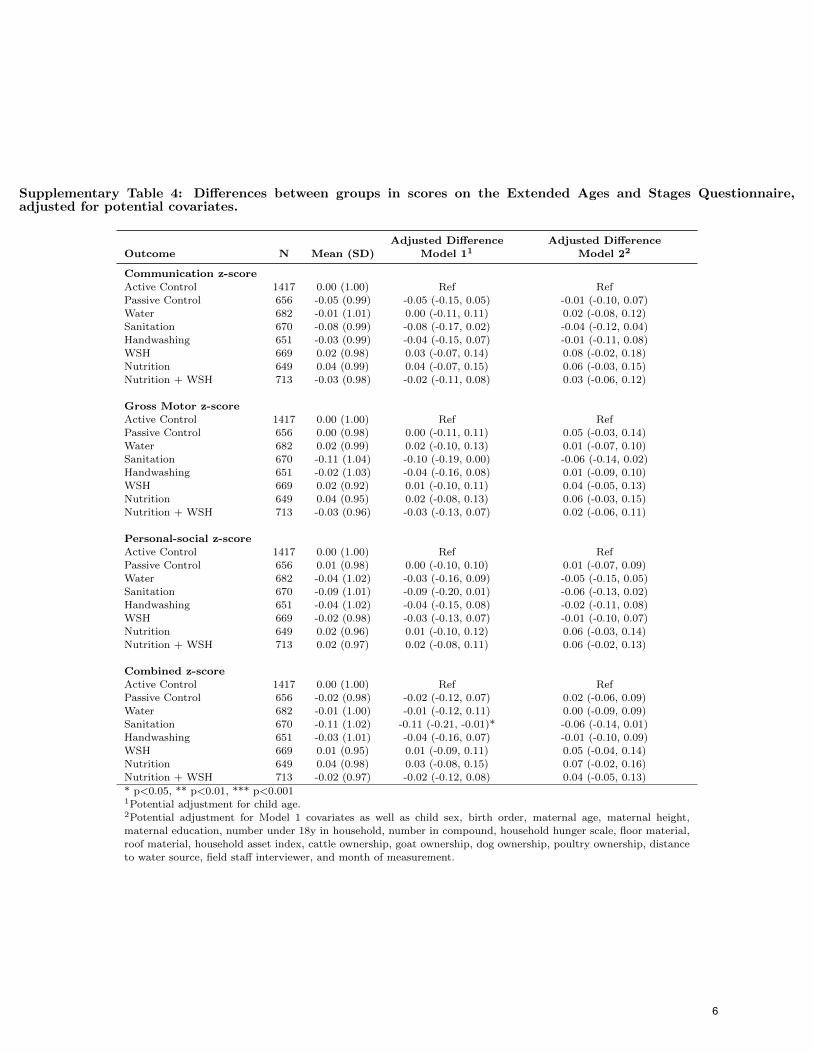
Supplementary Table 4: Differences between groups in scores on the Extended Ages and Stages Questionnaire,adjusted for potential covariates.
Adjusted Difference Adjusted DifferenceOutcome N Mean (SD) Model 11 Model 22
Communication z-scoreActive Control 1417 0.00 (1.00) Ref Ref
Passive Control 656 -0.05 (0.99) -0.05 (-0.15, 0.05) -0.01 (-0.10, 0.07)
Water 682 -0.01 (1.01) 0.00 (-0.11, 0.11) 0.02 (-0.08, 0.12)Sanitation 670 -0.08 (0.99) -0.08 (-0.17, 0.02) -0.04 (-0.12, 0.04)
Handwashing 651 -0.03 (0.99) -0.04 (-0.15, 0.07) -0.01 (-0.11, 0.08)
WSH 669 0.02 (0.98) 0.03 (-0.07, 0.14) 0.08 (-0.02, 0.18)Nutrition 649 0.04 (0.99) 0.04 (-0.07, 0.15) 0.06 (-0.03, 0.15)
Nutrition + WSH 713 -0.03 (0.98) -0.02 (-0.11, 0.08) 0.03 (-0.06, 0.12)
Gross Motor z-score
Active Control 1417 0.00 (1.00) Ref Ref
Passive Control 656 0.00 (0.98) 0.00 (-0.11, 0.11) 0.05 (-0.03, 0.14)Water 682 0.02 (0.99) 0.02 (-0.10, 0.13) 0.01 (-0.07, 0.10)
Sanitation 670 -0.11 (1.04) -0.10 (-0.19, 0.00) -0.06 (-0.14, 0.02)Handwashing 651 -0.02 (1.03) -0.04 (-0.16, 0.08) 0.01 (-0.09, 0.10)
WSH 669 0.02 (0.92) 0.01 (-0.10, 0.11) 0.04 (-0.05, 0.13)
Nutrition 649 0.04 (0.95) 0.02 (-0.08, 0.13) 0.06 (-0.03, 0.15)Nutrition + WSH 713 -0.03 (0.96) -0.03 (-0.13, 0.07) 0.02 (-0.06, 0.11)
Personal-social z-scoreActive Control 1417 0.00 (1.00) Ref Ref
Passive Control 656 0.01 (0.98) 0.00 (-0.10, 0.10) 0.01 (-0.07, 0.09)
Water 682 -0.04 (1.02) -0.03 (-0.16, 0.09) -0.05 (-0.15, 0.05)Sanitation 670 -0.09 (1.01) -0.09 (-0.20, 0.01) -0.06 (-0.13, 0.02)
Handwashing 651 -0.04 (1.02) -0.04 (-0.15, 0.08) -0.02 (-0.11, 0.08)
WSH 669 -0.02 (0.98) -0.03 (-0.13, 0.07) -0.01 (-0.10, 0.07)Nutrition 649 0.02 (0.96) 0.01 (-0.10, 0.12) 0.06 (-0.03, 0.14)
Nutrition + WSH 713 0.02 (0.97) 0.02 (-0.08, 0.11) 0.06 (-0.02, 0.13)
Combined z-scoreActive Control 1417 0.00 (1.00) Ref RefPassive Control 656 -0.02 (0.98) -0.02 (-0.12, 0.07) 0.02 (-0.06, 0.09)
Water 682 -0.01 (1.00) -0.01 (-0.12, 0.11) 0.00 (-0.09, 0.09)
Sanitation 670 -0.11 (1.02) -0.11 (-0.21, -0.01)* -0.06 (-0.14, 0.01)Handwashing 651 -0.03 (1.01) -0.04 (-0.16, 0.07) -0.01 (-0.10, 0.09)
WSH 669 0.01 (0.95) 0.01 (-0.09, 0.11) 0.05 (-0.04, 0.14)Nutrition 649 0.04 (0.98) 0.03 (-0.08, 0.15) 0.07 (-0.02, 0.16)Nutrition + WSH 713 -0.02 (0.97) -0.02 (-0.12, 0.08) 0.04 (-0.05, 0.13)
* p<0.05, ** p<0.01, *** p<0.0011Potential adjustment for child age.2Potential adjustment for Model 1 covariates as well as child sex, birth order, maternal age, maternal height,maternal education, number under 18y in household, number in compound, household hunger scale, floor material,
roof material, household asset index, cattle ownership, goat ownership, dog ownership, poultry ownership, distanceto water source, field staff interviewer, and month of measurement.
2
6
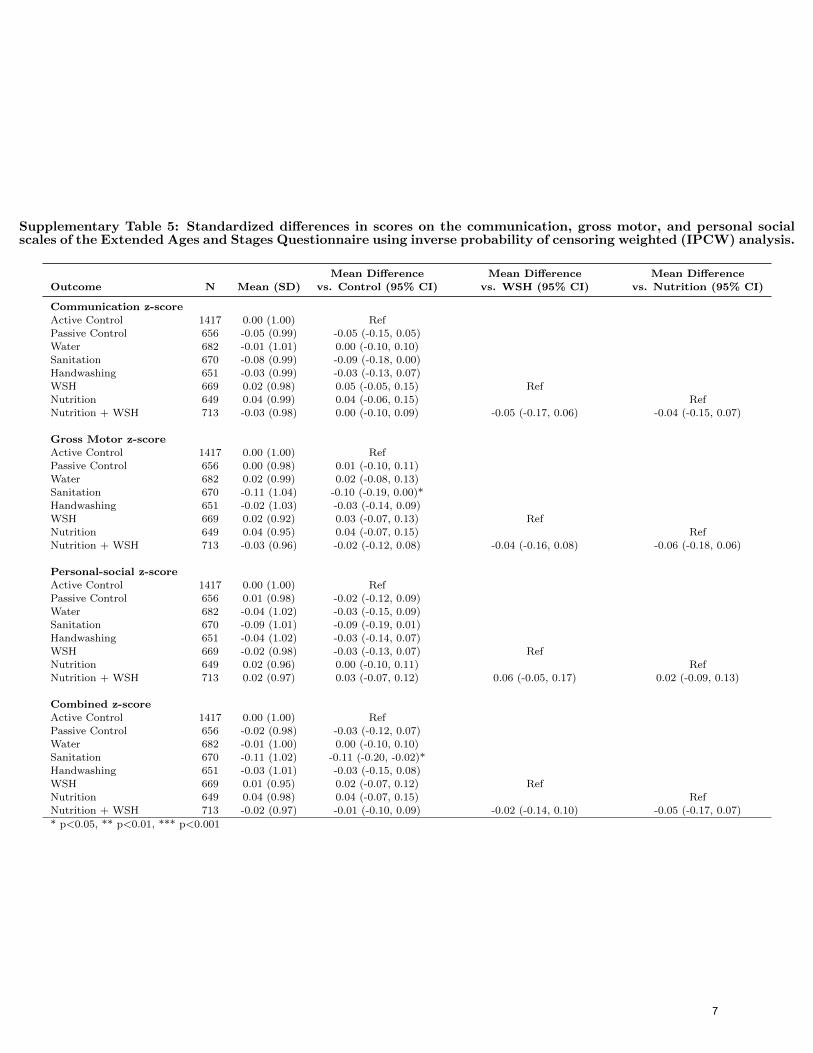
Supplementary Table 5: Standardized differences in scores on the communication, gross motor, and personal socialscales of the Extended Ages and Stages Questionnaire using inverse probability of censoring weighted (IPCW) analysis.
Mean Difference Mean Difference Mean Difference
Outcome N Mean (SD) vs. Control (95% CI) vs. WSH (95% CI) vs. Nutrition (95% CI)
Communication z-score
Active Control 1417 0.00 (1.00) Ref
Passive Control 656 -0.05 (0.99) -0.05 (-0.15, 0.05)Water 682 -0.01 (1.01) 0.00 (-0.10, 0.10)
Sanitation 670 -0.08 (0.99) -0.09 (-0.18, 0.00)
Handwashing 651 -0.03 (0.99) -0.03 (-0.13, 0.07)WSH 669 0.02 (0.98) 0.05 (-0.05, 0.15) Ref
Nutrition 649 0.04 (0.99) 0.04 (-0.06, 0.15) Ref
Nutrition + WSH 713 -0.03 (0.98) 0.00 (-0.10, 0.09) -0.05 (-0.17, 0.06) -0.04 (-0.15, 0.07)
Gross Motor z-scoreActive Control 1417 0.00 (1.00) Ref
Passive Control 656 0.00 (0.98) 0.01 (-0.10, 0.11)
Water 682 0.02 (0.99) 0.02 (-0.08, 0.13)Sanitation 670 -0.11 (1.04) -0.10 (-0.19, 0.00)*
Handwashing 651 -0.02 (1.03) -0.03 (-0.14, 0.09)
WSH 669 0.02 (0.92) 0.03 (-0.07, 0.13) RefNutrition 649 0.04 (0.95) 0.04 (-0.07, 0.15) Ref
Nutrition + WSH 713 -0.03 (0.96) -0.02 (-0.12, 0.08) -0.04 (-0.16, 0.08) -0.06 (-0.18, 0.06)
Personal-social z-score
Active Control 1417 0.00 (1.00) Ref
Passive Control 656 0.01 (0.98) -0.02 (-0.12, 0.09)Water 682 -0.04 (1.02) -0.03 (-0.15, 0.09)
Sanitation 670 -0.09 (1.01) -0.09 (-0.19, 0.01)Handwashing 651 -0.04 (1.02) -0.03 (-0.14, 0.07)
WSH 669 -0.02 (0.98) -0.03 (-0.13, 0.07) Ref
Nutrition 649 0.02 (0.96) 0.00 (-0.10, 0.11) RefNutrition + WSH 713 0.02 (0.97) 0.03 (-0.07, 0.12) 0.06 (-0.05, 0.17) 0.02 (-0.09, 0.13)
Combined z-scoreActive Control 1417 0.00 (1.00) RefPassive Control 656 -0.02 (0.98) -0.03 (-0.12, 0.07)
Water 682 -0.01 (1.00) 0.00 (-0.10, 0.10)Sanitation 670 -0.11 (1.02) -0.11 (-0.20, -0.02)*
Handwashing 651 -0.03 (1.01) -0.03 (-0.15, 0.08)
WSH 669 0.01 (0.95) 0.02 (-0.07, 0.12) RefNutrition 649 0.04 (0.98) 0.04 (-0.07, 0.15) RefNutrition + WSH 713 -0.02 (0.97) -0.01 (-0.10, 0.09) -0.02 (-0.14, 0.10) -0.05 (-0.17, 0.07)
* p<0.05, ** p<0.01, *** p<0.001
3
7

Supplementary Table 6: Effect modification with child gender
Male Female
Mean Difference Mean Difference P forOutcome N Mean (SD) vs. Control (95% CI) N Mean (SD) vs. Control (95% CI) Interaction
Communication z-score
Active Control 679 -0.08 (1.04) 738 0.08 (0.95)Passive Control 301 -0.16 (1.04) -0.06 (-0.21, 0.09) 355 0.05 (0.94) 0.00 (-0.11, 0.12) 0.462
Water 327 -0.03 (1.05) 0.06 (-0.08, 0.20) 355 0.01 (0.97) -0.03 (-0.16, 0.10) 0.319
Sanitation 322 -0.18 (1.03) -0.04 (-0.18, 0.09) 348 0.00 (0.95) -0.03 (-0.13, 0.08) 0.862Handwashing 316 -0.15 (0.99) -0.08 (-0.22, 0.06) 335 0.08 (0.97) -0.02 (-0.15, 0.11) 0.569
WSH 315 -0.06 (1.00) 0.04 (-0.11, 0.19) 354 0.09 (0.96) 0.06 (-0.06, 0.18) 0.807
Nutrition 340 -0.06 (1.00) 0.01 (-0.12, 0.14) 309 0.14 (0.96) 0.09 (-0.04, 0.22) 0.326Nutrition + WSH 342 -0.16 (1.02) -0.04 (-0.15, 0.08) 371 0.09 (0.92) 0.04 (-0.09, 0.18) 0.388
N + WSH vs WSH -0.09 (-0.24, 0.06) -0.05 (-0.19, 0.09) 0.661
N + WSH vs N -0.05 (-0.21, 0.10) -0.09 (-0.23, 0.05) 0.715
Gross Motor z-scoreActive Control 679 -0.01 (0.99) 738 0.01 (1.01)
Passive Control 301 0.02 (0.97) 0.07 (-0.08, 0.21) 355 -0.02 (0.99) -0.01 (-0.15, 0.13) 0.479
Water 327 -0.03 (1.02) -0.03 (-0.15, 0.10) 355 0.06 (0.95) 0.11 (-0.04, 0.25) 0.173Sanitation 322 -0.14 (1.05) -0.10 (-0.23, 0.03) 348 -0.07 (1.02) -0.02 (-0.16, 0.11) 0.440
Handwashing 316 -0.07 (1.02) -0.06 (-0.22, 0.10) 335 0.01 (1.04) 0.01 (-0.13, 0.15) 0.495
WSH 315 -0.06 (0.94) -0.05 (-0.20, 0.09) 354 0.08 (0.91) 0.08 (-0.06, 0.23) 0.202Nutrition 340 0.06 (0.95) 0.04 (-0.08, 0.16) 309 0.01 (0.96) 0.02 (-0.10, 0.15) 0.814
Nutrition + WSH 342 -0.07 (1.02) -0.05 (-0.20, 0.10) 371 0.00 (0.90) 0.03 (-0.11, 0.17) 0.453
N + WSH vs WSH -0.01 (-0.16, 0.15) -0.06 (-0.23, 0.10) 0.598N + WSH vs N -0.07 (-0.23, 0.09) -0.02 (-0.19, 0.16) 0.637
Personal-social z-score
Active Control 679 -0.11 (1.00) 738 0.10 (0.99)
Passive Control 301 -0.07 (1.02) 0.04 (-0.09, 0.16) 355 0.08 (0.93) -0.01 (-0.12, 0.10) 0.540Water 327 -0.13 (1.08) 0.00 (-0.15, 0.16) 355 0.05 (0.95) -0.03 (-0.15, 0.09) 0.691
Sanitation 322 -0.20 (0.99) -0.04 (-0.19, 0.11) 348 0.01 (1.02) -0.06 (-0.18, 0.06) 0.836
Handwashing 316 -0.19 (1.01) -0.08 (-0.23, 0.07) 335 0.11 (1.01) -0.03 (-0.15, 0.09) 0.648WSH 315 -0.12 (1.00) 0.01 (-0.13, 0.15) 354 0.07 (0.95) -0.03 (-0.16, 0.09) 0.669
Nutrition 340 -0.06 (1.00) 0.04 (-0.10, 0.18) 309 0.11 (0.92) -0.01 (-0.15, 0.12) 0.538Nutrition + WSH 342 -0.16 (1.03) -0.04 (-0.17, 0.09) 371 0.18 (0.88) 0.07 (-0.04, 0.19) 0.227N + WSH vs WSH -0.04 (-0.20, 0.11) 0.08 (-0.08, 0.24) 0.229
N + WSH vs N -0.09 (-0.25, 0.07) 0.09 (-0.07, 0.24) 0.111
Combined z-scoreActive Control 679 -0.08 (1.02) 738 0.07 (0.97)Passive Control 301 -0.09 (1.03) 0.01 (-0.12, 0.14) 355 0.04 (0.94) -0.01 (-0.13, 0.11) 0.827
Water 327 -0.07 (1.07) 0.02 (-0.12, 0.15) 355 0.05 (0.94) 0.02 (-0.12, 0.15) 0.991
Sanitation 322 -0.21 (1.03) -0.07 (-0.21, 0.07) 348 -0.03 (0.99) -0.05 (-0.16, 0.07) 0.770Handwashing 316 -0.16 (1.01) -0.09 (-0.24, 0.06) 335 0.08 (1.00) -0.01 (-0.14, 0.11) 0.466WSH 315 -0.09 (0.98) 0.00 (-0.15, 0.15) 354 0.10 (0.92) 0.05 (-0.08, 0.18) 0.606Nutrition 340 -0.02 (0.99) 0.04 (-0.10, 0.17) 309 0.11 (0.96) 0.05 (-0.08, 0.18) 0.868Nutrition + WSH 342 -0.16 (1.04) -0.05 (-0.19, 0.09) 371 0.10 (0.89) 0.06 (-0.07, 0.18) 0.266
N + WSH vs WSH -0.06 (-0.22, 0.09) -0.03 (-0.18, 0.13) 0.723
N + WSH vs N -0.09 (-0.25, 0.07) -0.02 (-0.18, 0.13) 0.539
* p<0.05, ** p<0.01, *** p<0.001
4
8

Supplementary Table 7: Effect modification with maternal parity
Multiparous Nulliparous
Mean Difference Mean Difference P forOutcome N Mean (SD) vs. Control (95% CI) N Mean (SD) vs. Control (95% CI) Interaction
Communication z-score
Active Control 310 -0.04 (1.05) 1103 0.01 (0.98)Passive Control 138 -0.02 (1.00) 0.01 (-0.18, 0.20) 518 -0.06 (0.99) -0.03 (-0.15, 0.08) 0.680
Water 131 -0.14 (1.11) -0.12 (-0.38, 0.14) 551 0.02 (0.98) 0.04 (-0.08, 0.15) 0.268
Sanitation 151 0.07 (0.92) 0.13 (-0.08, 0.34) 519 -0.13 (1.01) -0.08 (-0.19, 0.02) 0.093Handwashing 129 -0.14 (1.03) -0.13 (-0.34, 0.09) 522 0.00 (0.97) -0.04 (-0.14, 0.07) 0.445
WSH 115 0.03 (0.96) 0.10 (-0.11, 0.30) 554 0.02 (0.99) 0.04 (-0.09, 0.16) 0.652
Nutrition 143 0.12 (0.94) 0.18 (-0.02, 0.38) 506 0.01 (1.00) 0.00 (-0.13, 0.13) 0.154Nutrition + WSH 146 -0.09 (0.94) -0.06 (-0.26, 0.14) 565 -0.01 (0.99) 0.02 (-0.08, 0.12) 0.449
N + WSH vs WSH -0.13 (-0.38, 0.11) -0.06 (-0.19, 0.07) 0.617
N + WSH vs N -0.31 (-0.57, -0.06)* 0.00 (-0.11, 0.12)
Gross Motor z-scoreActive Control 310 0.10 (0.94) 1103 -0.02 (1.01)
Passive Control 138 0.13 (0.84) 0.01 (-0.15, 0.18) 518 -0.04 (1.02) 0.03 (-0.09, 0.14) 0.890
Water 131 -0.04 (1.01) -0.10 (-0.32, 0.11) 551 0.03 (0.98) 0.07 (-0.04, 0.19) 0.153Sanitation 151 -0.01 (1.04) -0.05 (-0.29, 0.18) 519 -0.13 (1.04) -0.07 (-0.17, 0.04) 0.925
Handwashing 129 0.02 (1.03) -0.05 (-0.27, 0.17) 522 -0.04 (1.04) -0.02 (-0.14, 0.10) 0.800
WSH 115 0.15 (0.85) 0.03 (-0.15, 0.22) 554 -0.01 (0.94) 0.02 (-0.09, 0.13) 0.905Nutrition 143 0.07 (0.93) -0.04 (-0.27, 0.18) 506 0.03 (0.96) 0.05 (-0.06, 0.16) 0.460
Nutrition + WSH 146 0.07 (1.01) 0.01 (-0.22, 0.24) 565 -0.06 (0.94) -0.01 (-0.12, 0.09) 0.878
N + WSH vs WSH -0.04 (-0.28, 0.20) -0.04 (-0.16, 0.09) 0.948N + WSH vs N 0.03 (-0.20, 0.25) -0.06 (-0.19, 0.08) 0.496
Personal-social z-score
Active Control 310 -0.02 (1.00) 1103 0.01 (1.00)
Passive Control 138 0.00 (0.93) 0.02 (-0.16, 0.20) 518 0.01 (0.99) 0.01 (-0.09, 0.12) 0.961Water 131 -0.08 (1.06) -0.03 (-0.27, 0.21) 551 -0.02 (1.01) -0.02 (-0.14, 0.10) 0.945
Sanitation 151 0.01 (1.01) 0.05 (-0.16, 0.25) 519 -0.12 (1.01) -0.08 (-0.20, 0.03) 0.257
Handwashing 129 -0.01 (1.07) -0.01 (-0.24, 0.23) 522 -0.04 (1.01) -0.07 (-0.18, 0.04) 0.655WSH 115 0.08 (1.05) 0.12 (-0.12, 0.35) 554 -0.04 (0.96) -0.04 (-0.15, 0.07) 0.254
Nutrition 143 0.00 (0.92) 0.02 (-0.20, 0.25) 506 0.03 (0.98) 0.00 (-0.14, 0.13) 0.850Nutrition + WSH 146 0.12 (0.96) 0.16 (-0.06, 0.38) 565 -0.01 (0.97) -0.02 (-0.12, 0.08) 0.165N + WSH vs WSH 0.01 (-0.27, 0.30) 0.01 (-0.12, 0.15) 0.997
N + WSH vs N 0.04 (-0.20, 0.28) 0.00 (-0.13, 0.13) 0.755
Combined z-scoreActive Control 310 0.02 (0.97) 1103 0.00 (1.00)Passive Control 138 0.05 (0.91) 0.02 (-0.15, 0.18) 518 -0.04 (1.00) 0.00 (-0.10, 0.10) 0.839
Water 131 -0.11 (1.06) -0.12 (-0.35, 0.12) 551 0.01 (0.99) 0.04 (-0.06, 0.15) 0.208
Sanitation 151 0.02 (0.97) 0.05 (-0.16, 0.26) 519 -0.15 (1.03) -0.09 (-0.20, 0.01) 0.253Handwashing 129 -0.06 (1.07) -0.08 (-0.31, 0.14) 522 -0.03 (1.00) -0.04 (-0.15, 0.06) 0.768WSH 115 0.11 (0.94) 0.10 (-0.11, 0.30) 554 -0.01 (0.95) 0.01 (-0.10, 0.13) 0.484Nutrition 143 0.08 (0.93) 0.07 (-0.15, 0.29) 506 0.03 (0.99) 0.02 (-0.10, 0.15) 0.714Nutrition + WSH 146 0.02 (0.97) 0.02 (-0.21, 0.24) 565 -0.03 (0.97) 0.00 (-0.10, 0.10) 0.889
N + WSH vs WSH -0.08 (-0.33, 0.16) -0.04 (-0.17, 0.09) 0.752
N + WSH vs N -0.13 (-0.38, 0.13) -0.03 (-0.15, 0.10) 0.449
* p<0.05, ** p<0.01, *** p<0.001
5
9
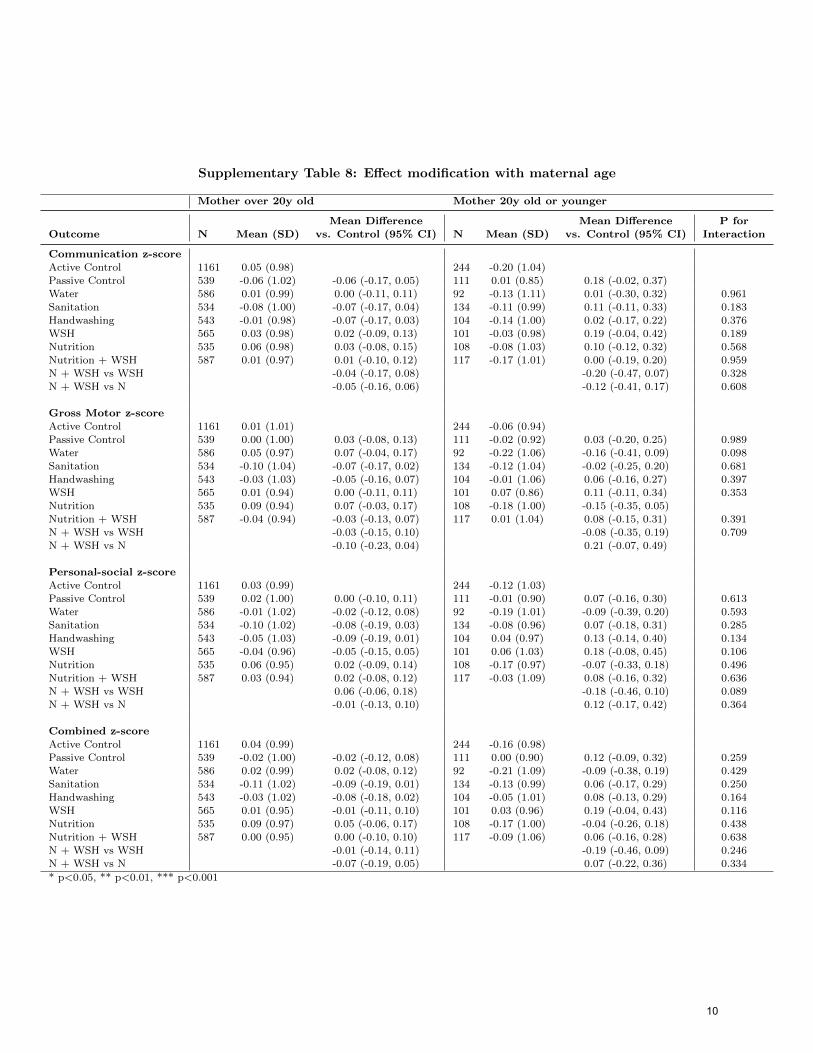
Supplementary Table 8: Effect modification with maternal age
Mother over 20y old Mother 20y old or younger
Mean Difference Mean Difference P forOutcome N Mean (SD) vs. Control (95% CI) N Mean (SD) vs. Control (95% CI) Interaction
Communication z-score
Active Control 1161 0.05 (0.98) 244 -0.20 (1.04)Passive Control 539 -0.06 (1.02) -0.06 (-0.17, 0.05) 111 0.01 (0.85) 0.18 (-0.02, 0.37)
Water 586 0.01 (0.99) 0.00 (-0.11, 0.11) 92 -0.13 (1.11) 0.01 (-0.30, 0.32) 0.961
Sanitation 534 -0.08 (1.00) -0.07 (-0.17, 0.04) 134 -0.11 (0.99) 0.11 (-0.11, 0.33) 0.183Handwashing 543 -0.01 (0.98) -0.07 (-0.17, 0.03) 104 -0.14 (1.00) 0.02 (-0.17, 0.22) 0.376
WSH 565 0.03 (0.98) 0.02 (-0.09, 0.13) 101 -0.03 (0.98) 0.19 (-0.04, 0.42) 0.189
Nutrition 535 0.06 (0.98) 0.03 (-0.08, 0.15) 108 -0.08 (1.03) 0.10 (-0.12, 0.32) 0.568Nutrition + WSH 587 0.01 (0.97) 0.01 (-0.10, 0.12) 117 -0.17 (1.01) 0.00 (-0.19, 0.20) 0.959
N + WSH vs WSH -0.04 (-0.17, 0.08) -0.20 (-0.47, 0.07) 0.328
N + WSH vs N -0.05 (-0.16, 0.06) -0.12 (-0.41, 0.17) 0.608
Gross Motor z-scoreActive Control 1161 0.01 (1.01) 244 -0.06 (0.94)
Passive Control 539 0.00 (1.00) 0.03 (-0.08, 0.13) 111 -0.02 (0.92) 0.03 (-0.20, 0.25) 0.989
Water 586 0.05 (0.97) 0.07 (-0.04, 0.17) 92 -0.22 (1.06) -0.16 (-0.41, 0.09) 0.098Sanitation 534 -0.10 (1.04) -0.07 (-0.17, 0.02) 134 -0.12 (1.04) -0.02 (-0.25, 0.20) 0.681
Handwashing 543 -0.03 (1.03) -0.05 (-0.16, 0.07) 104 -0.01 (1.06) 0.06 (-0.16, 0.27) 0.397
WSH 565 0.01 (0.94) 0.00 (-0.11, 0.11) 101 0.07 (0.86) 0.11 (-0.11, 0.34) 0.353Nutrition 535 0.09 (0.94) 0.07 (-0.03, 0.17) 108 -0.18 (1.00) -0.15 (-0.35, 0.05)
Nutrition + WSH 587 -0.04 (0.94) -0.03 (-0.13, 0.07) 117 0.01 (1.04) 0.08 (-0.15, 0.31) 0.391
N + WSH vs WSH -0.03 (-0.15, 0.10) -0.08 (-0.35, 0.19) 0.709N + WSH vs N -0.10 (-0.23, 0.04) 0.21 (-0.07, 0.49)
Personal-social z-score
Active Control 1161 0.03 (0.99) 244 -0.12 (1.03)
Passive Control 539 0.02 (1.00) 0.00 (-0.10, 0.11) 111 -0.01 (0.90) 0.07 (-0.16, 0.30) 0.613Water 586 -0.01 (1.02) -0.02 (-0.12, 0.08) 92 -0.19 (1.01) -0.09 (-0.39, 0.20) 0.593
Sanitation 534 -0.10 (1.02) -0.08 (-0.19, 0.03) 134 -0.08 (0.96) 0.07 (-0.18, 0.31) 0.285
Handwashing 543 -0.05 (1.03) -0.09 (-0.19, 0.01) 104 0.04 (0.97) 0.13 (-0.14, 0.40) 0.134WSH 565 -0.04 (0.96) -0.05 (-0.15, 0.05) 101 0.06 (1.03) 0.18 (-0.08, 0.45) 0.106
Nutrition 535 0.06 (0.95) 0.02 (-0.09, 0.14) 108 -0.17 (0.97) -0.07 (-0.33, 0.18) 0.496Nutrition + WSH 587 0.03 (0.94) 0.02 (-0.08, 0.12) 117 -0.03 (1.09) 0.08 (-0.16, 0.32) 0.636N + WSH vs WSH 0.06 (-0.06, 0.18) -0.18 (-0.46, 0.10) 0.089
N + WSH vs N -0.01 (-0.13, 0.10) 0.12 (-0.17, 0.42) 0.364
Combined z-scoreActive Control 1161 0.04 (0.99) 244 -0.16 (0.98)Passive Control 539 -0.02 (1.00) -0.02 (-0.12, 0.08) 111 0.00 (0.90) 0.12 (-0.09, 0.32) 0.259
Water 586 0.02 (0.99) 0.02 (-0.08, 0.12) 92 -0.21 (1.09) -0.09 (-0.38, 0.19) 0.429
Sanitation 534 -0.11 (1.02) -0.09 (-0.19, 0.01) 134 -0.13 (0.99) 0.06 (-0.17, 0.29) 0.250Handwashing 543 -0.03 (1.02) -0.08 (-0.18, 0.02) 104 -0.05 (1.01) 0.08 (-0.13, 0.29) 0.164WSH 565 0.01 (0.95) -0.01 (-0.11, 0.10) 101 0.03 (0.96) 0.19 (-0.04, 0.43) 0.116Nutrition 535 0.09 (0.97) 0.05 (-0.06, 0.17) 108 -0.17 (1.00) -0.04 (-0.26, 0.18) 0.438Nutrition + WSH 587 0.00 (0.95) 0.00 (-0.10, 0.10) 117 -0.09 (1.06) 0.06 (-0.16, 0.28) 0.638
N + WSH vs WSH -0.01 (-0.14, 0.11) -0.19 (-0.46, 0.09) 0.246
N + WSH vs N -0.07 (-0.19, 0.05) 0.07 (-0.22, 0.36) 0.334
* p<0.05, ** p<0.01, *** p<0.001
6
10
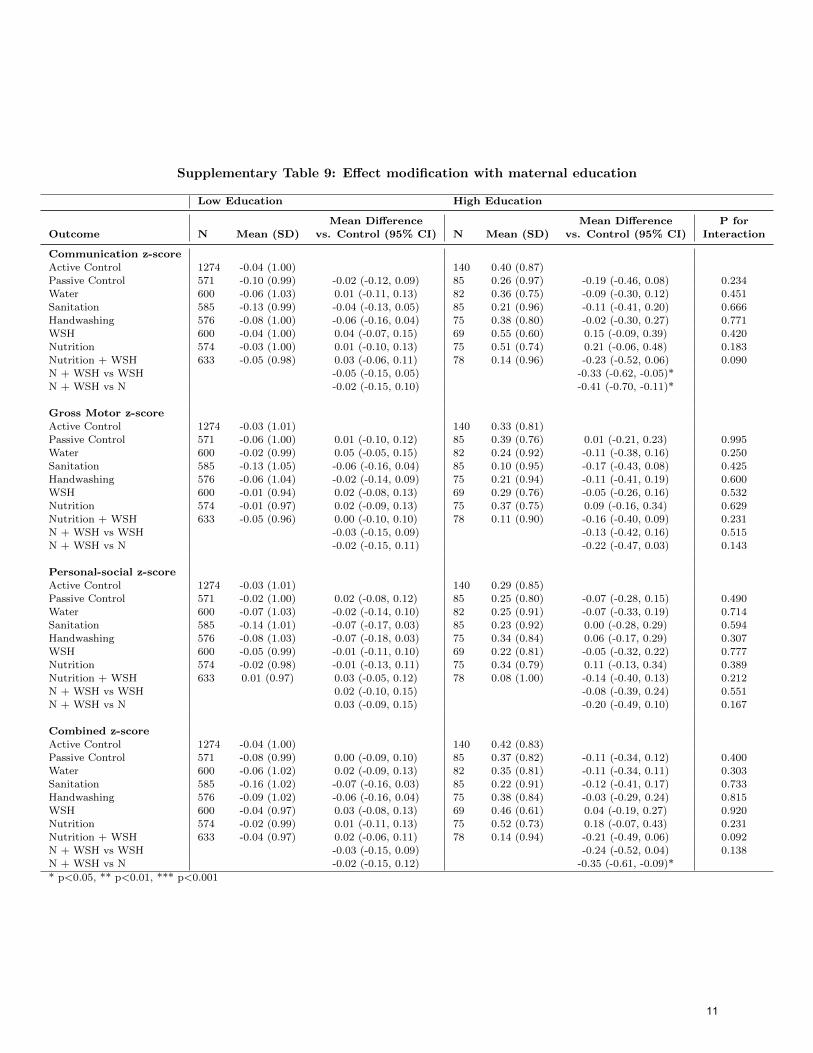
Supplementary Table 9: Effect modification with maternal education
Low Education High Education
Mean Difference Mean Difference P forOutcome N Mean (SD) vs. Control (95% CI) N Mean (SD) vs. Control (95% CI) Interaction
Communication z-score
Active Control 1274 -0.04 (1.00) 140 0.40 (0.87)Passive Control 571 -0.10 (0.99) -0.02 (-0.12, 0.09) 85 0.26 (0.97) -0.19 (-0.46, 0.08) 0.234
Water 600 -0.06 (1.03) 0.01 (-0.11, 0.13) 82 0.36 (0.75) -0.09 (-0.30, 0.12) 0.451
Sanitation 585 -0.13 (0.99) -0.04 (-0.13, 0.05) 85 0.21 (0.96) -0.11 (-0.41, 0.20) 0.666Handwashing 576 -0.08 (1.00) -0.06 (-0.16, 0.04) 75 0.38 (0.80) -0.02 (-0.30, 0.27) 0.771
WSH 600 -0.04 (1.00) 0.04 (-0.07, 0.15) 69 0.55 (0.60) 0.15 (-0.09, 0.39) 0.420
Nutrition 574 -0.03 (1.00) 0.01 (-0.10, 0.13) 75 0.51 (0.74) 0.21 (-0.06, 0.48) 0.183Nutrition + WSH 633 -0.05 (0.98) 0.03 (-0.06, 0.11) 78 0.14 (0.96) -0.23 (-0.52, 0.06) 0.090
N + WSH vs WSH -0.05 (-0.15, 0.05) -0.33 (-0.62, -0.05)*N + WSH vs N -0.02 (-0.15, 0.10) -0.41 (-0.70, -0.11)*
Gross Motor z-scoreActive Control 1274 -0.03 (1.01) 140 0.33 (0.81)
Passive Control 571 -0.06 (1.00) 0.01 (-0.10, 0.12) 85 0.39 (0.76) 0.01 (-0.21, 0.23) 0.995
Water 600 -0.02 (0.99) 0.05 (-0.05, 0.15) 82 0.24 (0.92) -0.11 (-0.38, 0.16) 0.250Sanitation 585 -0.13 (1.05) -0.06 (-0.16, 0.04) 85 0.10 (0.95) -0.17 (-0.43, 0.08) 0.425
Handwashing 576 -0.06 (1.04) -0.02 (-0.14, 0.09) 75 0.21 (0.94) -0.11 (-0.41, 0.19) 0.600
WSH 600 -0.01 (0.94) 0.02 (-0.08, 0.13) 69 0.29 (0.76) -0.05 (-0.26, 0.16) 0.532Nutrition 574 -0.01 (0.97) 0.02 (-0.09, 0.13) 75 0.37 (0.75) 0.09 (-0.16, 0.34) 0.629
Nutrition + WSH 633 -0.05 (0.96) 0.00 (-0.10, 0.10) 78 0.11 (0.90) -0.16 (-0.40, 0.09) 0.231
N + WSH vs WSH -0.03 (-0.15, 0.09) -0.13 (-0.42, 0.16) 0.515N + WSH vs N -0.02 (-0.15, 0.11) -0.22 (-0.47, 0.03) 0.143
Personal-social z-score
Active Control 1274 -0.03 (1.01) 140 0.29 (0.85)
Passive Control 571 -0.02 (1.00) 0.02 (-0.08, 0.12) 85 0.25 (0.80) -0.07 (-0.28, 0.15) 0.490Water 600 -0.07 (1.03) -0.02 (-0.14, 0.10) 82 0.25 (0.91) -0.07 (-0.33, 0.19) 0.714
Sanitation 585 -0.14 (1.01) -0.07 (-0.17, 0.03) 85 0.23 (0.92) 0.00 (-0.28, 0.29) 0.594
Handwashing 576 -0.08 (1.03) -0.07 (-0.18, 0.03) 75 0.34 (0.84) 0.06 (-0.17, 0.29) 0.307WSH 600 -0.05 (0.99) -0.01 (-0.11, 0.10) 69 0.22 (0.81) -0.05 (-0.32, 0.22) 0.777
Nutrition 574 -0.02 (0.98) -0.01 (-0.13, 0.11) 75 0.34 (0.79) 0.11 (-0.13, 0.34) 0.389Nutrition + WSH 633 0.01 (0.97) 0.03 (-0.05, 0.12) 78 0.08 (1.00) -0.14 (-0.40, 0.13) 0.212N + WSH vs WSH 0.02 (-0.10, 0.15) -0.08 (-0.39, 0.24) 0.551
N + WSH vs N 0.03 (-0.09, 0.15) -0.20 (-0.49, 0.10) 0.167
Combined z-scoreActive Control 1274 -0.04 (1.00) 140 0.42 (0.83)Passive Control 571 -0.08 (0.99) 0.00 (-0.09, 0.10) 85 0.37 (0.82) -0.11 (-0.34, 0.12) 0.400
Water 600 -0.06 (1.02) 0.02 (-0.09, 0.13) 82 0.35 (0.81) -0.11 (-0.34, 0.11) 0.303
Sanitation 585 -0.16 (1.02) -0.07 (-0.16, 0.03) 85 0.22 (0.91) -0.12 (-0.41, 0.17) 0.733Handwashing 576 -0.09 (1.02) -0.06 (-0.16, 0.04) 75 0.38 (0.84) -0.03 (-0.29, 0.24) 0.815WSH 600 -0.04 (0.97) 0.03 (-0.08, 0.13) 69 0.46 (0.61) 0.04 (-0.19, 0.27) 0.920Nutrition 574 -0.02 (0.99) 0.01 (-0.11, 0.13) 75 0.52 (0.73) 0.18 (-0.07, 0.43) 0.231Nutrition + WSH 633 -0.04 (0.97) 0.02 (-0.06, 0.11) 78 0.14 (0.94) -0.21 (-0.49, 0.06) 0.092
N + WSH vs WSH -0.03 (-0.15, 0.09) -0.24 (-0.52, 0.04) 0.138
N + WSH vs N -0.02 (-0.15, 0.12) -0.35 (-0.61, -0.09)*
* p<0.05, ** p<0.01, *** p<0.001
7
11
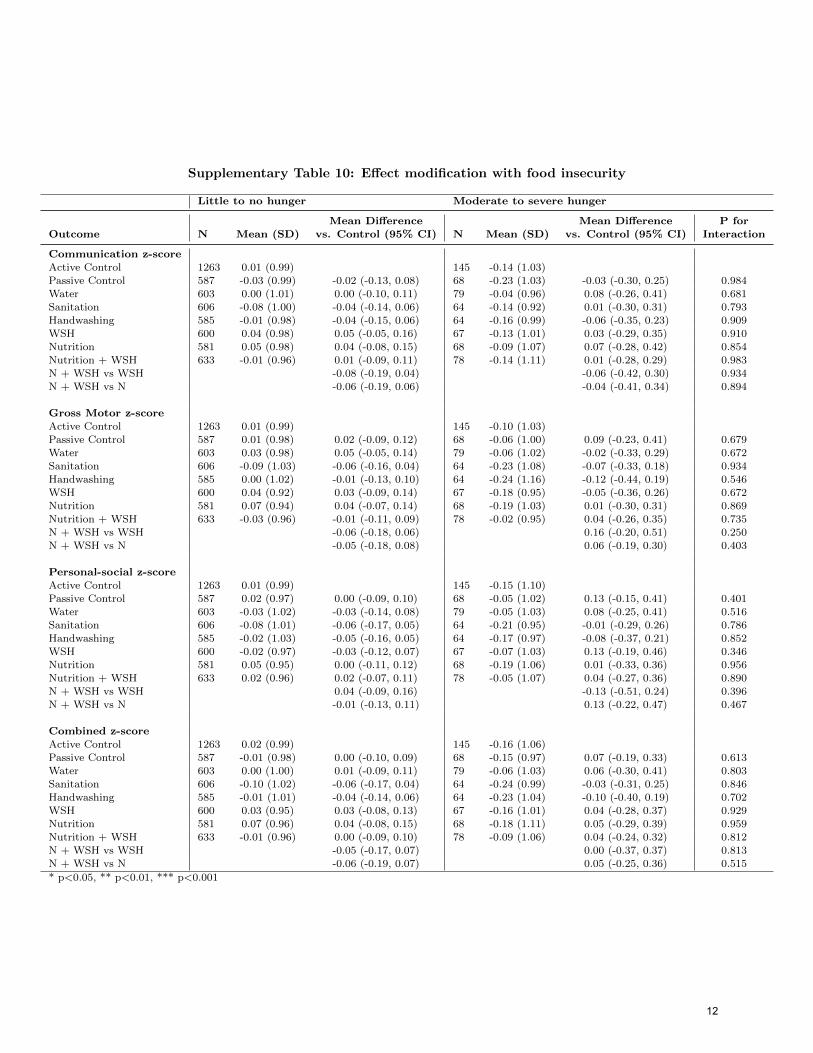
Supplementary Table 10: Effect modification with food insecurity
Little to no hunger Moderate to severe hunger
Mean Difference Mean Difference P forOutcome N Mean (SD) vs. Control (95% CI) N Mean (SD) vs. Control (95% CI) Interaction
Communication z-score
Active Control 1263 0.01 (0.99) 145 -0.14 (1.03)Passive Control 587 -0.03 (0.99) -0.02 (-0.13, 0.08) 68 -0.23 (1.03) -0.03 (-0.30, 0.25) 0.984
Water 603 0.00 (1.01) 0.00 (-0.10, 0.11) 79 -0.04 (0.96) 0.08 (-0.26, 0.41) 0.681
Sanitation 606 -0.08 (1.00) -0.04 (-0.14, 0.06) 64 -0.14 (0.92) 0.01 (-0.30, 0.31) 0.793Handwashing 585 -0.01 (0.98) -0.04 (-0.15, 0.06) 64 -0.16 (0.99) -0.06 (-0.35, 0.23) 0.909
WSH 600 0.04 (0.98) 0.05 (-0.05, 0.16) 67 -0.13 (1.01) 0.03 (-0.29, 0.35) 0.910
Nutrition 581 0.05 (0.98) 0.04 (-0.08, 0.15) 68 -0.09 (1.07) 0.07 (-0.28, 0.42) 0.854Nutrition + WSH 633 -0.01 (0.96) 0.01 (-0.09, 0.11) 78 -0.14 (1.11) 0.01 (-0.28, 0.29) 0.983
N + WSH vs WSH -0.08 (-0.19, 0.04) -0.06 (-0.42, 0.30) 0.934
N + WSH vs N -0.06 (-0.19, 0.06) -0.04 (-0.41, 0.34) 0.894
Gross Motor z-scoreActive Control 1263 0.01 (0.99) 145 -0.10 (1.03)
Passive Control 587 0.01 (0.98) 0.02 (-0.09, 0.12) 68 -0.06 (1.00) 0.09 (-0.23, 0.41) 0.679
Water 603 0.03 (0.98) 0.05 (-0.05, 0.14) 79 -0.06 (1.02) -0.02 (-0.33, 0.29) 0.672Sanitation 606 -0.09 (1.03) -0.06 (-0.16, 0.04) 64 -0.23 (1.08) -0.07 (-0.33, 0.18) 0.934
Handwashing 585 0.00 (1.02) -0.01 (-0.13, 0.10) 64 -0.24 (1.16) -0.12 (-0.44, 0.19) 0.546
WSH 600 0.04 (0.92) 0.03 (-0.09, 0.14) 67 -0.18 (0.95) -0.05 (-0.36, 0.26) 0.672Nutrition 581 0.07 (0.94) 0.04 (-0.07, 0.14) 68 -0.19 (1.03) 0.01 (-0.30, 0.31) 0.869
Nutrition + WSH 633 -0.03 (0.96) -0.01 (-0.11, 0.09) 78 -0.02 (0.95) 0.04 (-0.26, 0.35) 0.735
N + WSH vs WSH -0.06 (-0.18, 0.06) 0.16 (-0.20, 0.51) 0.250N + WSH vs N -0.05 (-0.18, 0.08) 0.06 (-0.19, 0.30) 0.403
Personal-social z-score
Active Control 1263 0.01 (0.99) 145 -0.15 (1.10)
Passive Control 587 0.02 (0.97) 0.00 (-0.09, 0.10) 68 -0.05 (1.02) 0.13 (-0.15, 0.41) 0.401Water 603 -0.03 (1.02) -0.03 (-0.14, 0.08) 79 -0.05 (1.03) 0.08 (-0.25, 0.41) 0.516
Sanitation 606 -0.08 (1.01) -0.06 (-0.17, 0.05) 64 -0.21 (0.95) -0.01 (-0.29, 0.26) 0.786
Handwashing 585 -0.02 (1.03) -0.05 (-0.16, 0.05) 64 -0.17 (0.97) -0.08 (-0.37, 0.21) 0.852WSH 600 -0.02 (0.97) -0.03 (-0.12, 0.07) 67 -0.07 (1.03) 0.13 (-0.19, 0.46) 0.346
Nutrition 581 0.05 (0.95) 0.00 (-0.11, 0.12) 68 -0.19 (1.06) 0.01 (-0.33, 0.36) 0.956Nutrition + WSH 633 0.02 (0.96) 0.02 (-0.07, 0.11) 78 -0.05 (1.07) 0.04 (-0.27, 0.36) 0.890N + WSH vs WSH 0.04 (-0.09, 0.16) -0.13 (-0.51, 0.24) 0.396
N + WSH vs N -0.01 (-0.13, 0.11) 0.13 (-0.22, 0.47) 0.467
Combined z-scoreActive Control 1263 0.02 (0.99) 145 -0.16 (1.06)Passive Control 587 -0.01 (0.98) 0.00 (-0.10, 0.09) 68 -0.15 (0.97) 0.07 (-0.19, 0.33) 0.613
Water 603 0.00 (1.00) 0.01 (-0.09, 0.11) 79 -0.06 (1.03) 0.06 (-0.30, 0.41) 0.803
Sanitation 606 -0.10 (1.02) -0.06 (-0.17, 0.04) 64 -0.24 (0.99) -0.03 (-0.31, 0.25) 0.846Handwashing 585 -0.01 (1.01) -0.04 (-0.14, 0.06) 64 -0.23 (1.04) -0.10 (-0.40, 0.19) 0.702WSH 600 0.03 (0.95) 0.03 (-0.08, 0.13) 67 -0.16 (1.01) 0.04 (-0.28, 0.37) 0.929Nutrition 581 0.07 (0.96) 0.04 (-0.08, 0.15) 68 -0.18 (1.11) 0.05 (-0.29, 0.39) 0.959Nutrition + WSH 633 -0.01 (0.96) 0.00 (-0.09, 0.10) 78 -0.09 (1.06) 0.04 (-0.24, 0.32) 0.812
N + WSH vs WSH -0.05 (-0.17, 0.07) 0.00 (-0.37, 0.37) 0.813
N + WSH vs N -0.06 (-0.19, 0.07) 0.05 (-0.25, 0.36) 0.515
* p<0.05, ** p<0.01, *** p<0.001
8
12
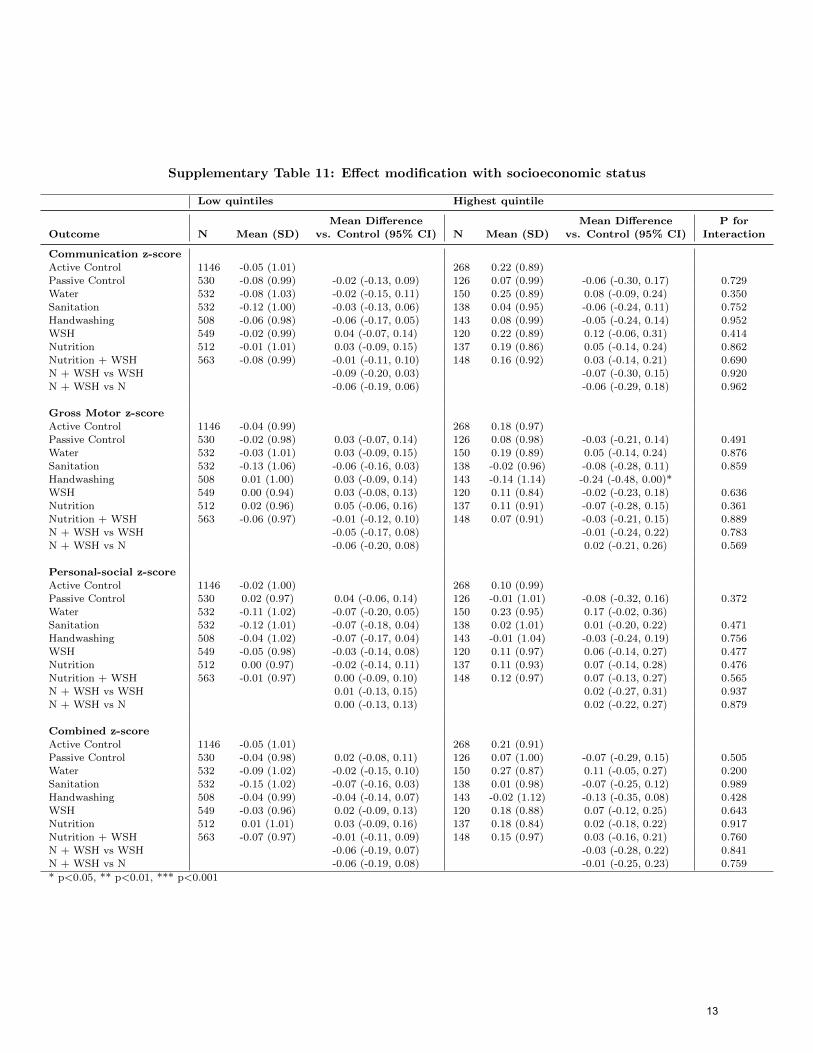
Supplementary Table 11: Effect modification with socioeconomic status
Low quintiles Highest quintile
Mean Difference Mean Difference P forOutcome N Mean (SD) vs. Control (95% CI) N Mean (SD) vs. Control (95% CI) Interaction
Communication z-score
Active Control 1146 -0.05 (1.01) 268 0.22 (0.89)Passive Control 530 -0.08 (0.99) -0.02 (-0.13, 0.09) 126 0.07 (0.99) -0.06 (-0.30, 0.17) 0.729
Water 532 -0.08 (1.03) -0.02 (-0.15, 0.11) 150 0.25 (0.89) 0.08 (-0.09, 0.24) 0.350
Sanitation 532 -0.12 (1.00) -0.03 (-0.13, 0.06) 138 0.04 (0.95) -0.06 (-0.24, 0.11) 0.752Handwashing 508 -0.06 (0.98) -0.06 (-0.17, 0.05) 143 0.08 (0.99) -0.05 (-0.24, 0.14) 0.952
WSH 549 -0.02 (0.99) 0.04 (-0.07, 0.14) 120 0.22 (0.89) 0.12 (-0.06, 0.31) 0.414
Nutrition 512 -0.01 (1.01) 0.03 (-0.09, 0.15) 137 0.19 (0.86) 0.05 (-0.14, 0.24) 0.862Nutrition + WSH 563 -0.08 (0.99) -0.01 (-0.11, 0.10) 148 0.16 (0.92) 0.03 (-0.14, 0.21) 0.690
N + WSH vs WSH -0.09 (-0.20, 0.03) -0.07 (-0.30, 0.15) 0.920
N + WSH vs N -0.06 (-0.19, 0.06) -0.06 (-0.29, 0.18) 0.962
Gross Motor z-scoreActive Control 1146 -0.04 (0.99) 268 0.18 (0.97)
Passive Control 530 -0.02 (0.98) 0.03 (-0.07, 0.14) 126 0.08 (0.98) -0.03 (-0.21, 0.14) 0.491
Water 532 -0.03 (1.01) 0.03 (-0.09, 0.15) 150 0.19 (0.89) 0.05 (-0.14, 0.24) 0.876Sanitation 532 -0.13 (1.06) -0.06 (-0.16, 0.03) 138 -0.02 (0.96) -0.08 (-0.28, 0.11) 0.859
Handwashing 508 0.01 (1.00) 0.03 (-0.09, 0.14) 143 -0.14 (1.14) -0.24 (-0.48, 0.00)*WSH 549 0.00 (0.94) 0.03 (-0.08, 0.13) 120 0.11 (0.84) -0.02 (-0.23, 0.18) 0.636Nutrition 512 0.02 (0.96) 0.05 (-0.06, 0.16) 137 0.11 (0.91) -0.07 (-0.28, 0.15) 0.361
Nutrition + WSH 563 -0.06 (0.97) -0.01 (-0.12, 0.10) 148 0.07 (0.91) -0.03 (-0.21, 0.15) 0.889
N + WSH vs WSH -0.05 (-0.17, 0.08) -0.01 (-0.24, 0.22) 0.783N + WSH vs N -0.06 (-0.20, 0.08) 0.02 (-0.21, 0.26) 0.569
Personal-social z-score
Active Control 1146 -0.02 (1.00) 268 0.10 (0.99)
Passive Control 530 0.02 (0.97) 0.04 (-0.06, 0.14) 126 -0.01 (1.01) -0.08 (-0.32, 0.16) 0.372Water 532 -0.11 (1.02) -0.07 (-0.20, 0.05) 150 0.23 (0.95) 0.17 (-0.02, 0.36)
Sanitation 532 -0.12 (1.01) -0.07 (-0.18, 0.04) 138 0.02 (1.01) 0.01 (-0.20, 0.22) 0.471
Handwashing 508 -0.04 (1.02) -0.07 (-0.17, 0.04) 143 -0.01 (1.04) -0.03 (-0.24, 0.19) 0.756WSH 549 -0.05 (0.98) -0.03 (-0.14, 0.08) 120 0.11 (0.97) 0.06 (-0.14, 0.27) 0.477
Nutrition 512 0.00 (0.97) -0.02 (-0.14, 0.11) 137 0.11 (0.93) 0.07 (-0.14, 0.28) 0.476Nutrition + WSH 563 -0.01 (0.97) 0.00 (-0.09, 0.10) 148 0.12 (0.97) 0.07 (-0.13, 0.27) 0.565N + WSH vs WSH 0.01 (-0.13, 0.15) 0.02 (-0.27, 0.31) 0.937
N + WSH vs N 0.00 (-0.13, 0.13) 0.02 (-0.22, 0.27) 0.879
Combined z-scoreActive Control 1146 -0.05 (1.01) 268 0.21 (0.91)Passive Control 530 -0.04 (0.98) 0.02 (-0.08, 0.11) 126 0.07 (1.00) -0.07 (-0.29, 0.15) 0.505
Water 532 -0.09 (1.02) -0.02 (-0.15, 0.10) 150 0.27 (0.87) 0.11 (-0.05, 0.27) 0.200
Sanitation 532 -0.15 (1.02) -0.07 (-0.16, 0.03) 138 0.01 (0.98) -0.07 (-0.25, 0.12) 0.989Handwashing 508 -0.04 (0.99) -0.04 (-0.14, 0.07) 143 -0.02 (1.12) -0.13 (-0.35, 0.08) 0.428WSH 549 -0.03 (0.96) 0.02 (-0.09, 0.13) 120 0.18 (0.88) 0.07 (-0.12, 0.25) 0.643Nutrition 512 0.01 (1.01) 0.03 (-0.09, 0.16) 137 0.18 (0.84) 0.02 (-0.18, 0.22) 0.917Nutrition + WSH 563 -0.07 (0.97) -0.01 (-0.11, 0.09) 148 0.15 (0.97) 0.03 (-0.16, 0.21) 0.760
N + WSH vs WSH -0.06 (-0.19, 0.07) -0.03 (-0.28, 0.22) 0.841
N + WSH vs N -0.06 (-0.19, 0.08) -0.01 (-0.25, 0.23) 0.759
* p<0.05, ** p<0.01, *** p<0.001
9
13
14
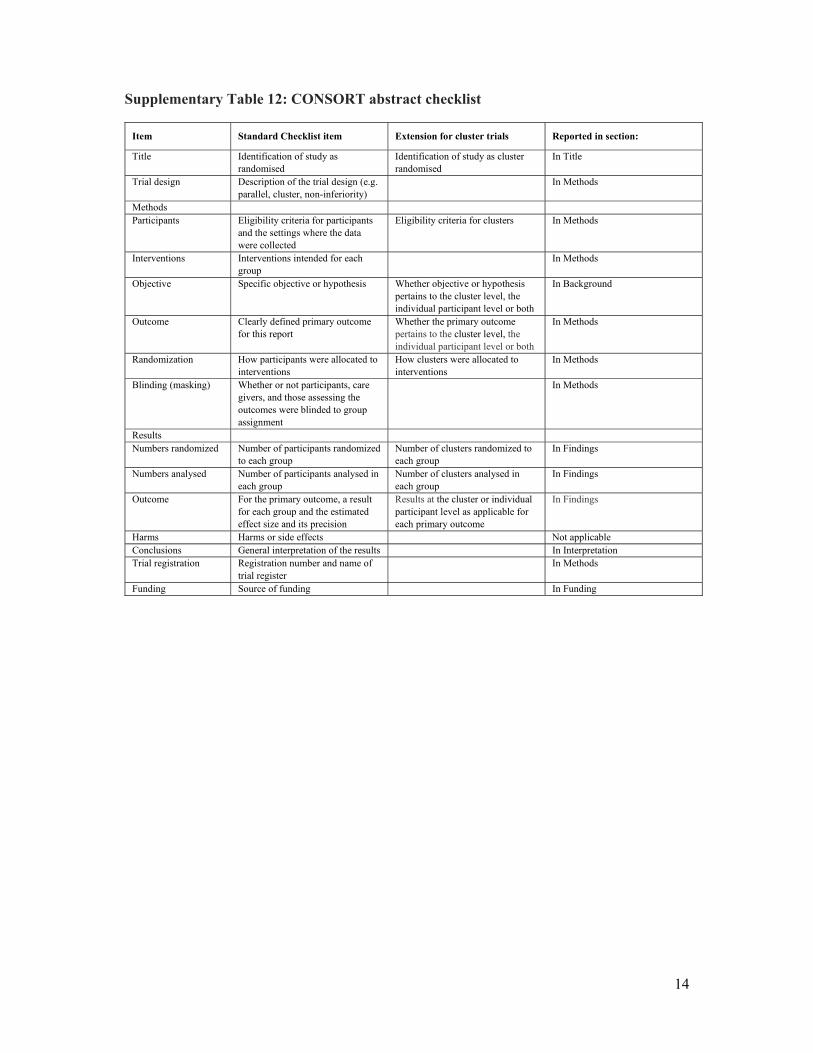
Supplementary Table 12: CONSORT abstract checklist
Item Standard Checklist item Extension for cluster trials Reported in section:
Title Identification of study as randomised
Identification of study as cluster randomised
In Title
Trial design Description of the trial design (e.g. parallel, cluster, non-inferiority)
In Methods
Methods Participants Eligibility criteria for participants
and the settings where the data were collected
Eligibility criteria for clusters In Methods
Interventions Interventions intended for each group
In Methods
Objective Specific objective or hypothesis Whether objective or hypothesis pertains to the cluster level, the individual participant level or both
In Background
Outcome Clearly defined primary outcome for this report
Whether the primary outcome pertains to the cluster level, the individual participant level or both
In Methods
Randomization How participants were allocated to interventions
How clusters were allocated to interventions
In Methods
Blinding (masking) Whether or not participants, care givers, and those assessing the outcomes were blinded to group assignment
In Methods
Results Numbers randomized Number of participants randomized
to each group Number of clusters randomized to each group
In Findings
Numbers analysed Number of participants analysed in each group
Number of clusters analysed in each group
In Findings
Outcome For the primary outcome, a result for each group and the estimated effect size and its precision
Results at the cluster or individual participant level as applicable for each primary outcome
In Findings
Harms Harms or side effects Not applicable Conclusions General interpretation of the results In Interpretation Trial registration Registration number and name of
trial register In Methods
Funding Source of funding In Funding
15
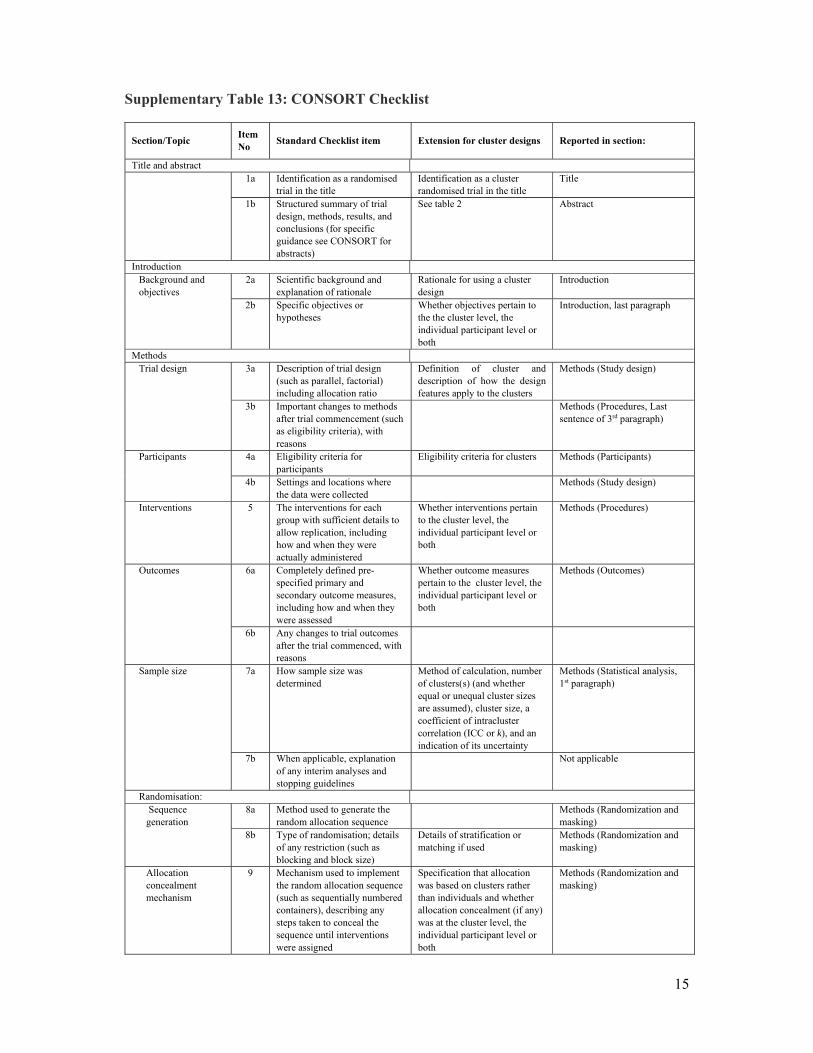
Supplementary Table 13: CONSORT Checklist
Section/Topic Item No
Standard Checklist item Extension for cluster designs Reported in section:
Title and abstract 1a Identification as a randomised
trial in the title Identification as a cluster randomised trial in the title
Title
1b Structured summary of trial design, methods, results, and conclusions (for specific guidance see CONSORT for abstracts)
See table 2 Abstract
Introduction Background and objectives
2a Scientific background and explanation of rationale
Rationale for using a cluster design
Introduction
2b Specific objectives or hypotheses
Whether objectives pertain to the the cluster level, the individual participant level or both
Introduction, last paragraph
Methods Trial design 3a Description of trial design
(such as parallel, factorial) including allocation ratio
Definition of cluster and description of how the design features apply to the clusters
Methods (Study design)
3b Important changes to methods after trial commencement (such as eligibility criteria), with reasons
Methods (Procedures, Last sentence of 3rd paragraph)
Participants 4a Eligibility criteria for participants
Eligibility criteria for clusters Methods (Participants)
4b Settings and locations where the data were collected
Methods (Study design)
Interventions 5 The interventions for each group with sufficient details to allow replication, including how and when they were actually administered
Whether interventions pertain to the cluster level, the individual participant level or both
Methods (Procedures)
Outcomes 6a Completely defined pre-specified primary and secondary outcome measures, including how and when they were assessed
Whether outcome measures pertain to the cluster level, the individual participant level or both
Methods (Outcomes)
6b Any changes to trial outcomes after the trial commenced, with reasons
Sample size 7a How sample size was determined
Method of calculation, number of clusters(s) (and whether equal or unequal cluster sizes are assumed), cluster size, a coefficient of intracluster correlation (ICC or k), and an indication of its uncertainty
Methods (Statistical analysis, 1st paragraph)
7b When applicable, explanation of any interim analyses and stopping guidelines
Not applicable
Randomisation: Sequence generation
8a Method used to generate the random allocation sequence
Methods (Randomization and masking)
8b Type of randomisation; details of any restriction (such as blocking and block size)
Details of stratification or matching if used
Methods (Randomization and masking)
Allocation concealment mechanism
9 Mechanism used to implement the random allocation sequence (such as sequentially numbered containers), describing any steps taken to conceal the sequence until interventions were assigned
Specification that allocation was based on clusters rather than individuals and whether allocation concealment (if any) was at the cluster level, the individual participant level or both
Methods (Randomization and masking)
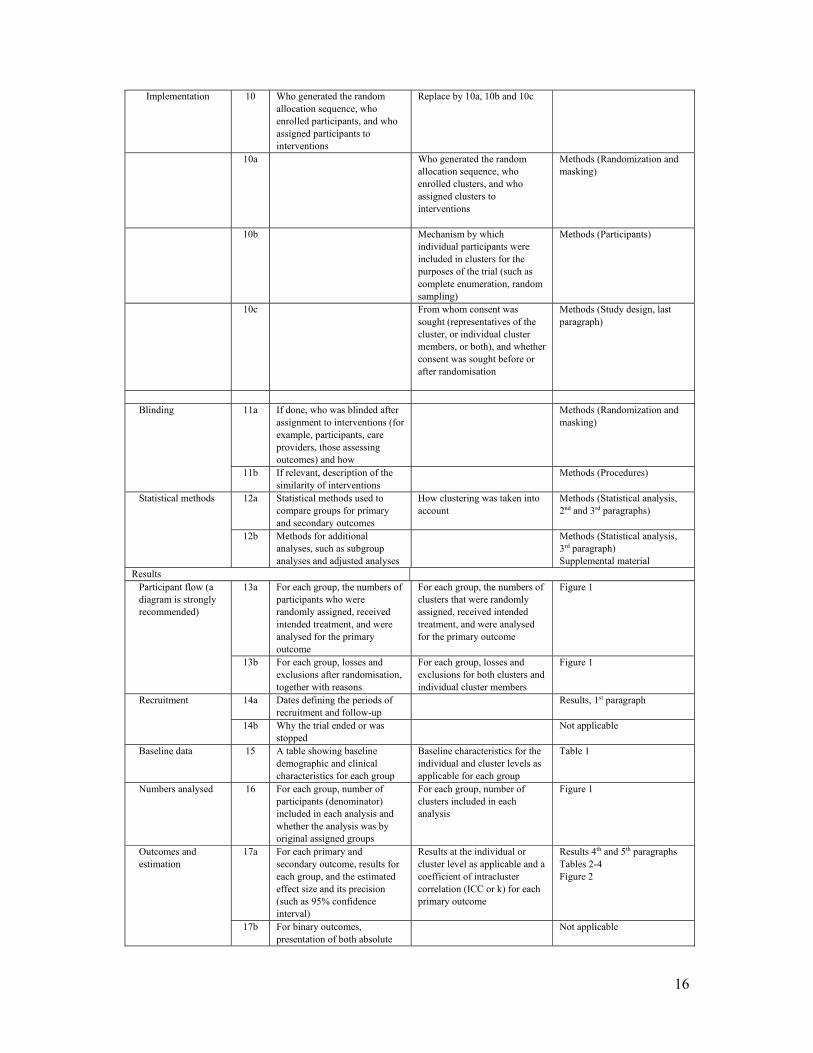
16
Implementation
10 Who generated the random allocation sequence, who enrolled participants, and who assigned participants to interventions
Replace by 10a, 10b and 10c
10a
Who generated the random allocation sequence, who enrolled clusters, and who assigned clusters to interventions
Methods (Randomization and masking)
10b
Mechanism by which individual participants were included in clusters for the purposes of the trial (such as complete enumeration, random sampling)
Methods (Participants)
10c
From whom consent was sought (representatives of the cluster, or individual cluster members, or both), and whether consent was sought before or after randomisation
Methods (Study design, last paragraph)
Blinding 11a If done, who was blinded after assignment to interventions (for example, participants, care providers, those assessing outcomes) and how
Methods (Randomization and masking)
11b If relevant, description of the similarity of interventions
Methods (Procedures)
Statistical methods 12a Statistical methods used to compare groups for primary and secondary outcomes
How clustering was taken into account
Methods (Statistical analysis, 2nd and 3rd paragraphs)
12b Methods for additional analyses, such as subgroup analyses and adjusted analyses
Methods (Statistical analysis, 3rd paragraph) Supplemental material
Results Participant flow (a diagram is strongly recommended)
13a For each group, the numbers of participants who were randomly assigned, received intended treatment, and were analysed for the primary outcome
For each group, the numbers of clusters that were randomly assigned, received intended treatment, and were analysed for the primary outcome
Figure 1
13b For each group, losses and exclusions after randomisation, together with reasons
For each group, losses and exclusions for both clusters and individual cluster members
Figure 1
Recruitment 14a Dates defining the periods of recruitment and follow-up
Results, 1st paragraph
14b Why the trial ended or was stopped
Not applicable
Baseline data 15 A table showing baseline demographic and clinical characteristics for each group
Baseline characteristics for the individual and cluster levels as applicable for each group
Table 1
Numbers analysed 16 For each group, number of participants (denominator) included in each analysis and whether the analysis was by original assigned groups
For each group, number of clusters included in each analysis
Figure 1
Outcomes and estimation
17a For each primary and secondary outcome, results for each group, and the estimated effect size and its precision (such as 95% confidence interval)
Results at the individual or cluster level as applicable and a coefficient of intracluster correlation (ICC or k) for each primary outcome
Results 4th and 5th paragraphs Tables 2-4 Figure 2
17b For binary outcomes, presentation of both absolute
Not applicable
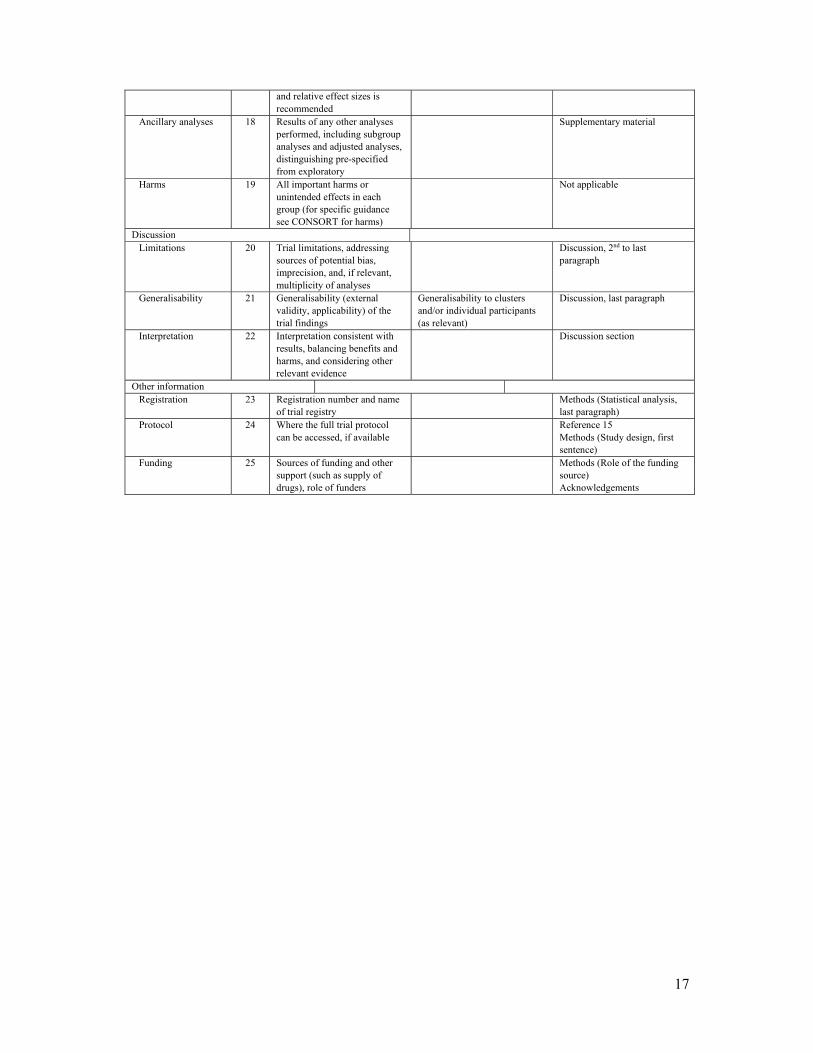
17
and relative effect sizes is recommended
Ancillary analyses 18 Results of any other analyses performed, including subgroup analyses and adjusted analyses, distinguishing pre-specified from exploratory
Supplementary material
Harms 19 All important harms or unintended effects in each group (for specific guidance see CONSORT for harms)
Not applicable
Discussion Limitations 20 Trial limitations, addressing
sources of potential bias, imprecision, and, if relevant, multiplicity of analyses
Discussion, 2nd to last paragraph
Generalisability 21 Generalisability (external validity, applicability) of the trial findings
Generalisability to clusters and/or individual participants (as relevant)
Discussion, last paragraph
Interpretation 22 Interpretation consistent with results, balancing benefits and harms, and considering other relevant evidence
Discussion section
Other information
Registration 23 Registration number and name
of trial registry
Methods (Statistical analysis, last paragraph)
Protocol 24 Where the full trial protocol can be accessed, if available
Reference 15 Methods (Study design, first sentence)
Funding 25 Sources of funding and other support (such as supply of drugs), role of funders
Methods (Role of the funding source) Acknowledgements