supplier enablement: connecting with suppliers to build lasting
TRANSCRIPT
Supplier Enablement Connecting with Suppliers to Build Lasting Relationships
May 2007

Supplier Enablement Page 2
© 2007 Aberdeen Group, Inc. www.aberdeen.com
Executive Summary upplier enablement continues to be one of the top three challenges for procurement professionals looking to transform their procurement organizations, gain better visibility into their supplier enablement processes and supplier relationships, and
increase spend under management. Despite the importance and potential benefits of enabling suppliers, many enterprises still experience large disconnects between the processes and technologies utilized around suppliers, their enablement, and the intelligence that can be gained to support business operations.
S
Best in Class Performance Best in Class enterprises demonstrate that supplier enablement can positively impact the business when the right technologies and practices are employed. Aberdeen used two key performance indicators (KPIs) to distinguish Best in Companies: percent (%) of suppliers enabled and percent (%) of spend under management. Best in Class organizations:
• Place 78% of spend under management, compared to 44% for all other peer enterprises
• Enable 50% of their suppliers versus 23% enabled by all others
• Realize transaction-processing costs 47% lower than all others as a result of enabling their suppliers
Competitive Assessment Survey results show that the firms enjoying Best in Class performance shared several common characteristics with respect to their supplier enablement strategies, such as:
• Best in Class enterprises are over 25% more likely to document and share (internally and externally) their supplier enablement practices than others
• Best in Class organizations are almost twice as likely to have full visibility into supplier enablement activities than others
• Best in Class companies have at least 50% more of their spend under management than their peers
Required Actions • Standardize processes which leverage leading technologies
(e.g., XML vs. EDI) and 3rd party services (e.g., supplier networks)
• Include suppliers in enablement process; leverage their experience and technologies to ensure collaborative and efficient interactions during enablement and through the lifetime of the relationship
Supplier enablement definitions An enabled supplier relationship includes one or all of the following capabilities: (1) business documents and communications are exchanged in an automated fashion (2) catalog content is easily managed online, if a catalog is available (3) supplier information is actively managed through anautomated or self-service process (including collection, verification, cleansing, and updating) Spend under management is defined as the spend associated with contractual terms that is processed through the procurement system.
Telephone: 617 723 7890 060407a

Supplier Enablement Page 4
© 2007 Aberdeen Group, Inc. Telephone: 617 723 7890 www.aberdeen.com 060407a
Table of Contents Executive Summary.............................................................................2
Best in Class Performance..................................................... 2 Competitive Assessment........................................................ 2 Required Actions.................................................................... 2
Chapter One: Benchmarking the Best in Class ...................................5 Top Drivers for Action: Cost Savings and B2B Enablement... 5 Maturity Class Framework ..................................................... 6 Best in Class PACE Model..................................................... 8
Chapter Two: Benchmarking Requirements for Success ..................11 Competitive Assessment...................................................... 12 Organizational Capabilities and Technology Enablers ......... 14
Chapter Three: Required Actions .....................................................16 Laggard Steps to Success ................................................... 16 Industry Norm Steps to Success.......................................... 16 Best in Class Steps to Success ........................................... 17
Appendix A: Research Methodology.................................................18 Appendix B: Related Aberdeen Research ........................................21
Figures Figure 1: Top Factors Driving Supplier Enablement ............................6 Figure 2: Average Requisition-to-Order Processing Costs ($US)........8 Figure 3: Current and Planned Actions around Supplier Enablement11
Tables Table 1: Supplier Enablement Performance Metrics ...........................7 Table 2: Average Cycle Times to Enable Suppliers.............................8 Table 3: Best-in-Class PACE Framework............................................9 Table 4: Competitive Framework .......................................................13 Table 5: PACE Framework ................................................................19 Table 6: Maturity Framework .............................................................19 Table 7: Relationship between PACE and Competitive Framework.20

Supplier Enablement Page 5
© 2007 Aberdeen Group, Inc. Telephone: 617 723 7890 www.aberdeen.com 060407a
Chapter One: Benchmarking the Best in Class
he disconnect between an enterprise and its suppliers can present a wealth of problems (and headaches) for any procurement division. Supply chain disruptions, insufficient or lack of appropriate supplier information, revenue leakage and
missed cost savings are genuine issues that are plaguing companies much too frequently. Organizations ultimately lack a high degree of visibility in to the interactions with suppliers, placing these supplier relationships at risk. Connecting suppliers to an enterprise’s supply chain, known as “enabling,” can help to ensure that companies meet customer demand by procuring materials at the right speed…for the right cost.
T Fast Facts • Nearly half of
respondents indicated that their top pressure for supplier enablement is to reduce procurement operating costs
• 47% of organizations indicated that their top strategy for supplier enablement is to utilize a supplier information management system., recognizing the need to better manage supplier information
Supplier enablement encompasses many different facets of the source-to-settle cycle, including:
• Automated collection and self-service provision of supplier information
• Supplier data cleansing and classification • Catalog content management, including third party hosting and
punch-out capability • Electronic communication about and processing of purchase
orders (POs), invoices, and payments • Strategic sourcing activities such as eRFx and online auctions
The majority of enterprises represented in our survey pool (53%) have indicated that supplier enablement is a high priority task for their respective procurement departments in 2007 Previous Aberdeen research discovered that although the number one and three challenges for CPOs may shift between people and spend, the number two challenge is always a constant - suppliers.
Top Drivers for Action: Cost Savings and B2B Enablement As shown in Figure 1, the major challenges driving enterprises to focus their resources on supplier enablement are reducing procurement operating costs (47%) and enabling business-to-business e-commerce with suppliers (39%).

Supplier Enablement Page 6
© 2007 Aberdeen Group, Inc. www.aberdeen.com
Figure 1: Top Factors Driving Supplier Enablement
16%
20%
25%
39%
47%
Reduce A/P operating costs
Increase negotiating leverage
Increase spend under management
Enable e-commerce with suppliers
Reduce procurement operating costs
Source: AberdeenGroup, May 2007
With improved electronic connections to the supply base, an enterprise can reap the advantages of reducing procurement operating costs by utilizing more automated processes instead of the manual systems. Effective supplier enablement also results in improved communication and improves the quality of supplier relationships, which keeps materials and services flowing without the increased fear of breaks in the supply chain.
While enterprises are focused on the financial impact of enabling suppliers and how increase the volume of automated/electronic transactions, it is clear that a critical component is the utilization of information. Nearly half (47%) of the participating organizations indicated that their top strategy for supplier enablement is to utilize a supplier information management system. They recognize the fact that unless they are able to not only collect supplier data (through automated or self-service methods), but also verify, cleanse and actively manage the information (including regular updates and internal distribution to as appropriate), then their supplier enablement strategies will not be as effective as planned.
Maturity Class Framework Top-performing enterprises manage their supplier relationships effectively by employing a wide range of technologies that address multiple facets of the supplier relationship. Aberdeen used two key performance metrics to distinguish between Best in Class companies from Industry Average and Laggard organizations. Table 1 summarizes the findings and defines Best in Class performance for our Supplier Enablement benchmark study.
“There’s been a pretty significant impact on our enterprise from using supplier enablement tools. We have an online database in which suppliers can register and through our supplier portal they have the ability to see the status of payments and view selected forecasts. We expect that all of our suppliers will be linked electronically within the next two years.” – Senior Director of Procurement, Large American Food Manufacturer
Telephone: 617 723 7890 060407a

Supplier Enablement Page 7
© 2007 Aberdeen Group, Inc. Telephone: 617 723 7890 www.aberdeen.com 060407a
Table 1: Supplier Enablement Performance Metrics
Definition of Maturity Class
Percent Suppliers Enabled
Percent Spend Under Management
Best in Class: Top 20% of aggregate performance scorers
50% 78%
Industry Average: Middle 50% of aggregate performance scorers
28% 50%
Laggard: Bottom 30% of aggregate performance scorers
10% 39%
Source: AberdeenGroup, May 2007
Best in Class enterprises clearly outperform other enterprises across key supplier enablement metrics. Most importantly, they enable five times more of their supply base compared to Laggard organizations, leading to distinct advantages in other areas of measurement for enablement. By enabling more of their suppliers, Best in Class companies are able to process more of the transactions in the procure-to-pay cycle electronically as opposed to using manual, paper-based methods. Electronic processing of POs, invoices, and payments occurs at least 30% more frequently in Best in Class organizations compared to all others, resulting in improved transaction processing cycle times and cost savings. A significant benefit of enabling more suppliers is to drive more spend under the management of procurement; Best in Class enterprises manage at least 1.5 times more of their spend through procurement than Average and Laggard enterprises. This leads to greater visibility into and increased ability to analyze and report on this spend, which subsequently allows an organization to leverage opportunities for spend aggregation and cost savings.
Table 2 below shows that Best in Class enterprises are significantly more efficient in enabling their supply base for electronic transaction processing. This has a direct impact to the business as Best in Class enterprises realize the benefits of supplier enablement sooner their peers.

Supplier Enablement Page 8
© 2007 Aberdeen Group, Inc. Telephone: 617 723 7890 www.aberdeen.com 060407a
Table 2: Average Cycle Times to Enable Suppliers
Best in Class (Days)
All Others (Days)
Enablement of electronic POs 18.7 27.9
Enablement electronic invoices 26.3 35.0
Source: AberdeenGroup, May 2007
Savings Opportunity In addition to improvements in cycle time for enablement and increasing the percentage of transactions conducted electronically, Best in Class enterprises also realize significantly lower transaction costs as a result of supplier enablement. Best in Class organizations are able to drive down their costs 71% lower than before supplier enablement strategies were deployed, while also realizing an average cost that is over 45% lower than their peers (Figure 2).
Figure 2: Average Requisition-to-Order Processing Costs ($US)
$27.85
$25.20
$13.80
Laggard
Average
BIC
Source: AberdeenGroup, May 2007
Best in Class PACE Model Best in Class supplier enablement consists of strong use of technology (online tools for collection of data, self-service entry of information, use of XML protocols for enriched communication, etc.) as well as engaging suppliers directly to improve the strategic relationship in order to gain increased visibility and control of supplier enablement activities. This is detailed in the PACE framework below (Table 3).

Supplier Enablement Page 9
© 2007 Aberdeen Group, Inc. Telephone: 617 723 7890 www.aberdeen.com 060407a
Table 3: Best-in-Class PACE Framework
Pressures Actions Capabilities Enablers • Enable e-
commerce with suppliers
• Collect, manage, and regularly update supplier information
• Measure organizational performance related to supplier enablement activities
• Outsource supplier enablement sub-processes to third party provider
• Cross functional coordination of supplier enablement activities across key department stakeholders
• Greater visibility into supplier enablement activities and ability to benchmark tasks
• Automated supplier communications with little or no paper
• Electronic updates of supplier information
• Document and share processes for supplier enablement
• Supplier information management systems
• Online survey tools to capture objective and subjective data
• Supplier networks and portals for self-service entry of information
• Automated spend data classification, enrichment, analysis, and reporting tools
• Management dashboards to provide overview of supplier enablement activities and metrics
• XML and other web-based protocols to enrich supplier communication
Source: AberdeenGroup, May 2007
Aberdeen Insights – Full A/P Automation
While enterprises still focus strongly on traditional supplier enablement activities – supplier information collection and management, catalog content management – increasing attention is being devoted to accounts payable functions. Best in Class companies are leading the charge into this area as 71% are currently investing in enablement technologies for processing of purchase orders electronically, occurring 13% more frequently than in other enterprises. Following closely is the automation of invoice and payment processing for these same leading organizations, enabled at rates 61% and 68% respectively. As a result, Best in Class companies have realized the greatest benefits of enabling suppliers for accounts payable activity as enablement cycle times are at least

Supplier Enablement Page 10
© 2007 Aberdeen Group, Inc. Telephone: 617 723 7890 www.aberdeen.com 060407a
Aberdeen Insights – Full A/P Automation
20% lower than those of other enterprises. Recent Aberdeen research also identified invoice processing cost savings of 74% to 89% for electronic instead of paper invoice transactions for all organizations.
Case Study: Accounts Payable Enablement
A global pharmaceutical company undertook an initiative to transition all of its suppliers for North American operations to electronic transactions by 2007. The challenge involved enabling over 2300 suppliers for two different organizational groups (procurement and accounts payable) operating two different systems. Utilizing an on-demand solution and off-shore enablement support, the enterprise was able to use the supplier enablement tools within 48 hours of project kick-off. Enablement results included:
• 350 suppliers enabled for e-invoicing within 12 weeks • 450 suppliers enabled for EFT within 8 weeks • Vendor master data for over 1500 suppliers was updated in
6 weeks
The technology solution selected provided integrated workflow, supplier self-service, and automated communications functionality for rapid deployment. Additionally, a layer of visibility was added through the use of online dashboards. Ultimately, over $400M of annualized PO-based transactions were enabled for electronic processing in under 3 months.

Supplier Enablement Page 11
© 2007 Aberdeen Group, Inc. Telephone: 617 723 7890 www.aberdeen.com 060407a
Chapter Two: Benchmarking Requirements for Success
he burden of managing suppliers is often eased, but not completely eradicated, with the utilization of technology. In the past decade, the responsibility of electronically-connecting suppliers to an enterprise was revolutionized by utilizing EDI (Electronic Data Interchange). Although the use of manual
methods, such as phone, fax and spreadsheets, remained prevalent in the majority of enterprises, EDI provided a way to enhance e-commerce and bring more dollars to the bottom-line.
T Fast Facts • Enterprises are planning
on using more advanced and varied technologies for supplier enablement; traditional options (EDI, phone/fax/email) are in a late lifecycle stage.
• Best in Class organizations are over 25% more likely to document and share supplier enablement processes internally and externally.
Seven years into a new century and companies still relying on EDI are faced with a major problem: EDI is losing its luster. As shown in Figure 3 below, although the majority of enterprises in our survey pool are relying heavily on manual methods and EDI (76% and 56%, respectively), there is a significant shift to the technology of a new millennium.
Figure 3: Current and Planned Actions around Supplier Enablement
14%
48%56%
76%67%
44% 43%
19%13%
39% 41% 41%
0%10%20%30%40%50%60%70%80%
Managementdashboard for
all supplierenablement
activity
XML and otherw eb-based
communicationprotocols
Suppliernetw ork/portal
Spend dataclassif ication,
enrichment andanalysis
EDI Phone, fax,email and
spreadsheets
CURRENTLY USE
PLAN TO USE
Source: AberdeenGroup, May 2007
Our 2006 Supplier Enablement study found that manual methods (phone/fax/email/spreadsheets) continued to rule. A year later, it isn’t surprising to see that these methods are still customary for enterprises. However, many companies are preparing for the switch to better, faster and more efficient technology, such as XML (44%), supplier networks/portals (43%) and spend analysis (41%). EDI, conversely, faces a difficult road for survival ahead: only 19% of enterprises plan to use this technology in the future.

Supplier Enablement Page 12
© 2007 Aberdeen Group, Inc. Telephone: 617 723 7890 www.aberdeen.com 060407a
The New Age of Supplier Enablement The progression of supplier enablement technology is allowing enterprises to electronically connect their suppliers in a more efficient manner. Slowly disappearing are the old days of VAN-based and Internet-based EDI; in the spotlight now are Web-based tools (XML) and supplier networks, two methods that are readily poised to replace EDI. XML, with its platform-independent structure and ability to store/manage/transfer data in a communicative manner, can assist enterprises in a quicker and more proficient way.
As we will see later in this chapter, Best in Class companies reinforce their top-performing status by implementing the right technology to effectively enable their supply base.
Case Study: Catalog Content Management
Chevron recently undertook an initiative to strengthen its supplier relationships by addressing its process for managing supplier catalogs. The project was driven by the need to gain visibility and reporting capability into catalog and content management activities, which were lost through the use of the an external service provider and homegrown tools. The goals of this supplier enablement initiative included:
• Automating the process from catalog submission to publication and use
• Gaining visibility into key metrics such as cycle time for catalog enablement
• Improving compliance and supplier coverage • Develop higher quality and more consistent catalog content
The organization deployed an on-demand technology solution to manage catalog content that included a dynamic workflow for the upload, review and approval of supplier catalogs. Additionally, the company was able to leverage its current e-procurement system to upload and make electronic catalogs available, adding further value to the enablement effort. The enterprise has enabled over 5300 catalogs and achieved reductions in suppler catalog enablement cycle times of over 33%. “We have dramatically improved our Supplier Enablement capability, standardized our process worldwide, lower our costs and improved overall customer satisfaction,” stated Scott Dunagan, Manager of Supplier Enablement for Chevron Procurement.
Competitive Assessment Survey respondents fell into one of three categories – Best in Class, Industry Average, or Laggard — the following table shows their characteristics in five major areas, (1) process (efficiency and effectiveness of processes); (2) organization (effective organizational

Supplier Enablement Page 13
© 2007 Aberdeen Group, Inc. Telephone: 617 723 7890 www.aberdeen.com 060407a
structure and organizational practices utilized to improve supplier enablement); (3) knowledge (accessibility and visibility of supplier data and information); (4) technology (appropriate tools and intelligent deployment of those tools); and (5) performance management (ability of the organization to measure the benefits of technology deployment and use the results to improve key processes further). Table 4 below shows some of the capabilities, organizational structure and processes these top-performing enterprises have in place.
Table 4: Competitive Framework
Laggard Average Best in Class Documented processes for supplier enablement that are shared
internally and externally Process 26% 35% 42%
Cross functional coordination of supplier enablement activities Organization
56% 60% 71%
Currently engaged in initiative to cleanse supplier information in master data files Knowledge
39% 52% 71%
Supplier enablement technologies currently in use
Technology
• 43% use spend data analysis, enrichment, and reporting tools
• 36% use XML and other web-based communication tools
• 31% use supplier networks or portals to enable suppliers
• 21% use online survey tools to capture objective & subjective data
• 24% use self-service collaboration tools
• 8% use executive dashboards to track enablement activities
• 53% use spend data analysis, enrichment, and reporting tools
• 40% use XML and other web-based communication tools
• 39% use supplier networks or portals to enable suppliers
• 25% use online survey tools to capture objective & subjective data
• 29% use self-service collaboration tools
• 13% use executive dashboards to track enablement activities
• 60% use spend data analysis, enrichment, and reporting tools
• 48% use XML and other web-based communication tools
• 46% use supplier networks or portals to enable suppliers
• 45% use online survey tools to capture objective & subjective data
• 39% use self-service collaboration tools
• 27% use executive dashboards to track enablement activities
Have visibility and measurement capability into all supplier enablement activities Performance
22% 25% 48%
Source: AberdeenGroup, May 2007
Supplier Enablement Page 14
© 2007 Aberdeen Group, Inc. Telephone: 617 723 7890 www.aberdeen.com 060407a
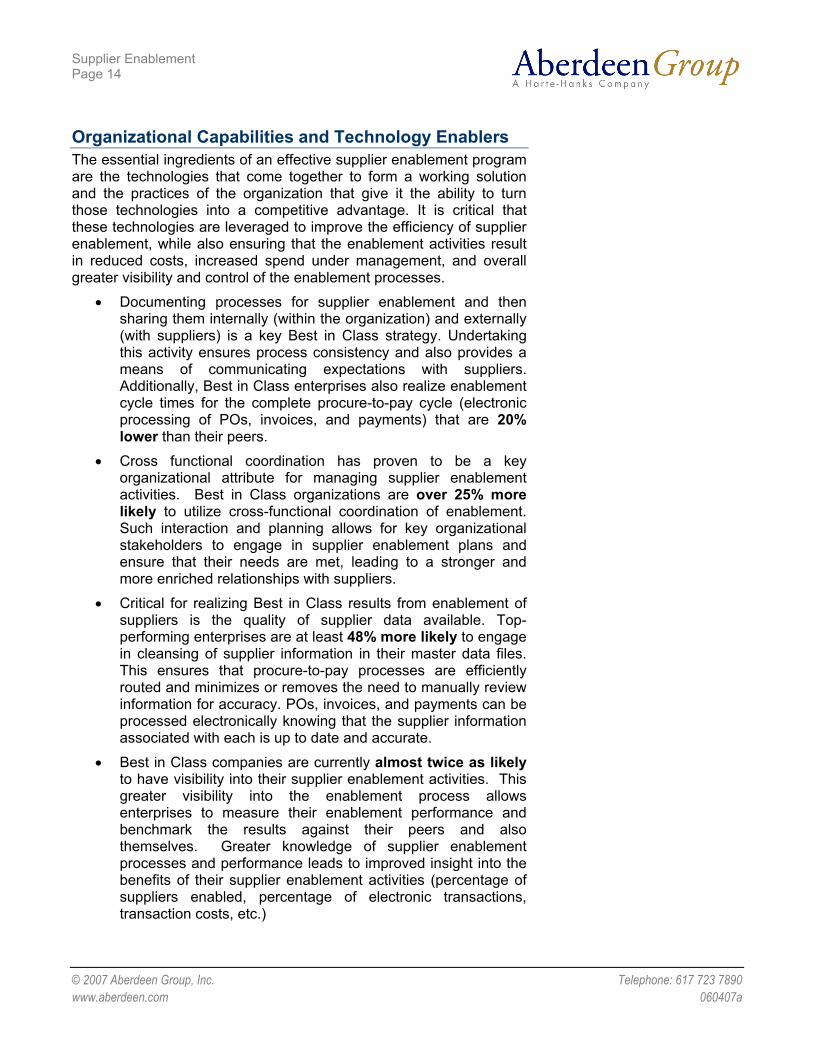
Organizational Capabilities and Technology Enablers The essential ingredients of an effective supplier enablement program are the technologies that come together to form a working solution and the practices of the organization that give it the ability to turn those technologies into a competitive advantage. It is critical that these technologies are leveraged to improve the efficiency of supplier enablement, while also ensuring that the enablement activities result in reduced costs, increased spend under management, and overall greater visibility and control of the enablement processes.
• Documenting processes for supplier enablement and then sharing them internally (within the organization) and externally (with suppliers) is a key Best in Class strategy. Undertaking this activity ensures process consistency and also provides a means of communicating expectations with suppliers. Additionally, Best in Class enterprises also realize enablement cycle times for the complete procure-to-pay cycle (electronic processing of POs, invoices, and payments) that are 20% lower than their peers.
• Cross functional coordination has proven to be a key organizational attribute for managing supplier enablement activities. Best in Class organizations are over 25% more likely to utilize cross-functional coordination of enablement. Such interaction and planning allows for key organizational stakeholders to engage in supplier enablement plans and ensure that their needs are met, leading to a stronger and more enriched relationships with suppliers.
• Critical for realizing Best in Class results from enablement of suppliers is the quality of supplier data available. Top-performing enterprises are at least 48% more likely to engage in cleansing of supplier information in their master data files. This ensures that procure-to-pay processes are efficiently routed and minimizes or removes the need to manually review information for accuracy. POs, invoices, and payments can be processed electronically knowing that the supplier information associated with each is up to date and accurate.
• Best in Class companies are currently almost twice as likely to have visibility into their supplier enablement activities. This greater visibility into the enablement process allows enterprises to measure their enablement performance and benchmark the results against their peers and also themselves. Greater knowledge of supplier enablement processes and performance leads to improved insight into the benefits of their supplier enablement activities (percentage of suppliers enabled, percentage of electronic transactions, transaction costs, etc.)

Supplier Enablement Page 15
© 2007 Aberdeen Group, Inc. Telephone: 617 723 7890 www.aberdeen.com 060407a
Aberdeen Insights –Supplier Networks
Our recent CPO’s Strategic Agenda and 2006 CPO Summit research discovered that 39% of CPOs cite supplier networks as one of their top investment priorities, reaffirming the fact that in order for the procurement function to perform at a high level, it needs effective communication with its suppliers. With much hoopla around new and improved technology as a means for initializing supplier enablement, an enterprise must realize the value of implementing a supplier network. Having one central outlet to handle POs, invoices, and catalog management allows an enterprise to quickly enable suppliers in their base, communicate in a helpful manner, and manage key business transactions with ease. Establishing a supplier network can send a company on the road to successful supplier enablement.

Chapter Three: Required Actions
hether a company is trying to move its performance in supplier enablement from “Laggard” to “Industry Average,” or “Industry Average” to “Best in Class,” the following actions will help spur the necessary performance
improvements:
WFast Facts • Standardize and
document enablement processes; share this information with internal stakeholders and suppliers
• Share supplier performance details gathered from enablement tools to allow suppliers to benchmark their performance and identify areas of improvement.
• Broaden the definition of supplier enablement to include invoice and payment-processing and activities that support strategic sourcing
Laggard Steps to Success 1. Standardize processes for supplier enablement.
Establishing a standard process for supplier enablement ensures that the process is repeatable and sustainable for future supplier relationships. Consistency of enablement procedures will allow enterprises to measure and benchmark the effectiveness of its enablement activities; Best in Class organizations are 27% more likely to document their enablement processes.
2. Share supplier performance details readily.
Allowing suppliers to gain visibility into how they are performing provides a benchmark for improvement. They will be able to see how they are performing against themselves and also against others within the supply base. Best in Class enterprises engage suppliers in strategic planning and share performance information 1.6 times more frequently than Laggard organizations.
3. Broaden the definition of supplier enablement.
It is critical that enterprises expand their view of supplier enablement in order to truly leverage the benefits of a fully-enabled relationship with its suppliers. Moving beyond catalog content management and PO exchange into invoice and payment transactions and strategic sourcing activities will generate operational efficiencies and transaction processing savings.
Industry Norm Steps to Success 1. Ignore EDI; use XML and internet-based tools to enable
suppliers.
EDI is slowly dying; it no longer meets all the needs of either procurement organizations or their suppliers. There are more robust technologies available to enable supplier relationships. XML and other web-based communication protocols allow enterprises to exchange information more readily and make the procure-to-pay process more efficient.
2. Leverage supplier experience.
Before jumping to conclusions or proposing a standard, talk to your suppliers. Involving suppliers in the enablement process ensures that the needs of both groups are met. Best in Class organizations follow this principle, engaging suppliers around strategic relationship issues versus tactical enablement concerns 10% more frequently than their peers. Suppliers should not be “enabled” unwillingly or unwittingly because they have technology standards that may be difficult to integrate to

Supplier Enablement Page 17
© 2007 Aberdeen Group, Inc. Telephone: 617 723 7890 www.aberdeen.com 060407a
the enablement tools selected. In fact, the technological capabilities of some suppliers far surpass that of most buying organizations.
3. Focus on self-service and automation of enablement activities.
Best in Class enterprises utilize online, self-service collaboration and survey tools for data collection over 40% more frequently than others. Self-service and automated supplier enablement strategies ensure supplier information is more quickly and accurately assimilated into master data files. Transaction processing from these suppliers becomes more efficient and less costly – manual updates and changes of supplier information are no longer required. However, self-service and automated solutions should not serve as a surrogate for personal interaction with suppliers. These strategies merely make the personal interactions more focused and effective.
Best in Class Steps to Success 1. Ignore the 80/20 rule for supplier enablement.
Enterprises often focus their enablement and relationship-building efforts on the 20% of suppliers that comprise 80% of their revenue. Yet, the remaining 80% of the supply base often constitutes the majority of problems related to supplier interactions. Best in Class companies enjoy significant advantages in transaction processing costs and enablement cycle times exactly because they address more of their supply base – 50% of the supply base for Best in Class organizations are enabled compared to only 23% for their peers.
2. Leverage incremental BPO strategies.
As definitions of supplier enablement broaden, the technology and services available also continue to develop and become more robust. Utilization of supplier networks as part of a BPO strategy is a leading priority for CPOs. Supplier networks provide a central system to manage POs and invoice-processing along with catalog content management, allowing enterprises to quickly enable suppliers, communicate in an effective manner, and manage key business transactions with ease.

Supplier Enablement Page 18
© 2007 Aberdeen Group, Inc. Telephone: 617 723 7890 www.aberdeen.com 060407a
Appendix A: Research Methodology
etween April and May 2007, Aberdeen Group examined the use of Contract Management, the experiences, and intentions of more than 200 enterprises in a diverse set of enterprises.
Responding procurement and finance executives completed an online survey that included questions designed to determine the following:
B• The strategies around supplier enablement and how their
business operations can be impacted.
• The structure and effectiveness of existing supplier enablement processes, organization and technologies.
• Performance metrics around supplier enablement and how other financial metrics are affected.
Aberdeen supplemented this online survey effort with telephone interviews with select survey respondents, gathering additional information on Supplier Enablement strategies, experiences, and results.
The study aimed to identify emerging best practices for Supplier Enablement and provide a framework by which readers could assess their own management capabilities.
Responding enterprises included the following:
• Job title: The majority of the research sample included respondents with the following job titles: C-Level executive (12%), Vice Presidents (9%), Director (25%), Manager (36%), Consultants and Other (18%)
• Job function: Procurement (53%), logistics and supply chain (17%), business process management (8%), finance (6%), sales and marketing (5%), other (11%)
• Industry: High technology (15%), health care/life sciences (15%), financial services (13%), CPG (9%), manufacturing (8%), retail (7%), transportation/logistics (7%), and then broadly distributed across 25 other industries
• Geography: The majority of respondents (63%) were from North America, Europe (20%), Asia-Pacific region (12%), and Other (5%)
• Company size: About 43% of respondents were from large enterprises (annual revenues above US$1 billion); 33% were from midsize enterprises (annual revenues between $50 million and $1 billion); and 23% of respondents were from small businesses (annual revenues of $50 million or less)
Solution providers recognized as sponsors of this report were solicited after the fact and had no substantive influence on the direction of the
Supplier Enablement Page 19
© 2007 Aberdeen Group, Inc. Telephone: 617 723 7890 www.aberdeen.com 060407a
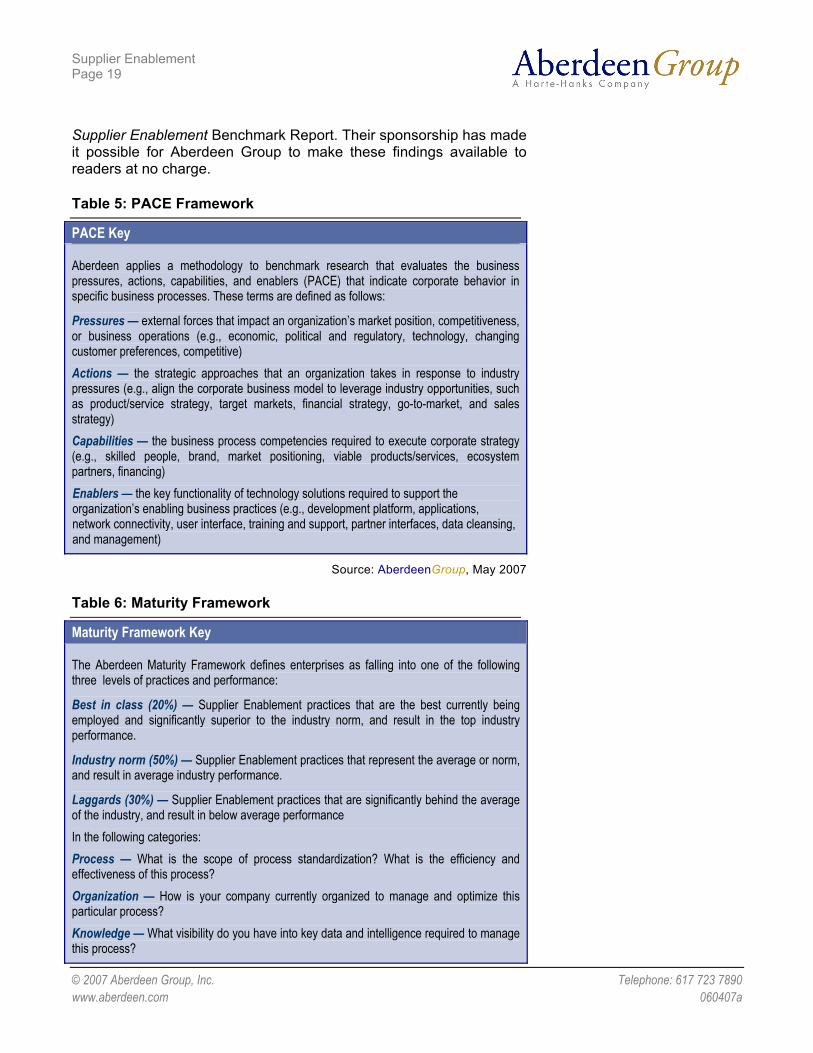
Supplier Enablement Benchmark Report. Their sponsorship has made it possible for Aberdeen Group to make these findings available to readers at no charge.
Table 5: PACE Framework
PACE Key
Aberdeen applies a methodology to benchmark research that evaluates the business pressures, actions, capabilities, and enablers (PACE) that indicate corporate behavior in specific business processes. These terms are defined as follows:
Pressures — external forces that impact an organization’s market position, competitiveness, or business operations (e.g., economic, political and regulatory, technology, changing customer preferences, competitive) Actions — the strategic approaches that an organization takes in response to industry pressures (e.g., align the corporate business model to leverage industry opportunities, such as product/service strategy, target markets, financial strategy, go-to-market, and sales strategy) Capabilities — the business process competencies required to execute corporate strategy (e.g., skilled people, brand, market positioning, viable products/services, ecosystem partners, financing) Enablers — the key functionality of technology solutions required to support the organization’s enabling business practices (e.g., development platform, applications, network connectivity, user interface, training and support, partner interfaces, data cleansing, and management)
Source: AberdeenGroup, May 2007
Table 6: Maturity Framework
Maturity Framework Key
The Aberdeen Maturity Framework defines enterprises as falling into one of the following three levels of practices and performance:
Best in class (20%) — Supplier Enablement practices that are the best currently being employed and significantly superior to the industry norm, and result in the top industry performance.
Industry norm (50%) — Supplier Enablement practices that represent the average or norm, and result in average industry performance.
Laggards (30%) — Supplier Enablement practices that are significantly behind the average of the industry, and result in below average performance In the following categories: Process — What is the scope of process standardization? What is the efficiency and effectiveness of this process? Organization — How is your company currently organized to manage and optimize this particular process? Knowledge — What visibility do you have into key data and intelligence required to manage this process?

Supplier Enablement Page 20
© 2007 Aberdeen Group, Inc. Telephone: 617 723 7890 www.aberdeen.com 060407a
Maturity Framework Key Technology — What level of automation have you used to support this process? How is this automation integrated and aligned? Performance — What do you measure? How frequently? What’s your actual performance?
Source: AberdeenGroup, May 2007
Table 7: Relationship between PACE and Competitive Framework
PACE and Competitive Framework How They Interact Aberdeen research indicates that companies that identify the most impactful pressures and take the most transformational and effective actions are most likely to achieve superior performance. The level of competitive performance that a company achieves is strongly determined by the PACE choices that they make and how well they execute.
Source: AberdeenGroup, May 2007

Supplier Enablement Page 21
© 2007 Aberdeen Group, Inc. Telephone: 617 723 7890 www.aberdeen.com 060407a
Appendix B: Related Aberdeen Research
Related Aberdeen research that forms a companion or reference to this report include:
• E-Payables: Advancing A/P Automation, March 2007
• The CPO’s Strategic Agenda: Managing Performance, Reporting the CFO, February 2007
• The CPO’s Strategic Agenda: Managing People, Managing Spend, November 2006
• The e-Procurement Benchmark Report, August, 2006
• The Supplier Enablement Benchmark Report, March 2006
Information on these and any other Aberdeen publications can be found at http://www.aberdeen.com/channel/procs.asp.
Aberdeen’s 2007 Global Supply Management Research Agenda is also available.
Subscribe to the Global Supply Management RSS FEED at: http://www.aberdeen.com/2-0/rss/procurement.xml
Authors: William Browning III, Research Analyst, Global Supply Management ([email protected]) Christopher Dwyer, Research Editor, Global Supply Management ([email protected]) Andrew Bartolini, Research Director, Global Supply Management ([email protected])
Founded in 1988, Aberdeen Group is the technology- driven research destination of choice for the global business executive. Aberdeen Group has over 100,000 research members in over 36 countries around the world that both participate in and direct the most comprehensive technology-driven value chain research in the market. Through its continued fact-based research, benchmarking, and actionable analysis, Aberdeen Group offers global business and technology executives a unique mix of actionable research, KPIs, tools, and services. This document is the result of research performed by Aberdeen Group. Aberdeen Group believes its findings are objective and represent the best analysis available at the time of publication. Unless otherwise noted, the entire contents of this publication are copyrighted by Aberdeen Group, Inc. and may not be reproduced, stored in a retrieval system, or transmitted in any form or by any means without prior written consent by Aberdeen Group, Inc.