supply chain management: a model for implementation for ...shura.shu.ac.uk/8557/1/sayed_phd.pdf ·...
TRANSCRIPT

Supply chain management: a model for implementation for SME's in Saudi Arabia
SYED, Mosa Saleh Al Haddad Al
Available from Sheffield Hallam University Research Archive (SHURA) at:
http://shura.shu.ac.uk/8557/
This document is the author deposited version. You are advised to consult the publisher's version if you wish to cite from it.
Published version
SYED, Mosa Saleh Al Haddad Al (2012). Supply chain management: a model for implementation for SME's in Saudi Arabia. Doctoral, Sheffield Hallam University.
Copyright and re-use policy
See http://shura.shu.ac.uk/information.html
Sheffield Hallam University Research Archivehttp://shura.shu.ac.uk

Supply Chain Management; A Model for Implementation
for SME's in Saudi Arabia
MOSA SALEH AL HADDAD AL SYED
A thesis submitted in partial fulfillment of Sheffield Hallam University
For the degree of Doctor of Philosophy
March, 2012

I
ACKNOWLEDGEMENTS
Life is full of challenges and the completion of this degree was one of those challenges
for me. I owe many thanks to my Director of Study, Professor Kadim AL Shaghana for
his valued and unlimited support on this journey, a process that was both rewarding and
enjoyable. His feedback and guidance was always timely, thoughtful and encouraging
and provided me with the opportunity to broaden my knowledge and to make significant
progress. The academic relationship developed into a close friendship.
I sincerely acknowledge Dr. Malih Shahidan my supervisor, for her advice and
enthusiasm throughout the completion of this thesis. The time spent by them and the
comments they rose greatly improved the final format of my work.
I am also very grateful to Liz Brearley for her administrative assistance during my
study. Liz was always of great help whenever it was required.
I would like to express my sincerest gratitude to my English family, Steve, Carol, Ed
and Joe. Thank you very much for accommodating me over this time. They welcomed
me into their home in which I did not feel a stranger or even an outsider.
I extend my special gratitude to my friends whose support of different kind cannot be
overlooked. Without their help, I would have really struggled in finishing my thesis.
Special thanks go to Dr. Ali AL Gadheeb, Dr. Mustafa AL Mindel, and Dr. Ahmed
Marghani for their unlimited, unconditional and valued support. They were all very kind
and supportive on various different occasions. There are more friends whom I also need
to thank but there are too many to mention individually.
My heartfelt gratitude goes to my family, my wife, my parents, and my brothers and
sisters. Their prayers, encouragement and patience were very important to my success. I
could not have achieved it without their love and support.
If I have missed mentioning anyone, I hope I will be forgiven.
Thank you all!!

II
ABSTRACT
With markets going global and competitions turning intense, Organizations are fast realizing the immense potential of a proactive Supply Chain Management (SCM) to improving their market positions in this cut-throat business environment. The research aims at developing a supply chain framework model that enables SMEs to improve their SCM performance and to have a sustainable business growth in dynamic environment. To fulfill the foremost aim, the following objectives have been set as follows. To fulfill the foremost aim, the following objectives have been set:
1. To contribute to the bod of knowledge to the both Supply Chain Management and Saudi Arabian SMEs manufacturing by reviewing pertinent literature of the same field. Knowledge in this study refers to as information, understanding and skills that one gain during research and education.
2. To investigate the current SCM practice of Saudi Arabia SMEs manufacturing sector by explorative approach, broad reliable and valid survey questionnaires distributed to 320 SMEs companies (Chapter 4).
3. To identify the gap within the current supply chain dimensions of SMEs against world class companies (Chapter 5) by statistical analyzing the survey questionnaires developed in chapter four.
4. To suggest appropriate methodological design using robust techniques that is to developed framework model (Chapter 6).
5. To develop qualitative assessment approach in the form of focus group to theoretically and practically validate and test the framework model ( Chapter 6).
6. To benchmark the developed model with different model in the same field. A sample of 150 of Saudi Arabia SMEs within the manufacturing sector was surveyed aimed at identifying the gap between SCM practices as adopted by the world class organizations and the actual practices adopted by SMEs under investigation. The research carried out using multiple research methods, i.e. quantitative and qualitative methods. This is mainly to gain multiple perspectives on the issue and filter out the real problem to be understood and worked upon. The framework model was developed based on literature review, other works in the same field, and the results of the field work study (survey) and the working experience of the researcher in the manufacturing sector for more than 20 years. The model was validated theoretically and practically with a predetermined selected manufacturing company. The significance of the research work could be best understood from the overall results which make important contributions to supply chain management system. The study is significant as it aids in better understanding of an issue which is of increasing importance to both the organizational practice and academic literature.

iii
Table of Contents
Page Title ………………………………………………………………………...1
Acknowledgements………………………………………………………………..i
Abstract…………………………………………………………………………...ii
Table of Contents………………………………………………………………...iii
List of Tables…………………………………………………………………….
List of Figures……………………………………………...………………………
CHAPTER ONE: INTRODUCTION………………………………………….1
1-1 Background…………………………………………………………………...1
1-2 Supply Chain Management Definitions..…………………….……………..2
2- Research Aim and Objectives………………………………………………….3
2-1 Research Aim……………………………………………...…………...….3
2-2 Research Objectives….………………………………...…………..……...3
3- Supply Chain Dimensions………………………………………………..……4
4- Small- Medium-sized Enterprise……………….………………………...5
4-1 Small and Medium Enterprises Definition……………………..6
4-2 Features of SMEs…………………………………………...………..……6
5 - Supply Chain Management and SMEs: What i s the l ink? . . . . .7
6- Research Methodology……………………..…………………………………8
7- Framework Model Rationale ………………………………………………...10
8- Thesis Outline………………………………………………………………...12
CHAPTER TWO: LITERATURE REVIEW ……………………………….15
2-1 Introduction…………………………………………………………………15
2-2 Supply Chain Definition………………………………………………….…15

iv
2-3 Supply Chain Dimensions…………………………………………..………19
2-3-1 Manufacturing Strategy ……….………………………………………….21
2-3-2 Supplier Partnership Strategy……………………………………….…….33
2-3-3 Customer Relationship Management………………………..……………52
2-3-4 The Value of Information Sharing in Supply Chain…….…………......…59
2-3-5 Logistics Strategy .….……………………………………………………73
2-3-6 Performance Measurement ………………… ……………………………89
2-4 SCM and SMEs: What is the link? ....……………….……………………97
2-5 Summary …………………………………………….……………………97
CHAPTER THREE: SAUDI ARABIA BACKGROUND AND MANUFACTURING SMEs SECTORS……....……………………………...90
3-1 Background /Geographical Factors…...………………………….……..…..90
3-2 Country Economy…………………………………………………………...92
3-3 Saudi Arabia Support for SMEs …………………….……………………...94
3-4 The Current State of Industry in Saudi Arabia………………...…….……..99
3-5 Eastern Province Industry ….………………………………...……………104
3-6 Small and Medium Enterprises…………………………..……..……106
3-6.1 Small and Medium Enterprises Definition….………………107
3-6.2 SMEs Characteristics…………………………………………...108
3-6.3 The contribution of SMEs Towards Economic Performance……….110
3 - 7 Why study on SMEs? . . . . . . . . . . . . . . . . . . . . . . . . . . . . . . . . . . . . . . . . . . . . . . . . . . . . 1 1 1
3-8 Saudi Arabia Corporative Culture ……………….…………………..….131
3-9 Summary………………..…………………………………………………119
CHAPTER FOUR: RESEARCH METHODOLOGY AND FIELDWORKS ……………………………………….………………120

v
4.1 Introduction……………………………..………………………………...120
4.2 Research Philosophy…………………………..…………………………...121
I- Positivism……………….……………………………………..……...…122
II- Interpretivism………………………………………………..…...………123
4.3 Research Approach…………………………………………………….…126
I- Quantitative Methods…………………………………..…………………126
II-Qualitative Methods………………………………………………………128
III- Combination of Methodology ………………………….………………133
4.4 Data Collection Methods …………………………………………………134
4.4-1 Quantitative Research Methods Data Collection……………………...134
I- Survey Research Methods ………………….…...………………………134
I-1 Characteristics of Survey Research Methods………………..............135
I-2 Advantages of Survey Research Methods …………………………135
I-3 Types of Survey Research Methods………………………………..135
I-4 Questionnaires…………………………... ………………………….136
I-5 Pre-Testing Surveys……………………...………………………...139
I-6 Cover Letter………………………………………………………...140
I-7 Reliability and Validity Assessment………………………………141
1- Reliability…………………………………………………………142
2- Validity…………………………………..……………………..…143
4.4-2 Qualitative Research Methods Data Collection…..…………………....143
I- Focus Group………...………………………………………................143
II-Methodology………………………………………………………..…146
III-Facilitation…………...…… ………………….…………...…………148
IV- Data Analysis ...…………… ………..…...….…………...…………149
V- Reporting.…...…………… ………………….…………...…………150
4.5 Summary ……………………… ………………….…………...…………150

vi
CHAPTER FIVE: FIELDWORKS DATA ANALYSIS………..… .152
5-0 Introduction…………………………………………………………….…152
5-1 Executive Data Summary………………………………………………….154
5-2 Sample Characteristics…………………………………………………….161
5-3 Responded Firms……………….………………………………………….161
5-4 Supply Chain Dimensions……………………..…………………………164
5-4-1 Manufacturing Strategy …………….……………………..…………..164
5-4-1-1 Quality……………………………………………………………...166
5-4-1-2 Total Supply Chain Cost…………………………………………...168
5-4-1-3 Delivery…………………………………………………………….170
5-4-2 Supplier Partnership Strategy……………………..……………………..172
5-4-2-1 Supplier Involvement Strategy…………………………..…………173
5-4-2-2 Supplier Base Reduction Strategy …………………………………175
5-4-3 Customer Relationship Dimension……………………………………...177
5-4-3-1 Customer Relationship Management ……………………………...180
5-4-3-2 Customer Supplier Relationship …. ………………………………182
5-4-4 Information Strategy in Supply Chain…………………………………183
5-4-4-1 Information Quality …………………………….…………………185
5-4-4-2 Information Sharing…………………………………..……………187
5-4-4-3 Usage of Information Technology …………………...……………189
5-4-5 Supply Chain Logistics…………………………………….…………192
5-4-6 Supply Chain Initiatives Data Analysis…………………...…………….194
5-4-7 Performance Measurement ………………………..…………….……196 5-4-7-1 Financial Performance Measure ………………............…………198
5-4-7-2 Operational Performance Measure ………………………………200
5-5 Summary………………………………………………………………202

vii
CHAPTER SIX: SUPPLY CHAIN FRAMEWORK MODEL
DEVELOPMENT AND IMPLEMENTATION……………………..….…204
6-1 Framework Model Development; An introduction ……………………204
6-2 Framework Model Definition………………………………………..…205
6-3 A Framework Model for improving SMEs Supply Chain Management 206
6-4 Framework Model Rationale …………………………….…………….208
6-5 Framework Model Components…………..…….………………………209
I- Framework Model Foundation……………………….…...……..…209
II- Framework Model Body; Supply Chain Management .....……...…216
III- Framework Model Roof; Competitiveness Advantages …...……...216
IV- Framework Model Boundary; Continuous Improvement……...…..217
6-6 Framework Model Assessment Methodology……………….…………222
6-7 Framework Model Validation and Implementation ……………………228
6-7-1 Framework Model Theoretical Validation ………………….........229
I- Introduction………………………………………………...……229 II- Validation and Testing Findings……………...…………………230
6-7-2 Framework Model Practical Validation and Testing…...……………..233
I- Introduction…………………………...…………………………233 II- Validation and Testing Findings………………...………………236
6-8 Summary …………………………………………………………………..254
CHAPTER SEVEN: CONCLUSION, LIMITATION AND FURTHER STUDY ……………………………………………………………………..…256
7-1 Conclusion…………………………………………………………..……..256
7-2 Contribution…………………………………………………………..……263
7-2-1 Contribution to Research……………….………………………………263

viii
7-2-2 Managerial Contribution…………………………..…………………..264
7-3 Limitations…………………………………………,,……………………266
7-4 Future Study…..…………………………………..………………………267
7-4 Summary……………………………...………………………………......269
REFERENCES…..…………………………………………………………..270
APPENDICES………...…………………………………………..…………293
Appendix A……………………………………………………………...……293
Appendix B……………………………………………………………...……294

ix
List of Tables
Table No. Table Description Page No.
CHAPTER TWOTable: 2-1 Supply Chain: Various Connotations 18Table: 2-2 Manufacturing Strategy contents 24Table: 2-3 Supplier Selection Criteria 38Table: 2-4 Classification of Production Information Model (PIM) 55Table: 2-5 Applications of internal IT and their benefits 64Table: 2-6 Applications of shared IT and their benefits 65Table: 2-7 Differences between Traditional and Non-Traditional
Performance Measure 84
CHAPTER THREE
Table: 3-1 Key Economic Data and Forecasts 92Table: 3-2 The developed industrial lands in the Kingdom 101Table: 3-3 The development of operating factories between
(1981- 2006) 103
Table: 3-4 The comparative industrial development for the last ten years
105
CHAPTER FOUR Table: 4-1 Schools of thought 140Table: 4-2 Strengths of Quantitative Methods 131Table: 4-3 Strengths of Qualitative Methods 132Table: 4-4 Focus Group Participant Demographics
147
CHAPTER FIVE Table: 5-1 The result of Crombach’s Alpha and CITC values 155Table: 5-2 Summary of the statistical descriptive analysis values 158Table: 5-3 Number of employees 162Table: 5-4 Position of company in the supply chain 162Table: 5-5 Primary type of industry 163Table: 5-6 Cronbach Alpha coefficient and CITC of Manufacturing
Strategy
165
Table: 5-7 Quality Dimension; Assessment Analysis 167Table: 5-8 Cronbach’s alpha coefficient and CITC of Total Supply
Chain Cost 169
Table: 5-9 Cronbach’s alpha coefficient and CITC of Delivery 170Table: 5-10 Crombach’s Alpha coefficient and CITC of supplier
relationship strategy 172
Table: 5-11 Crombach’s Alpha coefficient and CITC of supplier involvement Dimensions
174
Table: 5-12 Cronbach Alpha coefficient and CITC of supplier selection strategy
176
Table: 5-13 Cronbach Alpha coefficient and CITC of customer relationship practice
178
Table: 5-14 Cronbach’s Alpha coefficient and Corrected Item-to-Total 180

x
Correlation of customer relationship practiceTable: 5-15 Cronbach Alpha coefficient and CITC of information
strategy 182
Table: 5-16 Cronbach’s Alpha coefficient and CITC of Information quality practice
184
Table: 5-17 Cronbach’s Alpha coefficient and CITC of Information Sharing practice
185
Table: 5-18 Information Technologies 187Table: 5-19 Cronbach Alpha coefficient and CITC Supply Chain
Logistics Strategy 191
Table: 5-20 Supply Chain Initiatives 193Table: 5-21 Cronbach Alpha coefficient and CITC of Performance
measurement strategy197
Table: 5-22 Cronbach Alpha coefficient and CITC of Financial Performance measurements
198
Table: 5-23 Cronbach Alpha coefficient and CITC of Operational Performance measurement strategy
200
CHAPTER SIX
Table: 6-1 Scale Rating matrix 233Table: 6-2 Framework Model Questionnaire 234Table: 6-3 Number of People and days that the company spent in
promoting the safety awareness 243
Table: 6-4 the main sources of improvement and its frequency 247

xi
List of Figures
Figures Descriptions Page No.
CHAPTER ONE Fig: 1-1 Research Outline 14
CHAPTER TWO Fig: 2-1 Quality Control Tool 28Fig: 2-2 Logistic Integration 72Fig: 2-3 Supply Chain Operational Reference (SCOR) Model 86 CHAPTER THREE Fig: 3-1 Ten Years Population Growth from the year 2000 to 2010 91Fig: 3-2 The total export value for oil and non- oil products 93Fig: 3-3 Saudi Arabia Import 94
CHAPTER FOUR Fig: 4-1 The Research Process ‘Onion’. 121
CHAPTER FIVE Fig: 5-1 Number of Employees 161Fig: 5-2 The frequency of the primary type of industry 163Fig: 5-3 Manufacturing Strategy Importance 166Fig: 5-4 Quality Dimension Importance 168Fig: 5-5 The mean values of Supply Chain Total Cost 170Fig: 5-6 Deliver Strategy 171Fig: 5-7 Supplier Partnership Strategy 173Fig: 5-8 Supplier Involvement 174Fig: 5-9 Supplier Base Reduction 177Fig: 5-10 Customer Relationship Strategy 179Fig: 5-11 The Importance of Customer Relation Dimension 181Fig: 5-12 Customer Supplier Relationships 183 Fig: 5-13 Information Strategy Dimension 185Fig: 5-14 Information Quality Dimension 186Fig: 5-15 Information Sharing Dimension 188Fig: 5-16 IT Technology Applications 191Fig: 5-17 Supply Chain Logistics 194Fig: 5-18 Supply Chain Initiatives 195Fig: 5-19 Performance Measurements Strategy 197Fig: 5-20 Financial Performance Measurements Strategy 199Fig: 5-21 Operational Performance Measurements Strategy 201
CHAPTER SEVEN Fig: 6-1 Supply Chain Management House Framework Model 208Fig: 6-2 Continuous Improvement Process 218

xii
Fig: 6-3 “PDCA” cycle 219Fig: 6-4 Application feedback and continuous improvement model for
supplier selection in ASCs 221
Fig: 6-5 Self-Assessment Process Flow Chart 227Fig: 6-6 ISO 9000:2000 Standard Conceptual Model, Source: ISO 9000
Standard 244

1
CHAPTER ONE
INTRODUCTION
This chapter provides the research background by highlighting the importance of the supply chain management and its dimension, followed by the research aim and objectives. The chapter acquaints readers with importance of SMEs industry to the national economy. Subsequently, a glance at the research methodology is presented. Framework model rationale is given. Finally, an overview of the thesis structure is presented.
1-1 Background Effective Supply Chain Management (SCM) has become a potentially valuable way of
securing competitive advantage and improving organizational performance since
competition is no longer between organizations, but among supply chains. It has been
pointed out that understanding and practicing (SCM) has become an essential prerequisite
to staying in the competitive global race and to growing profitably (Power et al., 2001;
Moberg et al., 2002).
A Supply chain consists of all the stages that are required to satisfy the customer request. It
starts with the supplier and passes through the manufacturing, distribution, and retailing
and finally reaches the customer.
SCM is the oversight of materials, information, and finances as they move in a process
from supplier to manufacturer to wholesaler to retailer to consumer.
In the SCM there are mainly three flows. They are as follows:
Product flow: The movement of goods from a supplier to a customer, through the
manufacturer, distributor, and retailer.
Information flow: It involves transmitting orders and updating the status of delivery. The
information flow is useful for the success of the supply chain management.
Financial flow: It consists of credit terms, payment schedules, discount information and
consignment and title ownership arrangements.

2
In the SCM the product/ service flows towards the end customer. While the information
flows both the sides. And the financial flows towards the supplier, that means the customer
pays for the product or service receiving.
There are many benefits of SCM. The main two are as follows:
Achieving high level of customer satisfaction
Reducing cost, that means achieving the optimum life cycle cost. This
involves minimizing the wastage during reaching the customer.
In SCM an organization should concentrate on six major areas in order to achieve the twin
benefits of SCM. They are,
1. Supplier Relations Management (SRM)
2. Employee Relations Management (ERM)
3. Customer Relations Management (CRM)
4. Logistics Service Providers (LSP) Relations Management
5. Information Technology
6. Operation efficiency
1-2 Supply Chain Management Definition
The Term SCM has been used to explain the planning and control of materials and
information flows as well as the logistics activities not only internally within a company
but also externally between companies (Cooper et. al., 1997: Fisher, 1997).
Many authors provide their definitions on a supply chain Management. According to
Scott and Westbrook (1991), the term `supply chain' is used to refer to the chain linking
each element of the production and supply process from raw materials through to the
end customer.
From all definitions (Chapter 2), one can understand the objective of SCM. It is to achieve
operational excellence throughout the enterprise by maximizing revenue, minimizing
expenses and making full use of all the assets. The result is superior profitability, increased
market share and responsiveness to customer demand. SCM enables a comprehensive
integration of all business processes within and outside the enterprise that enables the

3
exchange of information and movement of goods, services and money. SCM is an
operational paradigm, which looks at a business as a chain of interconnected entities, thus
providing a see-through perspective of the entire business. It holds untapped sources of
competitive advantage for organization that need to get their products or services to the
market in competition from other organizations.
2- Research Aim and Objectives
2-1 Research Aim
The research aims at developing a framework model that enables SMEs to improve their SCM
performance and to have a sustainable business growth in dynamic environment.
2-2 Research Objectives
To fulfill the foremost aim, the following objectives have been set:
1. To contribute to the bod of knowledge to the both Supply Chain
Management and Saudi Arabian SMEs manufacturing by reviewing
pertinent literature of the same field. Knowledge in this study refers to as
information, understanding and skills that one gain during research and
education.
2. To investigate the current SCM practice of Saudi Arabia SMEs
manufacturing sector by explorative approach, broad reliable and valid
survey questionnaires distributed to 320 SMEs companies (Chapter 4).
3. To identify the gap within the current supply chain dimensions of SMEs
against world class companies (Chapter 5) by statistical analyzing the
survey questionnaires developed in chapter four.
4. To suggest appropriate methodological design using robust techniques that
is to developed framework model (Chapter 6).

4
5. To develop qualitative assessment approach in the form of focus group to
theoretically and practically validate and test the framework model (
Chapter 6)
6. To benchmark the developed model with different model in the same field.
3- Supply Chain Dimensions Supply chain dimensions are those dimensions which are mandatory to the success of any
organization, in the sense that, if objectives associated with the dimensions are not
achieved, the organization will fail. In the context of world class strategy, supply chain
management dimensions represent the essential component without which a strategy stands
little chance of success. SCM dimension is proposed to be a multi-dimensional concept,
and hence viewed as a more comprehensive concept than the narrower view (the supplier
side, the internal side or the customer side) taken in most prior research.
Dimensions that have contributed to the successful supply chain management have been
well researched over the years by different authors. Injazz and Antony (2004) reviewed
over 400 articles from the diverse disciplines which made their study may be the most
comprehensive analysis of the multidisciplinary, wide-ranging research on SCM. The result
is a set of reliable, valid, and uni-dimensional measurements that can be subsequently used
in different contexts to refine or extend conceptualization and measurements or to test
various theoretical models, paving the way for theory building in SCM.
All these researches have been made with main purpose which was to develop a reliable
and valid instrument.
It should be pointed out that even though the constructs used for this study capture the
major aspects of SCM dimensions, they cannot be considered complete. Other factors, such
as total quality management dimensions (Tan et al., 2002), internal integration (Pagell,
2004; Braganza, 2002), geographical proximity, cross-functional teams, agreed vision and

5
goals, and agreed supply chain leadership (Min and Mentzer, 2004) are also identified in
the literature. The author, for the purpose of this study focuses the research around the basic definition of
supply chain management. The definition of which looks to a focal company that extent its
one arm backward to its supplier and the second arm forward to its customer with two
different flows; material and information. Though other dimensions are of great interest,
they are not included due to the concerns regarding the length of the survey.
The supply chain dimensions of this study include dimensions related to manufacturing
strategy, supplier relationship dimension, customer relation management as foreword
relation management strategy. Material mobility, internally and externally forewords and
information flow backward of the chain, were also included. Supply chain initiatives were
extracted from literature and included in this study, to find out the future strategy toward
improving the organizations supply chain. Performance measurements including financial
and operational performance were included to assess the supply chain strategy of an
organization. These dimensions were the base for the literature review discussed in the
second chapter.
4- Small- Medium-sized Enterprise The Small-Medium-sized Enterprise (SME) sector is an important part of any national
economy (Storey, 1994). It contributes to economic growth, both regional and national. In
Europe, while industrial giants continue to slash jobs, high-growth SMEs are creating
thousands of new jobs in manufacturing and services (Flynn, 1998). They constitute a
large part of the economy in most countries, dominate the industrial and commercial
infrastructure and have significant roles in economic growth (OECD, 1996; Tetteh and
Burn, 1999; Curran and Blackburn, 2001). In developing countries, SMEs continue to play
a critical role in their country’s industrialization program through the strengthening of both
forward and backward industrial linkages.
They are not only providing job opportunities, but also, acting as suppliers of goods and
services to large organizations, and any lack of their product quality could adversely affect
the competitive ability of the larger organizations (Rose, 2000; Greenan et al., 1997;

6
Ghobadian and Gallear, 1996; Parkin and Parkin, 1996; Storey, 1994). In manufacturing
sector, SMEs act as specialist suppliers of components, parts, and sub-assemblies to larger
companies because the items can be produced at a cheaper cost than the large companies
could achieve in-house.
With dramatic change towards global market orientation and trade liberalization, most of
the business people realize the vital role of SMEs. The SMEs assume these roles by
complementing the activities of the large-scale industries through integration into the
mainstream industrial development.
4-1 Small and Medium Enterprises Definition At present, there seems to be no consensus on the definition for SMEs. Variations exist
among countries and industries. Storey (1994) argued that there is no single, distinct and
uniformly acceptable definition of a small firm. When reviewing the literatures you come
across an array of definitions (chapter 3). This is because employment, turnover and
capitalization vary among different industries. Additionally, any size definition that relates
standard measures of size at a particular activity level may be relatively small or large in
comparison to other industries. According to early critical contributions, SMEs must
satisfy criteria related to markets, ownership and control. Another perspective on defining
an SME attempts to identify those characteristics, other than size, which distinguish a
small enterprise from a larger one, which are: uncertainty, innovation and evolution
Wynarczyk et al (1993).
4-2 Features of SMEs Although there is neither a simple nor a single definition of an SME yet there are certain
features which are used to define them. The defining features of SMEs are the size of the
labor force and turnover, while assets and equity are also used as criteria. In general, SMEs
are defined by a number of factors and criteria such as location, size, age, structure, and
organization, number of employees, sales volume or worth of assets. However, in
dimension, most researchers and authors used both the quantitative and qualitative methods
to define SMEs. In terms of the quantitative criteria, the number of employees is the most
frequently used yardstick to determine the size of a SME in several countries (Hashim and
Wafa, 2002; Yusof, 2000; Anthony, 1983).

7
5- Supply Chain Management and SMEs: What i s the l ink?
The role of supply chain is widely recognized as being a critical determinant in the success
and survival of both manufacturing and service organizations in today’s competitive
environment, and thus, has focused attention on its effectiveness. In a number of
organizations, cost-effective supply chain is a matter of survival. The globalization of some
sources makes it essential that the professional dimension is improved and regarded as a key
element in the preparation of company or organization strategies (Quayle, 1998; Beamon,
1999).
In more recent years the importance of supply chain management to the smaller firms has
become a significantly recognized. They participate in value creating activities, especially for
larger firms. They supply raw materials, produce products, and distribute finished goods to
customers. Through their efforts, SMEs have significant impacts on supply chain processes
(Huin et al., 2002). SMEs are often suppliers of goods and services to larger organizations.
Increasingly, they have felt the impact of the quality programs imposed on them. The lack
of product quality from SMEs adversely affects the competitive ability of the larger
organizations. Because of this reason the larger companies have insisted that their small
suppliers adopt TQM of their own (Barrier, 1992; Ghobadian and Gallear, 1996).
Many studies found that supply chain could be used by SMEs with considerable success.
Studies by Spekman et al (1998) and Quayle (2003) found that the introduction of supply
chain has helped in reducing costs without compromising on customer satisfaction levels.
According to Alam, A. (1996), the perceived and realized benefits of SCM system consists
of tangible and intangible benefits. The tangible benefits of SCM implementation include
shortening the product development life cycle, increasing on-time order delivery, reducing
production costs, improving quality, reducing inventory, and bettering inventory
management. On the other hand, the intangible benefits include improving service quality,
faster response to customer needs, sharing and exchanging information, providing
information accurately, timely, and consistently. Tan et al. (1998) sought a relationship
between firms’ SCM dimension and their performance. They were able to show positive and
significant correlation between certain SCM dimensions and performances of their
respondent firms.
8
6- Research Methodology
There are many ways to approach an identified organizational phenomenon or problem.
The choice of methodology naturally relates to the paradigmatic view of the researcher, and
the research strategy naturally affects the results (Morgan 1983). In research methods
context, there are three main positions; qualitative, qualitative and a combined of both
(multiple approach). Each contains important differences which will influence the way in
which the researcher thinks about the research process.
In quantitative research methods, the science ( social or human ) problem is composed of
variables, measured with numbers, and analyzed with statistical procedures, in order to
determine whether the predictive generalizations of the theory hold true (Creswell, 2005). It
is appropriate where a researcher seeks to quantify relationships between variables of
interest, in order to formulate and test hypotheses derived from theories that may therefore
be either accepted or rejected on the basis of comparative and statistical analyses. In this
way, a quantitative approach is inclined to be deductive.
Quantitative methods focus on the strict quantification of observations (data) and on careful
control of empirical variables. Quantitative research often incorporates large scale sampling
and the use of statistical procedures to examine group means and variances
(Ponterotto&Grieger, 1999). Quantitative studies stress the measurement and analysis of
causal or correlation relationships between variables (Denzin& Lincoln, 2000).
In contrast, qualitative research methods were developed in the social sciences to enable
researchers to study social and cultural phenomenon. Miles &Huberman, (1994) define
qualitative methods as a set of data collection and analysis techniques that emphasize the
fine grained, the process oriented, and the experiential and that provide a means for
developing an understanding of complex phenomena from the perspectives of those who
are living it. Other scholars like Burns & Grove (1998) state that qualitative research
refers to inductive, holistic, subjective and process-oriented methods used to understand,
interpret, describe and develop theory on a phenomenon or a setting and is a systematic,
subjective approach used to describe life experiences and give them meaning.

9
Qualitative methods are most often used for theory building. In these cases, a phenomenon
exists that is poorly understood, so poorly that the relevant variables and linkages cannot be
specified a priori (Pamela, 2004). In these circumstances the researcher would immerse
herself in the phenomenon of interest, interviewing participants, observing activities within
the organization, and gathering archival information in an attempt to build a better
understanding.
While most often used for theory building purposes, qualitative methods can also be used to
test theory. For example, Barr et al. (1992) conducted a qualitative analysis of archival
documents from two companies to test their hypotheses about the relationship between
environmental change, management beliefs, and the timing of strategic change. Their
results did support their hypothesis that the organization in which management more
rapidly changed their understanding of the environment also was the first to change its
strategy.
Using qualitative research method in supply chain management provide the opportunity to
identify and explain complex relationships without having to pre-specify either the
variables involved, or the nature of the relationship between them. The research will
develop more understanding of the phenomena under investigation as he or she immersed
deeply in the problem thru using different data collection techniques available. Such
understanding will not be available thru using survey questioners.
Pamela (2004) stated that the unique benefit of qualitative methods is the ability to develop
detailed understandings and thick descriptions of the phenomenon of interest. Qualitative
data are rich and complex, often comprising hundreds of pages of interview transcripts,
field notes, and/or archival documents. The end result is a logically compelling analysis
that not only identifies and describes key constructs and/or explains the relationships
among them, but also contextualizes the findings (Strauss & Corbin, 1998).
In the real world, supply chain is a complex phenomenon that hardly to be solved with a
single methodology. Thus, multiple approaches are required in order to develop a holistic
understanding of supply chain management phenomena. It is only with multiple
perspectives that true picture of a problem could be visualized and understood.

10
Boyer and Swink (2008), argued that from a methodological standpoint, the right paradigm
is one which incorporates multiple, complementary methodologies, in order to triangulate
findings (Flynn et al., 1990) and to ensure that the weaknesses of any one methodology are
offset by the use of complementary methodologies (McGrath, 1982) within a specific area
of inquiry within any research field.
7- Framework Model Rationale Popper (1994) defines a framework as a set of basic fundamental principles, which can help
to promote discussions and actions. The authors have defined framework as a set of
simplified theoretical principles and practical guidelines for implementation and adoption,
which can enhance the chance of success that are easy to understand.
Frameworks portray through diagrams, flowcharts, and graphical or pictorial
representations (Yusof, 2000). A framework is used in research to outline possible courses
of action or to present a preferred approach to an idea or thought.
Struebing and Klaus (1997) believed a sound framework should define what the
organization does, what it is trying to do, how it is going to do it and ensure that each step
is done in the correct sequences.
To improve the SMEs supply chain capability in so dynamic market, a proposed framework
model that is believed to level up a company in a better position in the chain is suggested.
The illustration representation given in Figure 7-1 which considered the basis of this study
identifies the four major components of the Framework Model. These components are
closely inter-related. In many respects, this is a fairly generic framework model that may
apply across a number of business settings. A number of typical elements have been
identified within each of the four major components. These are the framework model
foundation, framework model body, the framework model house roof, and finally the
framework model boundary. The components of the framework model are now described
hereunder in detail.
First Component: The framework model house roof

11
Second Component: The framework model body
Third Component: The framework model foundation
Fourth Component: The framework model boundary
The rationale underlying this research framework model is straightforward. First, the
implementation of SCM dimension should be driven and facilitated by management
commitment. The management role behind the success or failure of any project initiative is
well documented in several studies.
The current dynamic business environment is characterized by high complexity and fiercer
competition mainly because of higher levels of manufacturing outsourcing, new
technologies, and shorter product life-cycles due to rapidly changing customer preferences.
All these and more factors often force companies to assume more ‘‘calculated risks’’, risks
that managers must accept in order to improve competitiveness, reduce costs and improve
profitability. However, the downside potential of the ‘‘calculated risks’’ could have adverse
consequences that jeopardize the whole supply chain’s ability to serve the final customers,
thus affecting firms’ long-term goal accomplishment (Svensson, 2002).
The business to be sustainable has to be measured. Normally, the business success is
measured by financial and operational performance. A higher level of SCM performance
will lead to an enhanced competitive advantage and further position an organization in
higher level of market lead.
Tompkins et al. (1998) have emphasized the importance of continuous improvement
processes within the value chain and subsequently coined the term “Supply Chain
Synthesis” (SCS). This is a continuous improvement process that ensures the satisfaction of
all players in the supply chain from original raw material providers to the finished product
consumer.

12
8- Thesis Outline In order to achieve the aforementioned objectives, the thesis is divided into seven chapters,
each representing a different stage of the research process. Chapter One: Introduction. This chapter highlights the importance of the study problem
and the methodology to attain the research results. Furthermore, it provides a brief
discussion of the aim and objectives purpose of this research. Finally, an overview of the
dissertation structure is provided.
Chapter Two: Literature Review. This chapter reviews the critical body of current
knowledge which is made up of the relevant studies and knowledge that address the subject
area. It aims to provide a comprehensive review of all the literature on the subject under
investigation. It is also identify, describes, evaluates, and summarizes the current body of
knowledge in the supply chain management dimension.
Chapter Three: Saudi Arabia Small and Medium Enterprises - This chapter reviews
the Saudi Arabia profile. Special focus on the country’s SMEs was given. Furthermore,
the link between supply chain management and SMEs enterprises is discussed in the last
part of this chapter. The discussion attains to show how SMEs benefit from adopting the
supply chain management system.
Chapter Four: Research Methodology and Fieldworks - In this chapter, the research
philosophy and fieldworks are discussed in details. Firstly, the author discusses different
research methodologies, approaches and tools are reviewed. The research quality aspects;
reliability and validity are also discussed.
Secondly, the researcher describes in detail the strategy of developing the questionnaires
design, sampling, survey administration, and piloting, amendment, developing the final
version of the survey questionnaires, distribution and data collection. In addition, the chapter
discusses the data analysis tool which used in this research.

13
Chapter Five: Data Analysis- This chapter is concerned with providing a comprehensive
analysis of the empirical data and presents the results of the study by describing the
descriptive findings. The chapter starts with giving a detail description of the sample
characteristics, followed by data quality assessments are also presented. The descriptive
findings of each construct and results interpretation are shown in detail.
Chapter Six: Framework model development and validation- The chapter aims to
develop a framework for supply chain system of Saudi Arabia –SMEs. The framework is
then validated and tested theoretically and practically, by developing a self-assessment
procedure to piloting the study in designated SME in Saudi Arabia, to see whether it works
or it doesn't and why.
Chapter Seven: Conclusion, Contribution, Limitation and Future Research. This
chapter presents the general conclusions from the existing body of research, and
implications of findings for managers and academic researchers. It further, addresses the
study limitation and what is to come in terms of the focus of future research.

14
Fig 1‐1Research Outline, Source: The author

15
CHAPTER TWO
LITERATURE REVIEW
This chapter reviews the critical body of current knowledge which is made up of the relevant studies and knowledge that address the subject area. It aims to provide a comprehensive review of all the literature on the subject under investigation. It also identifies, describes, evaluates, and summarizes the current body of knowledge in the supply chain management dimension.
2-1 Introduction
Increasingly global market, independent of size or industrial sector, is reliant on chains
sub-contracting to provide raw materials and facilitate in execution customer orders. The
success in such business environment will indeed increasingly be based on quality, cost,
delivery and service provided. Globally, increasing competition has caused the business
to be improved.
On the other hand, consumer pressures for lower prices and higher quality of service are
forcing the main supply chain players; suppliers, manufacturers and distributors to
achieve greater business effectiveness and efficiency. Making supply chain efficiency is
a key factor in gaining competitive advantage. As a result, both retailers and
manufacturers are increasingly looking across the supply chain, beyond their traditional
logistics boundaries, to form partnerships, with the aim of creating a seamless flow of
goods and information from raw materials supplier to the end customer.
It is well recognized that adoption of supply chain management principle is one
approach which has been demonstrated to provide success business competitiveness. It
is making an increasing positive impact in world industry.
16
2-2 Supply Chain Definition The key ideas and concepts proposed by different authors on SCM are given with a
view to understand the main questions and problems. The term Supply Chain
Management was originally introduced by consultant in the early 1980s (Oliver and
Webber1992) and has subsequently gained tremendous attention (La Londe, 1998),
analytically, a typical supply chain as shown in figure. (1) a network of materials,
information and services processing links with the characteristics of supply,
transformation and demand.
The term SCM has been used to explain the planning and control of materials and
information flows as well as the logistics activities not only internally with in a
company but also externally between companies.(I.J Chen, Paulraj 2004).
Many authors provide their definitions on a supply chain Management. According to
Scott and Westbrook (1991), the term `supply chain' is used to refer to the chain
linking each element of the production and supply process from raw materials
through to the end customer. Typically such a chain will cross several organizational
boundaries. It consists of flows of materials and product through various production
and distribution processes in one direction and flows of information to provide
control mechanisms, mostly in the other direction. The definition emphasizes on the
supply processes and the activities involved.
A supply chain can also be viewed as a system. Towill (1992) outline a supply chain
as a system, the constituent parts of which include material suppliers, production
facilities, distribution services and customers linked together via the feed forward
flow of materials and the feedback flow of information.
Supply chain management could be understood as Network. Christopher (1992) defines
a supply chain as the network of organizations that are involved, through upstream
and downstream linkages, in the different processes and activities that produce value
in the form of products and services in the hands of the ultimate consumer. Lee and

17
Billington (1993) define a supply chain as a network of facilities that performs the
functions of procurement of material, transformation of material to intermediate and
finished products, and distribution of finished products to customers. Scholar like
Davis (1993) looks at a supply chain simply as a network of material processing
cells with the following characteristics: supply, transformation, and demand.
The meaning of `network' is made explicit by Axelsson and Easton (1992) who
define a network as `a model or metaphor which describes a number, usually a large
number, of entities, which are connected. In the case of industrial as opposed to, say,
social, communication or electrical networks, the entities are actors involved in the
economic exchanges which are themselves conducted within the framework of an
enduring relationship. The existence of such relationships is the raison deter for
industrial networks. They provide the stability, and hence structure, which makes the
network proper.
The above definitions have formed a basis for defining the term of `supply chain' by
later authors and this view is also supported by Handfield and Nichols (1999) who
state that `Supply chains are essentially a series of linked suppliers and customers;
every customer is in turn a supplier to the next downstream organization until a
finished product reaches the ultimate end user.'
“The supply chain encompasses all activities associated with the transformation of
goods from the raw-material stage to the final stage, when the goods and services reach
the end customer.” (Janat shah, 1999)
The operating responsibility of SCM is the geographical positioning of raw materials,
work in progress, and finished inventories where required at the lowest cost possible. It
is through the logistical process that materials flow in to the vast manufacturing capacity
of an industrial nation and products are distributed through marketing channels to
consumers.

Source: (R.P Mohanty, S.G. Deshmukh, P 2009)
From all definitions above shown in Table (2-1), it could be understood the objective of
SCM. It is to achieve operational excellence throughout the enterprise by maximizing
revenue, minimizing expenses and making full use of all the assets. The result is
superior profitability, increased market share and responsiveness to customer demand.
SCM enables a comprehensive integration of all business processes within and outside
the enterprise that enables the exchange of information and movement of goods,
services and money. SCM is an operational paradigm, which looks at a business as a
chain of interconnected entities, thus providing a see-through perspective of the entire

19
business. It holds untapped sources of competitive advantage for organization that need
to get their products or services to the market in competition from other organizations.
(Mohanty, and Deshmukh, 2009)
2-3 Supply Chain Dimensions The role of supply chain is widely recognized as being a critical determinant in the
success and survival of both manufacturing and service organizations in today’s
competitive environment, and thus, has focused attention on its effectiveness. In a
number of organizations, cost-effective supply chain is a matter of survival. The
globalization of some sources makes it essential that the professional dimension is
improved and regarded as a key element in the preparation of company or organization
strategies (Quayle, 1998; Beamon, 1999).
Supply chain is also seen as a source of competitive advantage (Karen,2010; Douglas
and Judge, 2001), innovation change (Singh and Smith, 2004), and new organizational
culture (Irani et al., 2004). Any decline in customer satisfaction due to poor service
quality would be a serious cause of organizational failure.
SCM is a philosophy and presents a business system that companies should adopt to
achieve organizational excellence. There is a perception that large organizations have
traditionally led the way in the implementation of modern management; the smaller ones
always being followers and have lagged behind. Literatures survey showed that the
majority of SMEs addressed supply chain issues partially and informally.
In more recent years the importance of supply chain management to the smaller firm has
become a significantly recognized. They participate in value creating activities, especially
for larger firms. They supply raw materials, produce products, and distribute finished
goods to customers. Through their efforts, SMEs have significant impacts on supply
chain processes (Huin et al., 2002). SMEs are often suppliers of goods and services to
larger organizations. Increasingly, they have felt the impact of the quality programs
imposed on them. The lack of product quality from SMEs adversely affects the

20
competitive ability of the larger organizations. Because of this reason, the larger
companies have insisted that their small suppliers adopt TQM of their own (Barrier,
1992; Ghobadian and Gallear, 1996).
Supply chain dimensions are those dimensions which are mandatory to the success of
any organization, in the sense that, if objectives associated with the dimensions are not
achieved, the organization will fail. In the context of world class strategy, supply chain
management dimensions represent the essential component without which a strategy
stands little chance of success. SCM dimension is proposed to be a multi-dimensional
concept, and hence viewed as a more comprehensive concept than the narrower view
(the supplier side, the internal side or the customer side) taken in most prior research.
Supply chain dimensions have been well researched over the years by different authors
(Veera et. al., 2011). However, much of the current theoretical/ empirical research in
SCM dimensions focuses on only the upstream or downstream side of the supply chain,
or certain aspects/perspectives of SCM (Shah et. al., 2002).Topics such as supplier
selection, supplier involvement, and manufacturing performance (Choi & Hartley, 1996;
Vonderembse & Tracey, 1999), the influence of supplier alliances on the organization
(Stuart, 1997), success factors in strategic supplier alliances (Monczka, Morgan, 1997;
Narasimhan, Jayaram, 1998), supplier management orientation and supplier/buyer
performance (Shin et. al., 2000), the role of relationships with suppliers in improving
supplier responsiveness(Handfield, and Bechtel, 2002), and the antecedence and
consequences of buyer–supplier relationship (Chen, and Paulraj, 2004), have been
researched on the supplier side. Studies such as those by Korpela (Korpela, et al.,2001), Kisperska (Kisperska et al.,
2010), and Alvarado and Kotzab (Alvarado and Kotzab, 2001), focus on the
downstream linkages between manufacturers and retailers. Also, much of the current
empirical research focuses on certain aspect of the internal supply chain, such as total
quality management dimensions (Tan et al., 2002), internal integration (Pagell, 2004),
agile/lean manufacturing ( McIvor, 2001), and postponement (Naylor et al., 1999).

21
Injazz and Antony (2004) reviewed over 400 articles from the diverse disciplines which
made their study may be the most comprehensive analysis of the multidisciplinary,
wide-ranging research on SCM. The result is a set of reliable, valid, and uni-dimensional
measurements that can be subsequently used in different contexts to refine or extend
conceptualization and measurements or to test various theoretical models, paving the
way for theory building in SCM.
In the following section the researcher will deeply study and discuss the main
components of supply chain dimensions which believed to be a must in any supply chain
structure. The discussion starts with manufacturing strategy followed by supplier
partnership strategy, customer relation strategy, and information sharing in supply chain,
logistics, and supply chain performance measurement. Theses component or dimensions
will also be the base for survey questioners as presented in chapter five.
2-3-1 Manufacturing Strategy Many firms in the supply chain are involved in manufacturing products. Whereas almost
all business firms are engaged in procurement and market distribution operations
manufacturers add value by converting raw materials into consumer or industries
products. They create value by producing and marketing product service bundles to
either end customers or intermediate members of the supply chain. For example retailers
purchase a wide range of product from varied manufacturers to create an appealing
assortment for consumers. This section reviews Manufacturing Strategies (MS) as
important part of supply chain management. The objective is to identify its role and
content.
Many definitions have been given for manufacturing strategy. According to Skinner (1969),
manufacturing strategy refers to exploiting certain properties of the manufacturing function
as a competitive weapon. Swami dass and Newell (1987) agreed with the previous
definition and defined manufacturing strategy as a tool for effective use of manufacturing
strength as a competitive weapon for achievement of business and corporate goals. These
definitions looked at MS as a tool to achieve a company strategy. While, Hayes and
22
Wheelwright (1985) have defined manufacturing strategy as a consistent pattern of decision
making in the manufacturing function which is linked to the business strategy. Hill (1987)
stated that MS represents a coordinated approach, which strives to achieve consistency
between functional capabilities and policies for success in the marketplace. Cox and
Blackstone (1998) defined MS as "a collective pattern of decisions that acts upon the
formulation and deployment of manufacturing resources. These definitions provide new
understanding for MS. It coordinates different functions for strategy achieving.
I- The Role of Manufacturing Strategy
Manufacturing strategy can be vitally important in two ways. First, it can be reactive –
but central – to the implementation of an already devised business strategy. This
implementation would be seen in key areas such as quality, manufacturing processes,
investment requirements, skills audits, capacity requirements, inventory management
throughout the supply chain and new product innovation. In this concept,
manufacturing’s role is important in providing “strategic fit” (Hayes and Pisano, 1996;
Johnson and Scholes, 1993) in focusing efforts and resources (Platts, 1993) so that
manufacturing strategy is consistent with, and helps to support, the already devised
business strategy (Miller and Roth, 1994).
Second, manufacturing strategy can be seen as proactive whereby manufacturing is one
of a number of core capabilities/competencies which can be exploited and used to create
new opportunities and to target new market (Hayes, 1985). In this approach,
manufacturing’s contribution would be central to the planning stages of business
strategy (Mills et al., 1995). Such an approach equates with stage four of Hayes and
Wheelwright’s (1984) model whereby manufacturing’s role is central in creating
strategies to gain competitive advantage. As Hayes and Pisano (1996) conclude, this
approach has profound effect on the link between manufacturing and business strategies.

23
II- Manufacturing Strategy Content
While there may be distinction in the literature between corporate strategy, business
strategy and functional strategy the three are not mutually exclusive and will link in the
implementation of a particular strategy (Mills et. al., 1995). The phrase “manufacturing
strategy” remains noticeable by its absence in mainstream literature on “strategy”
(Brown, 1996). The possibility that there might be a manufacturing strategy comes, for
some companies, as a surprise (Clark and Hayes, 1988; Hayes and Wheelwright, 1984).
In manufacturing literature, the actual explicit term “manufacturing strategy” is
relatively new although it can be traced back to Skinner (1969). The term has been used
in manufacturing literature since (Hill, 1995; Samson, 1991; Skinner, 1985) and since
the 1980s the term “manufacturing strategy” has become increasingly common.
In many manufacturing strategy literature, cost, quality, dependability and flexibility
have been found the most representative of the competitive dimensions of
manufacturing. A number of studies have been conducted to identify or categorize
manufacturing strategy content. Stobaugh and Telesio (1983) derived three groups
empirically: cost, technology and market-driven strategies. Similar work has been
conducted by Miller and Roth (1994), who have developed taxonomy of manufacturing
strategies.
Fine and Hax (1985) examined four principal content issues – cost, quality, delivery,
and flexibility. Meyer and Ferdows (1987) used principal component analysis to identify
eight dimensions of manufacturing strategy including quality, flexibility, product-
process adjustments, and the role of the workforce. These dimensions correspond to
specific content issues.
One of the best-formulated approaches is that of Hill (1993). He argues that in each
market in which the company operates it should identify those criteria that win orders
against the competition. His order-winning criteria include price, delivery, quality,
product design and variety. Similar sets of criteria or priorities have been developed by
most writers in manufacturing strategy.

24
Platts and Gregory (1992) in their manufacturing strategy audit, look at the market
requirements: delivery lead-time, reliability, features, quality, and flexibility of design,
volume and price. Garvin (1993) in proposing strategic manufacturing initiative (SMI)
decomposed five strategic priorities namely; cost, quality, delivery, flexibility, and
service into thirty six items. His list is considered one of the most comprehensive lists in
literature.
A listing of the content issues addressed by different study appears in Table 2-2
Table 2-2 Manufacturing Strategy contents

25
Source: Elliott D. et al., (1994)
The following is the study of the main manufacturing strategy content ; cost, quality,
delivery and flexibility.

26
1- Cost Total Manufacturing Cost (TMC) is considered a vital element of manufacturing strategy. It
consists of design/ procurement /production/, inventory/ warehousing, and transportation. All of
the above costs are impacted by manufacturing strategy. As such, TMC represents the
foundation for formulating a market distribution strategy.
Total cost of manufacturing primarily determines the cost competitiveness of products.
As such, a firm tries to reduce manufacturing costs. To do so, the cost processes
involved in producing a product are to be well calculated. Design is the prime factor in
determining what the product costs will be with anything between 70 and 80 per cent of
product cost being determined at the design stage Mills (1991). Similarly, product cost
is also dependent on the level of product complexity, with Hagel (1988) considering cost
to be a direct exponential function of complexity.
The manufacturing cost and procurement declines as quantity increases, reflecting
economy of scale associated with make-to-plan (MTP). Inventory and warehousing
costs increase, reflecting the impact of larger manufacturing lot sizes. Transportation
cost per unit decreases as a result of shipment consolidation. In contrast, Make-To-Order
(MTO) strategies reflect high per unit manufacturing and procurement costs which are,
in part, offset by lower inventory and warehousing costs. In the MTO strategy,
transportation cost per unit is higher, reflecting small shipment and/or premium
transportation. The TMC results from functional integration of manufacturing,
procurement, and logistics. From a perspective of integrated management it is important
for manufacturing firms to design a supply chain strategy that achieves lowest total cost
of manufacturing across the entire process.
27
2- Quality It is well recognize that quality is essential for success in both large and small
manufacturing and service organizations alike. Quality is always being a major
consideration for manufacturing strategy. Failing such consideration, the business will
flounder and time spent planning, devising and articulating a particular strategy will be
futile. In addition, the success of the implementation of a particular strategy will depend,
to a large extent, on the capability of the plant in quality.
Product quality is one of the most important factors for a manufacturing firm to be
successful in the world market. It is argued that a quality image, once obtained, can
improve a firm’s ability to compete, as well as its long-term opportunity for success
(Pfau, 1989). DuBrin (1995) stated that business strategy development must place a high
priority on product quality, which is a crucial hinge for business success or failure in
today’s quality performance- oriented markets. Therefore, product quality has become a
major business strategy (Feigenbaum, 1991).
The strategic importance of quality is highlighted by the fact that quality is one of the
major distinguishing features in manufacturing performance between the West and
Japan between 1970 and 1990 (Womack et. al., 1990). The Japanese distinguished their
products not only by the cost but also by their low incidence of defects, their reliability,
and their durability. The weapons that Japanese used to beat the West products were
quality, cycle time, and flexibility.
It has been well recognized that, for SMEs to survive and succeed in very intensive
market competition, they should consider quality as one of the main block in their
business strategy (Switzer, 2002; Opasanont, 2000). Quality is, therefore, as important
as low-cost and innovation strategies (Hay, 1996), as a business strategy to win in an
aggressive market situation against a number of global competitors.
Benjamasuthin et. al., (2001), in his study concluded that most exporting Thai
manufacturing SMEs preferred to use a quality rather than a price strategy. This

28
showed a positive attitude by Thai manufacturing SMEs which were mostly
interested in quality and tended to implement quality concept as their strategy rather than
reduce price. The report on a survey by Lascelles and Dale (1990), carried out on
seventy four U.K. executives concluded that more than 85% of leading CEOs in Europe
considered the management of product quality to be one of the top priorities for their
organization. The quality revolution had brought pressure to bear on developing and
under developed countries too. Ahire et. al. (1996) suggested that improving product
quality be the prime objective of a firm’s quality management efforts, and product
quality be used as a primary indicator of the firm’s quality efforts.
The quality models are accompanied with well proven quality tools. These are many
quality tools that are used to improve product quality. These tools like; Pareto Chart,
Cause and Effect, Histogram, Flow Chart, Check Sheet, Scatter Plot, Statistical Process
Control, allow us to provide this essential direction and they are shown in Figure 2-1.
In summary, it is important to realize that services and products will only be required as
long as they meet the customer's demands. The only other sure thing is that tomorrow's
demands will be higher than those of yesterday and that, rather than being a 'winner',
excellence will only be a ticket to the game.
Fig: 2-1: Quality Control Tools Source: (David Simchi Levi et al., 2000)

29
3- Delivery Today more than ever—with the globalization delivering raw material, spare parts or
finished product on time within the supply chain is critical for suppliers, plants and
dealers. Order-to-delivery (OTD) time is something to be watched very closely to meet
each market’s specific demands.
In today’s competitive business environment, customers require dependable on-time
delivery from their suppliers. In the short term, delivery deviations – the earliness and
lateness from the targeted delivery date - must be analyzed, as both early and late
deliveries are disruptive to supply chains. Early and late deliveries introduce waste in
the form of excess cost into the supply chain; early deliveries contribute to excess
inventory holding costs, while late deliveries may contribute to production stoppages
costs and loss of goodwill. Burt (1989) notes that reductions in early deliveries reduced
inventory holding costs at Hewlett-Packard by $9 million. In the automotive industry
Saturn Levies fines of $500 per minute against suppliers who cause production line
stoppages (Frame, 1992). Chrysler fines suppliers $32,000 per hour when an order is
late (Russell and Taylor, 1998). When delivery is made on time, however, the costs
incurred by the supplier are considered to be “normal costs” and no penalty cost is
incurred.
On time delivery is an important part of a supply chain case. That is because it directly
impacts customers’ satisfaction; hence, measuring and improving delivery is always
desirable to increase competitiveness.
Recent empirical research has identified delivery performance as a key management
concern among supply chain practitioners (Lockamy and McCormack, 2004; Vachon
and Klassen, 2002; Verma and Pullman, 1998). Gunasekaran et. al., (2001) presented a
conceptual framework for defining delivery performance in supply chain management.
Within the structure, delivery performance is classified as a strategic level supply chain
performance measure.

30
Short delivery lead times can be an important marketing factor, with any reduction in
the delivery time increasing sales. Thus attention is often focused on reducing the
manufacturing lead time either through the use of advanced manufacturing technology
(AMT) or by Japanese approaches (JIT). Yet the overall delivery lead time can also be
reduced by a compression of the pre-manufacturing activities.
There are many factors that might affect the delivery performance of a company.
Complexity of a product, manufacturing technology, logistic capability, and information
technology affect product delivery. To protect against untimely deliveries, supply chain
managers often inflate inventory and production flow time buffers. Correcting untimely
deliveries in this fashion represents a reactive management style that may introduce
additional sources of variance into the supply chain, and further contribute to the
bullwhip effect. In the long run, delivery performance is an important component in the
overall continuous improvement of supply chain operations.
4- Flexibility
As competition intensified so did the uncertain business environment. For supply chain
to be effective and manage their business risk, it should consider manufacturing
flexibility within their strategy. Flexibility in supply chains is the possibility to respond
to short term changes in demand or supply situations of other external disruptions
together with the adjustment to strategic and structural shifts in the environment of the
supply chain. Flexibility thus combines agility and adaptability (Lee, 2004).
Slack (1991) concluded in his study the importance of flexibility for the supply chain
performance. Flexibility in supply chains may well represent a potential source to
improve the company's efficiency and may be a significant measure of supply chain
performance (Vickery et. al., 1999). Efficient supply chain flexibility can increase the
organization’s ability to adapt to the changes in its business environment. The
adaptation of the “many suppliers” dimension could increase flexibility generating
alternative sourcing for procurement by reducing supply chain risks. Building long-term
partnership relations with suppliers and customers also helps to improve the flexibility
of the supply chain by creating a mutual understanding among the members (Chang et.

31
al., 2005). Holding safety stock and sub-contracting could dampen down supply and
demand chains uncertainties through delivering from inventory and/or purchasing sub-
contracted resources. Outsourcing and 3PL are two of the frequently used SCM
dimensions by firms to provide flexibility to internal capacity to ring fence their
resources for the core activities.
Supply chain flexibility is defined to encompass those flexibility dimensions that
directly impact a firm's customers and are the shared responsibility of two or more
functions along the supply chain, whether internal (marketing, manufacturing) or
external (suppliers, channel members) to the firm. There are very few studies on supply
chain flexibility and there are even fewer studies about the relationship between supply
chain flexibility and firm performance, which offers a research opportunity (Dangayach
and Deshmukh, 2001).
2-3-2 Supplier Partnership Strategy Strategic supplier partnership is defined as “the long term relationship between the
organization and its suppliers. It is designed to leverage the strategic and operational
capabilities of individual participating organizations to help them achieve significant
ongoing benefits” (Li et. al., 2006; Eamonn et. al., 2010). Strategic partnerships between
organizations promote shared benefits and ongoing collaboration in key strategic areas
like technology, products, and markets (Yoshino and Rangan, 1995). For instance,
Taiwan Semiconductor Manufacturing Company (TSMC), the world's largest
semiconductor foundry, gives suppliers and customers proprietary tools, data, and
models so they can execute design and engineering changes quickly and accurately.
Porter (1980) suggested that co-operation can enable partners to achieve a stronger
position together than they can alone. Metzger et. al. (2001) suggests that the key to
effective management in the global environment is to have closer relationships with
suppliers. The purpose of strategic partnerships is to enable and enhance coordination
between partners in operations, R & D, product launching, and the like. (Fulconis and
Pache, 2005)

32
I- Success Factors of Supplier Partnership Strategy The success of supplier partnership strategy depends on some of the following six
factors:
a) Trust in partnership Strategy b) Commitment in partnership strategy c) Supplier selection. d) Supplier involvement e) Supplier evaluation, and f) Supplier-based reduction strategy
All these factors are discussed in detail hereunder;
a)- Trust in Partnership Strategy
In the new era of business corporate environment, companies are required to be
responsible not only for their own performance but also for all their partners in the
supply chain (Sarkis, 2001). Trust is often emphasized as the most important issue for
managing long-term relationships and cooperation, between parties (Min and Mentzer,
2000). Trust exists when one party has confidence in partner’s reliability and integrity in
a collaborative exchange (Zineldin and Jonsson, 2000).
The development of trust-based internal and external relationships is an important
source of competitive advantage for the successful supply chain strategy (Huff & Kelly,
2003; Shockley-Zalabak, Ellis, &Winograd, 2000). This is especially true for companies
operating in the global market because of increased risks and uncertainties, and
differences in culture, values, goals, policies, and dimensions of partners in the supply
chain (Huff & Kelly, 2003). Accordingly, trust is defined as the willingness of a partner
(the one who trusts) to be vulnerable to the actions of the other (the trustee) based on the
expectation that the trustee will not act in a harmful way towards his business partner
(Mayer et. al., 1995). Another source defines trust as “a willingness to rely on an
exchange partner in whom one has confidence” (Moorman et. al., 1993). Anderson and
Narus (1990) also focus on the perceived outcomes of trust when defining trust as "...
the firm’s belief that another company will perform actions that will result to positive
outcomes for the firm as well as to not take unexpected actions that will result to

33
negative outcomes".
For Moorman et. al., (1993), trust does exist if this expectation is associated with a
behavioral intention. Also, a minimum level of risk or uncertainty is necessary to trust.
Without it, there is no need to develop trust. Trust is a non-contractible attribute of a
relationship. Barney and Hansen (1994) have argued that trust can be a source of
competitive advantage for firms. Buyers will be reluctant to replace trusted suppliers,
given that trust-building occurs over a period of time and involves substantial costs.
b)- Commitment in Partnership Strategy
Researchers have been claiming that competitive success would depend on collaborative
supply chain (Christopher, and Ryals, 1999; Harps, and Hansen, 2000). The key for
effective supply chain collaborative breakthroughs is to establish strong managerial
commitment (Akkermans, et al., 1999; Lummus, et al., 1998). Morgan, and Hunt (1994)
argued that “… when both commitment and trust – not just one or the other – present,
they produce outcomes that promote efficiency, productivity and effectiveness”.
Commitment provides a foundation for the development of effective supply chain
integration. Commitment must come from all levels of the organization as well as from
key channel “partners.” Top management, all the way to the CEO, must endorse SCM
initiatives and provide the necessary resources (Marien, 2000; Stalk et al., 1992).
Supply chain partners must also exercise their role in sharing commitment between
channels. Therefore, it is needless to say, any enduring business transactions among
supply chain partners require commitment by two parties in order to achieve their
common supply chain goals. Without commitment, business relationship and subsequent
transactions become fragile and vulnerable. Accordingly, enduring commitment is a
basic requirement for successful supply chain implementation.
The concept of commitment is defined as a desire to maintain a relationship (Moorman,
et al., 1992; Morgan and Hunt 1994). Sometimes it is conceptualized as a “pledge of
continuity” from one party to another (Dwyer, et. al., 1987). This definition considers
commitment as cornerstone to all the relational exchanges between the firm and its

34
various patterns.
Drawing on previous studies it was argued that SCM commitment was found to be one
of the most influential factors on business process SCM integration (Wann et al., 2004).
Marketing scholars have identified customers' commitment as a central relationship
survival (Garbarino and Johnson 1999; Gundlach, et al., 1995) and performance (Kumar
et al., 1994; Noordewier et al., 1990). The fundamental principles upon which
relationship marketing is based are mutual value creation, trust, and commitment.
Commitment encourages the channel partner firms to resist apparently attractive short-
term alternatives in favor of the expected long-term benefits of staying with existing
partners (Anderson et al., 1994; Morgan and Hunt, 1994) and to achieve high levels of
customer satisfaction through collaboration of the parties involved (Payne et al., 1995).
Commitment and trust are a "key" because they encourage marketers to (1) work at
preserving relationship investments by cooperating with exchange partners, (2) resist
attractive short-term alternatives in favor of the expected long-term benefits of staying
with existing partners, and (3) view potentially high-risk actions as being prudent
because of the belief that their partners will not act opportunistically. Therefore, when
both trust and commitment are present, they produce outcomes that promote efficiency,
productivity, and effectiveness. In short, commitment and trust lead directly to
cooperative behaviors that are conducive to relationship marketing success.
Commitment is an important goal for channel and relationship managers (Dwyer et al.,
1987). It is essential to developing and maintaining successful relational exchange
(Gundlach, et al., 1995). For example, manufacturers require commitment from
distributors and retailers in order to carry out coordinated marketing programs
(Goodman, and Dion, 2001). More generally, commitment enhances the efficiency and
effectiveness of marketing relationships (Morgan & Hunt, 1994). Commitment increases
the efficiency of exchange relationships by establishing relational norms that include
flexibility and solidarity (Gundlach, & Murphy, 1993). Commitment enhances
effectiveness because the parties can maximize their returns over a series of transactions

35
(Mohr & Spekman, 1994). Commitment is of critical importance in organizational
buying behavior and can lead to important outcomes such as decreased customer
turnover (Porter et al., 1974) and higher motivation (Farrell and Rusbult, 1981).
Empirical research indicates that commitment predicts willingness to cooperate,
propensity to leave, and acquiescence and compliance (Morgan & Hunt, 1994). It is
clear that commitment is an important construct both theoretically and for practicing
managers.
Affective commitment expresses the extent to which customers like to maintain their
relationship with their supplier. Affective commitment is based on a general positive
feeling towards the exchange partner (Konovsky, Cropanzan, 1991). Calculative
commitment, a negatively oriented type of motivation, refers to a firm’s motivation to
continue the relationship because it cannot easily replace its current partner and because
it cannot obtain the same resources and outcomes outside.
Whereas, Fawcett et. al., (2006) have identified four types of commitment which are
vital to SCM implementation: top management commitment, broad-based functional
support, channel support, and a commitment to infrastructural development and
governance.
c)- Supplier Selection
Strategic sourcing has a key role to play in supply chain competitiveness. It is a core
process in the larger function of supply chain management. Strategic sourcing is a
disciplined approach that improves the value the firm receives from the suppliers. There
are four principles that set apart strategic sourcing from traditional tactical purchasing:
1- Define the total value of the relationship between the purchaser and suppliers,
2- Develop solution based on deep understanding of the supplier's economics and
business dynamics,
3- Use differentiated purchasing tactics in order to optimize the economic
relationship for both purchaser and suppliers
4- Implement the required changes in the organization so the purchaser achieves
not only a near-term measurable performance improvement but also the ability to

36
continuously improve.
In the strategic procurement project, the cross function team is a pre-requisite and
implementation is a four step process detailed as follows:
1- Research the industry
2- Evaluate the suppliers capabilities
3- Structure the relationship with suppliers
4- Develop action plan to build required infrastructure
The growing intensity of market competition forces organizations to focus on supply
chain management to cope with highly increasing competition. One strategy for
effective supply chain is to reduce the vertical range of manufacture and concentrate
exclusively on the core capabilities. At the same time, the reduction of the
manufacturing depth leads to an increase of the proportion of purchased parts and
consequently increases the dependency on suppliers (Marons and Bruckner, 1998).
Therefore, the success of a company is determined to a greater degree by the abilities of
its supplier’s selection. Suppliers have to be selected carefully, as they can have a very
positive or a very adverse impact on the overall performance of the organization.
The importance of supplier selection has been stressed in the literature. Some previous
reviews of the subject have been presented by Weber et al. (1991) and De Boer et al.,
(2001). Ellram (1990) categorized supplier selection research into two different
schemes: descriptive, which describing an actual dimension, or prescriptive, which is
modelling how suppliers should be selected given with a set of selection criteria.
Vonderembse et al., (1999) investigated the extent to which supplier selection criteria
and supplier involvement are used by manufacturers. The study provides support for the
claim that firms employing these dimensions have enhanced supplier and manufacturing
performance. De Boer et al. (2001) studied the supplier selection literature in a more
comprehensive manner. They extended previous reviews by classifying the existing
literature in a framework. This framework recognized several decision-making steps in
the supplier selection process prior to the ultimate choice step. In addition, De Boer et

37
al. (2001) framework classified the supplier selection literature according to different
purchasing situations such as first-time buys, modified re-buys, and straight re-buys.
A research work by Chin-Chun et. al., (2006) suggests that a number of themes emerge
from prior literature, which evolved primarily from the purchasing and supply
management domain. Much of the early work that focuses on the purchase environment
to take a transactional approach to study the underlying criteria used to select suppliers
in different purchase situations (Ellram, 1990; Swift, 1995).
The second theme focuses on the strategic issues and examines the strategic implications
of supplier selection. The advent of supply chain management as a business paradigm
has fundamentally reshaped the role of supplier selection. Manufacturing firms are
shifting away from vertical integration toward developing smaller, leaner organizations
that focus on exploiting core competencies (Prahalad and Hamel, 1990). This has led to
companies reducing the size of their supplier bases so they can more effectively manage
relationships with, and more efficiently leverage capabilities and technologies of
strategic suppliers (Tully, 1995). It has also led to traditional adversarial buyer-supplier
relationships being gradually replaced with mutually beneficial partnership
relationships; particularly with strategically important suppliers who can positively
affect buyer's competencies (Copacino 1996; Mason, 1996).The third, more recent
stream of research focuses on the performance issues and examines the impact of
supplier selection on measures of the buying firm's performance. Of particular
significance is the fact that not only does supplier selection impact both manufacturing
and business performance, more commonly used criteria such as cost and quality may
have less impact on performance than intangible criteria (Kannan et al., 2002). The
extensive list of supplier selection research makes it a daunting task to summarize the
findings of the literature. Chin-Chun et. al., (2006) provided a summary of the previous
research and their findings.
To build more effective relationship with suppliers, organizations are using supplier
selection criteria to strengthen the selection process. It is indicated that the supplier
selection criteria is changing with the new challenge to select suppliers who can add
long term value to the manufacturer (Lemke et al., 2000).

38
Relying on a single criterion makes the supplier selection process risky. Therefore, a
multi-criteria approach is recommended. Dickson (1966), in his seminal work, identified
50 factors which represented characteristics of vendor performance. His empirical
investigation later reduced the total criteria to 23.Weber et al. (1991) reviewed and
classified 74 articles that have appeared in the literature since 1966 in terms of the
particular criteria mentioned in each article, the purchasing environment, and the
decision techniques used to select the best suppliers. In 1991, Weber et al. (1991)
reprioritized the 23 criteria identified by Dickson based on 74 articles that have
appeared in the literature since 1966 (see Table2-3).
Table: 2-3 Supplier Selection Criteria

Source: Dickson (1966) and Weber et al. (1991)
With the growing trend for longer-term collaborative relationships, a new set of supplier
selection criteria began to evolve which consisted not only some of the traditional
factors used in previous studies, but also criteria which are longer term and more

40
subjective in nature. Ellram (1987) identified a number of issues as important in
selecting suppliers with which to establish partnership relations. A review of these
factors indicated under the category technology issues, the supplier’s design capabilities
is mentioned, but more from an overall qualitative impression rather than providing
specific variables to consider.
The selection of suppliers is critical for several reasons. First, the trend toward “Just- in-
Time” manufacturing dimensions has resulted in a supply base reduction (Pearson and
Ellram, 1995). Second, the result is due to resource scarcity. There is a need for greater
interaction between the buyer and supplier. Third, many firms involve their suppliers
early in the planning process so that they are able to deliver superior value to their
customers (Trent and Monczka, 1998). In order to release products quickly, supplier
selection occurs at the front end of the program, long before the specifications are laid
out. P. Humphreys et al., (2007) listed a number of reasons for this trend, including
rising global competition, more rapid technical change and the need for the faster
development of products with higher quality and reliability. It is virtually impossible for
any firm to possess all the technical expertise needed to develop a complex product.
Effective supplier selection enables manufacturers to achieve the four dimensions of
customer satisfaction: competitive pricing, product quality, product variety, and delivery
service (Morgan, 1996; Poirier, 1999). Empirical research has shown that manufacturing
companies that enrich their capacity to satisfy their customers in respect to any of these
four dimensions enhance their level of overall business performance (Tracey, 1998;
Tracey et. al., 2000). Therefore, it is possible that effective selection and evaluation of
suppliers and promoting their involvement in critical supplier chain activities will result
to improve firm performance via enhanced customer satisfaction.
d)- Supplier Involvement
Numerous scholars have argued that buyers can benefit from involving suppliers in the
development process rather than working independently when it comes to market timing
of new products, product quality, development cost, and product cost (Handfield, et.
al.,1999). In practice, supplier involvement includes a wide range of collaboration

41
activities such as Just-In-Time (JIT), delivery, quality improvement, new product
design, green purchasing and so on (Krause, 1997). Empirical evidence, however, has
provided mixed supports for the proposed positive effects of supplier involvement in
product development. Research in the late 1980s initially confirmed positive effects of
supplier involvement (Clark, 1989).
The focus of most researches, prior to the 1990s, was on supplier development,
selection, and certification. Later to that date, it was found out that a large body of
literature focusing on supplier-buyer collaboration, mostly in terms of supplier-buyer
relationships (Veloso and Fixon, 2001), trust in supplier relations (Sako and Helper,
1998), contractual aspects (Cox, 1996), organizational learning (Kogut and Zander,
1992) and collaboration between manufacturers and their suppliers in the development
of new parts or end products (Bozdogan et al., 1998). Supplier involvement and ESI
(Early Supplier Involvement) is an emerging and important research area both for the
research community and practitioners (Takeishi 2001). Empirical research (Narasimhan,
2000) provides evidence that supplier involvement on product design teams and in
continuous improvement programs is a source of meaningful competitive advantage
because it enhances the manufacturer’s quality, responsiveness, flexibility, and time-
saving capabilities.
Over the last decade, there is an increasing interest on the notion of Early Supplier
Involvement (ESI) in New Product Development (NPD) both within the practitioners
and academic communities. For instance, Handfield et al. (1999) propose a process
model for reaching consensus on suppliers integrate into new product development
project. They also provide a framework to facilitate in sourcing and outsourcing
decisions. Ragatz et. al., (2002) have developed a conceptual model to test the effect of
elements of the supplier integration process on cost, quality, and NPD time, under
conditions of technology uncertainty.
Rresearchers have found that a number of benefits are attained through early supplier
involvement. Firstly, incorporating suppliers on project teams enhances the information
and expertise regarding new ideas and technology (Smith, Reinertsen, 1991). In

42
addition, it allows early identification of potential problems, thus improving the quality
of the final product, eliminating rework and reducing costs (Handfield, 1994; Dow,
1997; Meyer, 1993). Secondly, early supplier involvement provides a possible route for
outsourcing that can reduce the internal complexity of projects (Brown, Eisenhard,
1995) and provides for extra resources which can lead to reduction in the critical path of
the project (Clark, and Fujimoto 1991). Thirdly, it can improve communication and
information exchange that reduces delays and ensures that the project is completed on
time. Finally, it can lead to improve buyer–supplier relationships, since suppliers
internalise project concerns and subsequently leads to smoother working relationships
on future projects (Meyer, 1993).
Three important strategic aspects of early supplier involvement have been identified in
the literature (Hartley et al., 1997;Ragatz et al., 2002; Handfield, Petersen, 2002); Liker
et al., 1996), consisting the of extent of involvement during the product development
phases, the nature of buyer–supplier relationships and the degree of information
exchange.
In respect to the extent of involvement during the product development phases, several
researchers have investigated the design process, particularly in the automotive industry,
and identified early supplier involvement during several phases of product development
(Clark, and Fujimoto, 1991; Lamming, 1993). The opportunity to improve product
design performance by involving suppliers in the product development process identifies
a definite need to understand better the influence of buyer–supplier relationships on ESI.
Birou and Fawcett (1994) suggest that environments which are conducive to highly co-
operative relationships between buyers and suppliers are more likely to lead to supplier
involvement.
By contrast, highly confrontational buyer–supplier relationships are less likely to result
in the early inclusion of suppliers in the product development process.

43
Studies of the effect of buyer–supplier communication on the product development
process have found mixed results. Several empirical studies have failed to confirm a
relationship between communication with suppliers and product development success
(Katz, Tushman, 1979). Just recently, Wynstra et al., (2000) in a series of case studies
involving a number of multinational corporations, it was found that in all instances,
communication problems were identified during ESI.
Typical issues are mentioned such as, poor guidelines for supplier involvement, poor
implementation of integrating suppliers with company systems, and standardization
efforts hindered by outdated information. Liker et al., (1998) identified technical
communication as another area which caused problems during ESI. Richeson et al.
(1995) have identified six areas where enhanced communication can take place: (a)
freely exchanged cost, schedule, and quality control information, (b) elimination of
purchase orders for each shipment, (c) involving suppliers in the development of design
speci1cations, (d) the formation of problem-solving task forces, (e) supplier and
manufacturer plant visits, and (f) electronic data interchange (EDI).
Researchers have tried to unveil the factors determining the success or failure of
supplier involvement in product development. Issues like defining and establishing
objectives, processes, and procedures for directing the involvement of suppliers and
defining the right organizational coordination mechanisms (Bruce et al., 1995; Ragatz et
al., 1997) are considered as critical success factors in overcoming major differences in
style, priorities, and motivation between the organizations involved (Tabrizi and
Walleigh, 1997). In this context, Takeishi (2001) refers to integrative capabilities, such
as architectural knowledge, integrated problem- solving, and internal coordination, as
critical factors determining the quality of the design outcome of joint development
effort. Another contribution in the same line is made by Brown and Eisenhardt (1995).

44
They provide a summary of the key variables from the literature, which include:
Team composition, team organisation of work and group
processes,
Project leadership and senior management support,
Product concept effectiveness,
Marketing issues, and
Supplier and customer integration
In addition, Wynstra, et al., (2001) contribute to this context by providing three critical
issues facing the manufacturer in achieving effective and efficient supplier involvement:
• Identifying specific processes and tasks that need to be carried out, aimed at
the integration of product development and sourcing processes,
• Forming an organisation that supports the execution of such tasks, and finally,
• Staffing the organisation with people that have the right commercial, technical
and social skills.
e)- Suppliers Evaluation
After developing a comprehensive list of potential suppliers, the supply manager's next
step is to evaluate each prospective supplier individually. The type of evaluation
required to determine supplier capability and capacity, criticality, complexity, and
Dollars value of the purchase to be made. The evaluation also varies with the supply
manager's or sourcing team's knowledge of the firms being considered for the order.
In some cases, an evaluation is unnecessary. For many uncomplicated, low-Dollars--
value purchases, an examination of basic information readily available, such as a
mailing or website, is sufficient. For complex, high-Dollar-value, and perhaps critical,
purchases, additional evaluation steps are necessary.

45
For Strategic Sourcing the following guidelines may be followed:
1. Is the supplier strategically important? If the supplier' provides a product, or
access to a future product, that is critical to the buying firm's success, take
the time.
2. Is the product or service being procured considered strategic? If yes, then
take the time to perform the evaluation.
3. Are there other short-term alternatives available? If supply management can
modify the request to allow another product, service or supplier to be quickly
substituted, then they can reduce the thoroughness of the evaluations.
Steps for complex, high value, and perhaps critical, purchases can include surveys,
financial condition analysis, third-party evaluators, evaluation conferences, plant visits,
and selected capability analyzes. Usually surveys and an analysis of the financial
condition come first. Companies that have positive survey results and good financial
standing may require facility visits. If required, visits are followed by even more
detailed analyzes of the most promising suppliers' management, quality, capacity,
service, just-in-time, and information technology capabilities.
f)- Supply Base Reduction Strategy
Supply base management is one of the most strategic areas of responsibility in the
purchasing and supply function in organizations. Research has supported the argument
that an organization is only as good as its supply base (Reed and Walsh, 2003). Hahn
(Hahn, et. al., 1990) supported this notion by stating that "without a competent supplier
network, a firm's ability to compete effectively in the market can be hampered
significantly". Fine (1998) emphasized the importance of an organization's supply base
by stating that supply chain base is the ultimate core competency.
One important decision relating to the design of an organization's supply chain is the
number of suppliers used for a given product or service (Lambert and Cooper, 2000;
Talluri and Narasimhan, 2005). Consequently, gaining an understanding of the tools used

46
in creating and managing a supply base should be a top priority for supply management
professionals. Supply base reduction is one such tool. For purposes of this research,
supply base reduction is defined as the process of and activities associated with reducing
the number of suppliers that an organization utilizes. While supply base optimization
may involve increasing the number of suppliers used for a given product or service,
supply base reduction strictly involves a decrease in the number of suppliers.
While many articles discuss the conceptual benefits of supply base reduction, very little
empirical research has been done on the topic. Supply base reduction has been discussed
as being a prerequisite to other purchasing strategies such as Just-In-Time (JIT)
purchasing, supplier partnerships, and supplier development. However, supply base
reduction implementation and the benefits that can be achieved through this purchasing
strategy have not been a major research topic in the literature. Most of the coverage of
supply base reduction tends to be brief and lack of specifics.
Recently, a significant shift has occurred from the traditional adversarial buyer–seller
relationships to the use of a limited number of qualified suppliers (Burt, 1989). Between
1980s and 1990s, purchasing began to be viewed as key player in the corporate strategic
planning process (Carlisle and Parker, 1989). Academics had too given unprecedented
attention to strategic purchasing (Gadde and Hakansson, 1993; Lamming, 1993; Ellram
and Carr, 1994). The ability of purchasing to influence strategic planning has increased
in a number of firms due to the rapidly changing competitive environment (Carr and
Pearson, 2002), and evidence reveals that purchasing is increasingly seen as a strategic
weapon to establish cooperative supplier relationships to enhance a firm’s competitive
stance (Carr and Smeltzer, 1999). Thus, contemporary purchasing is now best
recognized as a fundamental unit of SCM (Gadde and Hakansson, 1994; Fung, 1999).
One important decision relating to the design of an effective supply chain management
is the supplier relationship strategy. Supply base reduction was found to be one
component of this strategy. Traditionally, most organizations have engaged many
suppliers in order to reduce prices (Rittenberg and Tregarthen 1999). However, with
new global market competition, this has been changed. Most of the organizations
nowadays rely on few number of suppliers used for a given product or service (Lambert

47
and Cooper 2000; Talluri and Narasimhan 2005).
This has been viewed as a performance characteristic of a good supply management
orientation (Cooper and Ellram 1993; Shin, Collier and Wilson 2000).
The necessity of reducing the supply base has been highlighted by many researchers (
Dowlatshahi, 2000; Parker and Hartley, 1997; Swift, 1995). The benefits including: (1)
fewer suppliers to contact in case of orders given on short notice (Fisher, 1997), (2)
reduced inventory management costs (Trevelen, 1987), (3) volume consolidation and
quantity discounts, (4) increased economies of scale based on order volume and the
learning curve effect (Hahn et al., 1986), (5) A small supply base reduces supplier
development costs (Dowlatshahi, 2000), (6) reduced logistical costs (Bozarth et al.,
1998), (7) coordinated replenishment (Russell and Krajewski, 1992), (8) an improved
buyer–supplier product design relationship (De Toni and Nassimbeni, 1999), (9)
improved trust due to communication, (10) improved performance (Shin et al., 2000),
and (11) better customer service and market penetration (St. John and Heriot, 1993).
More benefits of such strategy could be found literatures.
Many world class organizations have put supply base reduction strategy in action and
gained better business advantages. For examples;
Xerox
From 1981 to 1985, Xerox reduced its supplier base from 5000 to 400.1 from 1981 to
1984; net product costs were reduced by about 10 percent per year. Rejects of incoming
material were reduced by 93 percent. New product development time and cost were
reduced by 50 percent. Production lead times were reduced from 52 weeks to 18 weeks
(Burt, 1989).
Nissan
Nissan plans to halve its worldwide supplier base to 4000 by 2002 and then leverage its
increased business with the remaining suppliers to reduce prices paid by 20 percent
(Magnier, 1999).

48
IBM
“In1993 IBM had about 4,900 production suppliers. Now about 85% of IBM’s $17.1
billion in production purchases is with 50 suppliers.” “Commodity councils that
leverage IBM purchasing worldwide have resulted in IBM sourcing parts at price[s] that
are 5%–10% below industry averages.” “Leveraging has had a big impact on the bottom
line. In the year of 1998, little over $1.5 billion on $21 billion we spent was saved, by
leveraging, negotiating, and moving business to our preferred set of suppliers’”.
“All other things being equal, we would source with a supplier who has multiple
capabilities and we tell them that” (Carbone, 1999).
Supply base reduction activities helped establish closer, or stronger, relationships with
the suppliers that remained after such efforts. Reducing the number of suppliers allows
companies to utilize long-term contracts and improve buyer-supplier communication as
part of win-win relationships.
Suppliers receive several benefits as part of these win-win situations. First, supply base
reduction efforts allow suppliers to receive a larger revenue base due to the increased
volume being purchased through them. Second, suppliers receive the opportunity to earn
additional business by bidding on new requirements that arise. Third, suppliers receive
forecast and parts usage information which helps them better plan and manage their
inventory levels. Fourth, suppliers are able to increase margins and be more competitive
with other customers because of lower costs through volume purchases. Fifth, suppliers
get detailed feedback from the buying organization that helps them improve their
products or processes.
2-3-3 Customer Relationship Management In today’s business environment, organizations are experiencing an increasingly
aggressive competition, from local market as well as from international market. Notably,
there have been a number of signs that suggest the power of the brand – in both
consumer and industrial markets – is in decline (Brady and Davis, 1993). In the new
paradigm of marketing, the emphasis changes from brand value to customer value. All

49
that and more demand enterprises become more skilled at managing customers.
In such business scenarios, organizations worldwide need to look at customer
relationship management (CRM) as a strategic approach that can help realize improved
customer value and to achieve corporate goals and stakeholder returns. Customer
Relationship Management (CRM) can be understood as a revolving process during
which companies interact with their customers, thereby generating, aggregating, and
analyzing customer data, and employing the results for service and marketing activities
(Seybold, 2001).
The motivation for companies to manage their customer relationships is to increase
profitability by concentrating on the economically valuable customers. From this, one
can understand that the purpose of CRM is to efficiently and effectively increase the
acquisition, growth and retention of profitable customers by selectively initiating,
building and maintaining appropriate relationships with them.
CRM has attracted the expanded attention of practitioners and scholars. More and more
companies are adopting customer-centric strategies, programs, tools, and technology for
efficient and effective customer relationship management. They are realizing the need
for in-depth and integrated customer knowledge in order to build close cooperative and
partnering relationships with their customers.
CRM is based on the principles of Relationship Marketing (RM) which is regarded as
one of the key areas of modern marketing and has generated great research interest
(Sheth, 2000). Others view CRM as a paradigmatic shift in marketing (Parvatiyar and
Sheth, 1997). The increased interest in ‘one to one’ marketing (Peppers and Rogers,
1993) raised the potential for shifting from a mass to individualize or ‘one-to-one’
marketing. Relationship-based approaches have been increasingly advocated over the
last fifteen years (Vargo and Lusch, 2004). With its roots in RM, CRM is a relatively
new management discipline. Parvitiyar and Sheth (2002) point out the two terms are
often used interchangeably. Contributors to this literature emphasize the key role of
multiple stakeholders (Gummesson, 1999). Others propose that RM is concerned with
relationships with multiple stakeholders, while the focus of customer relationship
management should be primarily on the customer.

50
I- Defining CRM
Customer Relationship Management is a word that every marketing professional thinks
or assumes as a known term. However, when it comes to explaining the same each
individual tends to give one’s own perspective, leaving behind the dimensions and
realities of various organizations implementing CRM and facing daunting tasks aside.
Agarwal (2003), in his treatise explaining the CRM concepts, identifies four ways of
viewing the term CRM. They are: - CRM is a contemporary response to the emerging climate of unprecedented
customer churn, waning brand loyalty and lower profitability (Cockburn, 2000);
-CRM is central to the task of making an organization customer-centric (Gamble, Stone
& Woodcock, 2006);
-CRM is the surest symbol embracing information technology in business (Gordon,
2002); and
-CRM is the most certain way to increase value to the customers and profitability to the
practicing organizations (Reichheld, 1996).
The importance of CRM may be gauged from the statement of Curry and Eckerson,
quoted as “the effective CRM dimensions can mean the difference between the success
and failure of a business across all industries, particularly for mid-size enterprises
(Curry, 2000). He concludes that in the present era more companies are seeking to
understand the concept and mechanics of the CRM.
He raises the most critical question: “What is customer relationship management (CRM)
all about? Is it a new jargon in our vocabulary or is it really a new paradigm?” While
we try and find few answers for the same, the topics of developing a relationship with
customers using the IT tools appear ubiquitously from every corner. Any cursory search
on the term CRM leads to an array of IT based solutions, applications and tools and
services surface, while few also voice the criticality of the database and its development
and management in CRM. At any rate, the broad definition for CRM may be developed
on the following lines using Agarwal’s framework. ‘CRM is the information technology

51
face of the business processes that aim to establish enduring and mutually beneficial
relationships with customers in order to drive customer retention, value, and profitability
up’.
II- What is CRM? In simple words, CRM is nothing but database marketing emphasizing the promotional
aspects of marketing, linked to database efforts. Shani and Chalasani (1992), Bickert
(1992) define CRM as the technological tool to build relationships with customers
through a network of specific customers, with the objective of augmenting the
marketing efforts of a firm for mutual benefit. Jackson (1985) however, applies the term
to mean “Marketing oriented toward strong, lasting relationship with individual
customers. Several authors have expressed similar views.
Berry (1995) and McKenna (1991) have a strategic role expected out of CRM, while
they stress that CRM has a role in attracting new customers, it has a lot to do with
developing closer relationships with these customers to turn them into loyal customers
to the organization in long term. As such, Berry proposed that CRM might mean
attracting, maintaining and enhancing customer relationships.
Dwyer (Dwyer et. al., 1987) have expected CRM to build a cooperative relationship
with the marketing organization. Few others have focused on the select set of customers
for an organization on the basis of their business volumes and criticality towards the
marketing activity, with an emphasis on identifying and managing a relation with them
for continued profitability of the organization.
While these and several similar other views are put forward, it remains to be seen as to
which of these get established as the core functions of CRM. It would suffice here, if
we set a fairly broad framework to study this area and explore the possibility of using
this as a strategy and operational tool for organization. Therefore, we may define CRM
as “a tool, process and strategy for a marketing organization which deals with the task of
identifying, acquiring, nurturing and retaining customers for long term interactive and
mutually beneficial association between customers and the marketing organization.
As it is implied in the above definition, the purpose of CRM is to improve marketing
productivity. Marketing productivity is achieved by increasing marketing efficiency and

52
by enhancing marketing effectiveness (Sheth and Sisodia, 1995). In CRM, marketing
efficiency is achieved because cooperative and collaborative processes help in reducing
transaction costs and overall development costs for the company. Two important
processes of CRM include proactive customer business development and building
partnering relationships with the most important customers. These lead to superior
mutual value creation.
CRM emphasizes that customer retention affects the company’s profitability because it
is more efficient to maintain an existing customer relationship than create a new one.
Also, customer Relationship Management (CRM) systems can help organizations
manage customer interactions more effectively. To achieve the CRM objective, there is
a series of aspects involved:
The processes through which the customer relates with the organization,
according to Thompson, are: marketing, sales, and service. In addition to
these processes, and depending on the area of business, there are other
processes which are directly affected and that must also be considered. The
latter processes, however, are the most common and, generally, of broader
scope.
The human factor (people) with a key role within the CRM strategy, both on
behalf of employees within the organization (who must be immersed in a
cultural change) as of the customers.
The technology is what facilitates implementing the CRM strategy; thus, it is
necessary to know which of these technologies are and how they favor the
CRM strategy.
III- CRM and SCM The above definition of CRM captures the essence of present day management mantra,
SCM too. It says, CRM is meant for a common cause of business and their customers,
which is also the understanding that the concept SCM focuses on. In order to link the
customer with the supplier, it networks the various players and using the tools for
managing the information and products, it tries to achieve the goal of customer

53
satisfaction. As such, the concept of CRM is hand in glove with the dimentions that go
well with SCM based management dimentions. CRM calls for capturing pertinent data
about the prospective and current customers in respect of their buying pattern, shopping
behaviour and usage habits of the products and services and to use the information to
commence a two-way dialogue with them. That means, the essence of CRM is customer
and continuity, and it goes well with the goals of Supply Chain Management.
2-3-4 The Value of Information sharing in Supply Chain
Supply Chain Management (SCM) is concerned with alignment of firms that bring
products or services to the market (Lambert et. al., 1998), to improve the performance of
the whole supply chain by considering their individual needs. One of the important
issues of the coordination is to share product and production information among
themselves ( Helena et. al., 2010).
Information sharing at different levels of supply chain is considered to be basic
ingredient to solve this issue. Lee and Whang (2000) therefore suggest that information
sharing is a key enabler for supply chain management.
Information sharing strategy can be defined as that strategy adopted by the headquarters
of an organization to integrate and coordinate the network (Barry and Venkatachalam,
2003). Several factors influence that strategy:
• product and competitive market;
• classification of the outsourced activity;
• global reach;
• efficiency and responsiveness;
• centralization or decentralization; and
• single and multiple sourcing
Many research works are devoted information sharing within the supply chain (Barrat,
2004). Lee and Whang (2000) describe information sharing as the enabler for tight
coordination among trading partners. According to Stein and Sweat (1998), supply chain

54
partners who exchange information regularly are able to work as a single entity.
Moreover, Tompkins and Ang (1999) consider the effective use of relevant and timely
information by all functional elements within the supply chain as a key competitive and
distinguishing factor. Kelle and Akbulut, (2005) have emphasized the importance of
sharing supply chain information between supply chain partners in order to increase
supply chain effectiveness and efficiency. McLaughlin et. al., (2003) demonstrate how
one US manufacturing company shared information to improve its external downstream
supply chain operations.
Lee and Whang (2000) describe information sharing as the enabler for tight coordination
among trading partners. Sharing sales information has been viewed as a major strategy
to counter the so-called “bullwhip effect” (Lee et. al., 1997). Cachon and Fisher (2000)
studied the value of sharing data in a model with one supplier. Chen et al. (2000)
quantified the bullwhip effect for a simple two-stage supply chain and demonstrated that
centralizing demand information can significantly reduce the increase in variability.
Raghunathan (2003) researched the value of demand information sharing between a
single manufacturer and N retailers. Liu and Kumar (2003) found that some supply
chain collaboration such as Third-Party Logistics (3PL), Vendor Managed Inventory
(VMI), and Two-tier Collaborative Planning, Forecasting, and Replenishment (CPFR)
rely more on inventory information than other information. Davis (2004) researched the
influence of capacity, demand, cost, and retailer policy on the value of information
sharing while sharing the retailer’s inventory position and demand in a single supplier
and a single retailer model. Several studies have emphasized the importance of sharing
information between customers and suppliers in supply chains, especially point-of-sale
(POS) and forecast data (Kelle and Akbulut, 2005; Christopher and Towill, 2000;
Cachon and Fisher, 2000).
A supply chain is in the form of an extended enterprise, where firms collectively
organize the supply, production, and distribution of products and services. Information
sharing is a well-accepted technique for this purpose. Many research works are devoted
to answering the question on ‘what information to share’. Li et al. (2006) offer four
types of data to be shared across SC, namely, order information which includes demand


Source: Huang et al, 2003
Product information: This includes the characteristics of products manufactured and the
production process. An example of product structure is a bill-of-materials (BOM),
which may include cost data. However, product information is not an actively
researched category in information sharing in a supply chain.
Process information: This includes the business processes in a supply chain that actually
add value in fulfilling the customers’ demand. General processes in a supply chain are
ordering, production, and shipment. Process information may contain the mean and
variance of the lead-time and set-up time, costs, policies, and the quality of the process.
Tsung (2000) investigated sharing quality information of a supplier in a two echelon
supply chain and concluded that real-time quality information sharing was most
beneficial compared to no information sharing as well as one-way and two-way
information sharing. Li et al. (2005) researched sharing the downstream customer’s
outbound shipment data, which represented “the amount of a product each stage
immediately ships to its customer in response to a customer order after previous
backorders are met.” They found that sharing shipment data is beneficial when a supply
chain has a relatively high service rate.
Planning information: This includes demand forecasts and order schedule. Finding
effective technique of forecasting and sharing the data obtained is important. The order
schedule denotes order quantity, which includes production order and purchase order, of
in advanced time period. However, sharing planning information in a supply chain has
not been studied much in the literature.
Resource information: This includes capability and capacity. Capability indicates the
available number of products or processes that each member of a supply chain can
sustain. Capacity indicates “the ability of satisfying future demand” (Huang et al.,
2003). Within the information available in a supply chain, the most important
information to be shared is demand and inventory information. By sharing either

57
demand information or inventory level, the whole chain can expect to reduce and find
optimal amount of inventory that lead to reduction of total cost of the chain.
In summary, Information sharing among the members of the supply chain includes any
type of data that could influence the actions and performance of other members of the
supply chain. Ideally, such information should be accessible by the appropriate parties
on a real-time, on-line basis without significant effort.
I- Benefits of Information Sharing Engaging and exploiting the opportunities offered by IT is one of the hot topics for
almost any modern organization. The importance of IT within a business environment
increased significantly during recent years. Aviv (2001) examines the benefits of
increased information sharing in the form of improved forecasting. Xu et al., (2001)
concluded that collaboration and information sharing reduce inventory within the supply
chain and improve efficiency in terms of resource utilization. Specifically, they find that
sharing of the demand information is beneficial when the forecasting errors of the
supplier are greater than those of the retailer before collaboration. Cachon and Fisher
(2000) find that firms share information are able to gain competitive advantages by
matching buyers with sellers before others can do it.
It can be claimed that many potential benefits can accrue from the proper share of
information between business partners. These include but not limited to; improved
customer service, increased sales, decreased administrative costs, decreased
manufacturing costs, decreased inventory costs, improved data control, and reduced
clerical errors that result in improved productivity, enhanced competitive advantage,
reduced financial exposure, and better cash management.

58
II- Information Aspects; the quality and quantity
1- The Quality Aspect Information sharing has two aspects: quality and quantity. Both aspects are important
for the dimensions of SCM (Li et. al., 2006) and have been treated as independent
constructs in the past SCM studies. For supply chain partners those depend on
information, the information quality is one of the key determinants of the quality of their
decisions and actions.
While information sharing is increasingly becoming a critical resource for an
organization, the significance of its impact on SCM depends on what information is
shared, when and how it is shared, and with whom. Literature is replete with example of
the dysfunctional effects of inaccurate/delayed information, as information moves along
the supply chain.
Information quality has been referred to constantly as information which must satisfy
the needs of the user. There are two significant definitions of information quality. One is
its inherent quality, and the other is its pragmatic quality. Inherent information quality is
the correctness or accuracy of data. Pragmatic information quality is the value that
accurate data has in supporting the work of the enterprise.
According to Strong et. al., (1997) quality information is the information that is fit for
use by the supply chain partners. The quality or usefulness of data is dependent on the
individual who is going to be using it. Good quality data would therefore meet the
requirements of its intended use. The concept of quality is therefore relative, depending
on the different perceptions and needs of the users of the data. There are various
opinions of information usefulness and quality. Recently, Ballou et. al., (2004) suggest
that information quality characteristics can be nebulous, with perfect information quality
being difficult to achieve. The authors indicate that information quality tends to be
shaped by the application environment in which users utilise that information – hence,
user perceptions govern the quality attributes. Ballou et. al., (2004) identify information
attributes such as accuracy, completeness, timelines and consistency as reflecting a

59
quality dimension that tends to be perceived as sufficient for user needs. Monczka, et.
al., (1998) propose that information quality includes such aspects as the accuracy,
timeliness, adequacy, and credibility of information exchanged. Information may have
descriptive characteristics that relate, for example, to accuracy, completeness, relevancy
and persistency – attributes that have information content dimension (O’Brien, 2001;
Pipino et. al., 2002). Information may also be directly related to a time dimension
(O’Brien, 2001; Cappiello et al., 2004) that includes descriptive characteristics such as
timeliness, frequency and currency. Lee et al. (2002) grouped business information
quality attributes into four categories – intrinsic, contextual, and representational and
those that addressed accessibility. The authors suggested that information attributes that
exhibit intrinsic quality are pure and inclusive of quality features, whilst contextual
information attributes are those that are used within the user’s sphere of application and
add value because of timeliness, completeness, relevance and appropriateness attribute.
The representational and accessibility dimensions reflect the importance of information
systems per se in that they allow easy storage and retrieval of data – information quality
values in these two dimensions encompass accessibility, interpretability, consistency
and conciseness. Lee and Strong (2004) focussed on five types of information quality in
an attempt to investigate relationships between knowledge and work performance.
Information attributes that reflected quality in the view of these authors were
accessibility, which directly reflected data availability; relevancy which is associated
with how the information is applied to a specific task; a timeliness dimensions reflecting
the creation date of the data; accuracy that Information quality attributes.
Helena Forslund (2007) in his “transition” study from the general studies towards
Forecast Information Quality (FIQ) variables, defined and described FIQ with the four
information quality variables: in time, accurate, convenient to access, and reliable.
Forecast information being in time means that it is in the agreed time, when the
information customer wants it. It is also concurrent to the situation, i.e. that the state of
information used for decision making corresponds to the situation, so the data
represented is not time-phased with regard to when it was registered and presented.
Accuracy concerns the degree of obvious mistakes in the information. Forecast
information coming from a customer might be impaired by obvious mistakes, which

60
must be corrected before being entered into the supplier’s planning system. Convenient
to access, deals with the ease of accessing the data without further processing.
Processing could mean adapting an item code or entering it manually into the supplier’s
planning system. The fourth variable, reliability, refers to the probability that a forecast
will remain unchanged. Unreliable information means uncertainty to the supplying
company, which has to be absorbed by safety mechanisms.
2- The Benefits of Quality Information Quality information within the context of a seamless supply chain structure is
established as a key strategy for dampening demand amplification effects across value
chains to help improve supply chain responsiveness. The commercial implications of
this concept of quality information sharing implies a higher than normal because, the
higher the quality information shared the greater achieving customer satisfaction. On
other hand, poor information quality costs organizations a significant of operating
revenue in process failure and "information scrap and rework" in direct costs with
missed opportunity costs often greater. Indeed, a 5 percent reduction in supply chain
costs can yield a 50 percent increase in profits (Taylor, 2003). Therefore, managing
quality information is essential in sustaining competitiveness (Lee, 2000). Quality
information sharing contributes positively to customer satisfaction (Spekman et al.,
1998) and partnership quality (Lee, et al., 2002). Quality information sharing impacts
the supply chain performance in terms of both total cost and service level (Zhao et al.,
2002). According to Lin et al. (2002) the higher level of quality information sharing is
associated with the lower total cost, the higher order fulfilment rate and the shorter order
cycle time.
The rapid growth of distributed information systems has led to an exponential growth in
corporate data collection and, consequently, a rapid deterioration in the quality of the
information collected. This has resulted in:
The capturing and use of poor or incorrect data increases operational costs.
An inability to realise the value of the information collected

61
The consequences of distorted quality information effects are significant to the
management of supply chains and have been identified as a significant barrier to
efficiency and effectiveness of such chains. The presence of distorted quality
information can drive excess inventory, capacity, and labour and therefore cost. It also
has detrimental effects on customer service and responsiveness (Lee et al., 1997). As the
objective of supply chain management is to synchronise supply with demand in order to
drive down costs whilst increasing customer satisfaction (Christopher and Towill, 2001),
the relative scale of distortion can act as a key indicator of the overall effectiveness of
the supply chain.
This continuing trend means that businesses need to develop and implement information
quality processes to ensure that the information they receive and store about their
customers is not only accurate, reliable, complete and not duplicated, but that it can also
be linked across different supply chain partners. This in turn ensures that the information
stored in corporate databases can be successfully realised as a valuable and strategic
business asset. Apart from reduced overall supply chain costs, the real benefits in
implementing an information quality solution are derived from the improvement in
business processes and the fostering of better customer relationships.
3- Information Quantity Quantity aspect of information sharing refers to the extent to which critical and
proprietary information is communicated to one’s supply chain partner (Monczka et al.,
1998). Seidmann & Sundararajan (1997) identify four level of information sharing based
on the impact of shared information on each participating party. Higher levels of
information sharing subsume lower levels. The first level of information sharing
involves the sharing of only transactional data such as order and price. There are no joint
decisions and each party acts independently to improve its own efficiency. The second
level involves the sharing of some operational information such as inventory levels. An
example of this level of information sharing is a Vendor Managed Inventory (VMI)
system in which a supplier is responsible for buyer inventory management. The supplier

62
can gain benefits from better production schedules and lower inventory and the buyer
benefits from better product availability hence increasing service level and lowering
inventory costs. The next level is sharing strategic information. The shared information
has minimal values to the party that owns information but can bring benefits when used
by other party. Sharing point-of sales data is an example of this level of information
sharing. By sharing actual sales data, the supplier can increase forecast accuracy and
operational efficiency that can be valuable for both parties. The fourth level is sharing
both strategic and competitive information. At this level, shared information has
minimal value to the party who owns the information but can provide significant
strategic and competitive benefits to the other party who receives the information.
III- Information Technology A key goal of SCM is the integration of supply chain players’ efforts, activities,
capabilities and resources to create competitive advantages over the competitors.
Although other characteristics and tools may be needed, the realization of this
‘integration’ is clearly enabled by information technology (Hill and Scudder, 2002; Kim
and Narasimhan, 2002, Craighead and LaForge, 2003). Investment in IT for managing
supply chains has been an effective way of obtaining competitive advantage (Kwan,
1999).
IT is used to transfer the information within the supply chain can be defined, which
combines the definitions of Martin et al. (1999) and www.whatis.com:
Information technology is a term that encompasses all forms of
technology utilized to create, capture, manipulate, communicate,
exchange, present, and use information in its various forms
(business data, voice conversations, still images, motion pictures,
multimedia presentations, and other forms, including those not
yet conceived).

63
In other words, this definition of IT includes computer hardware,
software, and communication systems, whereas some authors
also include personnel and resources dedicated to supporting
these capabilities (King et al., 1989; Stump and Sriram, 1997).
Another source defines IT as “encompasses the information that businesses creates, uses
as well as a wide spectrum of increasingly convergent and linked technologies the
process the information” Handfield & Nichols (1999).
There is a substantial amount of research conducted that addresses the role and impact
of IT in managing supply chains. John McLaughlin et al., (2003) examines the role of IT
in managing complex carrier service and rate structures, as well as outbound shipping
scenarios for one of US manufacturing company implemented a transportation planning
and optimization system to enhance their external downstream supply chain operations.
The benefit derived from the study was an improvement in carrier and service mode
selection. The project was able to determine benefits by comparing the most likely
carriers to be chosen by the traffic coordinators for a group of loads with the optimizer’s
selection. Using the “rate shopping” function, the freight costs of each selection were
recalculated manually and compared. Other area of study is the relation between IT
adoption and organization performance (Andersen and Segars, 2001; Baker and
Abrahams, 2001; Fisher, 2001; Da Silveira and Cagliano, 2006). The research continue
to study different aspect of ICT: the use of EDI (Hill and Scudder, 2002), designing
CPFR (Danese, 2007), the implementation/use of ERP (Wu and Wang, 2006), or the
learning effects in on-line ordering (Kull et al., 2007).
Information technology is classified either internally oriented or outwardly directed
(Stump and Sriram, 1997). Information systems that do not directly involve external
organizations are called internal IT. Internal IT falls into the domains of office and
factory automation systems that organize work more efficiently. The category of internal
IT encompasses all information systems that are only used within the organizational
boundaries. These systems can support the entire organization, or specific tasks or
functions within the organization. Applications that are basically used inside the
organization are office automation, transaction processing systems, enterprise resource

64
planning systems, data warehousing systems, groupware applications, intranets, and
executive information systems. These are the information function, communication
function, and decision support.
Ricky, et al (2004) show in their study the internal and shared IT and their benefits to an
organization. They are summarized in the following tables 2-5 and 2-6 respectively.
Table: 2-5 Applications of internal IT and their benefits

65
Table 2-6 Applications of shared IT and their benefits
Source: Ricky, et al (2004)
Many information technologies assist with the integration and coordination, Inter-
organizational systems, EDI and extranets are of the most popular shared IT tools.
EDI is the electronic transmission of information or documents such as invoices, bills of
lading, or purchase orders between computer systems in different organizations based on
a standard, structure, machine retrievable format. EDI can improve the buyer–supplier
relationship through a more systematic and fluid interchange of information. EDI allows
companies to exchange information electronically with little or no need for human
intervention to transform or input data (A. Martínez and Sánchez, 2005).
Many studies have researched the effects of EDI on trading relations (Hill and Scudder,
2002; Nakayama, 2003); however, it is yet to be determined how EDI effects the SC

66
performance components (i.e. inventory levels, stock-outs, order cycles, fill rates). Firms
view EDI as a tool for improving efficiencies, rather than as a tool for facilitating SC
integration (Hill and Scudder, 2002). The supply chain can realize the difference
between the effectiveness of an EDI-SC and a manual SC. More specifically, an
electronic (EDI) SC is more effective than non-electronic (manual) SC. SCMS benefits
may be classified as either more strategic- or operational-oriented. Other authors have
made similar classifications (Dearing 1990, Subramani 2004).
There are additional categories used by software suppliers, many of which have
coalesced with the rise of SCM. They include SCM itself (Supply Chain Management),
ERP (Enterprise Resource Planning), CRM (Customer Relationship Management),
PDM (Product Data Management), CRP (Capacity Requirements Planning), MES
(Manufacturing Execution Systems), and APS (Advanced Planning & Scheduling).
Companies use these systems to manage control and automate complex information
flows within or between firms (Kalakota,2000; Kalakota and Robinson, 2000), for key
supply chain operations such as warehousing, transportation and back-office functions.
The back office operations consist of the many transactions fundamental to the business.
Examples are personnel records, booking sales, and ordering materials.
The sudden increase in electronic commerce and the Internet have resulted in new
opportunities to improve the performance of the supply chain. The Internet can provide
for the exchange of information crucial to efficient SCM, either in the form of Web
pages accessible only to specific vendors or by means of an intranet enabled by the
Internet. The Internet also has given rise to another feature of SCM in providing a venue
for business-to-business product and services sales. Business-to-business e-commerce
grew much more quickly than did the market for consumer goods (William M.2004).
The Internet also has given rise to another feature of SCM in providing a venue for
business-to-business product and services sales. Business-to-business e-commerce grew
much more quickly than did the market for consumer goods. Armstrong and Hagel
(1996) maintain there is beginning to be an evolution in supply chain towards online
business communities. The Web enables all suppliers in a supply chain to identify and
co-ordinate data transfers with each other. Research laboratories, pharmaceutical

67
distributors and end-users, for example, can all swap information on new product
developments, specific diseases, and treatments within these settings.
2-3-5 Logistics Strategy
I- Introduction The scope and influence of logistics has evolved in the late 1940s. In the 1950s, and 60s,
military was the only organization which used logistics. It has been extended beyond the
army, as it has been recognized as one of the important tools for developing
competitiveness. Competitive advantage means the company has the ability to
differentiate itself, in the customer’s eyes, and also is operating at a lower cost and
greater profit.
Logistics facilitates in getting products and services as and when they are needed and
desired by the customer. It also helps in economic transactions, serving as a major
enabler of growth of trade and commerce in an economy (Ismail et. al., 2010).
Logistics has come to be recognized as a distinct function with the rise of mass
production systems. Production and distribution were earlier viewed as a sequential
chain of extremely specialized activities (Emel et. al., 2011). The role of logistics is to
ensure availability of all the required materials before every step in this chain.
Obviously inventory of raw materials, semi-finished and finished goods is a must, across
this chain to ensure its smooth functioning.
The concept of logistics has its base upon the systems approach. There is a single chain,
with flow of materials starting from the supplier, to the plant and finally the end
customer, and also these activities are done sequentially in order to achieve customer
satisfaction at low cost.
With reference to an organization, an organization gets a concrete shape due to its
structure. In the earlier times, the suppliers in distribution activities were spread across
the entire structure, thus resulting in an overlapping of activities and finally in
unaccountable authority and responsibility. In today’s process driven organization,

68
where the focus has shifted from functions to process, logistics has become an essential
part of the process.
Globalization of corporations and international orientations of management that sweeps
national boundaries has introduced new challenges on the ability of organizations to
deliver customer-adapted products all over the world quickly and on time. This has
placed a number of demands on the logistics system and has become a rapidly
developing area of investigation.
Logistics has evolved over the years to the points where logistical competency is
frequently viewed as a strategic resource (Mantzer at al., 1989). It found a competitive
edge in gaining and maintaining profitable customers which in turn result in increased
market share and revenue. Most of the world class organizations emphasis logistics
service as a competitive differentiator (Stern et al., 1993; Kwong et. al., 2011). These
organizations focus on creating or adding value for the customer. As firms become more
sophisticated and more adopted at leveraging logistical abilities, they move along the
continuum from initial efforts targeted to customer service and on to re focusing toward
achieving customer satisfaction and eventually, may shift to emphasizing customer
success ( Bowersox and closs, 1996).
II- Logistics Definition Logistics has traditionally been defined as the process of planning, implementing, and
controlling the efficient flow and storage of goods, services, and related information as
they travel from point of origin to point of consumption (Council of Logistics
Management, 1998). In this integrative approach, a cross-functional senior management
group coordinates physical and informational resources to optimize efficiency and
effectiveness. It manages both the purchasing (or inputs) side of the resource stream,
and the distribution (or outputs) side of the stream as a single integrated flow. This flow
typically encompasses customer service, physical distribution, materials management,
information management, and their related, highly complex sub-processes: order
processing and order tracking, production planning and supplier management,

69
purchasing, warehousing, transportation, and electronic supply-chain
communications/payment systems.
Philip Kotler defines logistics as “planning, implementing, and controlling the
physical flows of materials and finished goods from point of origin to point of use to
meet the customer’s need at a profit”. Logistics is all pervasive.
III- Goal of logistics
Logistics have the following objectives:
• Reduction of inventory
• Economy of freight
• Reliability and consistency in delivery performance
• Minimum damage to products
• Quicker and faster response
IV- Logistics integration The change in today’s business environments encourage adoption of integrated logistics
management and integrated information systems throughout the entire channel system (
Kenderdine and Larson, 1998). Integrated logistics focuses on co - coordinating all
logistics activities in a system that will simultaneously attempt to minimize total
distribution cost and maintain desired customer service level (Gopal and Cypress, 1993).
The results are increased efficiency and productivity (Larson, 2000). Benefits in the
form of inventory reduction, shorter lead times, customer service enhancements, and
improved forecasting and scheduling have been identified (Muller, 1990). Better supply
chain performance (Gustin et al., 1994; Christopher, 1998; Ellram and Cooper, 1993;
Christiansee and Kumar, 2000) and competitive advantage (Christopher, 1998) also
have been highlighted as a results of proper logistics integration.

70
A key to logistics integration is the transparent flow of information from one end of the
chain to the other. Supply chain partners are able to respond more rapidly to known
demand with lesser inventory and hence lower cost by sharing information. A
responsive supply chain is highly integrated. They integrate internally across functions
and externally integrate with suppliers and downstream customers. A lot of companies
are attempting to become more agile and responsive due to an encroached functional
structure. They have a fragmented approach to the marketplace and thus manage
functions rather than processes. It is also difficult for firms like these to reflect external
integration when they lack internal integration. Companies that have got over this are
now looking to design close linkages with their supply chain partners.
The following are the imperatives for successful integrated logistics:
New Culture: Enabling employees to adapt to the new operating realities in cross-
supply chain collaboration are a key component of integrated logistics. Core capability
teams, which consist of professionals, must be focused on key integrated logistics
activities, which synchronize activities across the entire supply chain. Senior
executives entrusted with the task of integration and synchronization has to articulate
the strategy for a new cross supply chain culture, which will be shared by all partners.
Agreements on cost-sharing and revenue-sharing: Building a benefit structure
balancing rewards with each partner’s understanding of their contribution is important
for maintaining close partnering relationships. A generally agreed upon framework for
equitable revenue and cost sharing amongst all participants is necessary. Analyzing
the supply chain economics examines the role and costs of each of the different
participants of the supply chain. Detailed dimensions and performance metrics will
help in understanding the participant’s competitive advantage.
Establish Transparency: Establishing of an integrated logistics system is challenged
by participants’ unwillingness to forgo any degree of control, which is a symptom of
lack of trust. This lack of trust will hinder acceptance of integrated logistics while lack
of standard communication and business processes will hinder implementation.

71
V- Need for Integration A significant feature of a responsive organization is the priority the organization
attaches for integration. Not only integration within the organization but also
integration upstream with suppliers and downstream with distributors and customers is
important. There is also a lot of emphasis on linking organizations through
information. Information systems nowadays drive companies to reconsider their
relationships with customers and suppliers. Process integration is achieved through
logistics integration, which means both upstream and downstream integration. The
objective in an extended enterprise is creation of an ‘end-to-end’ process so that
innovative products are created and delivered at higher levels of quality and in lesser
time frame to markets. This is achieved through the following means:
Rationalization of supply base: Companies try to rationalize their supply base by
reducing the number of suppliers. In fact, companies are looking at these suppliers to
provide systems rather than components. For example: the automotive sector is trying
to integrate tier 1, tier 2 and tier 3 suppliers.
Centralized inventory: The extended enterprise not only includes upstream suppliers
but also the downstream flow of finished products through dealer networks.
Traditionally, when dealers did not have the product demanded by customers, they
used to swap this with another dealer who had that product variety in stock. Today,
enterprises have centralized inventory and also take responsibility for its management.
The dealers have only demonstration models; they have on-line access of the
enterprise supply system and can give the customer an immediate confirmation about
the availability of the product of their choice and when it can be delivered. For those
products not available from stock, dealers enter order directly into the production
schedule and the product required is made to order.
Integrated Information Systems: The benefits of a fully transparent information
system are being considered with the use of Electronic Data Interchange (EDI)
together with the growing acceptance of ‘just-in-time’ philosophy. Suppliers can now
manage the flow of materials into the plant on the basis of advance notification of a

72
company’s production schedule. With integrated information systems, there are no
manual orders, invoices or delivery notes. A single source of information provides the
basis for a timely physical response, which automatically triggers payment to the
supplier.
Supplier Development Programs: Supplier development has replaced the traditional
purchasing function. A cross functional team of specialists work closely with suppliers
and seek improvements in supplier processes as well as in the interfaces with the
enterprise’s processes.
Supplier involvement: Innovations in industries are supplier originated. By bringing
suppliers closer to the process of new development, it has been found that innovation
can be embodied in new products continually and simpler cost effective designs can
be created.
Fig: 2-2 Logistics Integration (Source: Bowersox&Closs, 1996)
Logistics integration, Figure 2-2 can be described by two dimensions internal and
external depending on the nexus of integrative activities. Stevens (1989) suggests that
companies integrate internally first, and then, extend integration to other supply chain
members. Internal integration consider the inter relationships and trade-off within the
firm (Staude, 1987). In today’s business complexity, integrated logistics generally is
considered to have much boarder applicability. As La Londe and Power have noted,
“Logistics executive of the future will require both horizontal (cross- functional) and
Vertical (supply chain) information capability to effectively contribute to the
competitiveness of the firm” (La Londe and Power, 1993). More detail discussion of the
two types of logistics integration is given below.
Physical
Distribution
Manufacturing Support
Procurement SuppliersCustomers

73
1- Internal integration
Internal integration refers to the coordination, collaboration and integration of logistics
across functional boundaries within a firm (Stock et al., 1998). Bowersox and Daugherty
(1989) implicit in the recognition of the stages of integrated logistics is the notion that
benefits, especially cost benefits, will be realized by companies that operate their
logistics processes as an integrated system rather than by optimizing functional
subsystems. Internal integration basically means making the internal operation smoother
which is equivalent with decreasing the `internal transaction costs.
Such collaboration and coordination means that these functional areas must have formal
teamwork and share ideas, information and other resources. Integration also means that
there is a joint planning to anticipate and resolve operative problems, a joint
establishment of objectives, a joint development of the understanding of responsibilities
and a joint establishment of decisions about how to improve cost efficiencies.
The extent of internal integration would be reflected by the extent to which logistics
activities interact with other functional areas, as well as the extent to which logistics is
or is not a separate functional unit. For example, indications of higher levels of internal
integration would include increased coordination of logistics activities with other
departments in the firm, increased communication electronic and interpersonal between
logistics and other departments, increased importance of logistics in the overall business
strategy, and a blurring of the formal distinction between logistics and other areas of the
firm (Mc-Ginnis and Kohn, 1990).
2- External integration External integration is the second dimension of logistics integration in which the
logistics activities across suppliers and customers are integrated (Stock et al., 1998).
External integration is a relatively new concept and reflects a transformation of the
manufacturing enterprise to encompass the entire supply chain, not an individual
company. To compete effectively, supply chains must act as a cohesive entity, in effect
changing from a collection of unrelated firms to a set of firms that form a productive
enterprise. This form of manufacturing organization would necessarily require a greater

74
number of inter-firm operational interactions, as well as changes in the nature of these
interactions.
External integration would be reflected by the extent to which the logistics activities of a
firm are integrated with the logistics activities of its suppliers and customers. For
example, many companies have created dedicated ‘‘inter-firm’’ logistics approaches,
such as electronic data interchange, that link their manufacturing functions with
particular suppliers of components.
Indications of higher levels of external integration would include:
1. Increased logistics-related communication both computer and interpersonal with
suppliers and customers;
2. Greater coordination of the firm’s logistics activities with those of its suppliers
and customers; and
3. More blurred organizational distinctions between the logistics activities of the
firm and those of its suppliers and customers.
VI- Supply Chain Management versus Logistics Logistics management is that part of the Supply Chain Management processes that
plans, implements, and controls the efficient, effective forward and reverse flow and
storage of goods, services, and related information between the point of origin and the
point of consumption in order to meet customers' requirements.
These are the boundaries and relationships of Logistics Management adopted by the
Council of Logistics Management: "Logistics Management activities typically include
inbound and outbound transportation management, fleet management, warehousing,
materials handling, order fulfillment, logistics network design, inventory management
of third party logistics services providers. To varying degrees, the logistics function
also includes sourcing and procurement, production planning and scheduling,
packaging and assembly, and customer service. It is involved in all levels of planning
and execution -- strategic, operational and tactical. Logistics Management is an
integrating function, which coordinates and optimizes all logistics activities, as well as

75
integrates logistics activities with other functions including marketing, sales
manufacturing, finance and information technology."
SCM encompasses the planning and management of all activities involved in sourcing
and procurement, conversion, and all logistics management activities. Importantly, it
also includes coordination and collaboration with channel partners, which can be
suppliers, intermediaries, third-party service providers, and customers. In essence,
Supply Chain Management integrates supply and demand management within and
across companies.
These are the boundaries and relationships of Supply Chain Management adopted by
the Council of Logistics Management: "Supply Chain Management is an integrating
function with primary responsibility for linking major business functions and business
processes within and across companies into a cohesive and high-performing.
There are four different schools in defining the SCM:
1- Traditionalist
The traditionalist positions SCM within logistics, i.e. SCM is one small part of logistics.
They have variously addressed the concept of supply chain management (SCM) as an
extension of logistics, the same as logistics, or as an all-encompassing approach to
business integration.
Stock & Lambert (2001) observed that the logistics community has tended to view SCM
as ‘‘logistics outside the firm’’. This reduces SCM to a special type of logistics, external
or inter-organizational logistics. Traditionalist practitioners may create new ‘‘SCM
analyst’’ positions within the logistics group. SCM analysts would broaden the scope of
logistics analysis, perhaps linking the logistics effort to other functions within the firm,
as well as other firms in the supply chain.

76
2- Relabeling The relabeling perspective simply renames logistics; what was logistics is now SCM.
Leenders & Fearon (1997) describe ‘‘logistics management, or supply chain
management’’ as an organizational strategy. Tan et al., (1998) discuss an evolution of
logistics into ‘‘integrated logistics’’, which is now often called ‘‘SCM’’. Moreover,
according to Jones & Riley (1985), SCM techniques ‘‘deal with the planning and control
of total materials flows from suppliers through end users’’. This notion of SCM overlaps
heavily with the Council of Logistics Management (CLM) definition of logistics. More
recently, Simchi-Levi et al., (2003) confessed that they ‘‘do not distinguish between
logistics and supply chain management’’. They also use supply chain and logistics
network as synonymous terms. Relabeling narrows the scope of SCM, since SCM
equals logistics.
Gammel et. al., (2001) reported results of a survey of supply chain managers. The
survey included the following open-ended question: ‘‘Please briefly describe what a
supply chain manager does’’. A large group of responses to this question reflected the
relabeling perspective (supply chain manager as logistics manager).
3-Unionist
The logistics discipline is evolving with the SCM concept (Bechtel and Jayaram, 1997).
The Council of Logistics Management (CLM) defines logistics as “that part of supply
chain process that plan, implements, and controls the efficient and effective flow and
storage of goods, services, and related information from the point of origin to the point
of consumption in order to meet customers’ requirements” This requires coordination of
activities both within and between companies in the supply chain.
Giunipero & Brand (1996) expressed similar view with the following statement: ‘‘SCM
is more than logistics’’. According to Konezny & Beskow (1999), the components of
SCM are: logistics (inventory, warehousing, packaging, distribution, transportation,
customer service, purchasing, production planning and demand forecasting); strategic
planning; information technology; marketing; and sales. Others develop SCM as an
interdisciplinary concept drawing on fields such as marketing, economics, logistics and

77
organizational behavior (Hobbs, 1996). Moreover, New (1997) concluded that it is
important to study social, political and ethical aspects of SCM. For some authors, the
term ‘‘SCM’’ alone is not enough! For instance, Sandelands (1994) defines total SCM
as ‘‘gathering and exploiting quality information for all business areas, such as finance,
marketing, and human resource planning’’.
Stock & Lambert (2001) suggest ‘‘SCM is the management of eight key business
processes: (1) customer relationship management, (2) customer service management, (3)
demand management, (4) order fulfillment, (5) manufacturing flow management, (6)
procurement, (7) product development and commercialization, and (8) returns’’. These
processes subsume or include much of logistics, purchasing, marketing and operations
management. According to Mentzer et al. (2001), ‘‘all the traditional business functions
should be included in the process of SCM’’. In their model of SCM, these traditional
business functions are marketing, sales, research and development, forecasting,
production, purchasing, logistics, information systems, finance and customer service.
4- Inter-sectionist
Giunipero & Brand (1996) hinted at this idea with the following statement: ‘‘SCM is not
a subset of logistics but is a broad strategy which cuts across business processes both
within the firm and through the channels’’. The intersection concept suggests SCM is
not the union of logistics, marketing, operations management, purchasing and other
functional areas. Rather, it includes strategic, integrative elements from all of these
disciplines. For instance, in the purchasing area, negotiating a long-term arrangement is
a strategic element and transmitting a purchase order is tactical. The supply chain
manager would be involved in the negotiations, but not the purchase order transmission.
Similarly, in the logistics area, hiring a third-party logistics (3PL) provider is a strategic
decision, while picking and packing in the warehouse are tactical. At the intersection,
SCM co-ordinates cross functional efforts across multiple firms. SCM is strategic, not
tactical.
In practice, inter-sectionist organizations may appoint a supply chain council, consisting
of key executives across functions (e.g. logistics, marketing and purchasing) and

78
institutions (e.g. manufacturer, retailer and 3PL). The council would break down
barriers to SCM and seek opportunities to apply SCM concepts to improve overall
supply chain performance. A small, consultative SCM group, operating in a staff (rather
than a line) capacity, would also be indicative of the inter-sectionist perspective.
Logistics, marketing, operations and purchasing do not report to SCM. Rather, these
departments draw on the SCM group for research, intelligence and consulting support.
Despite a growing base of literature and experience, there appears to be no consensus on
the relation between logistics and SCM.
2-3-6 Performance Measurement
When you can measure what you are speaking about, and express it in numbers,
you know something about it ... [otherwise] your knowledge is of a meager and
unsatisfactory kind; it may be the beginning of knowledge, but you have scarcely in
thought advanced to the stage of science. (Lord Kelvin, 1824-1907)
1- Introduction
Performance measurement systems (PMS) have been an area for study and research for
decades. Such research studies admit that performance measurement systems (PMS)
allow an organization to align its business activities to its strategy, and to monitor
performance toward strategic goals over time. It is for such reason; it can play a key role
in supporting managerial growth in an organization either for small and medium
enterprises (SMEs) or large enterprises (Garengo et al., 2005; Chin et. al., 2010).
Performance measurement is an essential element of effective planning and control, as
well as decision making. It can provide necessary feedback information to reveal
progress, enhance motivation and communication, and diagnose problems (W.H. Ip et.
al., 2011). According to Chan (2003), it reflects the need for improvement in areas with
unsatisfactory performance. Thus efficiency and quality can be improved.
Neely (1994) defines performance measurement system as the set of metrics used to
quantify both the efficiency and effectiveness of actions. The terms efficiency and

79
effectiveness are used precisely in this context. Effectiveness refers to the extent to
which customer requirements are met, while efficiency is a measure of how
economically the firm's resources are utilized when providing a given level of customer
satisfaction. This is an important point as it identifies two fundamental dimensions of
performance. In terms of effectiveness, achieving a higher level of product reliability
might lead to greater customer satisfaction and in terms of efficiency, it reduces the cost
incurred by the business through decreased field failure and warranty claims.
In SCM context, performance measurement can further facilitate inter-understanding
and integration among the supply chain members. The measurement results reveal the
effects of strategies and potential opportunities in SCM (Nudurupati, et. al., 2011) .
There are many publications that have addressed performance measurement in SCM.
The literature on business performance measurement (BPM) emphasizes poor use of
PMS in SMEs, but little research investigates the reasons for this. Some of the reasons
mentioned in the literature include shortage of human and capital resources, lack of
strategic planning, misconception of the benefits of performance measurement and an
overly technical orientation (Barnes et al., 1998). There are two main measures into the
performance measurement field; the traditional performance measure and the non
traditional performance measure (Operational performance measure). The researcher
discusses the two types of performance measurements in more detail in the following
sections.
I- Traditional Performance Measure
Traditionally, performance measures have been primarily based on management
accounting systems. It focused on the financial indicators such as profit, return on sales,
price variances, sales per employee, and return on investment. This approach received
considerable criticism since the stress was only on the financial indicators. Critics
argued that focusing on financial indicators only may lead to promoting short-term
thinking (Hayes and Garvin, 1982; Kaplan, 1983). Johnson and Kaplan (1987) were
among the first authors to criticize the traditional performance measurement cost

80
accounting-based approach, thus underscoring the need for integrated performance
measurement approach. Carlos F. G. et. al (2006) states that the cost accounting
approach focused on the minimization of variance rather than continuous improvement.
For the purpose of further understanding of these different financial performance
indicators, a brief description is given.
1-Return on Investment
Profits/Investment (ROI) is probably the single most commonly used and studied
measure of financial performance. Much of the popularity of ROI undoubtedly arises
from its simplicity and ability to be generalized. ROI provides a performance measure
that can be applied (at least conceptually) to virtually any business. The primary
disadvantage of ROI concerns its sensitivity to accounting dimensions. In the process of
simplifying the evaluation of an entire business operation down to profits/investment,
many inexact accounting measurements are combined.
2-Market Share Market share is often used as a key indicator of industry growth (David, 2001). It also
used to describe the position and success of a firm in an industrial sector. Gale and
Buzzell (1993) suggest that market share can be an important determinant of
profitability in the medium to long term.
While the impact of market share is not always reflected in a firm’s profitability or
performance, many firms see it as an important organizational goal. The analysis shows
that firms with increased market share are likely to have higher performance and in
particular achieve enhanced financial performance, greater customer retention and
customer satisfaction. This applies to all firm sizes. The implication is usually that the
bigger the market share, the more successful the firm. This is not surprising, as firms
with market leader status tend to derive profitability from their economies of scale
capability as well as their established branding (Armstrong and Collopy, 1996).

81
3-Cash Flow Many managers have replaced evaluation techniques based on profits (ROI) with
techniques based on cash flows. The prevailing argument for this switch is that cash in
hand, not accounting profits, is what can be spent or invested, and cash flow is therefore
the more important financial measure to monitor. There are two primary categories of
techniques based upon the analysis of cash flows:
1) Discounting projected cash flows, and
2) Balancing cash flows across a portfolio of diverse business units.
The literatures highlighted number of limitations with financial performance. These
limitations could be classified into two categories: general limitations due to the overall
characteristics and limitations specific to certain traditional performance measures such
as productivity or cost. Both of these types of limitations make traditional performance
measures less applicable in today’s competitive market.
Alaa et. al.,(1996) discussed the main eight most commonly cited limitations; The most
significant limitation of traditional performance measures is that they are based on
traditional management accounting systems in which labor was the major cost driver
that management accounting systems emphasized and other costs were de-emphasized
by putting them together in one overhead category. However, today the average labor
cost component rarely exceeds 12 per cent while overhead is usually 50-55 per cent of
the manufacturing cost. Since in this case overhead is allocated based on the minor cost
element of direct labor this allocation approach is not valid.
Lagging metrics The financial reports are generally compiled on a monthly basis.
Therefore, they are lagging metrics that are the result of past decisions. As a result, it is
considered too old to be useful for operational performance assessment.
Corporate strategy: Traditional performance measures do not incorporate strategy.
Rather the objectives have been to minimize costs, increase labor efficiency and
machine utilization.

82
Relevance to practice: Traditional performance measures try to quantify performance
and other improvement efforts in financial terms. Yet, most improvements efforts are
difficult to quantify in dollars (i.e. lead time reduction, adherence to delivery schedule,
customer satisfaction and product quality). As a result, traditional performance measures
are often ignored in dimention.
Inflexible: Traditional financial reports are inflexible in that they have a predetermined
format which is used across all departments.
Expensive: The preparation of traditional financial reports requires an extensive amount
of data which is usually expensive to obtain.
Continuous improvement: Fisher (1992) argues that setting standards for performance
measures in general conflicts with continuous improvement. “If standards were not
carefully set, they had the effect of setting norms rather than motivating improvement.
Workers may hesitate to perform to their maximum if they realize that the standard for
upcoming periods may be revised upward by current results.”
Customer requirements and management techniques: Maskell (1998) argues that
traditional performance measures are no longer useful, since, in order to meet customer
requirements of higher-quality products, shorter lead time and lower cost management
have given the shop floor operators more responsibility and authority in their work.
Consequently, traditional financial reports used by middle managers do not reflect a
more autonomous management approach.
II- Non - Traditional Financial” Performance Measures Under the today influence of globalization and in spite of shortcoming of the financial
performance measure which fails to clearly distinguish various levels such as strategic,
tactical and operational especially in a supply chain. There is pressure to identify and
report new, non-traditional, and “non-financial” measures of performance to get at
newly recognized dimensions of enterprise value, success, and significance. These new
demands emerge from a belief that social, environmental, ethical, and geopolitical
factors materially impact the ability of a company or enterprise to perform favorably.

83
Kaplan and Norton, among others, argue that a firm needs a balanced set of measures
covering the financial and non-financial dimensions of performance.
The use of non-financial metrics is crucial in measuring and fostering improvement of
performance of supply chains. The main advantages of these non-financial measures
include their flexibility and ability to take into consideration soft aspects linked to
empowerment, trust and continuous improvement. It helps decision makers evaluate the
success of the company’s strategy and identify potential problems (Kaplan and Norton,
1996). Betchel and Jayaram (1997) claim that integrated measures, which are cross
functional have to be used as they avoid optimization at one point in the chain without
considering the potential consequences at other points on the chain. Remko (1998)
argues that non-financial measures have to be developed as they supplement financial
measures. They are very crucial and include a wide range of organizational and supply
chain participants.
The characteristics of emerging performance measures have been discussed recently
in the literature. The characteristics that have been mentioned include: measures
related to manufacturing strategy; primarily non-financial measures (i.e. operational) so
they can provide managers, supervisors, and operators with information required for
daily decision making; simple measures so that shop floor operators can easily use
and understand them; measures should foster improvement versus just monitor it;
and measures should change as is required by a dynamic marketplace.
Alla et al. (1996) has outlined the major attributes of non-financial measures which is
their greater emphasis on a holistic and strategic approach. They should therefore be:
• based on organization's strategy and needs;
• applicable to concepts such as JIT, TQM, SCM and other approaches
used by the organizations;
• intended for all employees;
• lead to employee satisfaction;
• flexible; and
• Vary between locations of the organizations.

84
The differences between traditional and non-traditional performance measures are
summarized in Table 2-7.
Table 2-7: Differences between Traditional and Non-Traditional Performance Measures
Source Alla et al. (1996)

85
2- Performance Measurement Models Different supply chain performance measurement models have been developed in order
to give an overall view of companies’ performance and to guard against sub-
optimization (Dong, 2011).These integrated systems are appropriate for a world-class
manufacturing firm in many aspects. The following sections will discuss three such
systems. 2-1 Supply Chain Operational Reference (SCOR) Model The Supply Chain Council developed a straight forward framework for identifying,
evaluating, defining and implementing performance measurement system. The model
was created to respond to three primary practitioner needs:
1. Common definitions, processes and measurements.
2. A methodology linking business objectives, strategic and tactical with supply chain
operations
3. A systematic approach for identifying, evaluating and monitoring supply chain
improvement projects.
The starting point for the SCOR Model is a process description that is based on four
basic management processes (Plan, Source, Make, Deliver), Figure 2-3. From these four
processes a hierarchical model has been developed that can describe any supply chain
by describing the elements and relationships within that chain. It is important to note
that the process elements and descriptions associated with those elements are provided
in standardized descriptions within the Model. The hierarchical model extends through
three levels allowing the modeling organization to configure its modeling efforts to its
unique supply chain and organizational elements.
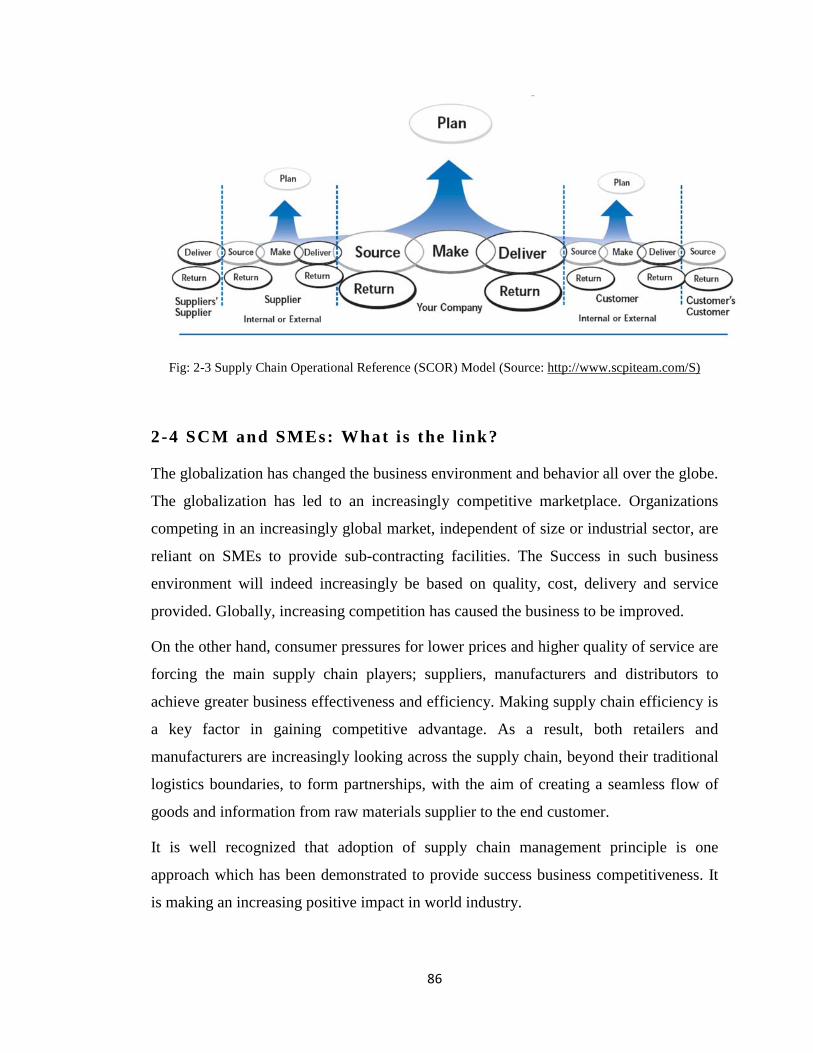
86
Fig: 2-3 Supply Chain Operational Reference (SCOR) Model (Source: http://www.scpiteam.com/S)
2-4 SCM and SMEs: What i s the l ink?
The globalization has changed the business environment and behavior all over the globe.
The globalization has led to an increasingly competitive marketplace. Organizations
competing in an increasingly global market, independent of size or industrial sector, are
reliant on SMEs to provide sub-contracting facilities. The Success in such business
environment will indeed increasingly be based on quality, cost, delivery and service
provided. Globally, increasing competition has caused the business to be improved.
On the other hand, consumer pressures for lower prices and higher quality of service are
forcing the main supply chain players; suppliers, manufacturers and distributors to
achieve greater business effectiveness and efficiency. Making supply chain efficiency is
a key factor in gaining competitive advantage. As a result, both retailers and
manufacturers are increasingly looking across the supply chain, beyond their traditional
logistics boundaries, to form partnerships, with the aim of creating a seamless flow of
goods and information from raw materials supplier to the end customer.
It is well recognized that adoption of supply chain management principle is one
approach which has been demonstrated to provide success business competitiveness. It
is making an increasing positive impact in world industry.

87
SMEs are not exempted from the pressure of globalization and market competition.
Drihlon and Estime (1993) argue that improving competitiveness is now an imperative
for small and large businesses alike regardless of their industry or location.
However, many SMEs firms have been strongly and positively impacted by the growing
tendency of the larger pressure firms to outsource some of their activities. The role of
the smaller firms as suppliers to the larger firms places a substantial burden on the small
companies to become world class and embrace the principles of supply chain (Simons
and Kerr, 1993). That means if an SME wants to be a key player and any supply chain
process wants to prosper into the twenty-first century, they need to be aware of the
importance of their competitive advantage and performance improvement (Forza and
Filippini, 1998) and exert conscious and sustained effort to continuously improve all
facets of their business operations in order to increase their competitiveness. Empirical
evidence supports the argument that focusing on supply chain management not only can
substantially improve its performance (Peters and Austin, 1985); but may well be the
key to survival.
The role of supply chain is widely recognized as being a critical determinant in the
success and survival of both manufacturing and service organizations in today’s
competitive environment, and thus, has focused attention on its effectiveness. In a
number of organizations, cost-effective supply chain is a matter of survival. The
globalization of some sources makes it essential that the professional practice is improved
and regarded as a key element in the preparation of company or organization strategies
(Quayle, 1998; Beamon, 1999).
Supply chain is also seen as a source of competitive advantage (Powel, 1995; Hackman
and Wageman, 1995; Douglas and Judge, 2001), innovation (Singh and Smith, 2004),
change and new organizational culture (Irani et al., 2004). Any decline in customer
satisfaction due to poor service quality would be a serious cause of organizational
failure.
Supply chain management (SCM) is a philosophy and presents a business system that
companies should adopt to achieve organizational excellence. There is a perception that
large organizations have traditionally led the way in the implementation of modern
88
management; the smaller ones always being followers and have lagged behind.
Literatures survey showed that the majority of SMEs addressed supply chain issues
partially and informally.
In more recent years the importance of supply chain management to the smaller firm has
become a significantly recognized. They participate in value creating activities, especially
for larger firms. They supply raw materials, produce products, and distribute finished
goods to customers. Through their efforts, SMEs have significant impacts on supply
chain processes (Huin et al., 2002). SMEs are often suppliers of goods and services to
larger organizations. Increasingly, they have felt the impact of the quality programs
imposed on them. The lack of product quality from SMEs adversely affects the
competitive ability of the larger organizations. Because of this reason the larger
companies have insisted that their small suppliers adopt TQM of their own (Barrier,
1992; Ghobadian and Gallear, 1996).
Many studies of supply chain management focus on the practices of large firms, while
small firms are treated mostly from the viewpoint of larger firms (Chopra and Meindl,
2001; Kukalis, 1989; Lambert and Cooper, 2000).
Various suggestions have been made to help small to medium-sized enterprises (SMEs)
implement SCM (Ghobadian and Gallear, 1996; Brown, 1993; Lee and Oakes, 1995;
Husband and Mandal, 1999). Literatures suggest that smaller organizations with limited
resources can equally apply the supply chain principles with measurable success, and
without undue expense.
Many studies found that supply chain could be used by SMEs with considerable
success. Studies by Spekman et al (1998) and Quayle (2003) found that the introduction
of supply chain has helped in reducing costs without compromising on customer
satisfaction levels. According to Alam, A. (1996), the perceived and realized benefits of
SCM system consists of tangible and intangible benefits. The tangible benefits of SCM
implementation include shortening the product development life cycle, increasing on-
time order delivery, reducing production costs, improving quality, reducing inventory,
and bettering inventory management. On the other hand, the intangible benefits include
improving service quality, faster response to customer needs, sharing and exchanging

89
information, providing information accurately, timely, and consistently. Tan et al.
(1998) sought a relationship between firms’ SCM practice and their performance. They
were able to show positive and significant correlation between certain SCM practices
and performances of their respondent firms. Soonhong Min et al (2005) argued that,
Supply chain improves Business chain collaboration. The expected outcomes of supply
collaboration could be Supply chain capabilities that include better demand planning
(McCarthy, T.M., Golicic, S.L. (2002), inventory visibility ((Sabath, R.E., Fontanella, J.
(2002), and new knowledge and skills Verespej, M. (2005); Supply chain efficiency
measured in reduced inventory and cost savings (Sabath, R.E., Fontanella, J. 2002), and
Supply chain effectiveness including improvements in customer responsiveness
(Sabath, R.E., Fontanella, J. 2002), and better access to target market segments
McCarthy, T.M., Golicic, S.L. (2002).
2-5 Summary
In summary, this chapter reviewed the existing literature in the supply chain
management field. It found that supply chain management evolved from different
disciplines. The literature provided a historical evolution background for better
understanding the subject. The literature provided different definitions and descriptions
of supply chain management that developed over the time. The body of knowledge in
this subject presented numbers of benefits that organization could gain for the effective
adoption of proper dimensions.
Supply chain dimension is a key concept in the supply chain literature. The dimensions
aimed at effectiveness the organizations through the appropriate selection and
implementation.
Different supply chain dimensions were discussed and research survey questionnaires
were developed by reviewing the existing literature. These survey questionnaires are
now taken forwards in chapter four.

90
CHAPTER THREE
SAUDI ARABIA BACKGROUND AND MANUFACTURING SMEs
SECTORS
This chapter gives a glance on Saudi Arabia profile. It reviews the geographical and economical position of the country. The chapter sheds light on the country’s SMEs and the role of its manufacturing enterprises in the economy and the employment prospects. Furthermore, it discusses the support strategy of the country to its SMEs in order to contribute better o the country economy. In second section of this chapter, small and medium enterprises sector is discussed in more detail. Definition, characteristics, the importance and roles are the studied areas .The link between supply chain management and SMEs enterprises are discussed in the last part of this chapter. It attempts to show how SMEs benefit from adopting the supply chain management system. 3-1 Background /Geographical Factors Saudi Arabia, formally known as the Kingdom of Saudi Arabia, is identified as the
birthplace of Islam and the site of Islam’s two holiest shrines in Mecca and Medina. The
modern Saudi Arabia was founded on September 23, 1932, which is commemorated as
its National Day. Saudi Arabia is the largest among the Arabian Peninsula countries. It
is approximately 830,000 square miles (2 million square kilometers) in size. It is
bounded on the north by Jordan, Iraq and Kuwait, the east by Qatar, and The United
Arab Emirates, the west by the Red Sea, and the south by Oman and Yemen. Riyadh is
the capital of Saudi Arabia. Saudi is comprised of 13 provinces and has five major
geographical regions, namely:
• The great Rub al Khali: a sand desert taking up the entire south/southeast area.
• The Nejd: an enormous, infertile plateau situated in the center of Saudi and
stretches out to the northeast.
• The Hejaz and Asir: mountainous areas that run parallel to the coastal plain
along the Red Sea, and which gradually increase in elevation.
• The Eastern Province: the location of Saudi’s rich oil reserves situated along the
Persian Gulf.

91
Saudi Arabia has one of the highest population growth rates in the world, and increased
from about three million in the 1950’s to almost 28 million in 2010. Its growth rate is
estimated as 1.848% in 2009 and is projected to continuously grow with almost same
rate. The Figure below (Figure 3-1) shows ten years population growth change from the
year 2000 to 2010.
Fig: 3-1 Ten years population growth changes from the year 2000 to 2010.
Source: Ministry of Planning, 2009
An overwhelming majority of the Saudi population is young. According to the Saudi
Ministry of Planning, 46 percent of the population was under 15years. Another 38
percent was under 40 years. Those over 40 years accounted for only 16 percent of the
population.
Saudi Arabia needs to create a work force from among its own nationals which has the
skills necessary to meet the requirements of the modern global economy. Labor force
will grow from 3.1 million workers in 1999 to 4 million in 2020 an estimated growth
rate of 89.2% in the coming 20 years.
Saudi Arabia is considering investing $400 billion in 2008-2013 to improve
infrastructure and build new industries to accommodate the rising numbers of young
adults entering the workforce.
Approximately 100,000 Saudis enter the job market every year and this number grows,
particularly as more young generation take up their position in the labor force. The
1994199619982000200220042006200820102012
YEAR
POPULATION


93
Source: JADWA INVESTMENT, 2010
I- Saudi Arabia Export Oil accounts for more than 90% of the country's exports and nearly 75% of government
revenues. Non-oil exports increased to $16 billion in 2005 from $12.8 billion the
previous year and went over $30 billion in 2008, making a growth of 10% over the
previous year (export centre, 2010). The total export value for oil and non- oil products
is shown in the Figure 3-2.
Fig: 3-2 The total export value for oil and non- oil products, Source: Trading Economics, 2010
While petrochemical production from Jubail and Yanbu accounts for about two thirds of
Saudi industrial non-crude oil exports, sectors such as metal products, electrical goods,
machinery and industrial equipment, construction materials, wood products, textiles and
garments as well as food and beverages are growing in importance.

94
II- Saudi Arabia Import The Government of Saudi Arabia uses oil revenues to aid in building the country
infrastructure and to increase the import of commodities and general goods. The
government expenditure rose from 55% of GDP in 2003 to 60% in 2007. Saudi Arabia
remains a key market for most countries in the world.
The Kingdom of Saudi Arabia imports different commodities and goods. The most
significant imports in 1995 for example are capital goods with electrical and mechanical
equipment providing 22% and transport equipment (cars and other transportation) 14%
of total import values. Imports of foodstuffs stood at 16% of import values, with textiles
and clothes at 8%. The structure of imports changes from year to year depending on the
needs and varies from sector to sector.
Saudi Arabia’s imports have strong correlation with the government expenditures
(Figure 3-3). For example, the import values in 1983 represented almost 50% of the
value of Gross National expenditure; by 1995 this proportion had fallen below 25%.
Consequently, imports have become much less important to the Saudi economy
resulting from the growing self-sufficiency-that is import substitution has taken place.
Fig: 3-3 Saudi Arabia Import, Source: Trade Economics, 2010
3-3 Saudi Arabia Support for SMEs Saudi Arabia aims to ensure that future growth will continue to be sustainable,
benefiting all citizens, maximizing its integration in the global economy. Therefore, the
Government intends to reduce the dependence on the production and export of crude oil,

95
which is a delectable resource and is subject to fluctuations of the world markets, and
diversify its economic base. Toward that end, the government became concerned about
the key success factors needed to build a successful and sustainable economic strategy
plan. These factors were highlighted in the Seventh Development Plan emphasized
development of human resources, provision of work opportunities, and expansion of
citizens’ participation in ownership of productive assets, as well strengthening the role
of the private sector. Privatization of some public services and facilities was started
within the framework model of a comprehensive privatization strategy. The government
Ninth Development Plan called for independent authority for small and medium
enterprises (SMEs) in the light of their importance in economic development
(www.zawya.com).
The government’s interests shifted from controlling to a supporting strategy for SMEs.
This support for the SMEs owed to its role in achieving strategic and economic goals of
the country and their success was needed to sustain competitiveness, quality growth,
and lasting prosperity. The government has adopted several measures and initiatives to
support and develop the SMEs including the development of the required infrastructure,
construction of Jubail and Yanbu industrial cities, and construction of industrial cities in
various regions of the Kingdom. Also, founding the Saudi General Investment Authority
(SAGIA), the Saudi Industrial Development Fund (SIDF) sponsors SMEs, and Saudi
commercial banks provide loans to SME’s implementation, and continued provision of
other industrial support and incentives. The response and cooperation of the private
sector with the governmental plans and efforts have an effective impact on actualization
of the industrial development's achievements. The role of the government initiatives
toward supporting the SMEs sector is described below.
I- The Saudi Industrial Development Fund (SIDF) The Saudi Industrial Development Fund (SIDF) was established in 1973 with the
specific objective of supporting the development of the private industrial sector. SIDF
accomplishes this objective through provision of financial assistance in form of short-
term loans to industrial investment along with technical, administrative, financial and

96
marketing advices to borrower enterprises. The specialized advice rendered positively
contributes to improvement of projects' performance and assists them in overcoming the
problems they encounter.
Among SIDF's prime objectives in the context of industrial development in the
Kingdom are;
The achievement of a good return on investment
A suitable added value
Replacement of imports by local products
Promotion of non-oil industry related exports
Realization of industrial integration
Creation of employment opportunities for Saudi nationals
Exploitation of the Kingdom’s natural resources and raw materials
The attraction of foreign capital as well as the transfer of technology
Protection of the natural environment
SIDF’s main achievements (By the end of 2006)
US$ 15.5 billion total loan commitments.
1,999 Industrial projects.
558 Industrial Join-Venture projects.
Foreign capital share in SIDF Financed Projects represents 32% of their capital.
II- The Saudi Arabian General Investment Authority (SAGIA) The Saudi Arabian General Investment Authority (SAGIA) was created by the Saudi
Government on April 10, 2000 as part of measures geared towards formalizing the
process of economic liberalization. SAGIA is responsible for managing the investment
environment in the Kingdom. Its objective is to achieve rapid and sustainable economic
growth by creating a pro-business environment, providing comprehensive services to
investors and fostering investment opportunities in key sectors of the economy,
including energy, transportation, ICT and knowledge-based industries.

97
The institution is committed to supporting new and growing business in the country.
Toward this commitment, SAGIA with other international institutions like Bahrain-
based Islamic investment bank Venture Capital Bank, and international investment
house Global Emerging Markets have signed a memorandum of understanding to
establish an independent venture capital investment company.
The objective of the new company is to provide growth capital and late stage financing
to venture capital opportunities and SMEs in Saudi Arabia.
Venture Capital Bank is the main promoter of the new company, whereby the Bank
owns a significant stake in the new company and raises the rest of the capital from
strategic Saudi investors, and high-net-worth individuals and corporate investors from
other GCC countries.
Venture Capital Bank also serves as an advisor to the new company. It utilizes its
strategic relationship with Global Emerging Markets to ensure that the new company
follows international best practices, according to a statement.
III- Chamber of Commerce The Small and Medium Enterprises Development Centre at Asharqia Chamber of
commerce function as a strategic channel for the development of SMEs in the country.
The Center was established as stated in its web site, with the objective of strengthening
the spirit of initiatives between the people of the Province as well as supporting an
active and important economic sector, the small and medium enterprises. The center
aims to reach this objective by offering incentives and various programs, among them an
award presented in the promising economic sectors in order to promote the society of
initiators and business owners by working hand in hand to allow them to take more steps
forward with greater success. The centre’s mission is to provide high quality and
valuable services to enhance the competitiveness of SMEs.
98
The Small and Medium Enterprises Development Centre at Asharqia Chamber
established to help the SMEs with the following activities;
To provide information to help startups and SMEs.
To adopt innovative business ideas and give the opportunity for the
implementation.
To help launching new businesses through franchising.
To provide free consulting and advisory services in fields such as: finance and
marketing for start-up and existing SMEs.
To hold lectures, seminars, and workshops that help increase the awareness
about the important role of SMEs in the economy and interested issues.
To provide investment opportunities and feasibility studies.
To organize the chamber's entrepreneurship development programs to help
potential entrepreneurs start their business in right way.
To provide specific short-term training programs in selected topics to enhance
the competitiveness of SMEs.
To arrange the chamber's best performance SMEs award in selected sectors.
To coordinate with the financial and supporting institutions to help start up
entrepreneurs & SMEs.
IV- Small and Medium Enterprises Funding Guarantee Program Inability to obtain appropriate funding comprises a major obstacle of development of the
small and medium enterprises sector. Commercial banks are unwilling to provide the
necessary funding for these enterprises. They believe that extending loans to such
enterprises incorporates high credit risks stemming from the followings:
Inability of small & medium enterprises to provide the required guarantees.
Lack of credit history especially for start-up enterprises.
Low or weak managerial skills & poor planning for sponsors of SMEs.
The program is established to close the gap and resolve the market shortage in the
Kingdom and thus help small and medium enterprises get the appropriate funding
through minimizing credit risk.

99
The program was established with a capital of SR 200 million. The Ministry of Finance
contributed a hundred million; current ten local banks contributed the remaining
amount. Hence, the program stands on three pillars:
The government, represented by the Ministry of Finance and the Saudi Industrial
Development Fund.
The commercial banks and funding institutions.
Small and medium enterprises (SMEs).
The program’s primary function is to provide guarantees to financial institutions to
minimize the risk inherited in lending to this sector. Therefore, the program will
guarantee 75% of the loan amount in exchange for collaterals including mortgage on the
fixed assets of the enterprise in favor of the lending institution. These collaterals are
held in the position of the Fund until the loan is fully repaid after which they are
released to the enterprise.
V- New Initiatives The Kingdom's Ninth Development Plan is to be implemented from 2010 to 2019 by the
Ministry of Economy and Planning. In the Ninth Plan, a major emphasis is being placed
on balanced development of human, social, economic and environmental resources.
The development plan also focuses on improving the living standard of citizens,
developing local human resources, ensuring an integrated development in all regions
and creating competitiveness among manufacturers of national products.
3-4 The Current State of Industry in Saudi Arabia Saudi Arabia has a robust economy that experienced rapid growth but remains largely
dependent on the production and exportation of oil. However, since 1973, the Saudi
Arabian economy has experienced a rapid shift from oil sector to non-oil sector activity
(Al-Sahlawi, 1991; AlFarsy, 1991). The seventh plan (2000-2004) focuses more on
economic diversification and a greater role of the private sector in the Saudi economy.

100
SMEs in Saudi Arabia are the main source of private sector investment. Their role in
industrialization has been largely focused mainly to light and medium-sized
manufacturing units operating in the service, trade, and manufacturing sectors. SMEs in
Saudi Arabia represent almost 93 percent of total enterprises and employ over 80
percent of the work force. There are estimated 500,000 registered SMEs in the
Kingdom, about a third of them are in Eastern Province. They are expected to contribute
more than 50% of total industrial production. They are the only means by which the
Saudi economy can diversify itself.
Saudi Arabia has played an instrumental role in developing the manufacturing sector of
the country by directly investing in industrial plants in Jubail and Yanbu, mainly in the
basic industrial sector, such as petrochemical, steel, and other large manufacturing
enterprises.
In 1975 the Royal Commission for Al Jubail and Yanbu was developed. The
commission was given authority to plan, construct, manage, and operate the
infrastructure needed to support the basic industries the government intended to build
and to satisfy the community needs of the work force employed in these industries. The
commission was also to promote investment in secondary and supporting industries, to
develop effective city government, and to train Saudis to take over as many jobs as
possible.
The commission started by developing the basic industry under the name SABIC.
SABIC was founded in 1976 as the fruit of an ambitious vision of the government of
Saudi Arabia toward less dependence on the oil and gas industry. Natural gas, a
previously useless by-product of oil extraction has historically been wasted through
environmentally damaging flaring. The vision has been to transform it into valuable
petrochemical products that could be supplied to the world. There are twenty one
companies operating under SABIC umbrella which most of them use the wasted natural
gas in their production.
In addition to the development of the basic industries in Jubail and Yanbu, the
commission encourages the private sector to invest in support industries. As result of

101
this initiative, by 1999, it had more than 17 basic industrial plants, 13 secondary
industrial plants and 110 supporting and light industries plants. Al Jubail benefited from
the massive petrochemical projects of the Saudi Basic Industries Corporation (SABIC).
Yanbu is a major industrial site with a modern port from which products manufactured
locally and in other areas of the Kingdom are exported. Yanbu had thirty six (36)
secondary industrial plants and 108 supporting and light industrial plants by the end of
1999.
Stage one of the $5.9B development of Jubail Industrial City-2 will be completed by the
end of 2023 for the all three stages.
The development is expected to generate foreign direct investment totaling $56B and
provide employment for 55,000 people as well as another 330,000 indirect job
opportunities.
The government’s efforts to promote the industry in the country extended to the private
sector.
Under the guidance of the government, the Saudi Industrial Property Authority
“MODON” was established as the official authority to plan, construct, manage, and
operate the infrastructure needed to support the basic industries the private sector
intended to build and to satisfy the community needs of the work force employed in
these industries.
Since its establishment in 1970, the Saudi Industrial Property Authority “MODON” has
developed a huge industrial land through the kingdom. The following table (Table 3-2)
shows the area of the industrial lands developed in the period between 1970 and 2010.

102
Table 3-2 the developed industrial lands in the Kingdom
the developed industrial lands in the Kingdom
AREA OF DEVELOPED
INDUSTRIAL LAND
(SQUARE METERS)
PERIOD
1,440,000 1970-1975
32,475,500 1976-1990
6,966,244 1991-2000
1.600.000 2001-2007
28.500.000 2008-2010
71 million square meters TOTAL
The Saudi Industrial Property Authority “MODON” successes in developing 18
industrial cities in different regions of Saudi Arabia;
1) Riyadh 1 2) Riyadh 2 3) Jeddah 1 4) Jeddah 2 5) Dammam 1
6) Dammam 2 7) Makkah, 8) Qassim 9) Ahsa, 10) Madinah,
11) Assir, 12) Al-Jouf, 13) Tabuk,
14) Hail,
15) Najran
16) Al-Kharj,
17) Jazan,
18) Ar’ar, 19) Sudair
Saudi Arabia's industrial base has expanded enormously since the Kingdom's first oil
boom in the 1970s with the number of operating factories increasing from less than 500
in 1975 to 4,600 by 2010. Capital invested in these similarly has risen from $2.6 billion

103
to $108 billion by 2010. There is a tangible economic benefit with exports of non- oil
products amounting to $21B in 2006.
The average annual growth rate of the value added by manufacturing industries
exceeded 8% during the past thirty years. Industry and manufacturing now provide
employment for some 528,000 people by end of 2010.
The industrial sector has been developed since 1981. The development has covered
different types of industries; metallurgical industry, chemical, plastic products, Chinese
porcelain, building materials, textiles and garments, food and other activities.
Table 3-3 hereunder provides the detail of industrial development from 1981- 2006
along with different industrial sector.
Table 3-3 The development of operating factories between (1981-2006)
The development of operating factories between (1981-2006)
INDUSTRIAL SECTOR 1981 1985 1989 1994 2001 2006 Manufacture of food and beverages 144 216 275 346 539 605
Textile, wearing apparel and leather industries 15 25 40 81 167 192
Manufacture of wood and wood products including furniture
27 46 70 100 174 191
Manufacture of paper products, printing and publishing
70 104 119 148 211 229
Manufacture of chemicals and petroleum, coal, rubber and plastic
116 200 273 399 693 895
Manufacturing of construction materials, chinaware and glass
225 309 359 439 570 618
Basic metal industries 4 6 8 10 12 618
Manufacture of fabricated metal products, machinery and equipment
226 361 484 633 948 463
Other manufacturing industries 10 25 45 57 83 79
Transport and storage 13 21 21 21 16
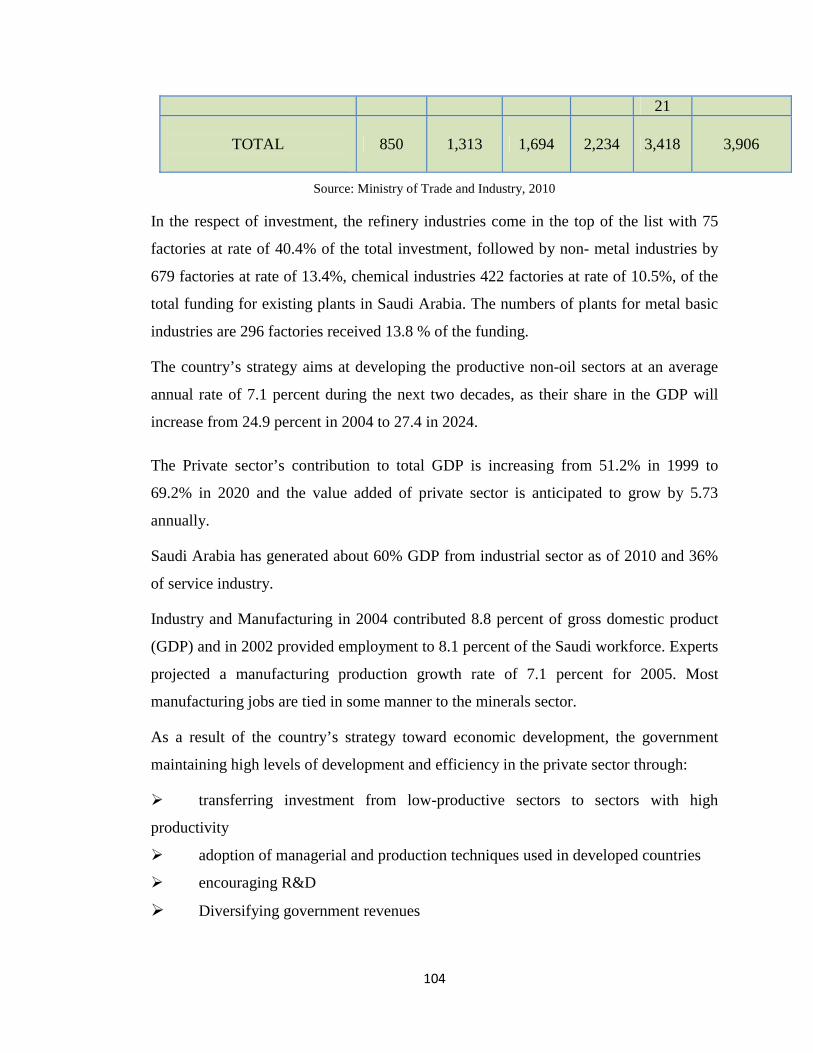
104
21
TOTAL
850 1,313 1,694 2,234 3,418 3,906
Source: Ministry of Trade and Industry, 2010
In the respect of investment, the refinery industries come in the top of the list with 75
factories at rate of 40.4% of the total investment, followed by non- metal industries by
679 factories at rate of 13.4%, chemical industries 422 factories at rate of 10.5%, of the
total funding for existing plants in Saudi Arabia. The numbers of plants for metal basic
industries are 296 factories received 13.8 % of the funding.
The country’s strategy aims at developing the productive non-oil sectors at an average
annual rate of 7.1 percent during the next two decades, as their share in the GDP will
increase from 24.9 percent in 2004 to 27.4 in 2024.
The Private sector’s contribution to total GDP is increasing from 51.2% in 1999 to
69.2% in 2020 and the value added of private sector is anticipated to grow by 5.73
annually.
Saudi Arabia has generated about 60% GDP from industrial sector as of 2010 and 36%
of service industry.
Industry and Manufacturing in 2004 contributed 8.8 percent of gross domestic product
(GDP) and in 2002 provided employment to 8.1 percent of the Saudi workforce. Experts
projected a manufacturing production growth rate of 7.1 percent for 2005. Most
manufacturing jobs are tied in some manner to the minerals sector.
As a result of the country’s strategy toward economic development, the government
maintaining high levels of development and efficiency in the private sector through:
transferring investment from low-productive sectors to sectors with high
productivity
adoption of managerial and production techniques used in developed countries
encouraging R&D
Diversifying government revenues

105
3-5 E Eastern Province Industry Eastern Province is a home land for the first and second industrial cities in Saudi Arabia.
The estimated number of productive factories in the area is 880 factories till 2006 which
representing 22.5% of the total of productive factories in Saudi Arabia for the same
period, with invested capital reached more than SR140 billion Saudi Riyals. Table 3-5
shows the comparative industrial development for the last ten years.
Table 3-4 The comparative industrial development for the last ten years
. Source: Ministry of Trade and Industry, 1999
As such the Eastern Province is considered the third city after Riyadh and Mecca in
number of factories and ranks the first in the total invested capital.
In summary, the small and medium enterprises (SMEs) sector has tremendous resources,
which qualifies it to play a major role in the economic development of our nation. The
experiences of many nations, developed, developing or underdeveloped alike, proved
the comparative industrial development for the last ten years
TOTAL NO. OF FACTORIES IN EP TOTAL NO. OF FACTORIES IN SA YEAR
632 2598 1996
651 2688 1997
745 3163 1998
761 3300 1999
790 3418 2000
806 3521 2001
829 3601 2002
848 3652 2003
858 3723 2004
876 3877 2005
880 3906 2006

106
the effectiveness of this sector in lifting up their economies. In Saudi Arabia, this sector,
if handled correctly, plays important economic roles, particularly in manpower
employment, in increasing and diversifying the gross national product, in minimizing
adverse effects of cyclic economic fluctuations and in vitalizing & energizing the market
and the business community as a whole. Further benefit is the contribution towards
improvement of the economic and social development of the remote regions of the
Kingdom.
3-6 Small-Medium-sized Enterprise (SMEs) The Small-Medium-sized Enterprise (SMEs) sector is an important part of any national
economy (Storey, 1994). It contributes to economic growth, both regional and national.
In Europe, while industrial giants continue to slash jobs, high-growth SMEs are
creating thousands of new jobs in manufacturing and services (Flynn, 1998). They
constitute a large part of the economy in most countries, dominate the industrial and
commercial infrastructure and have significant roles in economic growth (OECD, 1996;
Tetteh and Burn, 1999; Curran and Blackburn, 2001). In developing countries, SMEs
continue to play a critical role in their country’s industrialization program through the
strengthening of both forward and backward industrial linkages.
They are not only providing job opportunities, but also, acting as suppliers of goods and
services to large organizations, and any lack of their product quality could adversely
affect the competitive ability of the larger organizations (Rose, 2000; Greenan et al.,
1997; Ghobadian and Gallear, 1996; Parkin and Parkin, 1996; Storey, 1994). In
manufacturing sector, SMEs act as specialist suppliers of components, parts, and sub-
assemblies to larger companies because the items can be produced at a cheaper cost
than the large companies could achieve in-house.
With dramatic change towards global market orientation and trade liberalization, most
of the business people realize the vital role of SMEs. The SMEs assume these roles by
complementing the activities of the large-scale industries through integration into the
mainstream industrial development.

107
Larger organizations are reliant on SMEs, as they represent an essential element of their
supply chain. They provide sub-contracting facilities, provide essential inputs and
components that will form the critical linkage between industries, and have a vital role
in operating these supply chains effectively, as satisfying the demands of any market
rarely depend upon a single organization. Usually it depends on a network of suppliers,
most of which will be SMEs, each carrying out its own role effectively as part of a
larger, overall supply chain. At each stage in the supply chain, the integration between
each organization is a key method of improving the performance of the whole system.
Each ‘link’ in the chain presents opportunities to both, satisfy or to disappoint the
customer. Thus, SMEs can favorably influence the competitiveness of large
organizations.
It is envisaged that with the growth of SMEs, industrial base will be strengthened
further leading to enhance the nation’s economy. It is, therefore, imperative for SMEs
to meet quality standards, as large organizations need assurance of high quality goods
and services from SMEs. The importance of the small and medium industries will
become more significant as the developing and underdeveloped countries expand their
industrial base in meeting the challenges of the new market trend.
3-6.1 Small and Medium Enterprises Definition At present, there seems to be no consensus on the definition for SMEs. Variations exist
among countries and industries. Storey (1994) argued that there is no single, distinct
and uniformly acceptable definition of a small firm. When reviewing the literatures one
comes across an array of definitions like:
1- Bolton Committee’s definition (1971) which is the most acceptable
definition within the academic context. In this report, business sector is the
determinate criteria of the definition.
2- European Commission definition for SME has to satisfy the criteria for the
number of employees and one of the two financial criteria, i.e. either the
turnover total or the balance sheet total. In addition, it must be independent,

108
which means less than 25% owned by one enterprise (or jointly by several
enterprises).
3- The Department of Trade and Industry (DTI). It used the number of
employees of an organization to distinguish different business sectors.
This difference in the definition is because employment, turnover and capitalization
vary among different industries. Additionally, any size definition that relates standard
measures of size at a particular activity level may be relatively small or large in
comparison to other industries. According to early critical contributions, SMEs must
satisfy criteria related to markets, ownership and control. Another perspective on
defining SMEs attempts to identify those characteristics, other than size, which
distinguish a small enterprise from a larger one, which are: uncertainty, innovation and
evolution Wynarczyk et. al., (1993).
3-6.2 SMEs Characteristics Welsh and White (1981) suggested that “a small company is not a little large business”,
because small firms have different characteristics over their large-scale counterparts.
The characteristics of SMEs tend to influence their strategic capabilities and
competitiveness.
Storey (1994) stated that there are three key distinguishing features between large and
small firms. Firstly, the greater external uncertainty of the environment in which the
small firm operates and the greater internal consistency of its motivations and actions.
Secondly, they have a different role in innovation; small firms are able to produce
something marginally different, in terms of product or service; this differs from the
standardized product or service provided by large firms. A third area of distinction
between small and large firms is the greater likelihood of evolution and change in the
smaller firm; small firms which become large undergo a number of stage changes. The
following section discusses the definition of SMEs of different institutions.

109
In comparing the characteristics of SMEs and large organizations, they could be
classified as strengths and weaknesses versus large organizations.
SMEs are in a more advantageous position in terms of structure because it facilitates
faster communication line, quick decision-making process, faster implementation, short
decision-making chain, and higher contribution as a source of ideas in their operations
and innovation, unified culture and very few interest groups (Kraipornsak, 2002). A
majority of SMEs have simple systems and procedures, which allow flexibility,
immediate feedback, better understanding and quicker response to customer needs than
larger organizations (Kraipornsak, 2002). This is further enhanced by the SMEs
corporate mind-set, which is conducive for new change initiatives, provided that the
owner/management has the commitment to, and leadership of the change process,
together with a sound knowledge of it. In addition, SMEs employees are given the
authority and responsibility in their own work areas that can create cohesion and
enhance common purposes amongst the workforce to ensure that a job is well done.
A distinguishing feature of SMEs from larger firms is that Small and Medium Enterprises
(SMEs) have limited financial resources and lack of access to commercial lending (i.e.
difficult to obtain loans) (Hashim and Wafa, 2002) for investing in technology,
infrastructure and training and limited resources in the form of time and personnel.
In terms of human resources, SMEs are always faced with the shortage of skilled labor
and they have to compete with large companies for skilled workers (i.e. large
companies able to offer skilled workers better wages and working conditions) (Reed et
al., 2001; Chee, 1987). They have low level of formal education and limited training in
new management principles and practices. As a result, SMEs do not have adequate
budget for staff training which lead to lack of managerial and technical expertise
(Hashim and Wafa, 2002; Chee, 1987).
Very often SMEs rely on one-person management, thus insufficient time and attention is
given to the various managerial functions (Hashim and Wafa, 2002). In SMEs, the
owner controls everything; poor management is attributed to the owner’s lack of
business experience, lack of management experience or know-how (Pickle and
Abrahamson, 1990; Baumack, 1988).

110
A majority of SMEs rely on outdated technology, labor intensive and traditional
management practices. Some do not trust new technology, while others are unable to
afford it, which in many cases leads to inefficient, lack of information and inadequate
in-house expertise (Hashim and Wafa, 2002).
In addition, SMEs are also faced with frequent raw material shortages and have to pay
more, fluctuation in raw material price, inability to obtain credit terms, inadequate
inventory management and control of stock in raw materials and less bargaining power
compared to large companies (Kraipornsak, 2002; Chee, 1987). Furthermore, they may
encounter more barriers due to increased competition at national and international
levels, particularly if they do not have the capacity or resources to meet the demands of
their trading partners in the supply chain (Lummus and Vokurka, 1999). It is apparent
that most SMEs may find themselves disadvantaged due to the lack of extensive
resources required for efficient supply chain management.
Thus, it is important to appreciate the differences that exist between SMEs and large
business organizations. In other words, it is crucial to try and understand SMEs issues
and characteristics before making any attempt to help them in implementing SCM
philosophy.
3-6.3 The contribution of SMEs Towards Economic Performance Small and medium enterprises (SMEs) constitute a large part of the economy in most
countries and their contribution towards economic performance is now universally
accepted as significant (Beaver, 2002).
In the European Union (EU), SMEs account for 99 per cent of activity according to the
“European competitiveness report” (Commission of the European Communities, 2003).
Of these, 93.3 percent were micro firms, 6.2 percent were small, and 0.5 percent was
medium size. Only 0.1 percent of the 17 million was defined as large firms (ENSI
1994).
Flynn, (1998) argued that, in the European Union (EU), high-growth SMEs are creating
thousands of new jobs in manufacturing and services. The study by Storey (1994)

111
reported that the panorama of EU Industry concluded that small firms in both the USA
and the UK created jobs faster than large firms in the 1980s and, furthermore, small
firms are more consistent job creators than large firms because they are less affected by
macro-economic factors.
SMEs in the EU constitute 66 percent of the sales of the non-primary sector. However,
if we exclude the large economies of Germany, France, and Great Britain, the figure is
around 75 percent for most countries. SMEs control 50 percent of manufacturing sales,
67 percent of services, and 90 percent of the construction and trade sectors. Micro firms
sell mostly to final customers and operate in more segmented product markets. It is the
larger firms that are more likely to export. The smaller firms depend more on their local
economies than do large firms. They would therefore have greater multiplier impacts.
In the United States, while the employment share of large companies dropped from 20
per cent in 1970 to 8.5 per cent in 1996 (Carlsson, 1992, 1999), ninety percent of new
jobs in the United States are generated through small- and medium-sized enterprises
(SMEs).
Small businesses make up a major portion of businesses in developing countries It is
estimated that SMEs employ 22% of the adult population in these countries (Daniels,
1994; Daniels &Ngwira, 1992; Daniels &Fisseha, 1992; Fisseha, 1992; Fisseha&
McPherson, 1991; Gallagher & Robson, 1995).
In India for example, SMEs occupy a prominent position in planned development of
Indian economy. The SME sector accounts for 40 percent of the industrial production,
35 percent of the total export and provide about 80 percent of employment in the
industrial sector in the country. Over the years, SMEs have shown a consistent growth
rate (Ghose, 2001).
The growing significance of SMEs in China's economy is hard to ignore. Chinese and
foreign experts estimate that SMEs are now responsible for about 60% of China's
industrial output and employ about 75% of the workforce in China's cities and towns.
SMEs are responsible for creating most new urban jobs, and they are the main
destination for workers laid-off from state-owned enterprises (SOEs) that re-enter the
workforce.

112
3 - 7 Why study on SMEs?
SMEs constitute a large part of business array in most countries and they have
significant roles in economic growth (Curran and Blackburn, 2001). Small firms make
up the vast majority of businesses in Europe and the UK. In 1996, around 90% of
European businesses were classified as SMEs (CCEM 1997) and in 1998 there were 3.7
million businesses in the UK, of which 99% were small businesses employing less than
50 people and only 25 thousand were medium sized employing between 50 to 249
people (DTI 1999). According to the SBA Office of Advocacy (2003), 99.7 percent of
US businesses are SMEs. Thus, an increased importance has been given SMEs.
SMEs do not only contribute to the country's economic growth, but also create
thousands of new jobs in manufacturing and services industry (Flynn, 1998) while large
scale organizations continue to slash jobs, provide critical parts and components to the
large scale organizations and influence the competitiveness of large organizations by
providing high-quality inputs. Thus, both linkages of a supply chain; the forward and
backward could be strengthening. Therefore, the study of small and medium scale
enterprises is based on the following propositions:
• SMEs represent more than 90% of overall business enterprises in most of the
countries.
• They are a vital engine of nation’s economic prosperity;
• A good provider of employment;
• Have been recognized as a seed-bed for indigenous entrepreneurship;
• Adapt easily to customer requirements (flexible specialization).
• Promote indigenous technological know-how;
• They have been recognized as a seed bed for innovative product;
• Many large businesses grow from the acquisition of smaller firms.
• They represent main entity in supply chain linkages;
• SMEs are often suppliers of goods and services to large companies.
• Many studies of supply chain management focus on the practices of large
firms, while small firms are treated mostly from the viewpoint of larger
firms (Chopra and Meindl, 2001; Kukalis, 1989; Lambert and Cooper,

113
2000). Therefore, more research effort is needed to study the impacts of
SMEs in the context of supply chain management. Since the long-term
sustainability of SMEs depends on “where they compete” and “how they
compete”.
The research reported here, therefore, seeks to add to the body of knowledge by
providing evidence of the importance of SMEs to the industry and to a country’s
economy in all.
3-8 Saudi Arabia Corporative Culture
Supply chain management continues to be the choice of world class corporative as their
medium for creating and sustaining a competitive advantage (Ireland and Webb, 2007).
Such a displacement is understandable in considering the potential benefits of successful
SCM. These benefits include maintaining the market share, operation efficiency and
customer satisfaction. The ultimate goal of this is a “Win- Win solution” with all
business partners.
Despite these enticing benefits, organizations who partner in strategic supply chains
continue to encounter barriers (Hendricks and Singhal, 2003). Existence of these
barriers could hinder the promising competitive advantages of SCM. Some of these
barriers come as a result of corporative culture. Corporative culture consists of beliefs,
values, norms, customs and practices of the corporative (Ott, 1989).
The importance of organizational culture is well documented to the success of a
corporative. It is increasingly evident that top management must have an explicit focus
on the development and maintenance of their organization’s culture.
The improvement success is more likely where the cultural elements of a leadership,
supplier relationship, customer focus, continuous improvement, and teamwork and
employee involvement are stronger. Those elements are likely to be stronger where
SCM is implemented.

114
Schein (1992) defined the corporative culture concept as a system of norms, shared
values, concerns, and common beliefs that are understood and accepted by the members
of the organization. The members of the corporative accepts these as valid, follow and
teach them to the incoming members as a pattern to be followed for problem solving and
required thinking style and behavior.
Most if not all of change initiatives like SCM adoption failures – and failures of other
such initiative– are not only the failure of the management. Rather, they may be
attributed to deeper, more critical sources: the fundamental, pervasive culture of the
corporative and the operating climate that culture instills in its employees. Often,
managers are victims of that culture, just as change itself is a victim of the
implementation process. In order to improve the odds of success when attempting to
introduce any change in the corporative– especially SCM– managers should first
comprehensively examine their organization’s underlying culture and the operating
climate created and constantly influenced by that culture. These two characteristics
determine the readiness required for acceptance of the SCM philosophy within a
corporative (McNabb and Sepic, 1995).
SCM can have a dramatic impact on the culture of a corporative (Lawler et al., 1998).
SC is a management approach in which the application of practices such as teamwork,
internal customer relationship, and supplier partnership are tools for cultural
transformation, and involves a major cultural change in the corporative (Entrekin and
Pearson, 1995). SCM is a complete change in an organization's culture and the way
people behave at work. On the other hand, organizational culture appears to be a crucial
factor in understanding the ability of any corporative to perform and compete (Cicmil
and Kekäle, 1997). This is especially an issue of Saudi Arabia corporative where
services are provided by multinational group of people with different cultural values.
In the following section, the author will shed light on some important elements to the
success of SC implementation that is related to Saudi Arabia SMEs. These elements are
but not limited to, senior management leadership, customer relationship, and teamwork.

115
The importance of soft issues in the implementation of SC is well documented and
recognized in the literatures. Among these soft issues is leadership. According to some
management and quality initiatives such as Baldrige Award, EFMQ, TQM and SC the
assessment category of leadership examines senior executives’ personal leadership and
involvement in creating new corporative structure.
Leader is regarded as a driver in such initiatives. An inadequacy of leadership may
impede continuous improvement to strive for outstanding performance. It is thus
important for a senior executive to learn continuously about real essences of SCM and
the way to implement leadership in the pursuit of SCM.
Management leadership is more associated with providing vision, direction and
particularly with the ability of sharing, generating commitment, involving others and
creating levels of synergy, consensus, congruence and enlightenment. It is about
reacting to adverse situations with wisdom, courage and object but also is about risk
taking and seeking success and advancement.
The role of leaders can be extended including the identification of priorities and agendas
of the corporative and assigning these priorities for each actor, and have to bring the
various people together so that the act is complete.
Saudi Arabian SMEs are mixed of local and multinational companies. The multinational
companies are either fully foreign ownership or joint venture ownership. Accordingly,
the management schools are varies among local firms in Saudi Arabia and other
multinational companies.
The management style of Saudi managers is influenced by different variables like
gender, level of education, and the organizational position of subject managers.
In many SMEs, the vision, mission and strategic plan are not clear. The primary focus of
these companies is on short-term strategic goals which tend to be financial in nature.

116
A number of management initiatives ends with failure within the context of SMEs. The
failure could be attributed to the following:
a. Limited understanding of the certain initiative (SC) and its potential.
b. Lack of consistent commitment and support, leadership style of managers – too top or too laissez faire, superficial knowledge of the implementers.
c. Vague improvement goals, unclear strategies and conflicting priorities.
d. Lack of developing and sustaining oriented culture. e. Lack of employees' motivation, participation and team working, employee apathy and resistance to change. f. Lack of linkages between remuneration and firm's performance. g. Lack of recognition for success. h. Lack of training, education and technical knowledge and experience, poor coordination, close vertical communication (from top to the bottom) i. Lack of work discipline.
The organization chart, in many of these SMEs, is not well established. Accordingly, the
authority, the communication channel and the job description are poorly defined. As in
many SMEs, minimal support in financial allocation hinders the corporative growth.
Senior managers of Saudi SMEs do not invest in promoting awareness of SC through
training, seminars and open sharing. These observations indicate that there is still a
room for leadership improvement in Saudi Arabia.
To achieve successful implementation of SC within Saudi Arabia SMEs, leaders of
these organizations need to ensure that all facets of the organization, the organizational
structure, management style, training, communications, compensation and promotion
systems, and systems, procedures, and processes would reflect SC principles.
To look at the entirety of the organization's culture, we need to identify the performance
on customer relation. Every company has its own strategy to build long term customers'

117
reputation. This initiative gives a challenge to apply it in responding this crucial demand
but the result will give good benefits to the interest of the organization.
Customers and buyers are always part of the cycle in the system. They are the heart of
the business to keep the company alive and successful even high pressure is at stake in
nurturing good relationship. It is essential to build a customer relationship focused
culture within the organization's system to achieve lasting benefits.
Many of Saudi SMEs have limited finance to invest in big campaign in advertising. This
limitation is a hindrance to connect the clients. On the other hand, the system of
measuring customer satisfaction is limited to ISO companies. It is not a discipline or
norm of SMEs to measure their customer satisfaction in systematic way.
Maintaining the customer relation is one of the company's competitive advantages. It is
more powerful of capturing new customer but seldom to Saudi Arabia SMEs to have
data base of their customers to open continuous communication system to trace their
valued customers. Sometimes, they are normally treated as one single buyer. This is a
challenge to improve this limitation.
There is a business year-end practice within LEs in Saudi Arabia business culture to
invite their whole customers in an open environment and share with them their
performance, future and difficulties. They almost consider their customers as one of
their stakeholders; their voice and need are incorporated in the corporative strategy and
this will serve as their core goal to implement more rigorous strategies for the future
performance of the organization. SMEs never adopt similar practice within their
business context.
It is necessary to apply different strategies for the benefit of the corporative especially
looking at the teamwork provided by each leader in an organization. As we all know that
joint cooperation among members in a team is required when achieving common goals

118
for the organization. Each member is inclined to do their responsibility, and they are
guided to shape a clear goal for their mission. This is the outcome of a good teamwork.
Teamwork is a transparent joint cooperative effort to work together as a team in
achieving same goals especially for the good of the company. It is an important outcome
and a condition in any corporative regardless to the scope of work for continuous
improvement (Coyle-Shapiro, 1997). Scholtes (1992) argues that teams are needed for
all organizations in order to work more flexible and develop mutual trust among
members.
Teamwork is important in developing collective responsibility, develops a sense of
ownership, provides additional communication channels between individuals,
management, customers and suppliers, develops problem solving skills and facilitates
awareness of improvement leading to behavioral and attitude change. (Barrie G. Dale,
2007)
Implementation and use of teamwork would result in producing appropriate related
benefits:
a. Stay ahead of change
b. Gain new sources of expertise
c. Involve all who know something about the subject
d. Achieve consensus in controversial matters
e. Build commitment
f. Deal with problems that no one owns by organizational assignment
g. Balance vested interests
h. Avoid hasty decisions
i. Handle conflicting views
j. Develop and educate people through their participation.
There is a common underlying theme for teamwork and that is a willingness to
cooperate.

119
Saudi Arabia business culture is made up of different nations. Each nation has its own
language, values, attitude and beliefs. They are also different in knowledge, experience
and interests. These characteristics hinder the creation of harmonized group of
teamwork. Communication is the most common obstacle while working efficiently as a
team. Leadership role and responsibility of the team remain vague throughout the given
time frame. The output of their performance is adversely affected.
Senior manager of Saudi SMEs is less supportive in promoting team grouping strategy
as illustrated by not making an initiative on the participation process, not setting the
infrastructure for team functioning, and not assigning a meaningful and feasible task and
insufficient authority or mandate. Those are critical impediments to achieve teamwork.
It has been noticed that employees of Saudi SMEs are not encouraged to show
improvement through teamwork. Because of their inefficient implementation of
teamwork, individuals working together in teams or groups toward common goals are
generally less effective than individuals working alone.
Training is a fundamental channel in creating a team with principles and a method for
action; a vision about what would be completed; a forum to discuss and learn with other
teams; technical and emotional support; and a repertoire of procedures that enhanced
communication and involvement. These are the positive responses in producing a stable
and effective teamwork in a successful organization.
3-9 Summary
Today, as the world stands on the verge of major changes in the global economy, the
environment is increasingly becoming an integrated market for goods and services;
nations are becoming more and more competitive as they come to terms with the need to
develop their private sector; and as the private sector becomes the true engine of
economic growth, the critical role of small and medium enterprises (SME’s) is
beginning to attract the attention of policy makers and legislators worldwide. As Saudi

120
Arabia stands on the porch of its accession to the World Trade Organization (WTO), the
first and foremost task is the creation of a strong framework that can nurture the creation
and development of SME’s.
Solutions can be brought out with government intervention and support. And
government intervention and support can succeed with the active participation of the
private sector including commercial banks, large enterprises, business service providers
and other relevant stakeholders. A much needed public-private partnership must take
shape if SME’s are to be empowered. The government will have to face the challenge of
persuading the private sector to buy-in on their intervention measures, and in turn the
private sector will have to work hard in championing for the reasons as to why SMEs
are essential for the country.

120
CHAPTER FOUR
RESEARCH METHODOLOGY AND FIELDWORKS
In this chapter, the research philosophy, different research methodologies and fieldworks are reviewed and explained. Different research approaches and the justification of using a particular approach are discussed. This is followed by discussing the research tools. The chapter ends by reviewing the result assessment procedure; reliability and validity.
4.1 Introduction This chapter is concerned principally with the research methodology describes the
research design and the field works in details. The research philosophy which is part
of this chapter is discussed in relation to other philosophies. This chapter is also
discussing the research strategy, including the research methodologies adopted. In a
step toward the research goal, research objective and the quest for the solution for the
research question, the researcher is critically reviewing research instruments utilized.
As the main component of research methodology is data collection techniques and
results assessment procedures, these are discussed at the end of this chapter.
In any research process, the research philosophy adopted contains important
assumptions about the way in which world is viewed. These assumptions will
underpin the research strategy and the methods chosen as part of that strategy. As
Johnson and Clark (2006) note, the philosophical commitments have significant
impact not only on what we do but how we understand what we are investigating.
In part, the philosophy adopted will be influenced by the research’s particular view of
the relationship between knowledge and the process by which it is developed. Not only
will their strategies and methods probably differ considerably, but so will their views
on what is important and, perhaps more significantly, what is useful.
In summary, the researcher agrees with Johnson and Clark (2006) who argue that the
important issue is not so much whether our research should be philosophically
informed, but it is how well we are able to reflect upon our philosophical choices and
defend them in relation to the alternatives the researcher could have adopted.

121
4.2 Research Philosophy The research philosophy (Figure 4-1), the over-arching term relates to the
development of knowledge and the nature of that knowledge. The knowledge
development may not be as dramatic as a new theory of human motivation. But
even if the purpose has the relatively modest ambition of answering a specific
problem in a particular organization it is, nonetheless, developing new knowledge.
Fig: 4-1 The Research Process ‘Onion’. Mark et al., (2000)
In research philosophy context, there are two main philosophies position; ontology
and epistemology. Each contains important differences which will influence the way
in which anyone think about the research process.
The term epistemology, which comes from the Greek word episteme, their term for
knowledge, is the relationship between that reality and researcher. The term concerns
what constitutes the acceptable knowledge in a discipline (what is known to be true) as
opposed to doxology (what is believed to be true). The aim of research, then, is the
process of transforming things believed into things known.
In the following section, the two major research philosophies positivist (sometimes
called scientific) and inter-pretivist (also known as anti-positivist) (Galliers, 1991) are
discussed.

122
I- Positivism Positivists believe that an “objective” world and universe – an objective reality – exists.
They are operated by laws of cause and effect. Consequently, reality can be studied
using “objective” methods similar to that used in natural sciences so that we might
predict and control them.
Neumann (2000) states that, positivism is the approach of the natural sciences. This short
definition of positivism covers a lot of basic principles which underline the concept.
Other definition developed by Orlikowski and Baroudi (1991) gives more understanding
of the concept which states that positivist:
“…premised on the existence of a priori fixed relationships
within phenomena which are typically investigated with
structured instrumentation. Such studies serve primarily to test
theory, in an attempt to increase the predictive understanding of the
phenomena.”
The above definition advocates the existence of cause and effect within the case under
study. This relationship is investigated with a structured instrumentation with no
interference of the researcher in which advocates the value - free of the produced results
and data do not change because they are being observed. The knowledge is
accumulatively built and arrived through the gathering of facts – and only facts- that
provide the basis for laws New knowledge is added to existing the knowledge and false
hypotheses are eliminated (Denzin and Lincoln, 2000). This kind of knowledge can be
law-like generalizations similar to those produced by the physical and natural
scientists (Remenyi et al. 1998).
Positivism is an epistemological position that advocates the application of the methods
of the natural sciences to the study a phenomena. An important component of the
positivist approach to research is that the research is undertaken, as far as possible, in
a value-free way and data do not change because they are being observed (Guba and
Lincoln, 1994).

123
Positivism is characterized by the following principles:
1. Only phenomena and hence knowledge confirmed by the senses can genuinely
be warranted as knowledge (the principle of phenomenalism).
2. The purpose of theory is to generate hypotheses that can be tested and that will
thereby allow explanations of laws to be assessed (the principle of deductivism).
3. Knowledge is arrived at through the gathering of facts that provide the basis for
laws (the principle of intuitivism).
4. Science must (and presumably can) be conducted in a way that is value free (that
is, objective).
5. There is a clear distinction between scientific statements and normative
statements and a belief that the former are the true domain of the scientist.
Typically, positivism inquiry uses quantitative method that include secondary data,
laboratory experiment, field experiment, survey and case research that lend themselves
to statistical analysis (Gill and Johnson, 2002; Benbas et al., 1987). These methods are
used to test hypothetical-deductive generalizations. Positivism paradigm emphasizes
different quantitative analysis of strictly defined problems. The quantitative analysis
aims to be predictive and extrapolative.
II- Interpretivism On the other side of the river stands what is called anti-positivist researchers. This
school of thought believes that the world can only “be understood from the point of
view of the individuals who are directly involved in the activities which are to be
studied” (Denzin and Lincoln, 2000).
The interpretive science school rejects the positivists' beliefs. It claims that the
classical school of positivism is seriously misguided - particularly with regard to issues
that are inherently subjective (sociology, psychology and much of business
management). This concept is central to the notion of deducticism, which claims that
generalizations can be made from a finite set of events in the past to predict future
events.

124
The aim of interpretive research is to understand how members of a social group,
through their participation in social process, enact their particular realities and endow
them with meaning, and to show these meanings, beliefs and intentions of the
members help to constitute their social action.
Within this school, the actor plays an important role in the investigation process.
Interpretive philosophically differentiate between conducting research among people
rather than objects.
The bonds between the investigator and what was being investigated is impossible to
separate. The enquirer uses his/ her preconceptions in order to guide the process of
inquiry (Remenyi et al., 1998). The interpretive perspective attempts to understand the
intersubjective meanings embedded in social life... (and hence) to explain why people
act the way they do (Gibbons, 1987). And thus, value free data cannot be obtained. The
data collected is considered to be subjective and used to generate theories.
Understanding supply chain and distribution management issues have become a rich
area of research interest (Simatupang et al., 2004). Gaining a better understanding,
comprehension and meaning of the supply chain has led to the use of inductive
qualitative methodologies to broaden the knowledge base. In short, it could be
concluded that the supply chain research under the interpretivist doctrine is therefore
the development of theories through explanatory methods rather than through the
creation of generalization (Aastrup, 2008).
With regard to research into supply chain discipline, it could be suggested that
positivism is relevant for getting an overview and for considering the broad structure
of the implemented practices within SMEs whereas interpretivist is useful for finding
out at the micro-level about the behavior of supply chain partners.
Gummesson (2000) outlined the characteristics of the two schools of thought as
shown the following Table 4-1.

125
Table: 4-1 Schools of thought
Source; Silverman, 1993
The researcher intensively examines a particular case (Chapter 7), a single entity or a
specific event with qualitative methods. Yet, there is no standard approach among
qualitative researchers (Silverman, 1993). He claims that four primary methods are used
by qualitative researchers:

126
1. Interview 2. Analyzing text and documents; 3. Observation 4. Recording and transcribing
Silverman (1997) points out, these methods are often combined. The multi-
method approach is also stressed by Denzin and Lincoln (1994). The research
made use all of the above methods in the case study.
4.3 Research Approach
There are two primary approaches to the conduct a research project and generate
knowledge. They are quantitative and qualitative methods. Each of these has it strengths
and weaknesses. Multiple research method bridges the gap and makes use of the
strengths of each method.
Boyer and Swink (2008), argued that from a methodological standpoint, the right
paradigm is one which incorporates multiple, complementary methodologies, in order to
triangulate findings (Flynn et al., 1990) and to ensure that the weaknesses of any one
methodology are offset by the use of complementary methodologies (McGrath, 1982)
within a specific area of inquiry within any research field.
Accordingly, this study uses multiple research method; quantitative and qualitative
methods to collect relevant data; self-administrated survey questionnaire and focus
group interview in overcoming the ‘method effect’. The section below discusses in
detail how these two methods used in this research to collect the data required to answer
the research problem.
I- Quantitative Research The quantitative research methods were originally developed in the natural sciences to
study natural phenomena (Myers, 1997) and it is based on a scientific method, a
perspective based on positivism or objectivism. The goal of quantitative approach is to
answer research questions or test hypotheses (Hopkins, 2000). It typically tends to learn
‘what’, ‘how much’ and ‘how many’ (Pinsonneault & Kraemer, 1993). In this study, the

127
qualitative methods are intended to answer the research question rather than testing
hypotheses.
In quantitative research methods, the science (social or human) problem is composed of
variables, measured with numbers, and analyzed with statistical procedures, in order to
determine whether the predictive generalizations of the theory hold true (Creswell,
2005). It is appropriate where a researcher seeks to quantify relationships between
variables of interest, in order to formulate and test hypotheses derived from theories that
may therefore be either accepted or rejected on the basis of comparative and statistical
analyses. In this way, a quantitative approach is inclined to be deductive.
Quantitative methods focus on the strict quantification of observations (data) and on
careful control of empirical variables. It often incorporates large scale sampling and the
use of statistical procedures to examine group means and variances (Ponterotto &
Grieger, 1999). It stresses the measurement and analysis of causal or correlation
relationships between variables (Denzin & Lincoln, 2000).
Moody (2002) states that the most common quantitative methods are:
• Experiment: This includes the application of a treatment and measurement of
results (before and/or after). This is the only method that can demonstrate causal
relationships between variables.
• Survey which includes cross-sectional and longitudinal studies using
questionnaires or interviews for data collection with the intent of estimating the
characteristics of a large population based on a smaller sample from that
population, and
• Historical data: they are investigated to look for patterns in the data.
Each of the above method is particularly suited for obtaining a specific type of data.
Dilanthi et al., (2009) suggested that SCM studies can benefit from the strengths of
quantitative methodologies. It eliminates the external factors and so the results gained is
almost unbiased. The results are statistically reliable and determine if one idea is better

128
than the alternatives. A comprehensive answer is reached which can be generalized to
the total population of the study. It also allows comparison and replication.
Despite the advantages of quantitative researches, there are some misgivings in using
this type of research. Quantitative methods are fairly inflexible. With quantitative
methods such as surveys and questionnaires, for example, researchers ask all
participants identical questions in the same order. The response categories from which
participants may choose are “closed-ended” or fixed. The advantage of this inflexibility
is that it allows for meaningful comparison of responses across participants and study
sites. However, it requires a thorough understanding of the important questions to ask,
the best way to ask them, and the range of possible responses (Denzin, 200). The
quantitative methodologies focus on the structural and technological aspects of SCM
and overlook the importance of the social aspects of supply chains which considerably
add to the complexity of supply chains, and which is considered to be a major weakness.
II- Qualitative Methods
Qualitative research is often treated as a relatively minor methodology to be used.
Viewed from this perspective, qualitative research can be used to familiarize oneself
with a setting before the serious sampling and counting begins (Silverman, 1993).
Denzin and Lincoln (2000) provide additional ammunition, claiming that many
(traditionalists) regard qualitative researchers as soft scientists or even journalists.
Qualitative research is described as unscientific, or only exploratory, or entirely
personal and full of bias.
While it is important to take this criticism seriously, it is not enough to simply reject
all forms of qualitative research. There is no reason why good, scientific research
could not be performed using qualitative. However, they will not automatically
provide better research than quantitative research (Alvesson, 1996). Both schools of
thought have their strengths and weaknesses of forms and someone needs to try to
use the most appropriate method given the particular research problem.

129
Silverman (1993) tired of the strong polarization between positivists (quantitative)
versus interpretive (qualitative) approaches, argues that we need to understand the
similar issues faced by any systematic attempt at description and explanation,
whether quantitative or qualitative. The fundamental criteria for good research
should not differ between the two.
Qualitative research methods were developed in the social sciences to enable researchers
to study social and cultural phenomenon. Miles & Huberman, (1994) define qualitative
methods as a set of data collection and analysis techniques that emphasize the fine
grained, the process oriented, and the experiential and that provide a means for
developing an understanding of complex phenomena from the perspectives of those who
are living it. Other scholars like Burns & Grove (1998) state that qualitative research
refers to inductive, holistic, subjective and process-oriented methods used to
understand, interpret, describe and develop theory on a phenomenon or a setting and
is a systematic, subjective approach used to describe life experiences and give them
meaning.
Qualitative methods are most often used for theory building. In these cases, a
phenomenon exists that is poorly understood, so poorly that the relevant variables and
linkages cannot be specified a priori (Pamela, 2004). In these circumstances the
researcher would immerse herself in the phenomenon of interest, interviewing
participants, observing activities within the organization, and gathering archival
information in an attempt to build a better understanding.
While most often used for theory building purposes, qualitative methods can also be
used to test theory. For example, Barr et al. (1992) conducted a qualitative analysis of
archival documents from two companies to test their hypotheses about the relationship
between environmental change, management beliefs, and the timing of strategic change.
Their results did support their hypothesis that the organization in which management
more rapidly changed their understanding of the environment also was the first to
change its strategy.
Using qualitative research method in SCM provide the opportunity to identify and
explain complex relationships without having to pre-specify either the variables

130
involved, or the nature of the relationship between them. The researcher will develop
more understanding of the phenomena under investigation as he or she immersed deeply
in the problem thruogh using different data collection techniques available. Such
understanding will not be available through using survey questioners only.
Qualitative methods encompass a number of data collection techniques including
Pamela (2004):
• Action research aims to contribute both to the practical concerns of people in an
immediate problematic situation and to the goals of social science by joint
collaboration within a mutually acceptable ethical framework model;
• Case study research - a case study is an empirical enquiry that investigates a
contemporary phenomenon within its real-life context;
• Ethnography - the ethnographer immerses her/himself in the life of people s/he
studies and seeks to place the phenomena studied in its social and cultural
context.
• Participation and observation, interviews, and analysis of archival information
such as documents, photographs, and video and/or audio recordings.
Beside the advantages that qualitative approach offers, it received numbers of criticism.
Golden-Biddle & Locke (1997) stated that most qualitative methods lack a standardized
protocol for analyzing data and that the results of qualitative research are based upon the
subjective interpretation of the researcher. Other criticism is made to the data coding
protocols. Strauss & Corbin, (1998) argued that these protocols are purposely broad to
allow the coding process to be adapted to the situation at hand. The emphasis on basing
conclusions upon the researcher’s interpretation of the data, rather than on a
mathematically rigorous test of significance as in the case of quantitative methods, leads
some to question the validity and reliability of the results (Pamela, 2004).
The following Tables 4-2 and 4-3 summarize the strength and weakness of each
method. They are specifically designed to aid in the construction of combination of
qualitative and quantitative research. After determining one’s research question(s)
one can decide whether mixed research offers the best potential for an answer; if this

131
is the case, then one can use the tables as an aid to help in deciding on the
combination of complementary strengths and non-overlapping weaknesses that is
appropriate for a particular study (Johnson; and Onwuegbuzie 2004).
Table: 4-2 Strengths of Quantitative Methods
• Testing and validating already constructed theories about how (and to a lesser
degree, why) phenomena occur.
• Testing hypotheses that are constructed before the data are collected. Can
generalize research findings when the data are based on random samples of
sufficient size.
• Can generalize a research finding when it has been replicated on many different
populations and sub populations. Useful for obtaining data that allow quantitative
predictions to be made.
• The researcher may construct a situation that eliminates the confounding influence
of many variables, allowing one to more credibly assess cause-and-effect
relationships.
• Data collection using some quantitative methods is relatively quick.
• Provides precise, quantitative, numerical data.
• Data analysis is relatively less time consuming (using statistical software).
• The research results are relatively independent of the researcher.
• It is useful for studying large numbers of people.

132
Weaknesses of Quantitative Methods
• The researcher's categories that are used may not reflect local constituencies'
understandings..
• The researcher may miss out on phenomena occurring because of the focus on theory or
hypothesis testing rather than on theory or hypothesis generation (called the confir-
mation bias).
• Knowledge produced may be too abstract and general for direct application to specific
local situations, contexts and individuals.
Table: 4-3 Strengths of Qualitative Methods
• The data are based on the participants' own categories of meaning.
• It is useful for studying a limited number of cases in depth.
• It is useful for describing complex phenomena.
• Provides individual case information.
• The researcher can study dynamic processes (i.e., documenting sequential patterns
and change).
• Can conduct cross-case comparisons and analysis.
• Provides understanding and description of people's personal experiences of
phenomena.

133
Weaknesses of Qualitative Methods
• Knowledge produced may not generalize to other people or other settings (i.e.,
findings may be unique to the relatively few people included in the research study).
• It is more difficult to test hypotheses and theories.
• It generally takes more time to collect the data when compared to quantitative
research.
• Data analysis is open time consuming.
• The results are more easily influenced by the researcher's personal biases and
idiosyncrasies.
Sources; Denzin, 200
III- Combination of Methodology In the real world, supply chain is a complex phenomenon that could not be solved with a
single methodology. Thus, multiple approaches are required in order to develop a
holistic understanding of supply chain management phenomena (Näslund, 2002). It is
only with multiple perspectives that true picture of a problem could be visualized and
understood.
Dunn (1993) suggested that, it is trend of the researcher to use multiple methods in
many research disciplines and supply chain is not exceptional. Näslund (2002) put
it:“…it will be hard to develop any research field if all researchers belong to the same
paradigm and culture, and do the same kind of research with the same kind of research
methods”. Thus, to maintain the integrity of the research, it is advisable to use of
multiple complementary methodologies in our own research.
Boyer and Swink (2008) argued that from a methodological standpoint, the right
paradigm is one which incorporates multiple, complementary methodologies, in order to
triangulate findings (Flynn et al., 1990) and to ensure that the weaknesses of any one

134
methodology are offset by the use of complementary methodologies (McGrath, 1982)
within a specific area of inquiry within any research field. As this study concern, the
researcher integrated the both methodologies in reaching the aim and objectives of this
research work.
4.4 Data Collection Methods In the process of solving any research problem, collecting the proper data is a must. In
the research field, there are two main data collection. These are quantitative and
qualitative. The use of each method lies in the approach and the types of questions they
seek to answer. The main data collection technique under this approach is survey
research methods, while interview technique is the main method under the qualitative
research method. In this section, the data collections for the both research methods are
discussed in more details.
4.4-1 Quantitative Research Methods Data Collection
In the following section, the researcher will discuss the data collection protocol of
quantitative research methods.
I- Survey Research Methods Survey research methods are found to be the most suitable tool for obtaining a view of
situations and practices at a specific point in time, through the use of questionnaires or
interviews (Galliers, 1991). It involves the collection of information from a large group
of people or a population (through mailed questionnaires, telephone calls, personal
interview, etc.) about themselves or about the social units to which they belong (Rossi et
al., 1983), in very economical way. The survey sampling process determines
information about large populations with a known level of accuracy (Rea and Parker,
1992).
The classical school holds that survey research methods, which have been known since
the 1950s and have continued to evolve since that period, generate a detailed and
quantified description, a precise map and/or a precise measurement of potential. This is

135
accomplished by following well established methods for developing the research plan,
the survey instrument, the measurement device(s), the sampling plan, the
collection/coding/analysis of data and finally, the way results are reported (Daniele et
al., 2002). From the result, deductions are made via quantitative analysis regarding the
relationships between variables that are measured (Galliers, 1991).
Survey research methods can be studied in details through the following items:
I-1 Characteristics of Survey Research Methods Manoj and Varun (1998) identified three distinct characteristics for survey research.
First, it involves collection of information by asking people for information in some
structured format. Second, survey research is usually a quantitative method that requires
standardized information in order to define or describe variables, or to study
relationships between variables. Third, information is gathered via a sample, which is a
fraction of the population, with the need to be able to generalize findings from the
sample to the population. Given these three characteristics, it is easier to distinguish
survey research from other field-based methods like case studies.
I-2 Advantages of Survey Research Methods In their discussion on the advantages of survey research methods, Marshall and Ross
(1995) stated that these include their accuracy in measurement. Survey results can be
generalized to a large population within known limits of error. Other scholars
(Sekaran, 2000; Weiers, 1988; Zikmund, 2003) identified many more advantages for
survey research methods.
I-3 Types of Survey Research Methods Survey research methods often distinguish between exploratory, confirmatory (theory
testing) and descriptive survey research (Filippini, 1997; Malhotra and Grover, 1998).
The justification for selecting the survey method as a tool for data collection in this
study is that it was the most appropriate mode of inquiry for the organizations under
investigation since the sector under study is too large.

136
I-4 Questionnaires Design According to Dillman (2000), self-administered questionnaires are an accepted social
science research instrument. They are one of the oldest methods in the researcher’s
repertoire, and the method with which the general public is most familiar (Dane 1990).
Often they are the only feasible way to reach a number of reviewers large enough to
allow statistically analysis of the results.
In the questionnaires method of survey, the questionnaires may be mailed to the
respondents, or delivered in person. Both methods were used in this study. The targeted
respondents fill the same preprinted list of questions unaided. In the questionnaire, the
respondents themselves answer the questions without the present of interviewer around;
the questionnaire in this case is called self-administered.
Sufian (1990) classifies questionnaires into two types: structured and unstructured
questionnaires. A completely structured questionnaire is one in which all respondents
are asked the same set of predetermined questions with fixed wording and sequence.
Unstructured questionnaires on the other hand, although seeking standardization in the
sense of obtaining true variations among the respondents through their responses, are
based on the assumption that it is not possible to frame the same set of predetermined
questions that have identical meanings for extremely heterogeneous respondents.
The questionnaire was a result of comprehensive literature review and the study of an
existing available one with similar purpose. The questionnaire was carefully studied to
avoid unnecessary question that may lead to ambiguity or consume a lot of time to
answer.
The constructed survey was selected towards answering the problem statement of this
research. Questions under each construct were worded to cover certain construct
comprehensively. The survey was composed of two sections as follows:
The first section was designed to solicit basic data on the general characteristics of the
company such as their industry type, sales turnover, and number of employees. This
information was collected to enable the classification of responses by industry and size
of the organizations participating. The second is concerned on the current state of supply

137
chain. In total, the survey proposes __ questions.
I-4.1 Types of questions
There are many different types of questionnaire. They are;
• Contingency question
• Matrix questions
• Scale questions
• Open ended questions; and
• Closed ended question
All questions in this study were close-ended. As such, the survey employed three
question formats:
1) Yes/No;
2) Five-point Likert scales; and
3) Check list types of questions.
The question of each item was categorized in the following certain rules:
• The questions should not lead to a stereotype answer, short and simple enough to
be completed in short time, reduce the ambiguity and complexity of the
questions to overcome the possibility of obtaining lido not know" answers, and
the vocabulary used was intended to match the educational and experiential
background of the respondent.
• The question under each item is measured with five points. Likert Scale indicates
varying degrees of agreement to statements about these variables. In this
measurement, the most important was awarded 5 points, natural was given 3
points and least important was awarded 1 point under same scale.
A common criticism of mail surveys is that they often have low response rates (Benson,
1946; Robinson, 1951). Low response is the curse of statistical analysis, and it can
dramatically lower confidence in the results. While response rates vary widely from one
questionnaire to another, well-designed studies consistently produce high response rates.

138
Questionnaires have advantages over some other types of surveys in that they are
considerably cheaper to administer and conduct than other forms of survey research. It is
also, relatively easy to cover a large geographical area, obtain a listed population and
locate respondents, and can avoid interviewer bias and distortion. Questionnaires permit
the respondent more time for thought, allowing answers to be more realistic than other
type survey methods (Dillman 2000).
The most important limitation of self-administered structured is that the response rate
tends to be low, especially when the questionnaire is too long or is complicated to
complete, the subject matter is either not interesting to the respondent or is perceived as
being of a sensitive nature. Furthermore, Davidson (1970) notes that:
Left to a respondent to interpret questions, record
answers and return a questionnaire, the chances of getting
the required volume and accuracy of replies are lesser
than other forms of data collection.
I-4.2 Construction of Questionnaire
A large part of the success in a given research depends on how objectively the
instrument has been devised, Sufian (1990|). The first step in designing a questionnaire
is to decide the variables directly related to the problem. Other variables, such as,
intervening variables, background variables, etc., are also of concern. Having created the
exhaustive list of all variables necessary for the research, the next task is to frame
questions to obtain information on those variables. In addition to the variables related to
the problem, the researcher has to consider the following characteristics in designing the
questionnaires:
a- Instructions It is important to include in the questionnaire instructions for the respondents as to how
to fill it.

139
b- Questionnaire Length
A questionnaire should cover only those variables that are absolutely necessary for the
research being pursued.
c- Question Content
It is important that the questions make the respondents feel that the contents are, in one
way or another, relevant to them. If the contents are such that they do not concern most
of the respondents, it is unlikely that they will care for such matters and the responses
will cease to be practically useful.
I-5 Pre- Testing Surveys An important aspect of the quality of survey research is "The pre-test,or preliminary
test. It comes at the end of survey questionnaire design. It is essential to the credibility
and success of survey process.
Questionnaire pre-testing has merits in a sense that identifies questions that respondents
have difficulty understanding or interpret differently than the researcher intended.
Pre-tests typically consist of administering the draft questionnaire to a small sample of
respondents (10-25). Ideally, the test should be done on the same kinds of respondents
whom will include in the main study. The aim is to describe problems encountered and
the impressions of the respondents' experiences in answering the questions.
Often, the pre-test is administered by the most experienced interviewers because they
can do a good job with an unfamiliar questionnaire and can provide useful feedback on
questions that do not work or on problematic sequencing of questions.
Finally, it is important to note that pre- testing almost always results in a general
improvement of questionnaire.
As this study concern, a small sample group of practitioners and experienced academics
in supply chain management were selected for the careful review of the instrument. The
mailing list for the pilot study was randomly selected from the full mailing list. They
were given a copy of the survey and asked to answer it as soon as possible. The
researcher received 11 out of total 32 sent packages. This resulted in 34% of usable

140
survey.
The group was asked to highlight any ambiguity or uncertainty with the question
wording, structure, design, comprehension, layout and/ or sequence. Upon the
completion of the survey, a short meeting was arranged to discuss the concern areas
where improvement could be made like the sequence of questions and some terms used
in the questionnaire.
The panel found no major problems with the response format, directions, or other survey
procedures. On the other hand, the question that consistency misinterpreted was refined
and other minor modifications were made to ensure that the final version of the survey
was easily read and understood. Furthermore, several personal questions were deleted to
stress out the confidentiality of data, and to make it difficult in identifying the source.
The new version of the questionnaire was made in receiving the consideration of the
comments raised by the reviewers. This effort was made to help reducing the number of
missing items and to accommodate further input from the pilot study.
As this step finished, the survey was then submitted to the director of studies for final
evaluation prior to final printing and distribution.
I-6 Cover Letter Virtually all mailed questionnaires are accompanied by a cover letter. The cover letter is
an essential part of the survey. To a large degree, the cover letter will affect whether or
not the respondent completes the questionnaire. The importance of the cover letter
should not be underestimated. It is important to maintain a friendly tone and keep it as
short as possible (Goode and Hatt, 1962). It provides an opportunity to persuade the
respondent to complete the survey. However, letters vary widely in terms of length,
nature of appeal, and whether they are on a separate page or reproduced as part of the
questionnaires.
The central issue in discussing cover letter is whether to personalize cover letters (i.e.,
the respondents name appears on the cover letter) or an impersonal letter is sufficient or
perhaps even preferable. Some researchers have found that personalized cover letters
141
can be detrimental to response when anonymity or confidentiality is important to the
respondent. However, some researchers have found that personalized cover letters with
hand-written signatures helped response rates (Carpenter, 1974). Others, have reported
that personalization has no effect on response (Forsythe, 1977).
The cover letter should address seven items (Walonick, 1993):
1. Briefly describe why the study is being done. In other word, statement of purpose and
importance.
2. Identify the sponsors/ endorsers.
3. Mention the incentive.
4. Mention inclusion of a stamped, self-addressed return envelope.
5. Encourage prompt response without using deadlines.
6. Describe the confidentiality/anonymity policy.
7. Give the name and phone number of someone they can call.
Other investigators found the following are important to be included too.
1. Identification of why they should complete the questionnaire.
2. The name and phone number of a person they can call with questions.
3. Statement of appreciation
4. An offer of a summary of results.
I-7 Reliability and Validity Assessment Measurement, by definition, is simply the assignment of numbers to events, objects or
individuals, according to specified rules. Whether the attribute being measured is
physical or psychological, “hard” or “soft”, the focus of measurement is necessarily on
the “something” that is measured.
142
The goodness of the measurement or the truthful of the measurement results is a corner
stone in the quality of measurement process and therefore to the conclusion made. The
assessment of the measurements can be achieved by considering the reliability and
validity of the data under research. These two concepts of assessment are discussed in
the following section in more detail.
1- Reliability The term ‘Reliability’ is a concept used for testing or evaluating all kinds of research
methods; quantitative, qualitative or others. Reliability is a kind of assessment concept
that has issues of consistency of measures (Bernard, 2000). It is an indicator for
measuring the homogeneity of the scale items in the same construct (DeVellis, 1991;
Hinkin, 1995). In other word, it is concerned with minimizing the errors and biases in
the study so that if another researcher duplicated the same procedures using the same
case study, then the results and conclusions would ideally be the same (Yin, 1994).
Conceptually, the reliability reflects how well the observed scores are related to the true
scores. The research work has high acceptance when it has high degree of reliability.
As in most of empirical studies, Cronbach’s Alpha (Terence Jackson, 2001) was found
to be the most acceptable statistical technique to measure the reliability of a given
construct. The Crobach’s Alpha coefficient (Cronbach, 1951; Nunnally, 1967) varies
between 0 (no correlation and therefore no internal consistency) and 1 (perfect
correlation.. Typically, reliability coefficients of 0.70 or higher were found to be the
most acceptable cut off value (Nunnally, 1978). The reliability is affected by number of
items in a scale and sample size (Hayes, 1992). Therefore, permissible alpha values can
be slightly lower (0.60) for newer scales Nunnally (1978). The Crobach’s Alpha
coefficient with a value of (0.7) is considered in data analysis as accepted cut off value
in this study.

143
2- Validity The traditional criteria for validity find their roots in a positivist tradition, and to an
extent, positivism has been defined by a systematic theory of validity. Within the
positivist terminology, validity resided amongst, and was the result and culmination of
other empirical conceptions: universal laws, evidence, objectivity, truth, actuality,
deduction, reason, fact and mathematical data to name just a few (winter, 2000).
In order to understand the concept of "validity", it is essential to review the definition
given by leading authors Champion (1976). 'The measure that an instrument measures
what it is supposed. In other words, does the research instrument allow you to hit "the
bull’s eye" of your research object?
Validity concerns the crucial relationship between concept and indicator. Unlike
reliability that focuses on the performance of empirical measures, validity is usually
more of a theoretically-oriented issue because it inevitably raises the question, “valid for
what purpose?”. Validity is crucial to an instrument’s credibility; it is an indication that
the instrument is indeed measuring what it was designed to measure and that it is
measuring it accurately.
4.4-2 Quantitative Research Methods Data Collection In the following section, the researcher will discuss focus group as data collection
protocol of qualitative research methods.
I- Focus Group In order to meet the research objectives and assessment of supply chain house
framework model, the researcher coordinated and conducted a case focus group session
to explore the suitability and applicability of the framework model for SMEs
manufacturing sectors.
A focus group is, according to Lederman (Thomas et al. 1995), ‘a technique involving
the use of in-depth group interviews in which participants are selected because they are
a purposive. It is a qualitative research method to seek and gather information that is

144
beyond the scope of quantitative research. Mail and telephone surveys are concrete
examples in this method. The term “focus group” is often used to describe many types
of group discussions. Focus group research, however, is a true research method. As
such, it uses a fairly standard methodology.
Although it is not necessary the representative in the sampling of a specific population,
the group is being ‘focused’ on a given topic’. Participants in this type of research are,
therefore, selected on the criteria that they would have something to say on the topic
(Richardson & Rabiee, 2001).
The purpose of the methodology is to make sure that the information is not collected in a
biased manner by the researcher, is a true representation of participants’ feelings and
beliefs, and is reproducible. In other words, if another researcher conducts the same
focus group, he or she might obtain similar results.
In focus group research, participants usually bring up issues and concerns outside the
prepared question path. For that reason, focus group research is useful for issues
identification, and to determine areas needing further research.
Focus groups provide insights on how people think and provide a deeper understanding
of the phenomena being that is being studied. While a valuable research tool, surveys
generally ask closed-ended questions that may limit the feedback that can be gained
from a respondent. A scheme to gain more in-depth information and to supply a survey
is the interview method.
Group interview is the primary focal point in facilitating the interview in order that the
researcher can economically capture deeper information than individual interviews.
Focus groups have the following benefits:
Economical: It is more reasonable than individual interviews because it can be an expensive proposition that can exceed the available resources;

145
Group interaction: It is between members of the target population during focus groups that may encourage participants to make connections in various concepts through discussions that may not occur during individual interviews, and
Non-verbal communication: It is also the data that can be captured in focus groups. Participants who are in the focus group may respond differently to a topic.
Focus group discussions are a flexible tool for exploring respondent awareness, behavior, concerns, beliefs, experiences, motivation, and future plans.
Focus group offers an exploratory, formative, and “information-rich” data.
o Focus Group Methodology
This brief methodology outlines the five-stage process in conducting the focus groups
field work and reporting on the results. The five stages are:
I. Study Purpose II. Methodology
a. Conceptualization b. Process flow
III. Facilitation c. Preparation d. Pre-Session e. Session
IV. Data Analysis V. Reporting
Using this five-stage process will contribute to the completion of a feasible focus group,
and this will serve as an introduction to the focus groups. The first two stages belong to
the methodology design while the last three stages belong to the field work. The
following is the detail description of the five stages process.
I- Study Purpose As with any research studies, the first stage in conducting a quality focus group is to
define the study purpose. This is critical as it defines how all subsequent activities will
proceed. Sample purposes for a focus group include:
• Exploration: Finding out an issue of importance from the target of population
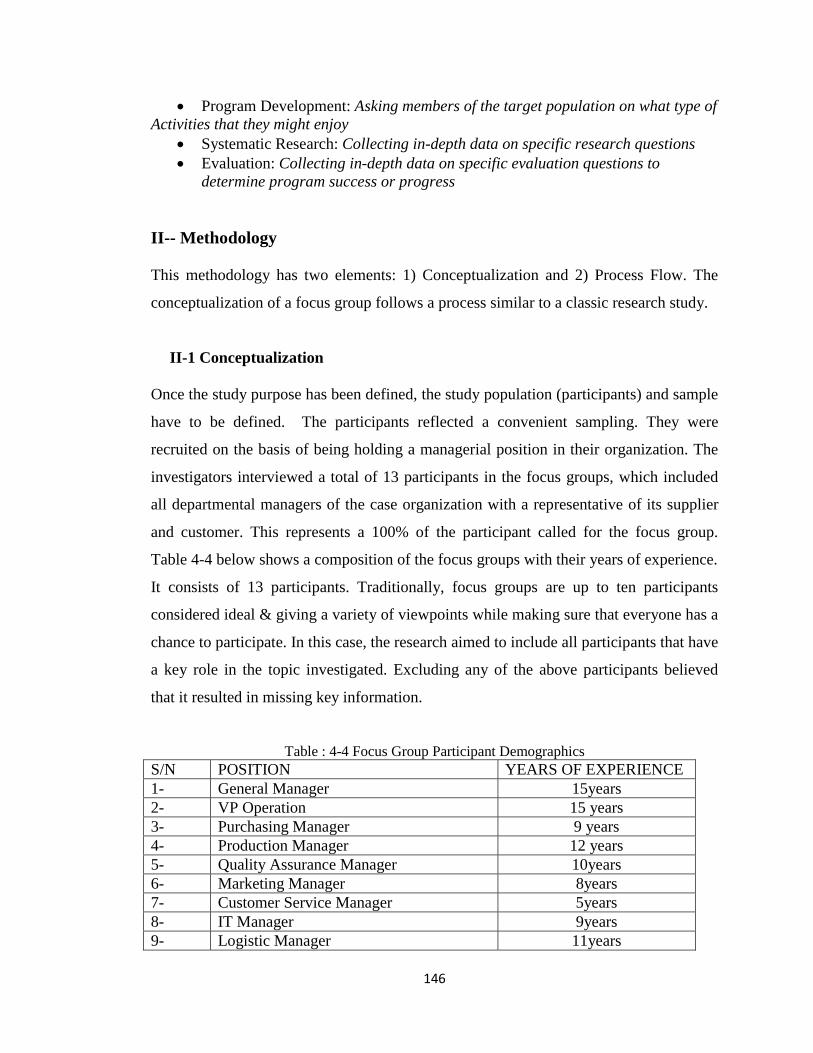
146
• Program Development: Asking members of the target population on what type of Activities that they might enjoy
• Systematic Research: Collecting in-depth data on specific research questions • Evaluation: Collecting in-depth data on specific evaluation questions to
determine program success or progress II-- Methodology This methodology has two elements: 1) Conceptualization and 2) Process Flow. The
conceptualization of a focus group follows a process similar to a classic research study.
II-1 Conceptualization Once the study purpose has been defined, the study population (participants) and sample
have to be defined. The participants reflected a convenient sampling. They were
recruited on the basis of being holding a managerial position in their organization. The
investigators interviewed a total of 13 participants in the focus groups, which included
all departmental managers of the case organization with a representative of its supplier
and customer. This represents a 100% of the participant called for the focus group.
Table 4-4 below shows a composition of the focus groups with their years of experience.
It consists of 13 participants. Traditionally, focus groups are up to ten participants
considered ideal & giving a variety of viewpoints while making sure that everyone has a
chance to participate. In this case, the research aimed to include all participants that have
a key role in the topic investigated. Excluding any of the above participants believed
that it resulted in missing key information.
Table : 4-4 Focus Group Participant Demographics S/N POSITION YEARS OF EXPERIENCE 1- General Manager 15years 2- VP Operation 15 years 3- Purchasing Manager 9 years 4- Production Manager 12 years 5- Quality Assurance Manager 10years 6- Marketing Manager 8years 7- Customer Service Manager 5years 8- IT Manager 9years 9- Logistic Manager 11years

147
10- Cooperate Strategy Manager 5years 11- Finance Manager 7years 12- First Tier Supplier 7years 13- Direct Customer 5years
Participants were given a stipend for attending the focus group. The use of a stipend
usually insures better attendance, because it creates a “contract” in the mind of the
participant. Refreshments of some type were served to create an informal and
comfortable atmosphere.
The question path is open-ended and it is designed to gather ideas and opinions that are
outside the scope of prepared questions. Yes/No questions or questions that are too
specific can limit discussion and decrease the value of a focus group.
The questions are put into a logical flow and develop prompts for each question. A
prompt is a question that can facilitate discussion if there isn’t a good response to the
initial question. It also develops questions that might explore an issue more in depth.
After finalizing the questions, review the questions to ensure that they are aligned with
the study purpose. Sometimes in the methodology stage, a research team may trap in
developing questions and ideas that the final questions could lose their alignment with
the study purpose. As a quality check, it always takes a step-back to ensure that the
questions that are being asked will inform on the study purpose.
II-2 Process Flow The logistics are often the most time-consuming element in preparing to conduct a focus
group. Below is a suggested schedule for planning a focus group:
• Develop the Study Purpose • Identify the Participants • Develop Participant Contact List • Select the Facilitator • Question Development • Develop the Script

148
• Pilot test questions and script. • Invite Participants • Verify Invitation to Participants • Finalize Room Arrangements • Reminder Call to Participants • Organize all Needed Materials
Conceptualizing the focus group and managing the logistics will prepare the focus group for Stage Three.
III- Facilitation The general components of the facilitation stage are preparation, pre-session, and the
session itself. There are certain factors to acknowledge for each component that will
contribute in conducting a successful focus group.
a) Preparation
With the logistics completed, the research team can prepare for the focus group.
Wherever possible, there should be a focus group team. The team should have at least
two people. One person is the facilitator and the other is the note taker. It is important to
have a note taker to record the focus group feedback. It can negatively crash the
discussion if the facilitator will stop to jot down important notes. A focus group is a
conversation and this should not be impeded by someone stopping to take notes.
Preparation involves the facilitator committing the questions to memory. The script can
be used for verification but the facilitator needs to keep the conversation flowing and
reading questions can distract from the conversation.
b) Pre-Session
The time before the focus group starts is an important opportunity to become familiar
with the group dynamics. Engaging in small-talk prior to the session is important to
avoid the session topics. This can help the participants to feel more comfortable around
the facilitator and make engaging the group an easier process. Use the pre-session as an
opportunity to begin in understanding the group and will bring good result in the focus
group.

149
c) Session After the pre-session, the facilitator will continue to open the session by requesting the
participants to introduce themselves.
After the introduction, proceed through the questions. At the end of the discussion, close
the session using the text from the script. The questions are important but it is merely
flexible. If an issue seems critical to the participants and it aligns with the study purpose,
explore it more in depth.
IV. Data Analysis
Qualitative research and, in particular, focus-group interviews generate large amounts of
data. The data analysis aims to reduce data Robson (1993). Yin (1989) points out that
data analysis consists of a number of stages, i.e. examining, categorizing and tabulating
or otherwise recombining the evidence, in order to address the initial goal of a study.
The process of qualitative analysis aims to bring meaning to a situation rather than the
search for truth that focused on by quantitative research. Strauss & Corbin (1998)
describe analysis as ‘. . . the interplay between researchers and data’, acknowledging
that there is an extent of subjective selection and interpretation of the generated data.
The main source of data analysis is the recorded spoken language derived from the
interview; nevertheless, reflection about the interview, the settings and capturing the
non-verbal communication expressed by the member of the groups would add a valuable
dimension to the construction and analysis of data. This record could be in the form of
an audiotape or a videotape. It is recommended that a reflective diary should be kept by
the facilitator or moderator and that observational notes should be written immediately
after each focus-group interview.
The process of data analysis begins during the data collection and just after focus group
closure, by skillfully facilitating the discussion and generating rich data from the

150
interview. Comprehensive note taking and summarization of the discussion with the
participants during the focus group session will facilitate more efficient analysis.
For each focus group question, summarize the “big ideas” or “themes” that were
discussed, by listening to tapes, reading several times the entire transcripts and reading
the observational notes taken during the interview and summary notes written
immediately after the interview. This process facilitates a deeper understanding on the
study topic.
V. Reporting The reporting stage will tie up all together the previous stages into a coherent whole.
The research team has various decisions in making this stage as the most important
output coming from the audience.
4.5 Summary In summary, any research process, the research philosophy adopted contains important
assumptions about the way in which world is viewed. These assumptions will underpin
the research strategy and the methods chosen as part of that strategy.
This chapter has dealt with issues related to research philosophical considerations such
as research approach and strategy in detail.
This chapter discussed the research strategy/methodology that adopted for this research
work which includes research design and the fieldwork that used for collecting data for
the multiple research method; quantitative and qualitative. The survey questionnaires
and focus group both were used for the multiple research methods.
The execution of survey research method included the following steps:
1) Selection of study area was done through simple random sampling.

151
2) Respondents were selected by using Convenient Sampling. 3) Data collection was carried out by email method through well- structured
questionnaire. 4) The ambiguity or uncertainty with the question wording, structure, design,
comprehension, layout and/ or sequence was reduced by pilot survey. 5) Reliability of data and response rate were increased through continuous follow.
On the other side, the researcher adopted focus group research method technique under
the qualitative research method to validate the framework model developed in chapter
seven. Focus groups are valuable research tools and can capture deeper information that
will help to better understand the subject under investigation. The use of focus groups
provided the investigator with access to groups of individuals who were the key players
in the company. This section discussed the theoretical concept, the role and
methodology of focus-group interviews.
The interview discussions revolved around the implementation assessment of the
proposed framework model “Supply Chain House” which was developed to improve the
SMEs performance. The focus group interview was guided by Krueger (1994) and
Ritchie & Spencer (1994) framework analyses. The analysis of qualitative data collected
during the interview, raised up numbers of recommendations and suggestions to the
framework model and to the implementation challenges.
The focus groups complemented the visited site during the facilitation of the study, it
represented opportunities to gain deeper information about the company, its operation
and its relation with their suppliers and customers, and the visit provided opportunities
to learn more about the implementation challenges associated with the capacity of
SMEs.
Next chapter will deal with the data analysis of the survey questioners and summarizes
the findings. It starts with the respondents’ demography analysis, followed by the detailed
statistical analysis of supply chain dimensions.

152
CHAPTER FIVE
FIELDWORKS DATA ANALYSIS
5-0 Introduction
This chapter concerns with the data analysis and interpretation. Following the data
collection, the data preparation process suggested by Malhotra (1993) and Churchill
(1999) was implemented to ensure data was cleaned before performing further
statistical analysis. The major analytical tasks in the data preparation process include
questionnaire checking, editing, coding, and tabulation.
To analyze the empirical data, several statistical methods were employed. First,
Cronbach’s Alpha and Corrected Item-to-Total Correlations were used in assessing
the internal consistency of each construct. The mean was used to find out the trend of
each attribute under each construct. Illustration of data was made to give
understanding for the data trend.
Cronbach's α (Alpha) is a coefficient of reliability. It estimates the consistency (or
repeatability) of the survey instrument measurement for a given concept. It is an
indication how well a set of items measures the same concept. Theoretically, alpha
varies from zero to 1, including negative values, although only positive values make
sense. Higher values of alpha are more desirable. As a rule of thumb a reliability of
0.70 or higher is required.
Cronbach's Alpha can be written as a function of the number of test items and the
average inter-correlation among the items. Below, for conceptual purposes, is the
formula for the standardized Cronbach's Alpha:
Where:
N: is equal to the number of items,
c-bar: is the average inter-item covariance among the items and
v-bar: equals the average variance.

153
Corrected Item to-Total Correlation test is performed to check if any item in the set
of tests is inconsistent with the averaged behavior of the others, and thus can be
discarded. The analysis is performed to purify the measure by eliminating ‘garbage’
items prior to determining the factors that represent the construct, Churchill, G.A.,
(1979), that is, the meaning of the averaged measure.
It is called Corrected Item to-Total Correlation because the total is not the sum of all
item scores, but the sum of item scores without including the item in question.
Corrected Item to-Total Correlation test formula can be written as follow: r = [ΣXY/n – (X−)(Y−)]/(σx × σy), Where:
ΣXY/n = the mean of the sum of cross-products of variable X (item score) and
variable Y (total score),
X− = the mean of the scores on the X variable,
Y− = the mean of the scores on the Y variable,
σx = the standard deviation of scores on the X variable, and
σy = the standard deviation of scores on the Y variable.
Data was analyzed using SPSS version 18. SPSS stands for Statistical Package for
the Social Sciences. It was written in 1968 by Stanford doctoral candidate Norman
Nie. SPSS is commonly used in the Social Sciences and in the Business world.
In this research work, the researcher used SPSS statistical package software for the
purpose of data analysis. It is general statistical software tailored to the needs of
social scientists and the general public. It provides over 50 statistical processes,
including regression analysis, correlation and analysis of variance. Compared to
other software, it is more intuitive and easier to learn; the trade-off is less flexibility
and fewer options in advanced statistics than some other statistical software like S-
Plus, R and SAS.
SPSS software package is Windows based program that can be used to perform data
entry, organizing and analyzing data and to create tables and graphs. Theoretically,

154
there is no limit to the size of data files, so large amounts of data can be handled, that
cannot be handled in different program.
This chapter starts with given a brief description of the sample characteristics for the
study sample, with the respect to number of employees, position of company in the
supply chain, and the primary type of industry. The supply chain dimensions were
reviewed and analysed. Each section of this chapter is dealt with one of the supply
chain dimensions. There are seven supply chain dimensions in this study: 1)
Manufacturing Strategy, 2) Supplier Relationship Strategy, 3) Customer
Relationship Strategy, 4) Logistics Strategy, 5) Information Strategy, 6) Supply
Chain Initiatives, and 7) Performance Measurement Strategy. The results are shown
in two tables. The first table presents the Cronbach’s alpha and Corrected Item to-
Total Correlation whereas the second table shows the descriptive statistics analysis.
Finally, the descriptive statistics analysis is shown in graph presentation. The data
then interpreted and discussed.
The next chapter, Chapter Seven, will deal with developing a framework model that
support SMEs in their transition to world class supply chain management. The
proposed framework model then will be put under the examination with group of
consultants and managers in focus group interview.
5-1 Executive Data Summary In the following tables, the author presents the executive data summary in two
different Tables (5-1, 5-2). The first Table 5-1 summarizes the Crombach’s Alpha
coefficient and CITC values of the main research constructs and for the related
variables. The second Table 5-2 presents the statistical descriptive analysis which
shows the mean value of each construct.

155
Table 5-1: The result of Crombach’s Alpha and CITC values
The result of Crombach’s Alpha and CITC values
CONSTRUCT
VARIABLE
CRONBACH
ALPHAα
C-I-TC
MANUFACTURING STRATEGY
0.843 Quality .679 Cost .698 Delivery .746QUALIY .79 .679 quality approach .659 Implementation of TQM .594 Continuous
improvement .559 Benchmark .491 Quality awareness .544 COST .66 .698 Sourcing cost .444 Manufacturing cost .525 Sales cost .474 Returns and after sales
cost .32
DELIVERY .78 .746 Delivery Products
needed .595 Delivery on time .546 dependable delivery .529 shipment Tracking .542 Short order-to delivery
time .618 SUPPLIER PARTNERSHIP STRATEGIES
0.675
Suppliers selection .440 Suppliers involvement
.434 Suppliers base reduction .482 SUPPLIERS SELECTION .683 .440
Trust .435
Quality .568

156
Delivery .442
Price .315
Technical competence .459
SUPPLIERS INVOLVEMENT
.846 .434
Product Design .645
Continous Improvement .755 SUPPLIERS BASE REDUCTION
.711 .482 rely on a small number
of suppliers .556 get multiple quotations .548 drop suppliers for price
reasons .645 drop suppliers for
quality reasons .621 CUSTOMER RELATIONSHIP STRATEGY
.732
Customer Relation Strategy
.566
Customer Supplier Relationships
.643
CUSTOMER RELATION DIMENSION
.652 .566 Setting business ethic
jointly .503 Measuring Customer
Satisfaction .549 Determine future
customer expectation .487 Having joint venture
improvement program .443 CUSTOMER SUPPLIER RELATIONSHIPS
.855 .643 Conveying accurate
information .567 Developing and
maintaining a positive……
.694
Using compatible technologies .744
Opening lines of communication…. .753
Engaging in problem solving .767
INFORMATION 0.772

157
STRATEGY information quality .679 information sharing .723 INFORMATION QUALITY
.911 .679 information exchange is
timely .794 accurate .817 complete .834 adequate .776 reliable .651 INFORMATION SHARING
.882 .723 informing partners of
changing needs
.649
share proprietary information .736
share business knowledge .649
exchange information for business planning .579
keeping each other informed .552
SUPPLY CHAIN LOGISTICS
.729
Inter organization activities are closely coordinated
.568
Information and material flow smoothly
.574
Inbound and outbound distributions are integrated
.527
PERFORMANCE MEASUREMENT
.849
Financial performance .897 Operational
performance
.523
FINANCIAL PERFORMANCE
.760 .897
Growth in sales 0.537 Growth on assets 0.494 Market share gain 0.503 Return on investment 0.649

158
Profit margin on sales 0.477OPERATIONAL PERFORMANCE
.848 .523
Volume Flexibility .681 Scheduling Flexibility .855 Delivery reliability. .752 Product quality .667 Customer satisfaction
index .841
Table 5-2 Summary of the statistical descriptive analysis values
CONSTRUCT VARIABLE MEAN MANUFACTURING STRATEGY
4.5 Quality 4.57 Cost 4.47 Delivery 4.52 QUALIY 4.57 quality approach 4.43 Implementation of TQM 4.06 Continuous improvement 4.20 Benchmark 3.95 Quality awareness 4.49 4.47 COST Sourcing cost 4.28 Manufacturing cost 4.70 Sales cost 4.05 Returns and after sales cost
3.85
DELIVERY 4.52 Delivery Products needed 4.45 Delivery on time 4.54 dependable delivery 4.00 shipment Tracking 3.95 Short order-to delivery time 3.81 SUPPLIER PARTNERSHIP STRATEGIES
3.85
Suppliers selection 4.77 Suppliers involvement 3.11 Suppliers base reduction 2.78 SUPPLIERS SELECTION 4.77

159
Trust 4.35 Quality 4.60 Delivery 4.31 Price 4.53 Technical competence 4.40 SUPPLIERS INVOLVEMENT
3.11 Product Design 3.59 Continous Improvement 3.86 SUPPLIERS BASE REDUCTION
2.78 rely on a small number of suppliers
2.65
get multiple quotations 2.50 drop suppliers for price reasons
2.21
drop suppliers for quality reasons 2.33
CUSTOMER RELATIONSHIP STRATEGY
4.56
Customer Relation Dimension 4.44 Customer Supplier Relationships 4.46 CUSTOMER RELATION DIMENSION
4.44 Setting business ethic jointly 4.15 Measuring Customer Satisfaction 4.17 Determine future customer
expectation 4.14 Having joint venture improvement
program 3.93 CUSTOMER SUPPLIER RELATIONSHIPS
4.46 Conveying accurate information 4.10 Developing and maintaining a
positive…… 4.25 Using compatible technologies 3.65 Opening lines of communication…. 4.67 Engaging in problem solving 3.43 INFORMATION STRATEGY
3.81 information quality 3.52 information sharing 3.05

160
INFORMATION QUALITY
3.52 information exchange is timely 3.19 accurate 3.28 complete 3.08 adequate 3.23 reliable 3.15 INFORMATION SHARING
3.05 informing partners of changing
needs 2.94
share proprietary information 3.10 share business knowledge 3.23 exchange information for business
planning 2.81 keeping each other informed 2.79 SUPPLY CHAIN LOGISTICS
3.81 Inter organization activities are
closely coordinated 3.52
Information and material flow smoothly 3.05
Inbound and outbound distributions are integrated 3.21
PERFORMANCE MEASUREMENT
4.57 Financial performance 4.73 Operational performance 4.14 FINANCIAL PERFORMANCE
4.73 Growth in sales 4.56 Growth on assets 4.69 Market share gain 4.39 Return on investment 4.33 Profit margin on sales 4.52 OPERATIONAL PERFORMANCE
4.14
Volume Flexibility 3.19 Scheduling Flexibility 3.07 Delivery reliability. 4.55 Product quality 4.67 Customer satisfaction index
4.79

161
5-2 Sample Characteristics A total of 320 small and medium size manufacturing organizations were survey. A
total of 132 usable surveys were completed giving a response rate 41%. The
response rate is considered to be great acceptable that because the efforts made
during the distribution, follow up and collection strategy adopted.
5-3 Responded Firms The current numbers of employees working in these sampled firms ranged from 0 to
500 employees, who are in the range of small and medium enterprises (SMEs), see
Table 5-3. Of 132 organizations, five (5) companies employed between 0- 20
employees 3.8%, Forty one (41) organizations employed between 21- 100 (31.1%),
Thirty five (35) employed between 101- 200 employees (26.5%), and fifty one (51)
organizations employee between 201- 500 employees (38.6%).
The analysis shows that most of the organizations investigated were having higher
number of employee rate. This indicates that the medium size companies give more
opportunity for employment creation.
Fig: 5-1 Number of Employees
The graphical presentation of this breakdown is shown in Figure 5-.1. Of the 132
manufacturing firms, 51 were medium-sized which represent 38.6% of the total
surveyed organizations. The remaining organizations represent the small sized firms.
They count for 81 companies which count for 61.4%.
5
4135
51
0
10
20
30
40
50
60
20 or less 21 to 100 101 to 200 201 to 500
No of Employees
frequency
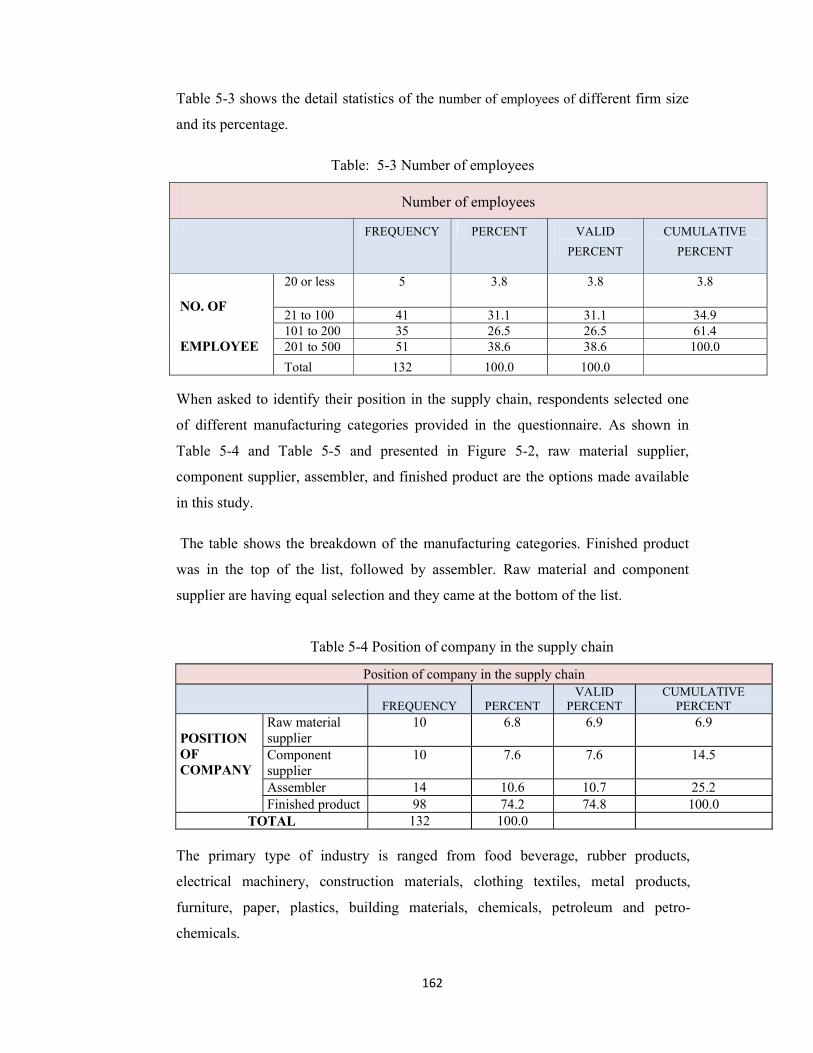
162
Table 5-3 shows the detail statistics of the number of employees of different firm size
and its percentage.
Table: 5-3 Number of employees
Number of employees
FREQUENCY PERCENT VALID PERCENT
CUMULATIVE PERCENT
NO. OF EMPLOYEE
20 or less 5 3.8 3.8 3.8
21 to 100 41 31.1 31.1 34.9 101 to 200 35 26.5 26.5 61.4 201 to 500 51 38.6 38.6 100.0Total 132 100.0 100.0
When asked to identify their position in the supply chain, respondents selected one
of different manufacturing categories provided in the questionnaire. As shown in
Table 5-4 and Table 5-5 and presented in Figure 5-2, raw material supplier,
component supplier, assembler, and finished product are the options made available
in this study.
The table shows the breakdown of the manufacturing categories. Finished product
was in the top of the list, followed by assembler. Raw material and component
supplier are having equal selection and they came at the bottom of the list.
Table 5-4 Position of company in the supply chain
The primary type of industry is ranged from food beverage, rubber products,
electrical machinery, construction materials, clothing textiles, metal products,
furniture, paper, plastics, building materials, chemicals, petroleum and petro-
chemicals.
Position of company in the supply chain
FREQUENCY PERCENT VALID
PERCENT CUMULATIVE
PERCENT POSITION OF COMPANY
Raw material supplier
10 6.8 6.9 6.9
Component supplier
10 7.6 7.6 14.5
Assembler 14 10.6 10.7 25.2 Finished product 98 74.2 74.8 100.0
TOTAL 132 100.0

163
Figure 5-2 shows the primary type of industry and their frequency. Metal industry
came on the top of the list which counts for 31 different companies. Rubber products
found to be on the bottom of the list and count for one industry which counts for 1%.
Other industries vary from 2 to 12 different industries.
Fig: 5- 2 The frequency of the primary type of industry
Table 5-5 Primary type of industry
71
9 11
2
31
12
3 511 10
4 7
05
101520253035
frequecy
Type of industry
Primary type of industry
FREQUENCY PERCENT
CUMULATIVE
PERCENT
PRIMARY
TYPE
OF
INDUSTRY
Food and Beverage 7 5.3 5.3
Rubber Products 1 .8 6.1
Electrical
Machinery
9 6.8 12.9
Construction
Materials
11 8.3 21.2
Clothing
Textiles
2 1.5 22.7
Metal Products 31 23.5 46.2
Furniture 12 9.1 55.3

164
5-4 Supply Chain Dimensions
In the following section the detail field work data analysis is presented.
5-4-1 Manufacturing Strategy
How important are the following manufacturing strategies in your organization?
I- Reliability Assessment The manufacturing strategy construct was presented by three dimensions (3) and
fourteen items (14). These dimensions including Quality dimensions (5 items), Cost
(4 items), and Delivery (5 items). The reliability assessment of the manufacturing
strategy construct was tested by means of Crombach’s Alpha and Corrected Item-to
Total Correlations (CITC) as shown in Table 5-6. The Cronbach Alpha of the
manufacturing strategy was found to be (0.843) which is above the acceptable cutoff
value (0.70) (Hair et al. 2000) and thus is considered to be accepted. The Corrected
Item-to-Total correlations for each item of the main dimensions are shown in the
table 6-6. The Corrected Item-to-Total Correlations of Quality dimensions is (0.679),
Cost is (0.698), and Delivery is (0.746). All these values are above the cutoff value
(0.4) (Nunnally 1994) and thus most of the correlations of these dimensions are
found to be significant.
Paper 3 2.3 57.6
Plastics 5 3.8 61.4
Building
Materials
11 8.3 69.7
Chemicals 10 7.6 77.3
Petroleum 4 3.0 80.3
Petro-chemicals 7 5.3 85.6
Others 19 14.4 100.0
Total 132 100.0

165
Table 5-6 Cronbach Alpha coefficient and CITC of Manufacturing Strategy
Cronbach Alpha coefficient and Corrected Item-To-Total Correlation of Manufacturing Strategy
CONSTRUCT
ITEM
CORRECTED ITEM-TOTAL
CORRELATION
CRONBACH ALPHA
α Manufacturing Strategy
Quality Dimensions
.679 0.843
Cost .698 Delivery .746
II- Descriptive Statistics When the respondents asked for the importance of the manufacturing strategies, their
answers were shown in Figure 5‐3. The answers were ranged from one (Very
unimportant) to five (Very important). This mean that there are few organizations
did not consider this component of manufacturing strategy crucial for the success of
their organization. But the mean value shows the acceptance of these dimensions as
success factor for better strategy. Figure 6‐3 below illustrates the importance mean in
Saudi Arabia manufacturing SMEs. These are prioritized as follows; quality
(4.57), cost (4.47), and delivery (4.52). The combined index of importance of the
MS is (4.51). This indicates that MS within Saudi Arabia’s SMEs is considered to be
one of the main blocks of business strategy. The top priority of this strategy was
quality dimensions.
From depictive statistics, one can conclude that Saudi Arabia SMEs realized the
importance of manufacturing strategy components, from the fact that all of them are
above (4) which come between Agree and Strongly Agree. It is not surprising for
quality dimension to come on the top of the list. Quality is recognized to be the proven
way for a business to survive in the current competitive global market. The report on
a survey by Lascelles and Dale (1990), carried out on seventy four U.K. executives
concluded that more than 85% of leading CEOs in Europe considered the
management of product quality to be one of the top priorities for their organization.
Quality is, therefore, as important as cost and delivery strategies, as a business
strategy to win in an aggressive market situation against a number of global
competitors. This finding comes in line with similar research finding and literatures.

166
Fig: 5-3 Manufacturing Strategy Importance
5-4-1-1 Quality
How important are each of the following quality Dimensions to your firm?
I- Reliability assessment
The quality construct was presented by five dimensions (5); quality approach,
implementation of TQM, continuous improvement, benchmarking, and quality
awareness. The reliability assessment of the quality dimensions of Crombach’s alpha
and Item- To Total Correlations are shown in Table 5-7. The Crombach’s Alpha of
the quality Dimension was (0.790) which means that this construct is reliable.
The Corrected Item-To-Total Correlations for each item of the quality approach was
(0.659), implementation of TQM (0.594), continuous improvement (0.559),
benchmarking (0.491), and quality awareness (0.544). These values are above the
cutoff value (0.4) and thus most of the correlations are found to be significant and
measuring the quality Dimensions.
4.57
4.47
4.52
4.424.444.464.484.54.524.544.564.58
Quality practices Cost Delivery
Importance
value
Parameters
Manufacturing Strategy Importance
Mean

167
Table 5-7 Quality Dimension; Assessment Analysis Quality Dimension; Assessment Analysis
CONSTRUCT ITEM
CORRECTED ITEM-TO-
TOTAL
CORRELATION
CRONBACH
ALPHA
α
Quality Dimension
Quality approach .659
.79
Implementation of
TQM
.594
Continuous
improvement tools
.559
Benchmark .491
Quality awareness .544
II- Descriptive Statistics
When the respondents asked for the importance of the quality dimensions, their
answers were shown in Figure 5-4. The answers were ranged from one (Very
unimportant) to five (Very important) for some of the dimensions and ranged from
two (unimportant) to five (very important). The mean value shows the acceptance of
these parameters as success factor for better quality dimensions.
Figure 5-4 below illustrates the importance mean of the quality dimensions in Saudi
Arabia manufacturing SMEs. These are prioritized as follows; quality awareness
(4.49), quality approach (4.43), continuous improvement tools (4.20),
implementation of TQM (4.06), and benchmark (3.95). The combined index of
importance of the MS is (4.22). This indicates that quality dimension within Saudi
Arabia’s SMEs is considered slightly moderate to MS. The main quality dimension is
quality awareness.

168
Fig: 5-4 Quality Dimension Importance
5-4-1-2 Total Supply Chain Cost
Please tick the number that accurately reflects your organization present Dimension in lowering total supply chain cost.
I- Reliability Assessment
Table 5-8 shows the Cronbach’s Alpha value for each scale and Corrected Item- To
Total Correlations (CITC) of the dimensions.
The total supply chain cost was presented by four dimensions (4); sourcing cost,
manufacturing cost, sales cost, and returns and after sales cost. The Crombach’s
Alpha of the total supply chain cost was (.66) which is slightly less than the cutoff
value (.70).
The Crombach’s Alpha if item deleted was calculated for each sub scale; sourcing
cost is (0.582), manufacturing cost (0.531), sales cost (0.559), and returns and after
sales cost (0.673). All these values will not improve the overall value of Cronbach
alpha of the total supply chain even if any of these sub scale was deleted. Moreover,
the Cronbach Alpha (.60) is found accepted in some management research literature.
For such reason the Cronbach Alpha of total supply chain is considered reliable.
4.43
4.064.2
3.95
4.49
3.63.84
4.24.44.6
Parameters
Quality Dimensions
Mean

169
Table 5-8 Cronbach’s Alpha coefficient and CITC of Total Supply Chain Cost
Cronbach’s Alpha coefficient and CITC of Total Supply Chain Cost
CONSTRUCT ITEMS CORRECTED
ITEM-TO TOTAL
CORRELATION
CRONBACH'S ALPHA (α )
Total Supply Cost
Sourcing cost .444
.66
Manufacturing cost .525
Sales cost .474 Returns and after sales cost .321
The Corrected Item-To-Total Correlations (CITC) for each item of the sourcing cost
is (0.444), manufacturing cost (0.525), sales cost (0.474), and returns and after sales
cost (0.321) All these values are above the cutoff value (0.4) except for return and
after sales which is less than 0.4 and thus most of the correlations are found to be
significant and measuring the quality Dimensions.
II- Descriptive Statistics Figure 5-5 shows the mean values of sourcing cost, manufacturing cost, sales cost,
and returns and after sales cost presented in are (4.28), (4.70), (4.05), and (3.85)
respectively. The table shows the highest mean value is 4.70 that for manufacturing
cost and the lowest is 3.85 that is for returns and after sales cost .
The illustration of the mean values is show in Fig 5-5.
From the illustration show in Figure 5-5, one can notice that the total supply cost came
in the top of the list and sourcing cost follows. Returns and after sales cost came on
the bottom of the list. The return and after sales cost were not given a considerable
attention in their strategy. This sub- scale plays an important role not only in the
respect of cost of the quality but the company image and reputation might be
severely affected.

170
Fig: 5-5 The mean values of Total Supply chain Cost
5-4-1-3 Delivery
How important are the following delivery Dimensions to your organization? I- Reliability Assessment
The reliability assessment of delivery dimensions by means of Crombach’s Alpha
and Corrected Item-To Total Correlations were calculated and are shown in Table 5-
9. The Crombach’s Alpha of the main construct was found (0.783). This is well
accepted alpha value.
Table 5-9 Cronbach’s Alpha coefficient and CITC of Delivery Cronbach’s Alpha coefficient and CITC of Delivery
CONSTRUCT CRONBACH'S ALPHA α ITEMS
CORRECTED ITEM-TOTAL
CORRELATION
Delivery
0.783
Delivery the kind of products needed .595 Delivery customer order on time .546 Provide dependable delivery .529 Implement shipment tracking .542Short order-to delivery time .618
4.284.7
4.05 3.85
00.51
1.52
2.53
3.54
4.55
Sourcing cost Manufacturing cost Sales cost Returns and aftersales cost
Parameters
The mean value of total supply chain cost
Mean

171
The Corrected Item-To-Total Correlations for each item of delivery the kind of
products needed, delivery customer order on time, provide dependable delivery,
implement shipment tracking, and short order-to delivery time are (0.5950, (0.546),
(0.529), (0.542), (0.618) respectively. All these values are above the cutoff value
(0.4) and thus the correlations are found to be significant and measuring the delivery
dimensions.
II- Descriptive Statistics When the respondents asked for the importance of delivery dimensions, their
answers were represented in Figure 5‐6. The Figure 5‐6 illustrates the importance
mean of delivery strategy in Saudi Arabia manufacturing SMEs. These are
prioritized as follows; delivery customer order on time, delivery the kind of products
needed, provide dependable delivery, implement shipment tracking, and short order-
to delivery time (4.54), (4.45), (4.00), (3.95), and (3.81) respectively. The main
delivery dimension was delivery customer order on time.
Fig: 5-6 Deliver Strategy
4.454.54
4 3.95
3.81
3.4
3.6
3.8
4
4.2
4.4
4.6
Delivery the kindof productsneeded
Delivery customerorder on time
Providedependabledelivery
Implementshipment tracking
Short order‐todelivery time
Delivery Strategy

172
5-4-2 Supplier Partnership Strategy
How important are the following supplier partnership strategies to your organization?
I- Reliability Assessment The Cronbach’s Alpha and Corrected – Item To Total Correlation were calculated
first for the three main dimensions. Table 5-10 below shows the calculation results.
The reliability of supplier relationship strategy was (α=0.675). Thus, the construct is
internally consistent and reliable. This value shows the consistency and reliability of
the construct.
Table 5-10 Crombach’s Alpha coefficient and CITC Correlation of Supplier Relationship
Strategy
Crombach’s Alpha coefficient and Corrected Item-To-Total Correlation of Supplier Relationship
Strategy
CONSTRUCT
ITEM
CORRECTED ITEM-TOTAL
CORRELATION
CRONBACH
ALPHA
α
Supplier relationship
strategy
Supplier
selection
.440
0.675 Supplier
involvement
.434
Supply base
reduction
.482
The Corrected Item To Total Correlation values are summarized in the above table.
It was found that, supplier selection has a value of (0.440), supplier involvement has
a value of (0.434), and supplier base reduction has a value of (0.482). The result
evidenced that the item scale correlations exceeded (0.40) and therefore, indicated
good item internal consistency for the core questionnaire and measuring the relevant
construct precisely.

173
II- Descriptive Statistics The descriptive statistics analysis of supplier partnership is illustrated in Figure 5-7.
As shown in Figure 5-7, the highest ranked item in supplier partnership strategy was
supplier selection with mean value of µ=4.77. This result suggested that supplier
partnership strategy is primarily influenced by the supplier selection. This result is
consistent with the past studies of traditional organizations. The world class
organizations give equal consideration to supplier involvement and using few base
suppliers.
Fig: 5-7 Supplier Partnership Strategy
5-4-2-1 Supplier Involvement Strategy
How important are the following supplier Involvement techniques to your
organization?
I- Reliability Assessment
The internal reliability of the supplier involvement strategy construct was
assessed using the standardized Cronbach’s Alpha coefficient. The Alpha
coefficient was (α=0.846) which consider reliable.
Supplier Involvement strategy was examined with two different dimensions as
follows: Product Design and Continue Improvement. Table 5-11 below shows
the reliability and Corrected Item -To- Total Correlation of supplier involvement
4.77
3.112.78
3.85
0
1
2
3
4
5
6
Supplier selection Supplier involvement Supply base reduction supplier partnershipstrategies
Supplier Partnership Strategy

174
strategy.
The Corrected – To- Total Item Correlation values are summarized in Table 5-16
above. It was found that, the Product Design has a value of (0.645) and the
Continous Improvement has a value of (0.755). The result evidenced that the item
scale correlations exceeded (0.40) and therefore, indicated good item internal
consistency for the core questionnaire and measuring the relevant construct
precisely.
Table 5-11 Crombach’s Alpha coefficient and CITC of Supplier
Involvement Dimension
Crombach’s Alpha coefficient and CITC of Supplier Involvement Dimension
THE
CONSTRUCT
CRONBACH’S
ALPHA α ITEMS
CORRECTED- ITEM-
TO TOTAL
CORRELATION
supplier Involvement
.846 Product Design .645
Continous
Improvement
.755
II- Descriptive Statistics In this part of the survey, the respondents were questioned on the extent of their
involvement of their suppliers in the product design and continuous improvement
programs. The first issue dealt with the supplier involvement in the design process
and the second issue is the supplier involvement in the continuous program.
Fig: 5-8 Supplier Involvement
3.59
3.863.75
3.43.53.63.73.83.9
Product Design ContinousImprovement
Supplier Involvement
Supplier Involvement

175
Figure 5-8 shows the mean value of the respondents’ results regarding Supplier
Involvement. It suggests that the respondents perceived “Continues Improvement” to
be more important than involving their supplier in the design program with mean
value of µ=3.86. This could be because most of the companies investigated either
produced pre designed product or a product that does not. Yet, introducing the same
product with different design attracts more market. The result suggested there is an
opportunity to engage suppliers in improvement projects and in product design, for
the benefits of both parties.
As conclusion, organizations that ignore the potentials of supplier involvement into
process improvement might lose competitive advantage in their markets.
5-4-2-2 Supplier Base Reduction Strategy
Please tick (√) the number that accurately reflects your organization present Dimension in depending on small number of suppliers.
I- Reliability Assessment Cronbach’s Alpha coefficient with value more than (0.7), was used to assess the
reliability of the four (4) dimensions. The Cronbach’s Alpha coefficient values of
this construct falls within the acceptable range (.711) to conclude good reliability.
Supplier base reduction strategy was constructed with four (4) different items as
follows:
1. Rely on a small number of suppliers,
2. Receiving multiple quotes from suppliers before ordering
3. Rejecting suppliers for price reasons
4. Refusing suppliers for quality reasons
Table 5-12 below shows the reliability of supplier selection strategy and Corrected-
To- Item Correlation. The coefficient alpha of the main construct was (α=0.711).
The reliability coefficients is slightly more than the benchmark limit (0.70).Thus, the
construct is internally consistent and reliable.

176
The Corrected Item – To - Total Correlation values are summarized in the above
table. It was found that, Rely on a small number of suppliers has a value of (0.556),
Receiving multiple quotes from suppliers before ordering has a value of (0.548),
Rejecting suppliers for price reasons has a value of (0.645), and Refusing suppliers
for quality reasons has a value of (0.621). The result evidenced that the item scale
correlations exceeded (0.40) and therefore, indicated good item internal consistency
for the core questionnaire and measuring the relevant construct precisely.
Table 5-12 Cronbach Alpha coefficient and CITC of supplier selection strategy
Cronbach Alpha coefficient and Corrected Item-to-Total Correlation of supplier selection
strategy
THE
CONSTRUCT
CRONBACH’S
ALPHA α ITEMS
CORRECTED-
ITEM-TO TOTAL
CORRELATION
Supplier Base
Reduction
.711
Rely on a small number of
suppliers .556
Receiving multiple quotes
from suppliers before
ordering
.548
Rejecting suppliers for price
reasons .645
Refusing suppliers for quality
reasons .621
II- Descriptive Statistics The survey questionnaire asked respondents to score the degree of agreement of the
firm’s supplier selection strategy on a scale of 1 (strongly disagree) to 5 (strongly
agree). The dimensions of this construct include; relying on a small number of
suppliers, receiving different quotes, rejecting suppliers for price reasons, and
refusing suppliers for quality.

177
Fig: 5-9 Supplier Base Reduction
The illustration shown above in Figure 5-9 suggested that the respondents did not
perceive supplier base reduction as important part to their supplier partnership
strategy. This result is in contradiction with the supply chain best dimension.
The study shows that few SMEs consider supply base reduction as a strategy to
manage their suppliers. Best supply chain companies are reducing the number of
primary suppliers and allocating a majority of the purchased material to a single
source (Kekre et al., 1995).
5-4-3 Customer Relationship Dimension
How Important are the following Customer Relationship Strategy to your
organization?
I- Reliability assessment The survey investigated the main two components of customer relationship
Dimension; Customer Relationship Dimension, and Customer Supplier
Relationships. In order to have deep study, again both the components were divided
into different dimensions. The research studied the Customer Relation Dimension
construct by looking at four (4) different sub scales. While Customer Supplier
Relationships studied by looking at five (5) different dimensions.
Table 5-13 shows the Cronbach’s alpha values of the main two components of
customer relationship Dimension. The table shows the Corrected Item-to Total
2.65 2.52.21 2.33
3.58
00.51
1.52
2.53
3.54
we rely on asmall number
We dropsuppliers
We dropsuppliers forprice reasons
We dropsuppliers for
quality reasons
Supplier BaseReduction
Supplier Base Reduction
Mean

178
Correlations values too. The Cronbach’s Alpha coefficient of the general index
(customer relationship Dimension) is (0.732) which means that this construct is
reliable and can be used to this research. The Corrected Item to Total Correlation of
“Customer Relation Dimension” is (0.566) and for “Customer Supplier
Relationships” is (0.643). Both values are above the cutoff. Thus, these two
components are measuring the customer relationship strategy.
Table 5-13 Cronbach Alpha coefficient and CITC of Customer Relation Dimension
Cronbach Alpha coefficient and Corrected Item-To-Total Correlation of Customer
Relation Dimension
CONSTRUCT ITEM
CORRECTED
ITEM-TO TOTAL
CORRELATION
CRONBACH’S
ALPHA
α
Customer
Relationship
Strategy
Customer Relation
Dimension .566
0.732 Customer Supplier
Relationships
.643
II- Descriptive Statistics The respondents were asked to rank the importance of the customer relationship
strategy to their organization. The mean of respondents are 4.44 and 4.46 for
Customer Relation dimension and Customer Supplier Relationships respectively. , see
Table 5-21.
Figure 5-10 below illustrates the importance mean of Customer Relationship
Strategy of SMEs operated in Saudi Arabia. These are prioritized as follows;
customer supplier relationships (µ =4.46), follows by customer relation dimension
(µ= 4.44). From the table, it can be realized that the both dimensions are considered
important. The overall mean value (µ) of the main construct was customer relationship
strategy was (µ =4.56).

179
Fig: 5-10 Customer Relationship Strategy
The result of this analysis evidences the importance of customer to an organization.
The customer is the reason for an organization being a live and making profitable
business. So, it is important to keep the customer relation healthy and strive to
maintain successful relationship between an organization and its customers.
The core theme of all CRM is its focus on “Customer Relation dimension” and
“Customer- Supplier Relationship”. These are found to be the main strategy toward
successful customer relationship strategy. In the current era of hyper-competition
locally and at globe level, marketers are forced to be more concerned with customer
retention and loyalty (Reichheld, 1996).
As several studies have indicated, retaining customers perhaps offers a more
sustainable competitive advantage than acquiring new ones. What marketers are
realizing is that it costs less to retain customers than to compete for new ones
(Rosenberg &Czepiel, 1984). Similarly, being a supplier for large organization,
SMEs pay more attention to develop, maintain and improve their business relation
with their customer. Having realized that, SMEs need to build its strategy around
this understanding.
4.444.46
4.56
4.384.4
4.424.444.464.484.5
4.524.544.564.58
Customer Relation Practice Customer SupplierRelationships
Customer Relationshipstrategy
CUSTOMER RELATIONSHIP STRATEGY

180
5-4-3-1 Customer Relationship Management
How important are the following Customer Relation to your organization?
I- Reliability assessment The measurement scale for the assessment of Customer Relation dimensions was
derived by conducting a reliability analysis using the Cronbach’s Alpha coefficient.
As a result, the Alpha (α) value was (.652).
Table 5-14 Cronbach’s Alpha coefficient and CITC of Customer Relationship Dimension
Cronbach’s Alpha coefficient and Corrected Item-To-Total Correlation of Customer Relationship Dimension
THE
CONSTRUCT CRONBACH’S
ALPHA α SUB SCALE
CORRECTED-
ITEM-TO TOTAL
CORRELATION
Customer
Relation
Dimensions
.652
Setting business ethic jointly .503 Measuring Customer Satisfaction .549
Determine future customer expectation .487
Having joint venture improvement program .443
Corrected Item- To Total Correlation for each item of customer relation Dimension
was evaluated and summarized in Table 5-14. Corrected Item- To- Total Correlation
of “Setting business ethic jointly” was (.503), “Measuring Customer Satisfaction”
was (.549), “Determine future customer expectation” was (.487), and “Having joint
venture improvement program” was (.443). It is clear from the analysis that the
results were above the cut off value (.4). This provides evidence of good correlation
between the component and its core construct.

181
II- Descriptive Statistics The purpose of examining the Customer Relation Dimension is to contribute further
to our understanding its significance to the supply chain management and how it
effects on the firm performance.
Figure 5-11 below illustrates the importance of Customer Relation Dimension in
Saudi Arabia manufacturing SMEs. The overall mean of Customer Relation
Dimension was 3.59. This moderate level of mean is subject of concern.
The mean values of all parameters are more than (3) Neutral and closed to 4(agreed).
It can be seen that the customer relation dimension is moderate in importance (on a
scale of 1–5), represented by setting business ethic jointly” was (µ=4.15),
“Measuring Customer Satisfaction” was (µ=4.17), “Determine future customer
expectation” was (µ=4.14), and “Having joint venture improvement program” was
(µ=3.93). The mean of overall index was (µ=3.59).
The figure above shows that customer satisfaction is the most important dimension
among others because of its inherent barrier to competition.
Fig: 5-11 The Importance of Customer Relation Dimension
Small- and medium-sized enterprises generally have limited sources and channels for
reaching customers; consequently they are concerned about keeping customers.
Satisfying customers’ needs is the central purpose of any business. Dibb et al. (1994)
3.33.43.53.63.73.83.94
4.14.2
Settingbusiness ethic
jointly
MeasuringCustomerSatisfaction
Determinefuture
customerexpectation
Having jointventure
improvementprogram
CustomerRelationPractice
4.15 4.17 4.14
3.93
3.59
Customer Relation Dimension
Mean

182
describe customer satisfaction as the major aim of marketing. Organizations can
outperform their competition by exceeding, not just satisfying, and the needs of their
customers. SMEs by maintaining this strategy will not only maintain their
customers’ base but will add more customer names to their profile.
5-4-3-2 Customer supplier relationships
How important are the following Customer Supplier Relationships Dimensions to your organization?
I- Reliability Assessment
The reliability assessment of Customer Supplier Relationships dimensions by means
of Crombach’s alpha and Corrected Item-to Total Correlations were calculated and
are shown in Table 5-15. The Crombach’s Alpha of the main construct was found
(0.780). This is well accepted alpha value.
Table 5-15 Cronbach’s Alpha coefficient and CITC of Customer Supplier Relationships Cronbach’s Alpha coefficient and CITC Customer Supplier Relationships
CONSTRUCT CRONBACH'S ALPHA α ITEMS
CORRECTED ITEM-TO TOTAL
CORRELATION
Customer supplier
relationships
0.780
Conveying accurate information .582 Developing and maintaining a positive relationship .566
Using compatible technologies .565 Opening lines of communication .553 Engaging in problem solving .625
The Corrected Item-To-Total Correlations for each item of Customer supplier
relationships; conveying accurate information , developing and maintaining a
positive relationship, using compatible technologies, opening lines of
communication and engaging in problem solving are (0.582), (0.566), (0.565),
(0.553), and (0.625) respectively. All these values are above the cutoff value (0.4)
and thus the correlations are found to be significant and measuring the customer
supplier relationships dimensions.

183
II- Descriptive Statistics
When the respondents asked for the importance of customer supplier relationships
dimensions, their answers were illustrated in Figure 5-12. The Figure below
illustrates the importance mean of customer supplier relationships dimensions in
Saudi Arabia manufacturing SMEs. These are prioritized as follows; Opening
lines of communication, Developing and maintaining a positive relationship,
Conveying accurate information, Using compatible technologies, and Engaging in
problem solving (4.64), (4.25), (4.10), (3.65), and (3.43) respectively. The main
customer supplier relationships dimension was Opening lines of communication.
Fig: 5-12 Customer Supplier Relationships
5-4-4 Information Strategy in Supply Chain
How important are the following information strategies to your organization?
I- Reliability Assessment Table 5-16 shows the Cronbach’s Alpha value for each scale and Corrected Item-To
Total Correlations.
The survey divided the information strategy dimension into two constructs (2);
information quality and information sharing. The formal one was presented by five
4.644.25 4.1
3.65 3.43
00.51
1.52
2.53
3.54
4.55
Customer Supplier Relationships

184
dimensions (5) and the information sharing was presented by five dimensions (5)
too.
Table 5-16 summarizes the results of the internal consistency reliability analysis for
the information strategy dimension. The construct achieved alpha of (0.772) that
exceeded the accepted minimum coefficient of (0.70) which is required for analysis.
Thus, the construct is internally consistent and reliable.
Corrected Item- to Total Correlation (CITC) was calculated, as summarized in Table
5-16 for the core questionnaire, information strategy dimension. It was found that,
(CITC) information quality is (0.679) and information sharing is (0.723). The result
evidenced that the item scale correlations exceeded (0.40) and therefore indicated
good item internal consistency for the core questionnaire and measuring the same
construct precisely
Table 5-16 Cronbach Alpha coefficient and CITC of information strategy
Table Cronbach Alpha coefficient and Corrected Item-To-Total Correlation of information strategy
CONSTRUCT ITEM CORRECTED ITEM-TO TOTAL CORRELATION
CRONBACH’S ALPHAα
information strategy
Information Quality
.679
0.772 Information Sharing
.723
II- Descriptive Statistics The respondents were asked to rank the importance of the information strategy. The
measurements were ranged from one (very unimportant) to five (Very important).
Their answers were illustrated in Figure 5-13. The mean value shows the low
acceptance of these parameters as success factor for better strategy (3.05 – 3.81).
The illustration shows the importance mean of information strategy in Saudi Arabia
manufacturing SMEs. These are prioritized as follows; information quality (3.52),
information sharing (3.05). The main information strategy was information quality
Dimensions. The overall mean value (µ) of the main construct was (3.81).

185
Fig: 5-13 Information Strategy Dimension
5-4-4-1 Information Quality
How important are the following information quality to your organization?
I- Reliability Assessment The assessment of information quality was derived by conducting a reliability
analysis using the Cronbach’s alpha coefficient. As a result, the alpha (α) value of
information quality construct was (.991).
Table 5-17 Cronbach’s Alpha coefficient and CITC of Information Quality Dimension
Cronbach’s Alpha coefficient and CITC of Information Quality Dimension
THE
CONSTRUCT
CRONBACH’S
ALPHA α SUB SCALE
CORRECTED-
ITEM-TOTAL
CORRELATION
Information
Quality
.911
information exchange is timely .794 information exchange is accurate .817 information exchange is complete .834 information exchange is adequate .776 information exchange is reliable .651
Corrected Item –to Total Correlation for each item of information quality was
evaluated and summarized in Table 6-17. Corrected Item –to Total Correlation of
“timely information was (.794)”, “accurate information was (.817)”, “complete
information was (.834)”, “adequate information was (.776)”, “reliable information
was (.651)”. It is clear from the analysis that the results were above the cut off value
3.52 3.053.81
012345
information quality information sharing Information StrategyPractice
The Dimension
Information Strategy Dimension
Mean

186
(.4). This provides evidence of good correlation between the component and its core
construct.
II- Descriptive Statistics The purpose of examining the information quality is to contribute further to our
understanding of the significance of quality of shared information and how it effects
on the firm performance.
Figure 5-14 below illustrates the importance mean of information sharing in Saudi
Arabia manufacturing SMEs. Information quality dimension is represented by
timely information exchange (3.19), the accuracy of information exchange is (3.28),
completeness of information exchange is (3.08), adequacy of information exchange
(3.23), and reliability of information reliability is (3.15).The most important
parameter was the accuracy of information exchanged. The overall mean of
information was (3.22). This low level of mean for most of the item is subject of
concern.
Fig: 5-14 Information Quality Dimension
Previous studies have demonstrated that sharing information significantly improves
operational supply chain performance (e.g., Hill & Scudder, 2002). While
information sharing is important, the significance of its impact on supply chain
performance depends largely on the quality of the shared information where quality
refers to the shared information’s usefulness, accuracy, and accessibility (Li, Ragu-
3.19
3.28
3.08
3.23
3.15
3.22
2.95
3
3.05
3.1
3.15
3.2
3.25
3.3
informationexchange is
timely
informationexchange isaccurate
informationexchange iscomplete
informationexchange isadequate
informationexchange isreliable
Informationquality
Information Quality Dimension
Mean

187
Nathan, Ragu-Nathan, &Rao, 2006). Sharing low quality information that is void of
these attributes may not benefit supply chain participants (Huang, Lau, &Mak,
2003).
5-4-4-2 Information Sharing
How important are the following information sharing Dimension to your organization?
I- Reliability Assessment To test the reliability of the main domain (Information sharing), the internal
consistency of the questionnaire was measured using Cronbach's Alpha coefficient
(α). The alpha for the main attribute was found to be (0.882), which suggested that
the domain is reliable and significant.
Looking at Table 5-18, one can see that the Corrected Item-To Total Correlations
seems to be significant and that measuring the main domain. The Corrected Item-to
Total Correlations of “informing partners of changing needs” is (.649), “share
proprietary information” is (.736), “sharing business knowledge” is (.649),
“exchange information for business planning” is (.579), and “keeping each other
informed” is (.552). It can be concluded that the values are significant and the sub
scale are correlated to the main domain.
Table 5-18 Cronbach’s Alpha coefficient and CITC of Information Sharing Dimension
Cronbach’s Alpha coefficient and Corrected Item-To Total Correlations of Information
Sharing Dimension
THE
CONSTRUCT
CRONBACH’S
ALPHA α SUB SCALE
CORRECTED- ITEM-TO
TOTAL CORRELATION
Information
Sharing
.882
informing partners of changing needs
.649
share proprietary information .736share business knowledge .649 exchange information for business planning
.579
keeping each other informed .552

188
It is shown that “share proprietary information” is the highest correlated one, with a
value of (.736), followed by “inform trading partners in advance” which in turn
followed, “exchange information for business planning” and “keeping each other
informed “ is the weakest correlated to the main domain with a value of (.552).
II- Descriptive Statistics Figure 5-15 illustrates the detail results of information sharing dimension. From the
graph, one can notice that the mean of “informing partners of changing needs” is
(2.94), “share proprietary information” is (3.10), “sharing business knowledge” is
(3.23), “exchange information for business planning” is (2.81), and “keeping each
other informed” is (2.79). The overall mean of information sharing is (3.75).
Information within supply chain can vary from strategic to tactical in nature. Many
researchers have suggested that the key to the seamless supply chain is making clear
and up-to-date marketing data available at every node within the supply chain.
Sharing available information within supply chain with other parties in the chain
plays crucial role in partnership success and thus for SCM performance.
Fig: 5-15 Information Sharing Dimension
The graph above illustrates the importance of information sharing Dimension for the
group sample of the study. It can be seen that the decreased importance for
information sharing is an area of concern. There should be reasons behind such
results. The reasons could be the low level of trust experienced between the partners,
supplier uncertainty, and un- availability of supported IT to share the required
information, or identification of information to be shared.
2.94 3.1 3.232.81 2.79
3.75
0
1
2
3
4
informing of changing needsshare proprietary informationshare business knowledgeexchange information for business planning keeping each other informedInformation sharing
Information Sharing Dimension
Mean

189
5-4-4-3 Usage of Information Technology
Please tick (√) ALL IT application (s) used in your business interactions with your suppliers.
The survey looks into the use of specific information technology applications in
business interactions, on “Yes”, “No” scale. The results are tabulated in Table 6-20
and illustrated as shown in Figure 5-16. As can be seen from Figure 5-16, most
frequently used technologies are “Telephone”, “ Fax”, and E mails as (118), (122),
and (131) respectively. This represents (89.3%), (92.4), and (99.2) percent
respectively. The frequency of using E mails in business interactions is higher than
others. This gives good indications that some sort of new technology is being used
by Saudi Arabia SMEs in their business communication and interactions.
The implementation of IT technologies such as EDI and Intranet came just next to
Phone, Fax, and E mail with a percentage 43.2% and 56% respectively. This result
was not found to be as important as should be while literature emphasized IT
technology to be an essential component of SCM for smooth information flow.
The survey evidence showed that the level of application of IT technologies like E-
commerce, MRPII, Engineering data, and Manufacturing Execution in implementing
SCM strategies is very low. Table 6-20 shows that E-commerce is used by (36)
companies; MRPII is used by (14) companies, Engineering data is used by (4)
companies, and Manufacturing Execution is used by (5) companies. This figures
represent (2.3%), (14%), (3%), and (3.8%) respectively. The reason behind the low
level of application might be the investment and the level of skills which most of
SMEs suffer off.
Respondents showed moderate usage of Information technologies like Extranet,
MRP, ERP, Bar Code, and CAD in their SCM implementation. The statistical Table
5-19 shows that the percentage is between (14% – 27%). The benefits of using ERP
and Bar code in business control are well documented in the literature. Integrating
information across the enterprise and across the supply chains has long been
considered an important strategy to achieve substantial cost efficiencies.

190
Though enterprise resource planning (ERP) systems were considered costly and
risky in the 1990s, its benefits are well recognized in the literature. Some of the
benefits ERP systems could bring include operational efficiency and reduced costs,
enforcing a discipline of best Dimension processes and consistency.
Typical features of enterprise systems such as data integrity, real-time availability,
visibility and processing capability of information and standardized business
processes are expected to create an excellent backdrop for embarking on integration
with external partners in the supply chain. Enterprise Resource Planning (ERP)
system can position the organization for effective management of the supply chain.
Manufacturers’ investment in strategic infrastructure, such as Enterprise Resource
Planning (ERP) and EDI, can provide the foundation to bring people, processes, and
relationships together to build an integrated business system that supports the e-
business strategy for critical business initiatives without huge IT investments.
ERP systems have come a long way in providing for lean supply chain management
principles that are employed by organization. ERP provides an agile transaction
workflow that can be adapted to meet the needs of SMEs businesses.
They improve operational efficiency, save time, reduce errors, cut costs, and benefit
from customer or regulatory requirements. For these reasons, the implementation of
these technologies was expected to be more as evidenced in best Dimension
companies.
These results support the low level of implementation of certain important IT
technologies which is a subject of concern in developing supply chain capabilities.
The results illustrated in Figure 5-16 indicate that the respondents are not familiar
with the functions for the application of information and communication
technologies. Investment, skills and company size are most main obstacles for SMEs
for not adopting sophisticated or so advanced IT technology.

191
Table: 5-19 Information Technologies
Information Technologies
TECHNOLOGIES RESPONSE
IT TECHNOLOGY NO. PERCENTAGE
Phone 131 99.3%
Fax 122 98.4%
e-mail 118 89.2%
EDI 57 43.2%
Intranet 74 56.1%
Extranet 30 22.7%
MRP 24 18.2%
MRPII 14 3.0%
ERP 29 22.0%
Bar code 90 14.4%
E-commerce 3 2.3%
CAD 36 27.3%
Engineering data. 4 35.6%
Manufacturing execution. 5 25.8%
Fig: 5-16 IT Technology Applications
0 20 40 60 80 100 120 140
Phone
e‐mail
Intranet
MRP
ERP
E‐commerce
Engineering data.
No. of Respodents
IT Technology Application
No.

192
5-4-5 Supply Chain Logistics
Please tick the number that accurately reflects your organization present Dimension
I- Reliability Assessment The internal consistency measures (Cronbach’s Alpha) are obtained in order to assess
the reliability of the importance of supply chain logistics strategy for the study sample
(Saudi Arabia SMEs manufacturing sector). Table 5-20 shows the Cronbach’s Alpha
value for each scale and corrected item-to total correlations.
The survey divided the supply chain logistic strategy into three different strategies as
followed; 1) The coordination of inter organizational activities, 2) Smooth flow of
Information and material, and finally, 3) Integration of inbound and outbound
distributions activities.
Table 5-20 summarizes the results of the internal consistency reliability and
Corrected Item- To – Relation analysis for the supply chain logistics strategy. The
construct achieved alpha of (0.729) that exceeded the accepted minimum
coefficient of (0.70) which is required for analysis. Thus, the construct is internally
consistent and reliable.
Corrected Item- to – Total Correlation analysis of the inter organization activities has
a value of (0.568), Smooth flow of Information and material has a value of (0.574),
and finally, integration of inbound and outbound distributions activities has a value
of (0.527). The result shows that the item scale correlations exceeded (0.40) and
therefore, indicated good internal consistency for the core questionnaire and
measuring the same construct precisely.
The

193
Table 5-20 Cronbach Alpha coefficient and CITC of Supply Chain Logistics Strategy
Cronbach Alpha coefficient and Corrected Item-To-Total Correlation of Supply Chain Logistics Strategy
CONSTRUCT ITEM CORRECTED ITEM-TOTAL
CORRELATION
CRONBACH’S ALPHA
α
Supply Chain Logistics
Close coordination of inter organizational activities .568
0.729
Smooth flow of Information and material
.574
Integration of inbound and outbound distributions .527
II- Descriptive Statistics The respondents were asked to rank their agreement with the supply chain logistics
strategy. Figure 5-17 below illustrates the findings of supply chain logistics strategy
in Saudi Arabia manufacturing SMEs. Those are prioritized as follows; inter
organization activities are closely coordinated (µ =3.52), inbound and outbound
distributions are integrated (µ=3.21), and information and material flow smoothly
(µ=3.05). The overall mean value (µ ) of the main construct was (3.81). The responses
were at the left side of the ranking scales; especially from strongly disagree to
neutral. This means that most of the organizations examined and perceived, has little
or no crucial importance for the supply chain logistics, in framing their supply chain
strategy management.
The findings suggested that SMEs manufacturing companies operated in Eastern
province of Saudi Arabia do not seem to be ready for playing a significant and
demanding role in supply chains. Current insufficiencies, including limited abilities
in closely coordinating the inter organization activities, in the smoothness flow of
information and material, and finally in the integration of inbound and outbound
distributions are the basic requirements, Failing to comply with basic requirements
of logistic Dimension will jeopardize the supply chain performance of this industry.

194
Fig: 5-17 Supply Chain Logistics
To overcome these limitations and weakness the organization should:
1. Ensure transparency among its stake holders.
2. Establish concrete terms and conditions for the long term relationship.
3. Develop proper communication by sharing accurate and information with strong IT
back up. Efficient IT support can be provided by increasing investment in
technology, and by enhancing technical manpower.
4. Introduce proper planning and implementation of transportation & distribution
activities, combined timely flow of information and considerably reduced cost,
thereby integrating the inbound and outbound distribution.
5-4-6 Supply Chain Initiatives Data Analysis
Please tick the number that accurately reflects your organization present Dimension
During the 1880s and1990s the software support systems transited from simple
packages to more broad and complicated software that to facilitate the linkage of
different parties in the chain. Electronic Business, Internet, enterprise resource
planning (ERP), and manufacturing resource planning (MRPII) are just examples of
this Information Technology development.
3.523.05 3.21
3.81
00.51
1.52
2.53
3.54
4.5
Interorganizationactivities are
closelycoordinated
Informationand material
flowsmoothly
Inbound andoutbound
distributionsare
integrated
Supply ChainLogisticsStrategy
Supply Chain Logistics
Mean

195
The study examined about initiative strategy of the SME manufacturing companies
in adopting different IT applications. It includes, implementation of IT, E –
Business, Internet, Bar Code, and EDI. The respondents were asked to identify their
strategy of adoption against each type of technology.
Figure 5-18 17 illustrates the respondent’s reply for supply chain initiatives. It shows
the applications of Internet, E Business, and Bar Code are very low. On other side, it
is clear that likeliness towards these applications is very low. Some companies are
planning to adopt different sort of applications. The companies in the “MAY BE”
category is also considerable.
Fig: 5-18 Supply Chain Initiatives
This question concludes that supply chain initiatives of SMEs are behind in term of
IT, E – Business, Internet, Bar Code, and EDI. The level information sharing; BAR
CODING, E Business and Internet are very low when compared to world class
manufacturing industry due to lack in skill, investment and the market where they
operated in.
In terms of current consideration for future usage, there are good number of
companies were currently considering adoption of IT, E – Business, Internet, Bar
Code, and EDI. This is a step in the right direction for the Saudis’ SMEs trying to
perfect their supply chains. This initiative will positively change the ways that
companies communicate with their customer and suppliers. These kinds of IT
0 50 100 150 200 250 300
NOT LIKELY
MAY BE
PLANNED
IN PLACE
Supply Chain Initiatives
IT
INTERNET
E‐ Business
BAR CODE
EDI

196
applications provide immediate, cost-effective, and more secure shared information
between the supply chain players. Further, SMEs that adopted these initiatives will
result in an earlier shipment of orders than most of their competitors and can
facilitate accurate, frequent, real-time and seamless exchange of information, both
internally and inter-organizationally.
5-4-7 Performance Measurement
How important are the following performance measures to your organization?
I- Reliability Assessment The survey divided the performance measurement in to two main components. They
are “Financial Performance” and “Operational Performance”. For in depth
Knowledge, the components are further divided in to five and four different small
dimensions.
The financial performance is divided into “Growth in sales”, “Growth on assets”,
“Market share gain”, “Return on investment”, and “Profit margin on sales” and the
Operational Performance was divided into (4) dimensions as “Volume Flexibility”,
“Scheduling Flexibility”, “Delivery reliability”, and “Product quality”.
Table 5-21 shows the Cronbach’s Alpha (α) values of the main two components of
performance measurement. The table shows the Corrected Item-to Total Correlations
values too. The Cronbach’s Alpha coefficient of the general index (Performance
measure) is (0.849), which means that the construct is reliable and can be used in this
research. The Corrected Item-to Total Correlations of financial performance is (0.897)
and for Operational performance is (0.523). Both values are above the acceptable
cutoff value. Thus, those two components are measuring the performance
measurement construct.

197
Table 5-21 Cronbach Alpha coefficient and CTIC of Performance measurement strategy.
Cronbach Alpha coefficient and Corrected Item-To-Total Correlation of Performance measurement strategy
CONSTRUCT ITEM CORRECTED ITEM-TO TOTAL CORRELATION
CRONBACH’S ALPHAα
Performance measurement Strategy
Financial performance
.897 0.849
Operational performance
.523
II- Descriptive Statistics The respondents were asked to rank the importance of the performance measurement
strategy to their organization. Figure 5-19 below illustrates the mean importance of
Performance Measurement Dimension in Saudi Arabia manufacturing SMEs which
has a mean (4.57). These are prioritized as follows; Financial measures (4.73),
Operational Measures sharing (4.14). From the table, it can be realized that the main
Performance Measurement Dimension is financial measures Dimensions. The
overall mean value (µ) of the main construct was (4.57).
Fig: 5-19 Performance Measurements Strategy
4.73
4.14
4.57
3.8
3.9
4
4.1
4.2
4.3
4.4
4.5
4.6
4.7
4.8
Financial performance Operationalperformance
PerformanceMeasurement Strategy
Practice
Performance Measrment Startegy

198
The result of this analysis shows no surprise. It is well documented in the literatures
that financial performance behaves as expected. The mean value of financial
performance is more important than the operational performance.
5-4-7-1 Financial Performance Measure
Please tick (√ )the number that accurately shows the importance of financial
performance measure to your organization
I- Reliability Assessment The data analysis resulted Cronbach’s Alpha coefficient with (.760). From the results
shown in Table 5-22, it can be concluded that this instrument meets the internal
consistency magnitude requirement and is therefore reliable.
Table 5-22 Cronbach Alpha coefficient and CITTC of financial Performance measurements
Cronbach Alpha coefficient and Item-To-Total Correlation of Financial Performance
measurements
CONSTRUCT ITEM CORRECTED ITEM-TO
TOTAL CORRELATION
CRONBACH’S
ALPHA
α
Financial
Performance
measurement
Growth in sales 0.537
0.760
Growth on assets 0.494
Market share gain 0.503
Return on
investment
0.649
Profit margin on
sales
0.477
The survey studied the component of financial performance measurements. The
breakdown of financial performance measure resulted in five (5) different
dimensions; Growth in sales, Growth on assets, Market share gain, Return on
investment, and Profit margin on sales. Table 6-24 shows the corrected item-to total
correlations values for each sub scale. Growth in sales (0.537), Growth on assets
(0.494), Market share gain (0.503), Return on investment (0.649), and Profit margin

199
on sales (0.477). All of these values are above the cutoff value which indicates that
they measure the financial performance construct precisely.
II- Descriptive Statistics The importance of Financial Performance was addressed through the use of means
value. Figure 5-20 shows that Growth on assets comes on the top followed by
Growth on sales. Whereas, Return on investment index has the lower mean value
(µ=4.33). Growth in sales has an average mean of (µ =4.56), Growth on assets has
an average mean of (µ =4.69), Market share gain has an average mean of (µ =4.39),
Return on investment has an average mean of (µ =4.33), and Profit margin on sales
has an average mean of (µ =4.52). This analysis brings “Growth on assets” on the
top of the rank and “Return on Investment” on the tail of the list. The overall index
of financial measurement ha an average mean (µ =4.73) which indicate very
important dimension. These values are illustrated in Figure 5-19.
One can realize that all the organizations under study evaluated their performance
based on the traditional concept of the performance measurement.
Fig: 5-20 Financial Performance Measurements Strategy
4.56
4.69
4.394.33
4.52
4.73
4.1
4.2
4.3
4.4
4.5
4.6
4.7
4.8
Growth insales
Growth onassets
Market sharegain
Return oninvestment
Profit marginon sales
Financialperformancemeasure.
Financial Performance

200
5-4-7-2 Operational Performance Measure
Please tick the number that accurately shows the importance of operational
performance measure to your organization I- Reliability Assessment
Table 5-23 shows the Cronbach’s alpha values of the Operation Performance
constructs and the Corrected Item-to Total Correlations values. The Cronbach’s alpha
coefficient of the general index (operation performance measure) is (α=0.848) which
means that this construct is reliable. The calculated value of corrected item total
correlation is indicating that there is a high correlation between the subscales of
Operational Performance Measurement and the main construct.
The Corrected Item to Total Correlation of “Volume Flexibility” is (0.681),
“Scheduling Flexibility” is (0.855), “Delivery Reliability” is (0.752), “Product
Quality” is (0.667), and customer satisfaction index (0.841). They are above the
cutoff value and considered acceptable as they the construct precisely.
Table 5-23 Cronbach Alpha coefficient and CITC of Operational Performance measurement strategy
Cronbach Alpha coefficient and Item-To-Total Correlation of Operational Performance
measurement strategy
CONSTRUCT ITEM CORRECTED
ITEM-TO TOTAL CORRELATION
CRONBACH’S ALPHA α
Operational Performance measurement
Volume Flexibility .681
0.848 Scheduling Flexibility
.855
Delivery reliability. .752 Product quality .667 Customer satisfaction index
.841
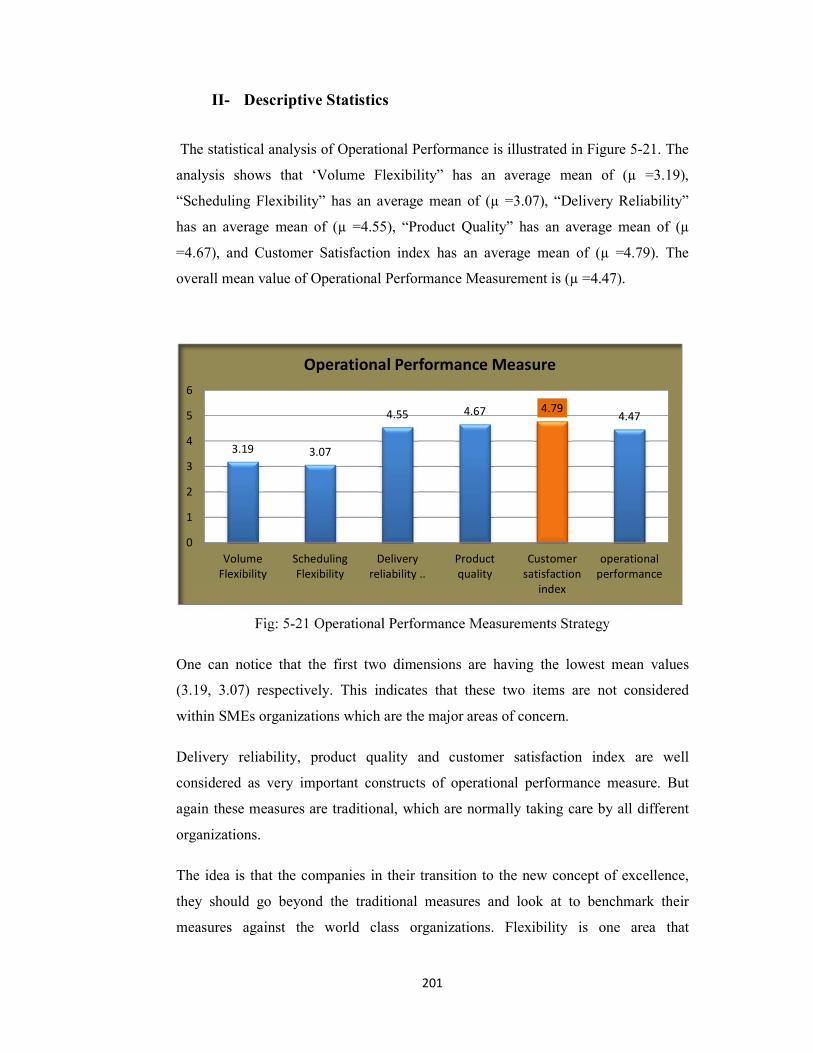
201
II- Descriptive Statistics
The statistical analysis of Operational Performance is illustrated in Figure 5-21. The
analysis shows that ‘Volume Flexibility” has an average mean of (µ =3.19),
“Scheduling Flexibility” has an average mean of (µ =3.07), “Delivery Reliability”
has an average mean of (µ =4.55), “Product Quality” has an average mean of (µ
=4.67), and Customer Satisfaction index has an average mean of (µ =4.79). The
overall mean value of Operational Performance Measurement is (µ =4.47).
Fig: 5-21 Operational Performance Measurements Strategy
One can notice that the first two dimensions are having the lowest mean values
(3.19, 3.07) respectively. This indicates that these two items are not considered
within SMEs organizations which are the major areas of concern.
Delivery reliability, product quality and customer satisfaction index are well
considered as very important constructs of operational performance measure. But
again these measures are traditional, which are normally taking care by all different
organizations.
The idea is that the companies in their transition to the new concept of excellence,
they should go beyond the traditional measures and look at to benchmark their
measures against the world class organizations. Flexibility is one area that
3.19 3.07
4.55 4.67 4.794.47
0
1
2
3
4
5
6
VolumeFlexibility
SchedulingFlexibility
Deliveryreliability ..
Productquality
Customersatisfaction
index
operationalperformance
Operational Performance Measure

202
organizations should consider as one of their operational performance especially in
uncertain business environment that most of supply chain facing in nowadays.
As competition intensified so did the uncertain business environment. For supply
chain be effective and manage their business risk, it should consider manufacturing
flexibility within their strategy.
5-5 Summary This chapter has presented an empirical study which examined the current supply
chain dimensions within SMEs in the manufacturing sector of Eastern Province,
Saudi Arabia. Based on the findings from the data analysis, the following points can
be concluded:
1- Using Cronbach’s Alpha index, this study has shown that supply chain
Dimensions adopted are valid and reliable. Therefore, this study supports the
positive argument concerning the applicability of SCM Dimensions for larger study,
different business sectors, and for different geographical areas.
2- Manufacturing strategy was given considerable thrust among the supply
chain best Dimensions. The choice between these Dimensions may change over
time, contingent on market context and corporate strategy of a company. It is
proposed that SMEs look at adopting more manufacturing strategy attributes similar
to what world class companies do. Flexibility in production was found as a common
strategy within world class manufacturers.
3- Supplier partnership strategy was influenced by supplier selection. For this
strategy to be more sufficient, supplier involvement and using few base suppliers
should be an integral part of the strategy. After all inclusiveness is an integral aspect
of SCM
4- Businesses always see the customers as the reason for an organization being
alive and making profitable business. SMEs being suppliers for large organizations,
they should pay more attention to develop, maintain and improve their business
relation with their customers. Having realized it, SMEs need to develop their

203
strategy around this understanding. Customer orientation is very much essential for a
successful business.
5- Most of the companies investigated failed to comply with basic requirements
of logistic Dimension which will jeopardize the supply chain performance of this
industry. The study gave some suggestions to overcome these weaknesses as the
weakest link above determines the strength of the chain.
6- The study found that most of the respondent companies were not motivated
to have advanced supply chain initiatives. Partially, may go to the investments and
skills needed and other may go for the awareness on the benefits of such initiatives.
7- It appears from this survey that in Saudi Arabia SMEs performance
measurement is more about the financial performance overlooking the importance of
operational performance. Despite the overall findings produced in this study, the
author believe that this topic still opens opportunities for further studies, particularly
considering the fact that industry sectors now have become more dominating sector
in the economy of the country.
8- The study has reached to a general conclusion that SCM Dimensions are still
in its infancy in Saudi Arabia SMEs manufacturing sector. Even though, they have
recognized its importance, implementation of these Dimensions is still lagging in
their business strategies.
The next chapter, Chapter Six, will deal with developing of supply chain
framework model. The framework model will be thoroughly reviewed, discussed
and validated.
204
CHAPTER SIX
SUPPLY CHAIN FRAMEWORK MODEL, THEORTICAL PART & CASE STUDY IMPLEMENTATION
This chapter aims at developing a framework model for supply chain system of Saudi Arabia –SMEs. The framework is then tested and validated theoretically and practically in designated SME in Saudi Arabia, to see whether it works or it doesn't and why. The chapter starts with framework model Development, followed by framework model theoretical validation and framework model Implementation; practically validation. The chapter then ends with summary.
6-1 Framework Model Development; An introduction
The previous chapter discussed the feedback of the field survey related to this research.
However, to take this feedback and provide a useful framework model for practitioners
and researchers, the researcher needs to develop a testable framework model.
This chapter aims at developing a testable conceptual framework model. The objective
of the proposed framework model is to help the SMEs to eliminate or reduce the gap and
thus improve their supply chain.
The framework model was developed based on literature review, other works in the
same field, and the results of the field work study (survey) and the working experience
of the researcher in the manufacturing sector for more than 20 years. So this framework
model is based on a combination of theoretical and empirical research concepts and
practical experience.
This chapter is organized as follows. First, the definition of a framework model is given
to establish the proper understanding of what is framework and why it is needed.
Second, the framework model is thoroughly discussed. The framework model can be
used to identify the gap and compare key items in the current supply chain against the
proposed framework model and plan for improvement, which can be done through the
self-assessment protocol. The framework model is then theoretically validated and

205
tested. A case is selected to examine the framework model implementation. Finally, the
chapter will be ended by a conclusion.
6-2 Framework Model Definition Popper (1994) defines a framework as a set of basic fundamental principles, which can
help to promote discussions and actions. The authors have defined framework as a set of
simplified theoretical principles and practical guidelines for implementation and
adoption, which can enhance the chance of success that are easy to understand.
Frameworks portray through diagrams, flowcharts, and graphical or pictorial
representations (Yusof, 2000). A framework is used in research to outline possible
courses of action or to present a preferred approach to an idea or thought.
Struebing and Klaus (1997) believed a sound framework should define what the
organization does, what it is trying to do, how it is going to do it and ensure that each
step is done in the correct sequences.
Aalbregtse et al. (1991), for example cited the following reasons for having a framework
to:
illustrate an overview and communicate a new vision to the organization;
force management to address a substantial list of key issues which otherwise
might not be addressed;
give valuable insights into the organization’s strengths and weaknesses, and its
overall strategic position in the market-place; and
Support implementation and to improve the chance of success because it will
provide not only overview but also more detailed information describing the
content of each framework element and its relationship to other elements.
A question, which arises then, is how one can characterize a good framework that really
suits the SMEs. In general, the following criteria can be considered as a guide in
developing a good framework to suit the SMEs characteristics (Yusof and Aspin wall,
2000a):

206
systematic and easily understood;
simple in structure;
having clear links between the elements or steps outlined;
general enough to suit different contexts;
.represent a road map and a planning tools for implementation;
answers “how to?” and not “what is?”; and
Implementable at reasonable cost and time.
Thus, it is important that these criteria are considered when developing a framework model.
6-3 A Framework Model for improving SMEs supply chain management To improve the SMEs supply chain capability in a dynamic market, a proposed
framework model that is believed to level a company in a better position in the chain is
suggested.
The illustration representation given in Figure 7-1 which considered the basis of this
study identifies the four major components of the Framework Model. These components
are closely inter-related. In many respects, this is a fairly generic framework model that
may apply across a number of business settings. A number of typical elements have
been identified within each of the four major components. These are the framework
model foundation, framework model body, the framework model house roof, and finally
the framework model boundary. The components of the framework model are now
described hereunder in detail.
First Component: The framework model foundation
Second Component: The framework model body
Third Component: The framework model house roof
Fourth Component: The framework model boundary
The framework model roof stands for the ultimate goal of SCM competitiveness. Supply
chain competitiveness is represented by the financial and operational performance. As

207
an organization improves its two sub components, its ultimate competitiveness will be
improved.
The framework model roof rests on the framework model house body representing the
main components of basic SCM, supplier, focal company, customer, and the two flows;
information and material. Each part of the company is decomposed into subcomponents
as illustrated in the framework model sketch Figure 6-2. For example the supplier part
of the framework model body is represented by the three main sub components; supplier
selection, supplier evaluation, and supplier base reduction. The focal company is
represented by the manufacturing strategy components namely quality, cost, delivery
and flexibility. The customer side is represented by customer satisfaction and customer
loyalty.
The Framework Model House rests on two blocks of foundation. These are management
commitment and supply chain risk management. These two blocks play the role of
foundation because of their importance in any new strategy or initiative.
The framework model house is boarded by Deming’s “PDCA” continuous improvement
tool. This means that every component of the supply chain house should continuously be
reviewed and improved to coup with the business changes or challenges. The “PDCA”
cycle is a proven tool to improve system.
The framework model is more deeply discussed in this following section, in which each
component is thoroughly explained and discussed.

208
Fig: 6-1 Supply Chain Management House Framework Model
6-4 Framework Model Rationale The rationale underlying this research framework model is straightforward. First, the
implementation of SCM dimensions should be driven and facilitated by management
commitment. The management role behind the success or failure of any project initiative
is well documented in several studies.
The current dynamic business environment is characterized by high complexity and
fiercer competition mainly because of higher levels of manufacturing outsourcing, new
technologies, and shorter product life-cycles due to rapidly changing customer
preferences. All these and more factors often force companies to assume more
‘‘calculated risks’’, risks that managers must accept in order to improve
competitiveness, reduce costs and improve profitability. However, the downside
potential of the ‘‘calculated risks’’ could have adverse consequences that jeopardize the
whole supply chain’s ability to serve the final customers, thus affecting firms’ long-term
goal accomplishment (Svensson, 2002).

209
The business to be sustainable has to be measured. Normally, the business success is
measured by financial and operational performance. A higher level of SCM performance
will lead to an enhanced competitive advantage and further position an organization in
higher level of market lead.
Tompkins et al. (1998) have emphasized the importance of continuous improvement
processes within the value chain and subsequently coined the term “Supply Chain
Synthesis” (SCS). This is a continuous improvement process that ensures the
satisfaction of all players in the supply chain from original raw material providers to the
finished product consumer.
Supply Chain Continuous Improvement (SCCI) initiative emphasizes the creation of
teams of suppliers, manufacturers and retail customers who share information to
improve the performance and effectiveness of the whole chain. SCCI enables the
various links of the entire supply chain to work together in response to changing
consumer needs and trends. The SCCI initiative can be applied to a supply chain
orientation that is either a “pull” or a “push” system or a combination of both.
6-5 Framework Model Components The following discusses the detail of the framework model components. It starts with
framework foundations, framework body followed by framework roof. Finally, the
framework boundary is discussed.
I- Framework Model Foundation The framework model foundation consists of two blocks. These are supply chain risk
management and management commitment. The following section will discuss in detail
the two blocks.

210
I-1 Supply Chain Risk Management
a) Introduction The field of research in Supply Chain Risk Management has received lot of attentions in
the recent years for several reasons (Wagner & Christoph , 2006). First, disasters;
natural or man- made have increased in number and in intensity during the last decades
(Munich , 2006). Second is business competition. Competitive pressures often force
companies to assume more ‘‘calculated risks’’ (Svensson, 2002)—risks that managers
must accept in order to improve competitiveness ,reduce costs and improve profitability.
Another factor is that the business environment characterized by high complexity and
hence the supply chain. This is mainly because of higher levels of R&D and
manufacturing outsourcing, supplier–supplier relationships in supplier networks,
increased dependence on supplier capabilities, new technologies (Internet, RFID),
regulatory requirements (e.g., post 9/11 security regulations such as C-TPAT, or food
safety controls), shorter product life-cycles due to rapidly changing customer
preferences, and international market and production expansion (Stephen &
Nikrouz,2009).
In the light of these risks and their inherent consequences, it can be assumed that the
performance of a supply chain will be affected negatively. Based on a larger sample,
Hendricks and Singhal (2003, 2005) underscore the relevance of supply chain
disruptions by showing empirically that these events have a significant negative impact
on shareholder value (Singhal, 2003, 2005a) and on operating performance (i.e., sales,
operating income, return on assets) (Singhal, 2005b), it can be concluded from their
research that capital markets severely penalize supply chain disruptions and attach high
value. uttner ( uttner et al., 2003) identified be financial losses, a negative corporate
image or a bad reputation eventually accompanied by a loss in demand as well as
damages in security and health as consequences of supply chain disruptions

211
b) Supply Chain Risk Management Definition
Agreeing to a definition for the term risk has proved challenging for academics and
practitioners alike for over a century, leading to the conclusion that there are probably as
many definitions as writers on the theme (Ritchie and Marshall, 1992). The reason for
this variety of definitions reflects different academic and professional disciplines and
variations in the specific settings, decision contexts and problems being addressed.
Sitkin and Pablo (1992) reflect this in their generalized definition of risk as being ‘the
extent to which there is uncertainty about whether potentially significant and/or
disappointing outcomes of decisions will be realized.’ Zsidisin (2003) addressing the
supply chain context more specifically defines risk as the potential occurrence of an
incident or failure to seize opportunities with inbound supply in which its outcomes
result in a financial loss for the [purchasing] firm.’ Most definitions (MacCrimmon and
Wehrung, 1986) of risk comprise three common elements:
• Likelihood of occurrence of a particular event or outcome,
• Consequences of the particular event or outcome occurring,
• Exposure or Causal pathway leading to the event
Most definitions would incorporate the following clusters of activities:
• Risk Identification and Modeling – including the sources and
characteristics of risks, what may trigger them and the relationship to the
supply chain performance in terms of effectiveness and efficiency.
• Risk Analysis, Assessment and Impact Measurement assessing the
likelihood of occurrence and potential consequences.
• Risk Management – generating and considering alternative scenarios and
solutions, judging their respective merits, selecting solutions and
undertaking the implementation.
• Risk Monitoring and Evaluation – monitoring, controlling and managing
solutions and assessing their impact on business performance outcomes.
• Organizational and Personal Learning including Knowledge Transfer –
seeking to capture, extract, distill and disseminate lessons and

212
experiences to others within the organization and its associated supply
chain members.
These components of the SCRM approach represent an integrated decision making
approach and one which interacts extensively with other members of the supply chain.
c) Supply Chain Risk Management Strategies
There are five risk management strategies to deal with SCRM namely:
1- Postponement: Postponement entails delaying the actual commitment of
resources to maintain flexibility and delay incurring costs (Bucklin, 1965). Form
postponement includes labeling, packaging, assembly, and manufacturing.
Building on Perry (1991), who suggests the potential benefits of postponement
depend on the uncertainty projected in the operating environment, it is argued
that supply chains facing low demand uncertainty will not benefit as much from
form postponement as supply chains facing high demand uncertainty.
2- Speculation. Speculation (also called selective risk taking) is a demand-side risk
management strategy that is the opposite of postponement (Bucklin, 1965).
Bucklin (1965), mentions that “the principle of speculation holds that changes in
form, and the movement of goods to forward inventories, should be made at the
earliest possible time in the marketing flow in order to reduce the costs of the
marketing system.” It includes such actions as forward placement of inventory in
country markets, forward buying of finished goods or raw material inventory,
and early commitment to the form of a product, all in anticipation of future
demand.
3- Hedging. Hedging is a supply side risk management strategy. In a global supply-
chain context, hedging is undertaken by having a globally dispersed portfolio of
suppliers and facilities such that a single event (like currency fluctuations or a
natural disaster) will not affect all the entities at the same time and/or in the same
magnitude. Hedging is an expensive strategy because it involves creating
multiple options for decision variables.

213
4- Control/share/transfer- Control, share, or transfer of risks takes the form of
vertical integration, contracts, and agreements. Vertical integration increases the
ability of a member of a supply chain to control processes, systems, methods,
and decisions. Vertical integration may take the form of forward (downstream)
or backward (upstream) integration, and is therefore, both a supply side and
demand side risk management strategy.
5- Security- Global supply chain security encompasses information systems
security, freight breaches, terrorism, vandalism, crime, and sabotage. Security
strategy is aimed at increasing a supply chain’s ability to sort out what is
moving, and identify unusual or suspicious elements. Security strategy also
encompasses working closely with government and port officials to proactively
comply with regulations and avoid unnecessary delays at border-crossing points.
As a conclusion, SMEs can look into three risk sources namely demand and supply risk
which are the most important issues in supply chain risk management and therefore of
high relevance for practitioners and the catastrophic risks which are currently very
tropical and is receiving lot of attention. These risks can be managed through the six
strategies mentioned above like postponement, speculation, hedging, control / share/
transfer, security, avoidance. All security risks can be addressed, managed and
controlled through implementation of ISO 28000 security management systems. As
discussed above the supply chain risk management is the need of the hour to remain
competitive or to have competitive advantage through supply chain excellence, But the
only challenge for SMR is the identification of the risk form the supply perspective,
operational perspective , customer perspective and also have control mechanism to
address the risk form the environment as these risk vary from industry to industry , from
firm to firm from product to product and also from geography to geography.

214
I-2 Management Commitment In order to compete in the world markets, organizations are striving to improve their
competitive edge, and one aspect of which is supply chain management implementation.
All major competitive initiatives, especially those that demand substantial resource
dedication or a dramatic change in organizational philosophy require high levels of
management commitment. Supply Chain Management is no different. In their article,
(Competing on Capabilities), Stalk et al. (1992) noted that only the most senior levels of
management can dedicate the resources and realign the incentives to assure that true
cross-functional capabilities are developed. Further, as collaboration moves to higher
levels in an organization, the impediments to cooperation seem to grow in magnitude as
organizational politics and internal turf issues must be overcome. SCM inherently
involves high level of integration, making organizational support a prerequisite to
success. Supply chain commitment therefore is found to be the foundation of the supply
chain house framework in this research.
TQM and SCM share similarities in a way that both initiatives requiring management
commitment and aiming at improving an organization performance. Saraph, Benson,
and Shroeder (1989) developed a quality management instrument, identifying eight
critical factors of quality management. In the top of these factors comes top
management support. Flynn, Schoeder, and Sakibara (1994) developed seven constructs
of quality management while Ahire (1996) developed 12 constructs of quality
management. Black and Porter (1996) developed 8 constructs of quality management.
Zeitz, Johannesson and Ritchie. (1997) developed 7 constructs of quality management
while Joseph, Rajendran, &Kamalanabhan (1999) developed 10 constructs of quality
management. Rao, and Raghunathan (1999) made a significant contribution by
developing and validating a measurement instrument for international quality
management research, which consisted of 13 constructs of quality management. All
these studies find management commitment is the most important construct for the
successful of TQM implementation.

215
Strong commitment from the top management is vital in supply chain management
philosophy. Rao and Raghunathan, (1999) had described this construct as the top
management's commitment in providing active and timely support to build the
awareness, leading to higher business performance. Most of the other researchers
consent to this notion is (Saraph &Shroeder, 1989, Flynn, Schoeder and Sakakibara
1994, Ahire, 1996, Zeitz, Johannesson& Ritchie, 1997, Joseph, Rajendran &
Kamalanabhan, 1999). However, Black and Porter (1996) did not include this construct
in their study. Instead, they had introduced another construct corporate quality culture,
which is about encouragement of a company-wide culture committed to quality
improvement. As top management support plays a significant role in encouraging
company-wide culture committed to quality improvement the construct 'top
management support' is preferred by most researchers.
The top management of different supply chain members should, together, set directions
for the operation of the supply chain and create a customer orientation, clear and visible
values and high expectations for the supply chain. The top management should commit
them themselves to the development of the entire supply chain and should encourage
participation, learning, innovation and creativity by all supply chain members. The top
management should also commit themselves to maintaining and sustaining the
relationship among the supply chain partners. The cultivation of a quality culture for the
whole chain and the forming of cooperative and congruent goals among supply chain
members are important tasks of the top management of each member in a supply chain.
For successful new management approach, however, leadership must translate its
commitment into a set of actions. These actions should be aimed at enhancing the ability
to:
• compile and effectively analyze relevant information essential to the firm (customer
focus, benchmarking, and supplier quality management);
• collect and make a better use of information flow between supply chain partners); and
• ensure better application of manufacturing, and information technology for better
chain performance.

216
When the leaders of organizations provide direction and resource supporting the new
change (supply chain management), higher organization performance is more likely to
result.
Thus, starting from material sourcing to delivering the material to the end users, the
supply chain management practice (SCM) approach supported by management
commitment can be effectively implemented in an organization for achieving business
excellence and competitiveness in a world market place.
From the above discussion, one would expect a much better implementation of supply
chain practices in firms with top management commitment as compared to the firms
without.
II- Framework Model Body; Supply Chain Management The role of supply chain is widely recognized as being a critical determinant in the
success and survival of both manufacturing and service organizations in today’s
competitive environment, and thus, has focused attention on its effectiveness. In a
number of organizations, cost-effective supply chain is a matter of survival. The
globalization of some sources makes it essential that the professional practice is improved
and regarded as a key element in the preparation of company or organization strategies
(Quayle, 1998; Beamon, 1999). For more detail of this component, refer to the literature
review (Chapter2).
III- Framework Model Roof ; Competitive Advantages Performance measurement systems (PMS) has been an area for study and research for
decades. Such research studies admit that performance measurement systems (PMS)
allow an organization to align its business activities to its strategy, and to monitor
performance toward strategic goals over time. It is for such reason, it can play a key role
in supporting managerial growth in an organization either for small and medium
enterprises (SMEs) or large enterprises (Biazzo and Bernardi, 2003; Garengoet al.,
2005). For more detail of this component, refer to the literature review (Chapter2).

217
IV- Framework Model Boundary; Continuous Improvement Continuous improvement is a popular concept which is used universally to improve
organization’s performance and competitiveness in business life. Many companies
worldwide have used the concept in their business successfully. The importance of
continuous improvement has made it explicitly. Its scope of application is not limited to
any size of organization. Large and SMEs industries can use the concept alike, public
and semi- public, and encompassed various type of industries.
The increasing pace of globalization has pressurized the supply chain players to offer
their product with higher quality and less cost with shortest lead time. The
manufacturers thus are focusing on all aspects of their operations aiming to continuously
improve their total business and reduce all non-value adding activities to a minimum.
Continuous improvement (CI) has been defined by Bessant et. al,. (1994) as a
“companywide process of focused and incremental innovation”. According to (Boer et
al., 2000), CI is defined as “the planned, organized and systematic process of ongoing,
incremental and company-wide change of existing practices aimed at improving
company performance”.
CI has been viewed for some time as an important element in quality programs. There
has been growing use of CI in areas such as cost reductions, flexibility, inter-firm
relations and support process improvements. An analysis of the level of development of
CI across all aspects of a firm's operations provides a significant indicator of a
company's future competitive potential.
The terms continuous improvement and continual improvement are frequently used
interchangeably. But some quality practitioners make the following distinction:
Continual improvement: a broader term preferred by W. Edwards Deming to
refer to general processes of improvement and encompassing “discontinuous”
improvements—that is, many different approaches, covering different areas.
Continuous improvement: a subset of continual improvement (Figure 6-2), with
a more specific focus on linear, incremental improvement within an existing

218
process. Some practitioners also associate continuous improvement more
closely with techniques of statistical process control.
Fig: 6-2 Continuous Improvement Process
There are many tools and techniques commonly used in process improvement such like:
Problem solving methodology
Process mapping
Process flowcharting
Force field analysis
Cause & effect diagrams
PDCA cycle
Brainstorming
Pareto analysis
Statistical process control (SPC)
Control charts
Check sheets

219
Bar charts
Scatter diagrams
Matrix analysis
Dot plot or tally chart
Histograms
Among the most widely used tools for continuous improvement is a four-step quality
model—the Plan-Do-Check-Act (PDCA) cycle, also known as Deming Cycle or Shew
chart Cycle. The concept of the PDCA (Plan, Do, Check and Act) cycle originally
developed by Walter Shewhart during the 1930’s and implemented and promoted very
effectively from the 1950s by W. Edwards Deming, has consequently played a key role
in the field of quality control.
After that, ’the Deming Cycle’ is developed not only as a quality cycle in the quality
control field, but also for different business units as part of continuous improvement
cycle which has played a key role in all of the management fields. The “PDCA” cycle
(Figure 6-3). It can be described as the systematic study of the causes of variation in
quality and an approach to improving quality.
Fig: 6-3 “PDCA” cycle
W. Edwards Deming introduced this cycle in the 1950s. This is a process – indeed, a
culture – for institutionalizing continuous improvement in an organization. These
concepts form the basis of the Deming's PDCA virtuous cycle of improvement:
1. Plan: Identify an opportunity and plan for change.

220
2. Do: Implement the change on a small scale.
3. Check: Use data to analyze the results of the change and determine whether it
made a difference
4. Act: standardize on a permanent basis
PDCA provides a framework for the improvement of a process. It can guide the entire
improvement project, or to aid in developing specific projects based on identified target
improvement areas.
PDCA is as a dynamic model. Completing one turn of the cycle flows into the beginning
of the next. This continual cycle of change delivers ever-increasing improvement. In
addition, the PDCA loop provides the continuous improvement mechanism in a model
that involves the quality management system concepts of people involvement, process,
factual and systems approaches.
A benefit of using the cycle is increased knowledge to understand, predict, and control
output. Because this application of the scientific method is cyclical and ongoing, and
because the components of profound knowledge interact, the growth in knowledge is
much like compounding interest—multiplicative rather than additive.
The aim is to correct the cause not the symptoms in order to eradicate a problem
permanently and so effect permanent improvement.
Hamid Noori (2004) studied the application of continuous improvement in the supply
chains of Canadian industries. Several Canadian industries including the automotive,
electronics and aerospace sectors were examined to determine: (i) what CCI activities
were initiated, (ii) which supply chain nodes were the most proactive in establishing
these endeavors, (iii) what are the most effective collaborative tools and processes, and
(iv) the effect such tools would have on the supply chain performance of participating
companies. The results indicate that Canadian companies are placing greater strategic
importance on supply chain performance. Supply chain nodes are engaging in joint
strategic planning to a greater extent than they did a decade ago.

221
The choice of supply chain partners can have a significant impact on many aspects of
supply chain performance. Working with the right firm can provide an effective way to
enter a new market, guarantee good quality raw materials, help diffuse new technologies
rapidly, by-pass governmental restrictions, overcome financial constraints and achieve
organizational learning (Elmuti and Kathawala, 2001; Monczka et al., 1998).
Furthermore, supplier selection is perhaps the most important step in creating a
successful partnership strategy (Lee, 2009).
Chong Wu1, and David Barnes (2009) developed and tested a model designed to
provide feedback and continuous improvement during the process of supplier selection
in agile supply chains. The model seeks to capitalize on the increased application of the
supplier section process by applying principles of continuous improvement using
Deming model PDCA.
Fig: 6-4 Application feedback and continuous improvement model for supplier selection

222
Organizational learning (see Figure 7-4). Its aim is to support organizational decision-
makers in their efforts to optimize the performance of the supply chain by ensuring that
only the most appropriate suppliers are selected at all times. The results of a
questionnaire, used to assess the efficacy of the model, showed that the participants
found the model was likely to have significant benefits when used in practice.
6-6 Framework Model Assessment Methodology The following section discusses the self –assessment, its benefits, and the self-
assessment process.
I- Self-Assessment Increasingly, many world class organizations have realized that supply chain
management is a way of managing activities to gain efficiency, effectiveness and
competitive advantage. This ensures longer term success by meeting the needs of their
customers, employees, financial and all other stakeholders. The implementation and
assessment of supply chain management program can achieve significant benefits such
as increased efficiency, reduced costs and greater customer satisfaction, all leading to
better performance for the organization.
Using the Self-Assessment process based on Supply Chain Management House
(SCMH) Framework Model has a key role to play in enhancing the effectiveness and
efficiency of the organizations. The framework model achieves the objective by
reinforcing the importance of each component of the model toward organizational
Excellence.
Assessment and self-assessment have during the last few decades been established
as important methodologies for improvements. One difference between assessment and
self-assessment is that the latter does not involve any external organization of the
work, while the first does.
Self-assessment is a device that offers helpful information and clear answers for the
most common questions regarding and organization’s current level of excellence in

223
terms of its strengths and areas of improvement on the basis of which top management
make their decisions and assist the organization in choosing the right strategy to move
forward. Many business organizations are taking help of different quality awards as well
as for enhancing their competitive position in the global market (Khoo& Tan, 2003).
There are many definitions of self-assessment provided by writers such as Hillman
(1994) but an all-embracing definition is provided by the EFQM (2002):
Self-assessment is a comprehensive, systematic and regular
review of an organization’s activities and results against a
model of business excellence.
Further, according to EFQM (2002), “the self-
assessment process allows the organization to discern clearly
its strengths and areas in which improvements can be made
and culminates in planned improvement actions which are then
monitored for progress”.
Thus, it can be seen from the above definition that self-assessment is a vehicle for systematic
continuous improvement in an organization. An extensive study by Coulambidou and Dale
(1995) supports this view. The believed benefits of self-assessment could be summarized into
the following:
• Identify opportunities for improvement ;
• Provide new motivation for the quality improvement process;
• Direct the improvement process; and
• Manage the business.
According to Lam and et al. (2007) self-assessment has three main elements; model,
measurement and management. The first element is “model” which acts as a framework for
evaluating business performance. “Measurement” is the second element which measures
organizations’ performance against the model. The last element is “management” which is
concerned with managing the self-assessment process to ensure its effectiveness. Self-
assessment is a quality initiative that works both internal and external focus as it is carried out
by organization’s own staff, but on externally defined standards.

224
According to Samuelsson & Nilsson (2002) apart from illuminating areas for improvement, self-
assessment provides an important cultural benefit because it encourages an ethos of continuous
improvement, promotes a holistic perspective, and allows people to gain a broader
understanding of the business.
II- Self-Assessment Benefits Self-assessment aimed to various benefits (Zairi, 1994; Hillman, 1994; Conti, 1999; Porter and
Tanner, 1998; Dale, 2003). Van der Wiele et al. (1996) point out that organizations are using
self-assessment to identify strengths and weaknesses, and to facilitate internal and external
learning in terms of the transfer of best practice and ideas. Brown & van der Wiele (1996)
show, on the basis of a national postal survey of self-assessment practices in Australia, that the
reasons for using self-assessment are mainly to find opportunities for improvement and to
direct the improvement process, while the goals for the introduction of self- assessment are to
improve business performance, to drive continuous improvement and to increase quality-
awareness in all aspects of the business.
Dale (2003) in his research categorized the objectives in respect to the time frame required as
below:
CATEGORY OBJECTIVES
Immediate Facilitates benchmarking
Drives continuous improvement
Encourages employee involvement and ownership
Provides visibility in direction
Raises understanding and awareness of quality related issues
Develops a common approach to improvement across the
company
Seen as a marketing strategy, raising the profile of the
organization
Produces `people friendly business plans

225
Long-term Keeps costs down
Improves business results
Balances long and short-term investments
Provides a disciplined approach to business planning
Develops an holistic approach to quality
Increases the ability to meet and exceed customer’s
expectations
Maintains a quality image
Provides a link between customers and suppliers
III- Self-Assessment Process There is a greater chance of success if the senior management team has an active
involvement in the process plus a sound grasp of the SCHM Framework Model and the
fundamental concepts of supply chain management. Establishing teams responsible for
managing the self-assessment process in the organization, the design of appropriate
record forms and the establishment of a method for scoring achievements come next.
The plans and objectives for conducting self-assessment should be communicated
throughout the organization.
For Self-Assessment to be successful, the top management has to build a clear strategy
and communicate this strategy to all employees in the organization.
When considering which specific Self-Assessment technique to adopt, the current
culture of an organization needs to be taken into consideration. There are no set rules;
the Self-Assessment can be carried out at any and all levels. However experience shows
that many organizations first undertake one or more pilots to “test the water” and learn
more about the process.
There is no “superior” technique for Self-Assessment. The most important factor is for
the organization to have clarity on the outcomes it is looking to achieve and then
choosing the specific Self-Assessment technique that is the most appropriate for

226
delivering those desired outcomes. All employees directly involved in the self-
assessment processes and all facilitators should be trained. The introduction of any new
process needs careful management. Self-Assessment is no exception to this rule and it is
best managed as a project.
Organizations of all sizes have limited resources to allocate in different project. It is
important therefore to have a clear process in place for the prioritization of the
outcomes, as well as the management of the subsequent improvement action plans and
the ongoing monitoring of progress through “business as usual” review cycles.
The outcomes from conducting the Self-Assessment provide the “moment in time”
picture of the status of the organization, usually expressed in terms of strengths, areas
for improvement.
As with any other activity, progress in implementing the improvement actions should be
reviewed regularly and the whole process for linking Self-Assessment and business
planning should also be reviewed and improved ready for the next Self-Assessment.
EFQM (1996) summarized the general process steps of conducting self-assessment as
shown in the following flow chart (see Figure 6-5):

227
Fig: 6-5 Self-Assessment Process Flow Chart

228
6-7 Framework Model Validation and Implementation Due to hard competition all the suppliers are in position to supply their product at
competitive price with good quality, in the shortest delivery time. It is identified that it is
possible to create competitive advantage through Supply Chain Management.
Accordingly, a comprehensive systematic implementation framework was expounded.
Subsequently, the researcher demonstrated the validation of emerged "Supply
Chain House Framework Model". The validation was with focus group of a selected
firm called ABC (the true name is kept confidential). The company is engaged in the
manufacturing of various types of food items that are ready-to-eat. It has been in the
business for the past 12 years. It has its factory as well as the processing unit in Eastern
Province. The raw materials required are mainly vegetables, chicken, and meat which
the company procures from either the local vendors, or imported from various suppliers
situated. The required materials are procured with the help of hired transporters.
The company's products are quite popular to many customers. However, the company
stands to lose the market due to erratic supply schedules which do not cater
promptly to the customers. The packaging of the products is attractive, but it does not
preserve the product for a long time. The company has about 10 distribution centers.
Logistical information system is not adequate. Due to this, the company is unable to
expand its business. In fact, due to competition, there is fear that the company may
stand to lose its existing clientele. Due to mismanagement, the company is unable to
meet the increase in the demands during festival seasons and holidays.
The validation and testing process is discussed into two sections. The first section 7-7-1
is about “Framework Model Theoretical Validation and Testing" and the second section
7-7-2 is about "Framework Model Theoretical Validation and Testing". These are
discussed in the following sections.

229
6-6-1 Framework Model Theoretical Validation This section discusses the framework model theoretical validation and testing. It starts
with an introduction followed by validation feedback.
I- Introduction In previous sections the conceptual “Supply Chain House Framework Model” was
developed and discussed (see Section 7-3, Fig. 7-3). The aim of this section is to
theoretically validate the framework model with a focus group selected from SMEs in
the manufacturing sector by discussing its applicability and potential benefits its
adaptation will bring in addressing the performance gaps of supply chain management in
small and medium enterprises in the manufacturing sector of the Eastern Province of
Saudi Arabia.
The focus group was organized by the researcher who briefed the focus group members
on the purpose of the meeting which was to explore the suitability and applicability of
the framework model for SMEs in the manufacturing sector of the Eastern Province of
Saudi Arabia with the aim of improving performance gaps of their supply chain
management.
A convenient sampling approach was used in selecting the focus group. The focus group
members were selected on the basis of their being in a managerial position in their
organization and having a considerable understanding on the concept of supply chain
management. The composition of the focus group and their years of experience are
shown in Table 5-1 "Focus Group Participant Demographics" under section 5-2-2 item
II-1. A presentation was made to the focus group members explaining in detail the
framework model, its components and benefits to industries.
Following the briefing and presentation on Supply Chain Management Framework
Model, the following points were discussed: the perceptions and opinions of group
members on the applicability and drawbacks of the framework.

230
The participants were allowed to bring up issues and concerns outside the prepared
question path to determine the strengths and weakness of the framework model and
identify areas needing improvements and further research.
The Questions that the researcher discussed during the validation session were:
1. How far will the implementation of the model improve the performance of the
organizations both operationally as well as financially?
2. Does the implementation of the model require additional cost to the
organization? If so to what extent?
3. Does the model apply to service sector organizations?
4. What is the effect of the framework model on the organization structure change?
5. Does the framework model need a special skill and competency for
implementation?
6. Can the framework model be used as a benchmarking tool for the organization?
7. What are the significant factors that distinguish organizations should
consider?
II- Validation and Testing Findings This section presents the validation and testing feedback of the “Supply Chain
House Framework Model”. Each participant was asked to present his view and
opinions on the framework model. The results are based on the ideas of focus
group. It includes combined views and proposals made by focus group
members.
The following points summaries the main comments and suggestions made by
the focus group members:
1. Responses relating to question one, deals with the implementation of
the framework model and how it can improve the performance of
organizations both operationally and financially. The respondents emphasized
that the framework model of the SCM must be developed in line with the

231
world class requirements and standards. Hence, the optimal aim of the
framework model should enable organizations to position themselves in
their quest for world class par excellence performance. The respondents
were in favour of the framework since it will improve the performance of
their organizations. However, some respondents stated that various
aspects of the framework model should be given equal attention during
implementation. The respondents also noted that the model should
consider the limitation and capabilities of SMEs in the application of
SCM framework model.
2. Feedback relating to question two deals with the cost of implementing the
model and whether it requires additional cost to the organization. The
respondents noted that the cost implication of this framework model mainly
depends on their supply chain magnitudes and their present practices in
organizations. Overall, there will be a drastic cost reduction resulting in better
profitability as a result of proper implementation of the framework model within
the organization and with the trade partners. The cost saving could be tangible
resulting in less production cost and more market share. In addition, non-tangible
cost saving could be in form of customer satisfaction and loyalty. In contrast, it
was noted that organizations will suffer loss of customers and market share if
aspects of the framework model are treated separately.
3. Responses to question three, relate to how the framework model is perceived
in terms of its usefulness to service organizations. The analysis of the
discussion showed a clear preference amongst the focus group
members for applying the SCM framework model in service
organizations. The expected potential benefits that the framework model
brings will be alike for manufacturing as well as service industries. The
framework model when applied in the service industry should place more weight
on the importance of the core component of the framework model and could be
adjusted to suit the service industry.
4. Reponses to question four, which was about the organization structure affects.
The focus group members stated that though major structural changes may not

232
be warranted in the implementation of the framework model, the organization
should adopt collaborative practices especially in the case of those activities
which tend to overlap on two functions. Moreover, the philosophy of the
organization should tend towards the customer i.e. all activities and functions
need to be customer centric. The main change to the organization structure might
be brought by the supply chain risk management. This responsibility could not
be overlooked and should be managed and controlled by a competent staff.
5. Response to question five which was related to the skills required for the
framework model implementation, a common feedback from the members of
the group concluded that, the framework model envisages analytical skills
among concerned managers and their decision making competencies. Managers
are expected to be comfortable with basic analytical tools and techniques that
are required to be competent in understanding and using new managerial
concepts to make decisions especially those which overlap two or more
departments. They are also required to shoulder more responsibilities that may
be needed for the SCM implementation process. However, top management
needs to consider that more responsibility may de-motivate people if they are not
appropriately compensated.
6. Response to question six, deals with benchmarking, the respondents agreed that
the Supply Chain House Framework Model helps companies to assess and
benchmark their current state against their requirements. The model is
constructed with the view to benchmark the supply chain dimensions of SMEs
with that of world class organizations if implemented properly. Since, the model
considers customer relationship management it will help the organizations both
in the manufacturing and service sector in sustaining a competitive advantage.
7. The feedback on the question Seven relate to the significant factors
that distinguish organizations should consider, organizations are
different in terms of their people, culture, history, goals, structure, products,
services, technologies, processes and operating environments. Therefore, they
should combine their own uniqueness with this framework model and
consequently develop their own ways to excellence.

233
6-7-2 Framework Model Practical Validation and Testing
I- Introduction In the previous section, the conceptual “Supply Chain House Framework Model” was
theoretically validated and tested (see Section 6-6-1). The aim of this section is to
practically validate the framework model with the same focus group of Section 6-6-1.
To proceed with the practical framework model validation and testing, the researcher
developed scale rating matrix (Table 6-1) and a set of questionnaires (Table 6-2) which
to be answered by the participants during the focus group session. The participants were
allowed to bring up issues and concerns outside the prepared question path to identify
areas needing improvements and further research.
Table: 6-1 Scale Rating Matrix
SCALE DESCRIPTION
0 Poor
1 Fair
2 Adequate
3 Good
4 Very Good
5 Excellent
The table below (Table 6-2) shows the validation questionnaires on the right of the table
and the Rating of each question is shown in the left side of the table. The rating column
is split into two sub-columns; scale and weight. The researcher analysed the feedback of
each question and allocated the proper scale and weight. Accordingly, this table serves
as a summary of the practical validation process.

234
Table: 6-2 Framework Model Questionnaire
I FOUNDATION Rating A MANAGEMENT COMMITMENT Scale Weight 1 Top management attends and chairs the company’s meeting
regularly and on time. 5 Excellent
2 Top management provides all resources (financial, people and physical) needed for the business and on time.
4 Very Good
3 Top management is actively empowering, involving and encouraging company’s employees
5 Excellent
4 Top management has established a documented procedure for business review.
5 Excellent
5 Top management has set regular follow up and management review program.
5 Excellent
B SUPPLY CHAIN RISK MANAGEMENT 1 The company sets clear supply chain risk aims and
objectives 1 Fair
2 The company has a methodology in place to identify the internal and external supply chain risks.
zero Poor
3 The company has implemented supply chain risk program zero Poor
4 The company regularly assess the company’s supply chain risk
2 Adequate
5 The company regularly reviews and updates the company’s supply chain risks.
2 Adequate
II FRAMEMWORK MODEL BODY
1 Top management sets (smart) supply chain targets for the company.
5 Excellent
2 Top management has established a documented and systematic procedure for its supply chain management
5 Excellent
3 Top management has plans and methodology implementation in place for its supply chain management.
5 Excellent
4 Top management has established a documented procedure for business assessment.
4 Very Good
5 Top management has set regular follow up and management review program.
4 Very Good
III FRAMEWORK MODEL COMPETITIVE 2 Adequate

235
ADVANTAGES; THE ROOF
1 Top management sets performance objectives, and goals for the company
3 Good
2 Top management has a methodology in place to identify the KPIs
3 Good
3 Top management involves middle management in setting the KPI,s.
2
4 The management assesses and reviews the company’s performance regularly.
3 Good
5 Top management sets regular follow up to improve the KPI’s of the company.
3 Good
IV FRAMEWORK MODEL CONTINUOUS IMPROVEMENT; THE BOARDER
1 The company has a target to achieve in the number of new ideas and improvements.
5 Excellent
2 Top management has established a documented and systematic procedure for continuous improvement program.
5 Excellent
3 Top management is actively empowering, involving and encouraging company’s employees in the continuous improvement program.
5 Excellent
4 Top management assesses the continuous improvement program.
3 Good
5 Top management has set regular follow up and management review of the continuous improvement program.
3 Good
The questionnaire is divided into four parts that cover the framework model
components. It involves a set of statement or questions which can be answered by the
participants easily. The questionnaire is open ended style and avoids the simplest level,
No-Yes answers. Further, the questionnaire employs scale between 0 and 5. The scale 5
represents the excellent level of implementation and zero scale represents the poor level
of implementation.
The questionnaire approach is the least resources approach, and can be done very easily.
It provides an excellent method for collecting information on people’s perceptions
within the firm.

236
II- Validation and Testing Findings The following presents the detail findings of the practical framework model validation.
1- Framework Model Foundation This part consists of commitment and supply chain risk management findings.
1-1 Commitment Findings The interview revealed that the top management (The Director, Managing Director and
General Manager) is committed to overall company strategy. A part of their
responsibility, the top management provided vision, mission, and policy. They were the
management champions and regularly participate in business strategy development of
the company.
The company vision sets the company benchmark, whereas the mission statement stated
the reason for the company being in the market and type of products. The company
policy gave emphasis on the quality, customer satisfaction and continual improvement.
The vision, mission and company policy had been communicated to the company
members regardless of their position, and been available in all departments and in the
company reception hall.
The commitment of the top management to the quality resulted in achieving the
international quality certificate (ISO 9000:2000) in as short as three months.
Production manager quoted…
…… “It was very challenging to start developing the
company procedure in this short period of time with all the day
to day responsibilities”
He added….
……that is credited to our top management commitment and
support”

237
These testimonies summarized the top management commitment toward achieving the
company strategy.
As a system of business continuous review and continuous communication, the
company runs management review meetings. The researcher reviewed “The
management review meeting” documentations and found that MD name and signature
available for the last three years.
The meeting would review all related business issues, but in minimum would cover the following;
• Legal Requirements including status of ISO certification and audits • Business Plan • Group discussion of customer survey information • Quality objectives • Organization chart (Quality manual) • Result of audits • Process performance • Preventive and corrective actions status (ECR and ECO status) • Follow-up of feedback from previous management review meetings • Planned changes that could effect the quality system • Recommendations for improvement
The researcher found that the level of commitment between the middle managements is
significantly less than that shown by MD. However, there is a weekly meeting between
the middle management and their subordinates, but that was limited to production
department.
Reviewing the first part of this questionnaire, it can be concluded that
It was clear that upper management were committed to making the changes. The top management team had developed a model of management that support the organization continual improvement and values
Top management team was effectively involved in champion changing and development.

238
Awareness and commitment from top management was constantly reflected through numerous reviews of progress.
Lack of comprehensive implementation of management review procedure in the company at the middle management level.
There was not strong commitment within the middle management that champions the change and initiates the improvements. Initiatives like awards for the best quality team, the best worker, full attendance of staff and the highest contributor of Kaizen submissions were not found.
1-2 Supply Chain Risk Management Findings The feedback related to weather the management identified the supply chain risk results,
the researcher clearly demonstrated that the management’s initiative in identifying the
company’s supply chain risks aim and objective systemically was found un-satisfactory.
The company business strategy overlooked to address the scope, results, targets, and
trend of the company’s risks for the last three years. There were no performance
indicators of risk that can be compared with that of others and depends on a good
approach to the problems. The managing director explained the reason and said,
“……. This subject never was an issue for discussion in our formal management review meeting…..”
The general manager added;
“………we may have analyzed the risk occasionally but that was not based on a strategic plan and decisions were based on opinions rather than facts……”
The researcher noticed there was no authority on the senior management level that holds
the full responsibility for the identification of risk results to the top management for
discussion making.
The interview pointed out that the sources of risk were identified as the practitioners saw
and understood them. Most of which are classified as of internal risks natural and of
limited scope. The managers focused on the risks to their own areas of responsibility in
an ad hoc manner.

239
For example, evidence found that suppliers were being selected mainly on the basis of
price only was seen to be increasing the risks to delivery schedules for the customers
concerned, and presumably those downstream.
“……..Of course it's a problem for us because if they fail to supply a good material, we would be behind the schedule which cause customer complains….” Procurement manager’s comment
This illustrates the management paid little attention toward this subject and overlooked
the importance of developing a comprehensive approach to mitigate or avoid the
associated risks to their business.
The feedback of the discussion showed the company was challenged with a different
types, frequency and complexity of supply chain risk as a result of the business
environment. The risks were not of internal natural but with external source too. Internal
risks are; price, quality, employee turnover as most of them are contractual. External
risks are; competition, legal requirements, technology development, customer change
requirements.
The general manager recalls a situation where he could not export a required shipment
to the customer who is within the GCC country. He stated that …
“…when the shipment reached the custom, the driver was asked to present the food certification, ISO 22000 and HACCP. This certificate was recently become a legal requirement for exporting food product…”
The discussion concluded with an agreement for the development of supply chain risk
mitigation strategy to ensure the smooth flow of goods end-to-end across the supply
chain, at the promised service level, at anticipated costs. The approach should describe
what, why, how and that should be linked to the company’s strategy.

240
The company did not establish well documented procedure to identify and apply the
supply chain framework model including the path, key players, organization, roles key
risk and threats involved in implementing supply chain activity. Thus, the
implementation based on treatment plan for selected identified risk, has been visualized
in many cases. Top management did not develop any training program to improve the
staff skill in identifying, and mitigating supply chain risk management.
The company treats the risks either internal or external in reactive base. The researcher
found no evidence of proactive risk plan strategy that predicts the type and seriousness
of risk and act according to contingency plan (Plan B).
In conclusion, an ad hoc approach and reactive strategy which has not been thought
through and tested will not safe the supply chain of disturbance. In a good organization,
the approach is visible to and usable by the workers, and used in a systematic way, to
ensure full implementation, and in areas which are strategic for the organization.
The researcher was unable to gather or verify a systematic deployment of risk
procedure. Therefore, looking for assessment or review documents of supply chain risk
management was unworthy process. This is a proof for serious problematic issue in this
company. The attention given to this area is very low. Consequently, the company
loosed some good share of market in many occasion. Developing systematic approach to
deal with this subject could be considered a good area for business improvement.
2- Framework Model Body Findings
The organization has results to show what it is achieving, in core areas; suppliers,
process and customers. It demonstrated strongly positive trends in most results in
suppliers, process and customers over at least 3 years. The company is implementing
quality management system in the process activity attempt to achieve competitive
priorities (objectives) .The company selected appropriate targets for each core business
areas, based on goals and company objectives. These targets were detailed in each
business unit. Times to time, the analysis of these objectives are evaluated and any
deviation or negative trends were reviewed, discussed, and explained in the company

241
congress. Most results can be shown to have been caused by the approach taken. The
interview failed to provide any external benchmarks or comparisons with other
organizations’ performance. It was accepted in the research that comparative analysis
needs to be address. This could be considered an area for improvement to find out the
best practice in the industry and carry out benchmark. This will position the company a
head of its competitors. The detail results of the investigation for the main core business
units are shown hereunder. This section will discuss the following areas:
1- Suppliers Component
1-1 supplier selection
1-2 supplier evaluation
2- Process Components
2-1 production
2-2 safety
2-3 Quality
3- Customer Components
3-1 customer satisfaction
The detail discussion of each is presented hereunder.
1- Supplier Components
1-1 Supplier Selection
Purchasing and suppliers are of major strategic importance to ABC. A substantial
amount of the resources used by the company are made available through its suppliers.
Purchases from suppliers account for almost half of total costs.
In order to control and develop its suppliers, ABC evaluates their performance with
regard to many different criteria. Supplier selection criteria based on qualification is
used to build profiles and find the matches who build the criteria. These criteria are
divided into four dimensions; quality, delivery, cost, and flexibility.

242
1-2 Supplier Evaluation
When new suppliers are selected the process for approving the supplier based on the
pre-qualification criteria are implemented. The supplier performance is evaluated by
purchasing department with respect to supplier’s overall performance. Evaluation
includes criteria addressing the supplier’s capabilities regarding Quality, Logistics,
Production, Internal management, Supply management, Environment, Engineering,
Finance, Technical support etc. An audit visit is scheduled whenever serious defect or
change in the organization structure happens. The supplier evaluation is carried out
once in six months based on the criteria, supplier score cards matrix is evaluated and
degree of fulfillment the supplier is ranked.
2- Process Components 2-1 production
ABC showed considerable progress in sales volume and profit margin and market share
for the last three years. The sales were increased between 24% to 26% year and after.
The revenues were up 23% for the last year.
The company has improved its market share by 3%. Egypt and Sudan were the new
market areas in which the sales could be increased to 2% for the first years.
The company has adopted operation strategy as a collective pattern of coordinated
decision for the allocation of modern automatic machine and other’s resources, the last
two years have seen substantial changes in the operations especially with the new
investment in technology and state of art of the laboratory equipment. The company
expects the payoff in coming years.
The preventive maintenance program of machines and objective to reduce the
breakdown hours has increased the production capacities by 5.4%.

243
2-2 Safety Safety is a key issue in support of production. Safety is measured by number of
accidents happened during a year. Safety accidents were classified into major and minor.
The foremost is what treated in outside clinic whereas the minor accident is those cloud
be treated in the company clinic. There are two main objectives of production free
accident, firstly to maintain the most important asset of the company, people. Secondly
is to maintain the momentum of the production. The company promoted the safety
awareness and safety orientation program like Mock drill, Fire and safety and first aid
training within its facility. The table below shows the number of people and days that
the company spent in promoting the safety awareness. Table 7-3 shows increasing trend
between year and after.
Table: 6-3 Number of People and days that the company spent in promoting the safety
awareness
Number of People and days that the company spent in promoting the safety awareness TRAINING UNIT YEAR 2008 YEAR2009 YEAR 2010
Safety related training people 38 56 69 Safety related training days 49 97 144
2-3 Quality Performance
The company has implemented many quality and compliance program based on the
requirement of international standard (ISO 9001:2008), FDA and food safety
management system like HACCP criteria.
ABC evaluation of the quality of the products starts with receiving the product from the
suppliers. Quality defects are reported to purchasing department for the claim. Feedback
is given to the supplier that takes corrective actions. These evaluation procedures are
conducted for every dispatched product before put in use in the production line.
In the span of 12 months there were only 02 cases identified against 213 supplies cases
were supplied material was not meeting the specified criteria. The respective supplier

244
has been communicated and the way the supplier handles the situation was of major
importance for the evaluation.
The interview proceeded to assess the process approach of the company ABC. It was
found that ABC has established and developed working approach to define the
processes. The working approach is in compliance with the Quality Management
System in accordance to the International Quality System, ISO 9000:2008, see Figure
6-6. The system defines and develops the processes in line with quality system
framework shown.
The development of the organization operation framework was with the assistance of
external advisor and the involvement of the management and the department head
responsible. The system indents to outline the responsibilities and process flow from
procurement, design, value adding, and control to delivery in order to fully satisfy, and
generate increasing value for, customers and other stakeholders.
Fig 6-6 ISO 9000:2008 Conceptual Framework Model, source: ISO 9000 Standard
The quality System documentations are structured in four levels of documentations.

245
These are:
Level I: The pyramid is topped by the single, overarching Quality Policy that guides the organization in all decisions.
Level II: The Quality Manual defines responsibilities and the general guidelines for completing particular task. It was developed to provide the philosophy of the system and describes links between the business operations and the delivery of the business goals and key performance measurements.
Level III: Documented procedures and work instructions that define precisely how to complete a specific task. Each department function has generated its own lists of key processes, and documented as Standard Operation Procedure (SOP). This document was maintained with each department head. It reviewed and revised annually whenever needed. The departmental procedure links between department/functions or other departments, to prevent causing serious interface issues.
Level IV: Records and forms which describe the work completed accurately.
From the evidence reviewed, the researcher confirmed that the structures of key
processes and support processes were defined, flowcharted and integrated. Linkages
between customer requirements, process measures and standards were being identified.
The business management system describes links between the documentation produced
for the system and the delivery of the business goals and key performance measures.
The researcher verified the deployment of the company operational framework through;
departmental meeting, documents review and site visit. The assessment started with a
short meeting with the department in charge to understand the department procedure and
methodology. The inputs were counterchecked with departmental procedure, forms and
records. The assessment was made for three departments for the time constraint. They
are marketing department, production and quality control department.
The approach (The company quality manual) was distributed to all departments. The
distribution was documented in the transmittal sheet which specifies the copy receiver
name, copy number and the signatory. The review concluded the approach was used and

246
followed systemically structured way in all aspects. The system was followed
systemically. It was accompanied with all necessary forms and documents. The system
deployment is assessed annually or semi-annually to verify the implementation. The
discrepancy found is adjusted and rectified to maintain the proper implementation of the
system. The organization does not do the assessment to know their assessment results
and scores; it also wants to know their strengths and areas for improvement. This
process is meant to add value for the organization continual improvements.
3- Customer Component
3-1 Customer satisfaction
In ABC case, the aim is establishing ideal partnership relation with customer on
business transaction. The customer relations are handled with a proactive orientation to
prevent dissatisfaction from the supplied product/service.
The company surveys its customers concerning complaints, satisfaction, and loyalty.
The latest survey, a total of 45% participated in the survey. The customer visit and
qualitative feedback from the various customer compliments and complaints were
evaluated on customer satisfaction index. The results show that there was high
satisfaction concerning the business relation, price and quality. The customer
satisfaction index (CSI) was 82. On in the other side, there was low satisfaction
concerning delivery lead time and flexibility. The company has to choose best methods
for customer retention. The overall results show most of the customers surveyed were
satisfied with more than average (CSI 78).
The deployment process of the operational approach has been monitored by the
assessment and review process to identifying and prioritizing the process improvement
and learning which is a continuous activity which is the duty of all members of staff and
in particular process owners. The assessment and review process is about regular
measurement of system effectiveness and identify and share best practice and
improvement opportunities. The review is made against the preset company’s KPI’s.

247
The review frequency of each KPI is shown in Table 6-4 below. The table also shows
the main sources of improvement.
Table: 6-4 The main sources of improvement and its frequency
The main sources of improvement and its frequency
MAIN SOURCES OF IMPROVEMENT FREQUENCY Internal System Audit Once (maximum twice per year) KPI Twice per year Suggestions Box Once a year People satisfaction Feedback Annual Customer satisfaction survey Annual Management Review congress Annual
3- Competitive Advantages Findings
In reviewing the performance measurement of the company, the researcher identified a
general goal which was set in the business plan. In addition to the traditional financial,
there are few non- financial performance indices found for business control.
The company does have financial department occupied by skill and competent staff to
monitor and control the financial and accounting system of the company. However, the
company failed to present comprehensive, balanced and cross functional measures and
ownership that working together in an optimum fashion to achieve the results desired by
the organization.
The general manager quoted that…….
"……We never used to have a detail KPIs for each business unit. Our focus mainly on how to achieve what was agreed in the business plan….".
It was understood from group discussion that implementation of a new performance
measurement system can be seen as “changing the rules of the game” or redistributing
power in the organization. Individuals and groups may see this as not being in their best
interest and actively or passively resist the implementation.

248
Concluding on the findings above, the company maintained financial report and two
operational reports. These are the daily production report and people appraisal. The
foremost id reviewed by production manager in daily bases and the second is reviewed
in annually bases.
The assessment was not carried out in systematic and formal. Except for the financial
report which regularly assessed by the top management in more frequent and annually
reviewed by the external auditor, none of the performance indicators assessed in
systematic fashion.
The researcher failed to find benefits gained or improvement made out of this
assessment. There were no evidences of linking these measures to overall business
strategy. Also there was no clear evidence on how these measures benefited the business
outcomes or how to improve the business performance.
The discussion revealed that few lessons that the management learned from their
assessment which particularly takes a financial figures. Learning activities include
internal benchmarking, industry benchmarking or comparisons with the processes of
best in class organizations were not found rare. They were not used comprehensively for
continual improvement, better customer services and innovation.
4- Continues Improvement Findings
Responding to the last component of the framework model that is continuous
improvement, the discussion revealed a general agreement on the importance of this
component as a tool of to maintain a sustainable competitive advantage of their supply
chain management.
The general manager emphasized on the company strategy of encouraging and
motivating everyone in the company to participate in improvement process. He said,
"……….the Company in compliance with the requirements of international quality standard ISO 9000:2000 set the system of

249
continuous improvement. We distributed what called "Suggestion Box" everywhere in the company…."
The researcher reached for a conclusion which arrived at, the results for the continuous
improvement were clear at the higher level of the organization. During the
documentation review and site visit, the management presented different improvement
cases. Accordingly, it can be realized that the management is committed to the
continuous improvement process that aimed at improving the organization efficiency.
Responses showed a clear preference amongst the group candidates for accepting the
system of continuous improvement in their organization as an aiding tool that facilitates
the improvement process.
Respondents in their feedback on the availability a clear and well defined approach for
the continuous improvement, the quality assurance confirmed the availability of such
approach, and stated;
"………the continuous improvement system was developed by a team of management that includes general manager, purchasing manager, production manager and human resource manager. The system includes scope, purpose reviewing and rewarding system……"
The respondents in their feedback to the approach part of the questionnaire, it was found
out that the approach has a clear rational, well defined and developed in line with the
management quality policy. The approach in brief is divided in three sections.
Committee coordinator collects the suggestions from the boxes. The, the committee
reviews the suggestions. Finally, the management rewards the winner.
The production department was the prime implementer of the continuous improvement
system. The ideas reviewed brought enough evidences of the deployment to the
researcher. During the site visit to the plant, different quality and safety posters and
slogans were found. The improvements were in reduction of using the spare parts,
product defect reduction and safety enhancement. However, it was very seldom to find
similar improvements at the rest of the company departments.

250
The extract from the group discussion, site and office visits showed the system was
implemented soundly. The conclusion was reached based on many observations. There
were general agreements that the system was developed, the management was
committed, and well communicated throughout the company. However, the deployment
was limited to a single business unit, the people were not trained in using the proper
tools (7 improvement tools) which make the implementation and the creativity processes
in an ad hoc fashion. Improvements can also be carried out through a tool called
“Pathfinder Card”, which helps identify the opportunities of improvement and plan the
action of improvement.
The discussion went further with management to justify the researcher final conclusion.
The researcher briefed the benefits of making the improvement process has its scope and
with line to the business unit's objectives. It is also necessary for the people to be trained
for using the quality improvement tools.
Accordingly, the management showed clear preference for applying the quality
improvement tools and to be a part of the training program. The quality control manager
stated.
"……..this will improve the people way of thinking which ultimately improve their performance…….."
The company through its improvement committee assessed the improvement initiatives.
The assessment is made in compliance to improvement system procedure.
The changes brought up by the production team were documented and implemented.
Accordingly the production process procedure and work instruction were revised to
anchor the changes. The researcher realized the new initiatives were adopted by
different production teams which support the wealthy communication between the staff.
There were many lessons were learned from the production team and these lessons were
exchanged between them. However, adopting the system to different business units
coupled with proper training will identify more opportunities for improvement. Some of
these improvements could be generalized and be beneficial to the organization.

251
To summarize, the management's journey for continuous improvement has resulted in a
strong commitment to the principles of excellence. However, the deployment of the
approach was limited to a single business unit. The organization has systematically
established sound linkages between the approach and the results they have achieved, so
that they were able to demonstrate some improvement. For broad achievement of
improvement, the procedure should be deployed to the whole organization.
5- The feedback of Trade partnerships Next to the focus group discussion with the company’s official, feedback and an
interrogation session was carried out with the company’s business partnerships; supplier
and customer regarding the business relationships performance. The pros and cons of
the company were identified and they are summarized as follows;
Performance excellence in the company as stated follows:
From the supplier point of view, there were no problems found with the company in its
performance, relationship tie ups and other transactions ever since the company had its
establishment with the supply chain. So it was considered to be a positive feedback from
the supplier’s side.
From the customer point of view, the reasons for the diminished performance of the
company can be listed out as follows;
1) The customer felt that there was no efficient supply chain to meet with the
requirements at the time of need which might be due to logistics and distribution
of products.
2) Due to lack of proper framework in the company, the customer felt a lag in
systematic flow of goods.
3) There was a communication problem always existed between the customer and
top executive panel due to total power residence of the company with the middle
level management.
4) The lack of flexibility with the middle level management created unrest among
the customers though they received quality products at good cost.

252
Based on the feedback obtained from the customers, the top level management assured
that there will not any discrepancies in future regarding the problems stated.
From the managers’ point of view, the company’s performance can be stated as follows;
1) Since the entire attention was focused over the volume of sales, the customer
needs are not well evaluated at the time of need.
2) Due to least importance given to quality of supply chain, there was no KPI (key
performance indicator) established for the same which played a major role in
diminishing the company’s performance.
3) The improper functioning of the supply chain in the company shows that all
departments of the company were not interfaced properly which have resulted
problems in distribution of foods
4) Although meeting was conducted periodically, it never focused towards the entire
function of the company.
To solve these problems, a meeting was organized among the management crew of the
company and a set of possible alternatives were asked to be submitted. The alternatives
were;
1) For the customer problem No 1:
• The company should appoint a supervisor to give a period status about the
distribution.
• Setting up a separate strategy and a team for supply chain.
• The current strategy of the company should be reviewed that it focuses on
all the areas of operation.

253
2) For customer problem No 2 :
• Implementation of technology in supply chain.
• Framing the objectives using the experts.
3) For customer problem No 3 :
• Interfering of top level management in decision making.
• Making an appraisal competition between the department managers to
motivate them.
• Organizing a meeting every six months to acquire feedback from the
customers.
4) For customer problem No 4 :
• The requirements of the customers should be analyzed before getting into
action.
• Educating the managers about the importance of SCM periodically
After listing out the alternatives, the top level management goes for an apt solution and
it is summarized as follows;
• The company will set up a strategy and individual team for supply chain by an
expert team after sufficient research in the particular field.
• The company hereafter will analyze the complete needs and wants of the
customer before distributing the goods and a separate meeting will be organized
periodically to get feedback from the customer.
• The same meeting was extended after a break to discuss about the alternatives
for the causes given by the managers of the company. They were listed as
follows;
1) For the manager problem No1 :
• The alternatives are middle level management should be aware of about
the value of the customers and timely delivery of the service to the
customer.

254
2) For the rest of the problems, the alternatives are as follows
• Implementing the technologies in SCM.
• Outsourcing the SCM.
• Setting an individual KPI for each department. 7-8 Summary
This chapter reviewed and discussed the importance of developing supply chain
framework model for the SMEs manufacturing industry in Saudi Arabia. The framework
model was developed based on literature review, other works in the same field, and the
results of the field work study (survey) and the working experience of the researcher in
the manufacturing sector for more than 20 years. So this framework is based on a
combination of theoretical and empirical research concepts and practical experience.
The framework is then tested and validated theoretically and practically by self-
assessment approach with a focus group selected from SMEs in the manufacturing
sector by discussing its applicability and potential benefits its adaptation will bring in
addressing the performance gaps of supply chain management in small and medium
enterprises in the manufacturing sector of the Eastern Province of Saudi Arabia.
The focus group members were selected on the basis of their being in a managerial
position in their organization and having a considerable understanding on the concept
of supply chain management. Details of the preparation of the focus group formation
characteristics were verified.
The framework model theoretically and practically validated and tested. As such the
“Supply Chain House Framework Model” found to be feasible and applicable
and some of the group members showed enthusiasm in applying the SCM
house model in their companies. However, in order to attain the
maximum advantage of the model, the SMEs need to devote exceptional time
and a lot of managerial and administrative efforts in order to change the quality
cultures and their institutional work environment.

255
The researcher thereby illustrated the effect of the process of formulating the focus
group perceptions and feedback on the adoption of the SCM House framework model in
a format which could be practiced in the selected firm.
The next chapter is indented to highlight the conclusions, contribution, research
limitations of the whole research study and presents the future study.

256
CHAPTER SEVEN
CONCLUSION, CONTRIBUTION, LIMITATION AND FURTHER STUDY
This chapter summarizes the findings of the research and contribution, outlines its limitations and highlights the future studies opportunities to the subject area. The chapter starts with the research's conclusions, followed by its limitations and ends with the research future opportunities.
7-1 Conclusion
Organizations are fast realizing the immense potential of a proactive supply chain to
improving their market positions in this cut-throat business environment.This research aims
at developing a framework model that enables SMEs to improve their SCM performance and to
have a sustainable business growth in dynamic environment. To fulfill the foremost aim, the
following objectives have been set.
1. To contribute to the bod of knowledge to the both Supply Chain Management and
Saudi Arabian SMEs manufacturing by reviewing pertinent literature of the same field. Knowledge in this study refers to as information, understanding and skills that one gain during research and education (Chapter 2).
2. To investigate the current SCM practice of Saudi Arabia SMEs manufacturing sector by explorative approach, broad reliable and valid survey questionnaires distributed to 320 SMEs companies (Chapter 4).
3. To identify the gap within the current supply chain dimensions of SMEs against
world class companies (Chapter 5) by statistical analyzing the survey questionnaires developed in chapter four.
4. To suggest appropriate methodological design using robust techniques that is to
developed framework model (Chapter 6). 5. To develop qualitative assessment approach in the form of focus group to
theoretically and practically validate and test the framework model ( Chapter 6) 6. To benchmark the developed model with different model in the same field.

257
The Literature review revealed that supply chain management evolved from different disciplines.
It provided a historical evolution background for better understanding the subject. The literature
highlighted different definitions and descriptions of supply chain management that developed
over the time. The body of knowledge in this subject presented numbers of benefits that
organization could gain from the effective adoption of proper supply chain system.
Supply chain dimensions are key concept in the supply chain framework model. The framework
aimed at effectiveness the organizations through the appropriate and implementation. The
literature (Chapter 2) as well as the field work data analysis (Chapter 5) studied and discussed
the main components of supply chain dimensions which believed to be a must in any supply
chain structure.
This research study is focused on Saudi Arabia SMEs. They are representing more than 90% of
the total business in Saudi Arabia. Despite SMEs supply chain benefits, they continue to encounter
barriers. Some of these barriers come as a result of corporative culture.
The importance of organizational culture is well documented to the success of a corporative. The
improvement success is more likely where the cultural elements of a leadership, supplier
relationship, customer focus, continuous improvement, and teamwork and employee
involvement are stronger. Those elements are likely to be stronger where SCM is implemented.
Most if not all of change initiatives like SCM adoption failures – and failures of other such
initiative– are not only the failure of the management. Often, managers are victims of that
culture, just as change itself is a victim of the implementation process.
This is especially an issue of Saudi Arabia corporative where services are provided by
multinational group of people with different cultural values.
The author shaded light on some important elements to the success of SC implementation that is
related to Saudi Arabia SMEs. These elements are but not limited to, senior management
leadership, customer relationship, and teamwork.

258
The importance of soft issues in the implementation of SC is well documented and recognized in
the literatures. Among these soft issues is leadership.
Saudi Arabian SMEs are mixed of local and multinational companies. The multinational
companies are either fully foreign ownership or joint venture ownership. Accordingly, the
management schools are varies among local firms in Saudi Arabia and other multinational
companies.
The management style of Saudi managers is influenced by different variables like gender, level
of education, and the organizational position of subject managers.
In many Saudi Arabia SMEs, the vision, mission and strategic plan are not clear and limited to
ISO certified companies. The primary focus of these companies is on short-term strategic goals
which tend to be financial in nature.
Customers and buyers are always part of the cycle in the system. They are the heart of the
business to keep the company alive and successful even high pressure is at stake in nurturing
good relationship. Many of Saudi SMEs have limited finance to invest in big campaign in
advertising. This limitation is a hindrance to connect the clients. On the other hand, the system of
measuring customer satisfaction is limited to ISO companies. It is not a discipline or norm of
SMEs to measure their customer satisfaction in systematic way.
It is necessary to apply different strategies for the benefit of the corporative especially looking at
the teamwork provided by each leader in an organization. Teamwork is a transparent joint
cooperative effort to work together as a team in achieving same goals.
Saudi Arabia business culture is made up of different nations. Each nation has its own language,
values, attitude and beliefs. They are also different in knowledge, experience and interests. These
characteristics hinder the creation of harmonized group of teamwork. Communication is the
most common obstacle while working efficiently as a team. Leadership role and responsibility

259
of the team remain vague throughout the given time frame. The output of their performance is
adversely affected.
The research adopted multiple research method for data collection. The aim behind using the
multiple research approach was to draw the strengths and minimize the weakness of each
approach.
The conclusion on supply chain literature and field work data analysis may cover the following
key issues:
• It is well recognized that adoption of supply chain management principle is one approach
which has been demonstrated to provide success business competitiveness. It is making an
increasing positive impact in world industry.
• The globalization has changed the business environment and behavior all over the globe. The
globalization has led to an increasingly competitive marketplace. Organizations competing in
an increasingly global market, independent of size or industrial sector, are reliant on SMEs to
provide sub-contracting facilities. The success in such business environment will indeed
increasingly be based on quality, cost, delivery and service provided. Globally, increasing
competition has caused the business to be improved.
• With the help of the following points, the researcher could conclude that why SMEs were
selected as study area for this research (Chapter 3). SMEs represent more than 90% of overall
business enterprises in most of the countries. They are the vital engine of nation’s economic
prosperity, a good provider of employment, seed-bed for indigenous entrepreneurship,
adaptability according to customer requirements, to promote indigenous technical knowhow,
represent main entity in supply chain linkages; SMEs are often suppliers of goods and
services to large companies , therefore, imperative for SMEs to meet the highest level of
business relation, as large organizations need assurance of seamless flow of the business
without any interruption. Moreover, many studies of supply chain management focus on the
practices of large firms, while small firms are treated mostly from the viewpoint of larger

260
firms (Chopra and Meindl, 2001; Lambert and Cooper, 2000). Therefore, more research
efforts are needed to study the impacts of SMEs in the context of supply chain management.
Since the long-term sustainability of SMEs depends on “where they compete” and “how they
compete”.
• Supply chain dimensions adopted were valid and reliable. This was supported by using
Cronbach’s Alpha index. Therefore, this study supports the positive argument concerning the
applicability of SCM dimensions for larger study, different business sectors, and for different
geographical areas.
• Manufacturing strategy was given considerable thrust among the supply chain best practices.
The most chosen manufacturing strategy contents were quality, cost, delivery and flexibility.
The choice between these manufacturing strategy contents may change over time, contingent
on market context and corporate strategy of a company. It is proposed that SMEs look at
adopting more manufacturing strategy attributes similar to what world class companies do.
• Supplier partnership strategy was influenced by supplier selection. For this strategy to be
more efficient, supplier involvement and using few base suppliers should be an integral part
of the strategy. Having said that, SMEs need to develop their strategy around this
understanding. After all-inclusiveness is an integral aspect of SCM.
• Businesses always see the customers as the reason for an organization being alive and
making profitable business. SMEs being suppliers for large organizations, they should pay
more attention to develop, maintain and improve their business relation with their customers.
Having realized it, SMEs need to invest more in technology which support the customer
relationship strategy. Customer orientation is very much essential for a successful business.
• Most of the companies investigated failed to comply with basic requirements of logistic
practice which will jeopardize the supply chain performance of this industry.
The study found that most of the respondent companies were not motivated to have advanced
supply chain initiatives. Partially, may go to the investments and skills needed and other may
go for the awareness on the benefits of such initiatives.
261
• It appears from the field work survey that in Saudi Arabia SMEs performance measurement
is more about the financial performance overlooking the importance of operational
performance. Despite the overall findings produced in this study, the author believe that this
topic still opens opportunities for further studies, particularly considering the fact that
industry sectors now have become more dominating sector in the economy of the country.
• The study has reached to a general conclusion that SCM dimensions are still in its infancy in
Saudi Arabia SMEs manufacturing sector. Even though, they have recognized its importance,
implementation of these dimensions is still lagging in their business strategies.
The researcher by reaching on the above conclusions, it can claimed that the first two objectives
mentioned in the first chapter as well as on the top of this chapter has been fulfilled.
The framework model (Chapter 6) discussed in this research work was developed based on an
extensive literature review of supply chain management and sound academic underpinning
(Chapter 2). It was also based on key findings derived from a systematic analysis of quantitative
data (Chapter 3). The framework model represents the in-depth thinking and review of different
supply chain concepts, theories and models. It also reflects the practical experience of the
researcher into the SMEs industry. As such, it would prove highly relevant and useful for
establishing a success supply chain system for SMEs industries. The framework model identified
four main components of supply chain house system, essential for successful implementation of
supply chain practice and for increasing the effectiveness and efficiency of an organization.
The framework was validated qualitatively using the focus group methodology in a selected
SME manufacturing company. This framework model accompanied with theoretical and
practical assessment in order to provide the management with an aiding tool for proper
implementation. The assessment is meant to highlight an organization’s present strengths and
weaknesses. The framework model was validated for SMEs manufacturing industry; however, it
applies to many different kinds and size of organizations. It was developed to assist the
organization to close the gap in their supply chain practice implementation, and guide the
companies to benchmark their system against the best practice on a journey to become a world

262
class organization. The framework model can serve as a prototype for evaluating the supply
chain maturity and for guiding the firms in for proper system implementing. Such a framework
model contributes positively to the Saudi Arabia SMEs, particularly with the absence of any
testable implementation framework model. These benefits included improvement the process,
increased market business share and improved client satisfaction, all of which are important for
sustaining a competitive advantage.
Focus groups are valuable research tools and can capture deeper information that will help to
better understand the subject under investigation. The analysis of qualitative data collected
during the interview, raised up numbers of recommendations and suggestions to the framework
model and to the implementation challenges.
The focus groups complemented the visited site during the facilitation of the study, it represented
opportunities to gain deeper information about the company, its operation and its relation with
their suppliers and customers, and the visit provided opportunities to learn more about the
implementation challenges associated with the capacity of SMEs.
Implementation of this framework model can be can be classified into many types based on
many factors that are people, culture, history, goals, structure, products, services, technologies,
processes, and operating environments. As a result, the framework model can be developed
based on their uniqueness to excellence. The most key thing is to focus on practical
implementation. Then it is possible for them to measure, compare with benchmarks and start all
over again. In simple, the implementation of SCM is a never-ending process.
This framework model provides a solid foundation for future research and adds to the available
literature. An empirical research that considers adding value to the subject area and it can be
further improved by studying using the multivariate analysis to test, validation and enhancement.
The development of this framework model fulfills the third objective mentioned in the first
chapter as well as on the top of this chapter. Thus, the aim and objectives of this thesis have been
completely achieved.

263
7-2 Contributions and Implications
The thesis makes several contributions that have important implications for both researchers and
managers. These contributions should enhance our understanding of the subject under research.
Remenyi et. al., (1998) suggests that “a contribution to the body of knowledge should include
one or more of the following: extending our ability to understand phenomena, new ways of
applying existing science or theories, rejecting invalid theories, and providing unifying
explanations for events and circumstances.” The following section discusses the main theoretical
and managerial implications that result from this thesis are addressed here.
7-2.1 Contribution to Research The research conducted in this thesis contributes to the body of knowledge in a number of areas.
First, this thesis has extended the supply chain literature by building knowledge of SMEs supply
chain practices of certain geographical area. The results of this the empirical investigation have
strengthened our understanding of the current state of SCM practices of Saudi Arabian SMEs. It
demonstrated, empirically, that there were number of weak areas which give an opportunity for
improvement.
The second contribution of this study is the methodological approach employed herein. The
researcher used multiple research approaches in order to develop a holistic understanding of the
problem under investigation. It is only with multiple perspectives that true picture of a problem
could be visualized and understood.
Further contribution to theory is the development of Supply Chain House Framework Model that
claimed suite and improve the supply chain system of SMEs manufacturing industry. The
framework model was developed based on the literature review in the field, the survey result and
the researcher experience. The framework model in addition to the basic components of SC, it
gave focus to the supply chain risk management, management commitment and continuous
improvement. It can be used by researchers and practitioners alike for difference industrial
sectors.

264
It was validated and tested theoretical and practically in SME company. The result of successful
implementation of the proposed framework model provides opportunities for the improvement of
SMEs supply chain system and in their relation with the suppliers and customers.
7-2.2 Managerial Contribution The results of this research have important managerial implications as Saudi Arabian SMEs
manufacturing industry faces a more competitive environment. First, low profits, combined with
increasing competition worldwide, place SMEs organizations at a distinct disadvantage. Many
SMEs are experiencing low return which, when combined with limited financial resources, make
further investment in expensive business development difficult.
The results of this study could be of interest to practitioners, managers, or policy makers. It gave
some important guidelines concerning the importance of SCM practice to SMEs. This study has
provided hand on valid and reliable constructs and dimensions that can be used in any industry or
business sector of SMEs. The empirical investigation has resulted in highlighting the strength
and weakness of the current state of SMEs. The managers benefit from this study by focusing on
the weak areas and plan for improvements.
Additionally, validation and assessment procedure was provided to practitioners who wish to
assess their SC system toward improvement of their own processes and with their business
partners.
Executives who wish to improve efficiency of their supply chain are challenged to implement
meaningful SC model that can positively affect the organization’s performance. This study
demonstrates that the implementation of SCMH may be an opportunity to improve efficiency in
their institutions and increase profitability.
Using the framework model assessment procedure will provide hand on tool for the manger to
consider benchmarking the firm’s business processes against their competitors or others in
related industries, and identifying industry best practices. Benchmarking involves comparing the
efficiency and effectiveness of a firm’s business processes against strict standards and then

265
measuring performance against those standards. Accordingly, the focal company can achieve
competitive advantage by attaining operational excellence, lowering costs, improving profit
margins and forging a closer relationship with customers and suppliers.
The framework model has highlighted an important issue to practitioners, managers, or policy
makers. They can also benefit from the conceptualization by focusing on the risk associated with
their business context supported with high level of commitment. Continuous improvement also
should have considerable efforts to keep the model dynamic.
Supply chain risks have a significant role in the business transactions. It can be assumed that the
performance of a supply chain will be affected negatively overseen risks. Based on a larger
sample, Hendricks and Singhal (2003, 2005) underscore the relevance of supply chain
disruptions by showing empirically that these events have a significant negative impact on
shareholder value (Singhal, 2003, 2005a) and on operating performance (i.e., sales, operating
income, return on assets) (Singhal, 2005b), it can be concluded from their research that capital
markets severely penalize supply chain disruptions and attach high value.
The importance of top management commitment is well documented in the literatures (Sakibara,
1994; Shroeder, 1989; Ahire, 1996). The top management should commit them themselves to the
development of the entire supply chain and should encourage participation, learning, innovation
and creativity by all supply chain members. The top management should also commit themselves
to maintaining and sustaining the relationship among the supply chain partners. The cultivation
of an organization culture for the whole chain and the forming of cooperative and congruent
goals among supply chain members are important tasks of the top management of each member
in a supply chain.
Supply Chain Continuous Improvement (SCCI) initiative emphasizes the creation of teams of
suppliers, manufacturers and retail customers who share information to improve the performance
and effectiveness of the whole chain. SCCI enables the various links of the entire supply chain to
work together in response to changing consumer needs and trends. The SCCI initiative can be
applied to a supply chain orientation that is either a “pull” or a “push” system or a combination
of both.

266
7-3 Limitation While the current research made significant contributions from both a theoretical and
practical point of view, it also has some limitations, which need to be acknowledged.
The study is limited in a number of ways.
To start with, the sample is limited with respect to size, choice for SMEs and the limited
geographical area. A caution should, therefore, be exercised when interpreting the results.
Another limitation is that the researcher only considered the influence of limited number
of supply chain practices, which we believed from the literature review, have major
influence in the supply chain performance.
In addition, this study considered the manufacturing industry is homogenous in itself, and
hence no comparison has been made between different product categories.
The geographical coverage: the study was constrained to Saudi Arabia manufacturing
sector; therefore, the conclusions drawn from this might be country-specific and have a
potential problem on generalizability.
The source of the sampling frame: the organizations’ contact detail were obtained from
the electronic database of the second industrial city authority. This database list is
incomplete, as some records have not been updated for some time, i.e., recent addresses
change.

267
Research dimensions: the research relied on basic measuring dimensions of supply
chain practices which could consider a source of inaccuracy to the study results.
Time constraint: the time constraint played an important role in the quality of data
and depth of the study.
Single industry cluster: the study has focused on the manufacturing industry, and has not
examined supply chains of other sectors. Hence, issues pertinent to manufacturing sector
supply chains may not be relevant to other industries.
Single respondent: the survey questionnaire answered by one of the middle
management. Therefore, the use of single respondent may generate some
measurement inaccuracy. Thus, the empirical findings from this study should be
interpreted with caution.
Due to time constraints in this study, the number of cases studied were limited. Hence the
views and experiences of this SME may not be representative of SMEs in the
manufacturing sector.
7-4 Future Studies
• It would be interesting to see future research that adds service-oriented industry and
government sectors as well as different geographical area that may benefit from a sound
SCM strategy to the study. The extension of this study will help to confirm the
importance of supply chain management, accurately identify the challenges and
opportunities that SMEs provide and generalize the findings.
• It will be interesting to further study the influence of different soft and hard aspects
which have been ignored from this study, which could improve the supply chain
performance.

268
• In addition, this study considered the manufacturing industry is homogenous in itself, and
hence no comparison has been made between different product categories. This
assumption should be examined in future studies. Furthermore, a comparison study
between service organizations and manufacturing companies could provide additional
insights.
• It will be more informative if more regions are taken into consideration for better and
wider results.
• Instead of concentrating on the electronic database alone if the researcher can gather data
from various other sources like manual data collection, data banks etc. coverage will be
more wider
• Other related sectors to manufacturing and supply chain also can be included in the area
of study to strengthen the research outcome.
• The data from the questionnaire can be collected from a pool of respondents instead of
single respondent to avoid bias in the outcome of the same.
• Time constraint to a larger extent can be overcome by planning and scheduling the
process well ahead of execution of it; may be through prioritizing events as per their
relative importance.
• The framework model described in this research work is only a first attempt at providing
a model to improve the supply chain management dimensions of SMEs organization. An
expansion of this work can be suggested by examining different dimensions or different
industries to benefit the SMEs in their pursuit towards enhancing their business
competitiveness and excellence.

269
• The framework model assessment process described in this study illustrates one
methodology by which an organization can assess the applicability of this model. Further
assessment methodology can be used for the same purpose.
• Operationalization of the framework model dimensions with relation to competitive
advantage can be an area for further study based on qualitative study methodology.
• Further research is needed to establish key elements and disciplines of supply chain
continuous improvements in SMEs to the coup with the dynamic nature of the market.
• Finally, it is hoped that this study will provide the momentum for future research aimed
at developing or refining the supply chain house dimensions to provide better business
performance, and as such, SMEs can survive and compete.
7-4 Summary This chapter has summarized the findings of the research, outlined its limitations and highlighted
the future studies opportunities to the subject area. The following conclusions evidence the
achievement of the objectives of the study as indicated earlier:
• Manufacturing strategy was given considerable thrust among the supply chain
best practices and in Saudi Arabia SMEs performance measurement is more about the
financial performance overlooking the importance of operational performance. Therefore,
we can conclude that SCM dimensions are still in its infancy in Saudi Arabia SMEs
manufacturing sector.
• Most of the companies investigated failed to comply with basic requirements of
logistic dimensions which will jeopardize the supply chain performance of this industry
and the study found that most of the respondent companies were not motivated to have
advanced supply chain initiatives. Partially, may go to the investments and skills needed
and other may go for the awareness on the benefits of such initiatives.
• The framework model would prove highly relevant and useful for establishing a
success supply chain system for SMEs industries. The framework model is hoped to be a

270
good contribution of the author to help and support the business community of SME's in
Saudi Arabia for improving the performance of their supply chain system.

271
REFERENCES: Aaker, D. A., kumar, V. and Day, G. S., (1998), "Marketing Research", New York: John Wiley & Sons. Ahluwalia, R., Unnova, H.R. and Burnkrant, R. (2001), “The moderating role of commitment on the spill over effect of marketing communications”, Journal of Marketing Research, Vol. 38 No. 4, pp. 458-70. Akkermans, H., Bogerd, P. and Vos, B. (1999), “Virtuous and vicious cycles on the road towards international supply chain management”, International Journal of Operations & Management Allen, N.J. and J.P. Meyer, (1991), “The measurement and antecedents of affective, continuance and normative commitment to the organization” ,Journal of Occupational Psychology.vol 63, pp 1-18. Andersen, T.J. and Segars, A.H. (2001), “The impact of IT decision structure and firm performance: evidence from the textile and apparel industry”, Information &Management, Vol. 39 No. 2, pp. 85-100. Anderson, D.L., Lee, H. (1999), "Synchronized supply chains: the new frontier", Achieving Supply Chain Excellence Through Technology, San Francisco, CA,, Montgomery Research, pp.12-21 Anderson, E., & Weitz, B. (1992), “The use of pledges to build and sustain commitment in distribution channels”. Journal of Marketing Research, vol 29, pp 18– 34. Anderson, J. C., & Narus, J. A. (1990), “A model of distributor firm and manufacturer firm working partnerships”. Journal of Marketing, vol 54, pp 42– 58. Anderson, J.C., H. H~kansson and J. Johanson, (1994), “Dyadic business relationships within a business network context”. Journal of Marketing, pp 1-15 Armstrong, J.S., Collopy, F. (1996), "Competitor orientation: effects of objectives and information on managerial decisions and profitability", Journal of Marketing Research, Vol. 33 pp.188-99. Arnoud De Meyer, Jinichiro Nakane, Jeffrey G. Miller,(1989), “ Flexibility: The next competitive battle the manufacturing futures survey”, Strategic Management Journal Volume 10, Issue 2, pages 135–144, March/April Baker, G. and Abrahams, P. (2001), “Forget IT, it was Wal- Mart behind that US miracle”, Financial Times, October ,vol17, p. 9. Ballou, D., Madnick, S.E. and Wang, Balsmeier PW, Voisin W.(2004), “ Supply chain management: a timebased strategy”. Industrial Management vol 38(5), pp24–7.

272
Barney G. Glaser; Anselm L. Strauss: (1967) "The Discovery of Grounded Theory: Strategies for Qualitative Research, Chicago : Aldine Publishing , c1967 Barry Shore and A.R. Venkatachalam,(2003) “Evaluating the information sharing capabilities of supply chain partners: A fuzzy logic model” International Journal of Physical Distribution & Logistics Management, Vol. 33 No. 9,pp. 804-824 Benjamasuthin, R. et. al. (2001), “ Research Report: Characteristics and Obstacles of Thai SMEs”. Bangkok: Thai Chamber University. Berry, Leonard L. and A. Parasuraman (1991), “Marketing Services. New York: The Free Press” Blau, Peter M. (1964), “Exchange and Power in Social Life”. New York: John Wiley & Sons, Inc. Bloemhof J, van Nunen J.(2005), “ Integration of environmental management and SCM”. ERIM Report Series Research in Management.; ERS-2005-030-LIS. Bowersox, D.J., Daugherty, P.J., Dröge, C.L., Rogers, D.S. and Wardlow, D.L.,(1989), "Leading Edge Logistics: Competitive Positioning for the 1990s, Council of Logistics Management, Oak Brook, IL, Bozarth, C., Handfield, R., Das, A., (1998), “Stages of global sourcing strategy evolution: an exploratory study”. Journal of Operations Management. vol 16 (2/3), pp 241–255. Brown, J.R., Lusch, R.F., Nicholson, C.Y., (1995), “Power and relationship commitment: their impact on marketing channel member performance”. Journal of Retailing.vol 71 (4), pp 363–392. Brown, S. (1996), “Strategic Manufacturing for Competitive Advantage”. Hemel Hempstead: Prentice-Hall. Bryman, A. (2001). “Social Research Methods”. Oxford, UK: Oxford University Press. Brynjolfsson, E. (1993), “The productivity paradox of information technology”, Communications of the ACM, Vol. 36 No. 12, pp. 67-77. Burt, D.N. ,(1989), “Managing suppliers up to speed”, Harvard Business Review, vol 67(4), pp 127-135. Cachon, G. and Fisher, M. (2000), "Supply chain inventory management and the value of shared information. Management Science, 46(8), 1032–1048. Cagliano, R., Caniato, F. and Spina, G. (2003), “E-business strategy: how companies are shaping their supply chain through the internet”, International Journal of Operations & Production Management, Vol. 23 No. 10, pp. 1142-62.
273
Canez, L.E., K.W. Platts and D.R. Probert. (2000) ‘‘Developing a Framework for Make-Or-Buy Decisions,’’ International Journal of Operations & Production Management, vol (20:11), Cappiello, C., Francalanci, C. and Pernici, B. (2004), “Time-related factors of data quality in multichannel information systems”, Journal of Management Information Systems, Vol. 20 No. 3, pp. 71-91. Carlisle, J., Parker, R., (1989), “Beyond Negotiation, Redeeming Customer–Supplier Relationships”. Wiley, Chichester, UK. Carlos F. Gomes, Mahmoud M., Yasin Joa˜o V. Lisboa (2006), “Performance measurement practices in manufacturing firms: an empirical investigation”, Journal of Manufacturing Technology Management Vol. 17 No. 2, pp. 144-167 Carr, A.S., Pearson, J.N.,( 2002), “The impact of purchasing and supplier involvement on strategic purchasing and its impact on firm’s performance”. International Journal of Operations and Production Management. vol 22 (9),pp 1032–1053. Carr, A.S., Smeltzer, L.R., (1999). "The relationship of strategic purchasing to supply chain management. European Journal of Purchasing and Supply Management.vol 5, pp 43–51. Carter CR, Ellram LM.(1998), “ Reverse logistics: A reviewof the literature and framework for future investigation”. Journal of Business Logistics . vol 19(1):pp 85–102. Carter, J.R., Narasimhan, R., (1996). "Is purchasing really strategic? International Journal of Production Distribution and Materials Management.vol 32(1),pp 20–28. Carter, P.L., Carter, J.R., Monczka, R.M., Slaight, T.H., Swan, A.J. (2000), "The future of purchasing and supply: a ten-year forecast", The Journal of Supply Chain Management, Vol. 36 No.1, pp.14-26.
Chang, S.C., Lin, R.J., Chen, J.H., Huang, L.H. (2005), "Manufacturing flexibility and manufacturing proactiveness: empirical evidence from the motherboard industry", Industrial Management & Data Systems, Vol. 105 No.8, pp.1115-32.
Chen Zhang and Ssuhong Li (2006), "Secure information sharing in internet-based Supply chain management systems, Journal of Computer Information Systems Chen, F., Drezner, Z., Ryan, J. and Simchi-Levi, D. (2000), "Quantifying the bullwhip effect in a simple supply chain: the impact of forecasting, lead times and information. Management Sciencem, vol 46(3), pp 436–443. Chen, Hong, Murray Z. Frank and Owen Q. Wu. (2005), “What actually happened to the Child house P,(2003)

274
Chin-Chun Hsu, Vijay R. Kannan, G. Keong Leong, Keah-Choon Tan (2006), " Supplier selection construct: instrument development and validation" The International Journal of Logistics Management; Volume: 17 Issue: 2; Chin S. Ou, Fang C. Liu, Yu C. Hung, David C. Yen, (2010), “A structural model of supply chain management on firm performance”, International Journal of Operations & Production Management Volume: 30 Issue: 5 Christopher, M. and Ryals, L. (1999), “Supply chain strategy: its impact on shareholder value”, International Journal of Logistics Management, Vol. 10 No. 1, pp. 1-10. Christopher, M., Towill, D., (2001). "An integrated model for the design of agile supply chains. International Journal of Physical Distribution and Logistics 31 (4), 235–246. Churchill, G.A. Jr (1999), "Marketing Research: Methodological Foundations, Dryden, Orlando, FL,.
Cicmil, S., Kekäle, T. (1997), "Implications of organizational and individual learning for effective change management in education", The Journal of Workplace Learning, Vol. 9 No.5, pp.169-76
Cooper, M.C., Ellram, L.M., (1993), “ Characteristics of supply chain management and the implications for purchasing and logistics strategy”. International Journal of Logistics management.vol 4 (2),pp 13–24. Copacino, W.C. (1996), "Seven supply chain principles", Traffic Management, Vol. 35 No.1, pp.60. Cox III, J.F., and BLACKSTONE, J.H., (1998), APICS Dictionary (9th edition),
Coyle-Shapiro, J. (1997), "The impact of a TQM intervention on teamwork: a longitudinal assessment", Team Performance Management, Vol. 3 No.3, pp.150-61.
Craighead, C.W. and LaForge, R.L.,(2003), “ Taxonomy of information technology adoption patterns in manufacturing firms”. Int. J. Prod. Res., vol 41, pp 2431–2449. Da Silveira, G.J.C., Cagliano, R. (2006), "The relationship between inter-organizational information systems and operations performance", International Journal of Operations & Production Management, Vol. 26 No.3, pp.232-53. Dan Remenyi et al. (1998), “ Doing Research in Business and Management: An Introduction to Process and Method London: Sage Publications. Danese, P. (2007), “Designing CPFR collaborations: insights from seven case studies”, International Journal of Operations & Production Management, Vol. 27 No. 2, pp. 181-204.

275
Dangayach, G.S., Deshmukh, S.G. (2001), "Practice of manufacturing strategy: evidences from select Indian automobile companies", International Journal of Production Research, Vol. 39 No.11, pp.2353-93.
Daugherty, P.J., Ellinger, A.E., Rogers, D.S. (2001), "Information accessibility: customer responsiveness and enhanced performance", International Journal of Physical Distribution & Logistics Management, Vol. 25 No.1, pp.4-17.
Daugherty, P.J., Sabath, R.E. and Rogers, D.S.,(1992) “Competitive advantage through customer responsiveness”, Logistics and Transportation Review, Vol. 28 No. 3, pp. 257- 268 Davis, L. M. (2004). "State Clustering in Markov Decision Processes with an Application in Information Sharing. Unpublished doctoral dissertation, North Carolina State University Davis, T. (1993), "Effective supply chain management", Sloan Management Review, pp.35-46. Dawe, R.L., (1994) “An investigation of the pace and determination of information technology use in the manufacturing materials logistics system: a case study of Northern California’s electronics manufacturers”, Journal of Business Logistics, Vol. 15 No. 1, pp. 229-59. De Boer, L., E. Labro, and P. Morlacchi (2001),"A Review of Methods Supporting Supplier Selection," European Journal of Purchasing and Supply Management, vol 7(2), pp. 75-89. De Brito M.P. and R. Dekker, (2004) "A Framework for Reverse Logistics. Chapter 1 of Reverse Logistics, Quantitative Models for Closed-Loop Supply Chains, Springer-Verlag, Germany. De Toni, A., Nassimbeni, G., (1999), “ Buyer–supplier operational practices, sourcing policies and plant performance: result of an empirical research”. nternational Journal of Production search Vol 37 (3), pp 597–619. Dearing, B., (1990), "The strategic benefits of EDI. J. Business Strategy, 11, 4–6. Degraeve, Z., E. Labro, and F. Roodhooft (2000), "An Evaluation of Supplier Selection Methods from a Total Cost of Ownership Perspective, " European Journal of Operational Research, 125(1), pp. 34-59. Degraeve, Z., Roodhooft, F. (1999), "Effectively selecting suppliers using total cost of ownership", Journal of Supply Chain Management, Vol. 35 No.1, pp.5-10. Dibb S, Simkin L, Pride W M & Ferrel O C (1994). "Marketing: Concepts and Strategies. Boston: Houghton Mifflin, p12. Don A. Dillman. (2000). "Mail and Internet Surveys: The Tailored Design Method, Second Edition. 2nd ed. New York, NY: John Wiley & Sons.

276
Doney, P. M., & Cannon, J. P. (1997), “An examination of the nature of trust in buyer–seller relationships”. Journal of Marketing, vol 61, pp 35–51. Dong Won Cho, Young Hae Lee , Sung Hwa Ahn, Min Kyu Hwang, (2011), ” A framework for measuring the performance of service supply chain management, Computers & Industrial Engineering, V.2, PP 116-126 Dowlatshahi, S., (2000), “Designer–buyer–supplier interface: theory vs.practice”. International Journal of Production Economics.vol 63, pp 111–130. Dryden Claycomb C, Droge C, Germain R. (1999), "The effect of just in- time with customers on organizational design and performance. International Journal of Logistics Management ;10(1):37–58. Configurability. Twenty-Fourth International Conference on Information Systems, pp 523- 537, Seattle. Dwyer, R. F., Schurr, P. H., & Oh, S. (1987), “Developing buyer–seller relationships”. Journal of Marketing, vol 51, pp 11– 27. Eamonn Ambrose, Donna Marshall, Daniel Lynch, (2010), “Buyer supplier perspectives on supply chain relationships”, International Journal of Operations & Production Management Volume: 30 Issue: 12 Ellram, L. M. (1991), “Supply Chain Management: the Industrial Organization Perspective”. International Journal of Physical Distribution and Logistics Management.vol 21 (1): pp13-22. Ellram, L.M.(1990), “The Supplier Selection Decision in Strategic Partnerships,” Journal of Purchasing and Materials Management, (20:4), pp. 8-14. Ellram, L.M., Carr, A.S., (1994), “Strategic purchasing: a history and review of the literature.” International Journal of Physical Distribution and Materials Management.vol 30 (2),pp 10–18. Emel Aktas, Berrin Agaran, Fusun Ulengin, Sule Onsel, (2011), ” The use of outsourcing logistics activities: The case of turkey”, Transportation Research Part C 1, 833–852 Farrell, D. and Rusbult, C.E. (1981), “Exchange variables as predictors of job satisfaction, job commitment, and turnover: the impact of rewards, costs, alternatives, and investments”, Organisational Behaviour and Human Decision Processes, Vol. 28 No. 1, pp. 78-95. Fearon, H.E., (1989), “ Historical evolution of the purchasing function”. Journal of Purchasing and Materials Management, Spring,71–81. Fine, C.H. and Hax, A.C. (1985), “Manufacturing strategy: a methodology and an illustration”, Interfaces, Vol. 15 No. 6, pp. 28-46. Fishbein BK.(1994), “Germany, garbage and the green dot: challenging the throwaway society”. New York: Inform Inc.

277
Fisher, A. (2001), “Human resources: a waste of money? Re appraising information technology”, Financial Times. Fisher, M.L., (1997), “ What is the right supply chain for your product?”.Harvard Business Review vol 75 (2), pp 105–116. Fleischmann M, Bloemhof-Ruwaard JM, Dekker R, van der Laan E, van Nunen JAEE, van Wassenhove LN.(1999), “ Quantitative models for reverse logistics: a review. European Journal of Operational Research .vol 103(1):pp 1–17. Fleischmann, M., Krikke, H.R., Dekker, and R., Flapper, S.D., (2000), “A characterization of logistics networks for product recovery. Omega”, The International Journal of Management Science .vol 8,pp 653–666. Fox, T., (1994), “Logistics information systems design”, in Robeson, J.F. and Copacino, W.C. (Eds) Frame, P., (1992), “ Saturn to fine suppliers $500/minute for delays”. Automotive News, Fred Lemke, Keith Goffin, Marek Szwejczewski, Rolf Pfeiffer, Bertram Lohmüller.(2000), “Supplier Base Management: Experiences from the UK and Germany”, Fung, P., (1999). "Managing purchasing in a supply chain context: evolution and resolution". Logistics Information Management.vol 12 (5),pp 362–366. Gadde, L.E., Hakansson, H., (1993), “Professional Purchasing”. Routledge, London. Gadde, L.E., Hakansson, H., (1994). "The changing role of purchasing: reconsidering three strategic issues". European Journal of Purchasing and Supply Management .vol1 (1), pp 27–35. Ganesan, S. (1994), “Determinants of long-term orientation in buyer– seller relationships”. Journal of Marketing, vol 58,pp 1 –19. Garbarino, E. and Johnson, M.S. (1999), “The different roles of satisfaction, trust and commitment in customer relationships”, Journal of Marketing, Vol. 63 No. 2, pp. 70-87. Garvin, D.A. (1993), ``Manufacturing strategic planning'', California Management Review, Vol. 35 No. 4, pp. 85-106. Gaski, J. F. (1984), “The theory of power and conflict in channels of distribution”. Journal of Marketing, vol 48,pp 9 – 29. Gattorna, John L. (Ed.). (2003), “Handbook of supply chain management (pp. 4)”. Aldershot Gower Publishing.

278
G. D. (1998), "Which Contractor Selection Methodology?" International Journal of Project Management,vol 16(3), pp. 153-164. Gilson C.(1973), “Convenience-package banning: economic and environmental implications”. Academy of Marketing Science Journal,vol1(1):pp 75–9. Giunipero, L.C., Brand, R.R. (1996), "Purchasing’s role in supply chain management", International Journal of Logistics Management, Vol. 7 No.1, pp.29-38. Goodman, L. E., & Dion, P. A. (2001), “ The determinants of commitment in the distributor–manufacturer relationship”. Industrial Marketing Management, vol 30,pp 287–300. Gunasekaran, A., C. Patel, and E. Tirtiroglu (2001), "Performance Measures and Metrics in A Supply Chain Environment," International Journal of Operations and Production Management, vol 21 (1/2),pp 71-87. Gundlach, G. T., & Murphy, P. E. (1993). "Ethical and legal foundations of relational marketing exchanges. Journal of Marketing,vol 57, pp 35– 46. Gundlach, G. T., Achrol, R. S., & Mentzer, J. T. (1995), "The structure of commitment in exchange. Journal of Marketing, vol 59, pp78– 92. Gustavsson,M. and Jonsson,P. (2007), “Information quality deficiencies and consequences in supply chain information exchange”, Proceedings of the Annual NOFOMA Conference. Hahn, C.K., Kim, K.H., Kim, J.S., (1986), ‘‘Costs of competition:implications for purchasing strategy”. International Journal of Purchasing and Materials Management. Vol 22 (4), pp 2–7. Hair, J. F., R.E. Anderson, R.L. Tatham, and W.C. Black (1998). "Multivariate data analysis (5th ed.). Upper Saddle River, New Jersey: Prentice Hall Hall, R.W., Johnson, H.T. and Turney, P.B.B.,(1991) "Measuring Up-- Charting Pathways to Excellence, Irwin, Homewood, IL, Hamel, Jacques (1993), “Case study methods”. Thousand Oaks: Sage Handfield, R. B., Ragatz, G. L., Petersen, K. J.,&Monczka, R. M. (1999), “ Involving suppliers in new product development”. California Management Review, vol 42(1).pp 59-82. Handfield, R.B. & Nichols, E.L. Jr. (1999). "Introduction to supply chain management". New Jersey: Prentice Hall, Harps, L. and Hansen, L. (2000), “The haves and the haves nots: supply chain practices for the new millennium”, Inbound Logistics, January, pp. 75-111

279
Hartley, J.L. and T.Y. Choi. (1996), ‘‘Supplier Development: Customers as a Catalyst of Process Change,’’ Business Horizons, vol (39:4), pp. 37-44. Hayes and Wheelwright's (1984) "four-stage concept", Journal of Manufacturing Technology Management, Vol. 15 Iss: 7, pp.651 – 661 Hayes, R. and Wheelwright, S.. Restoring Our Competitive Edge. New York: Wiley and Sons Hayes, R. H. and Pisano, G. P. (1994). “Beyond world-class: the new manufacturing strategy”. Harvard Business Review, January–February, 77–86. Hayes, R. H. and Pisano, G. P. (1996) “Manufacturing strategy: at the intersection of two paradigms”. Production and Operations Management, vol 5, 1, pp 25–41. Hayes, R.H. and Garvin, D.A. (1982), “Managing as if tomorrow mattered”, Harvard Business Review, May/June, pp. 70-9 . Hayes, R.H., Wheelwright, S.C. and Clark, K.B. (1988), “ Dynamic Manufacturing: Creating the Learning Organization”. Free Press. Helena ,Forslund, Patrik Jonsson., (2007), “The impact of forecast information quality on supply chain performance”. International Journal of Operations & Production Management; Volume: 27 Issue: 1; Research paper. Helena Forslund, Patrik Jonsson (2010), “Selection, implementation and use of ERP systems for supply chain performance management Industrial Management & Data Systems Volume: 110 Issue: 8 Helper, S.R., (1991), “ How much has really changed between US automakers and their suppliers”. Sloan Management Review (Summer) pp15–28.
Hendricks, K. B., and Singhal, V. R. (2003), “The effect of supply chain glitches on shareholder value”, Journal of Operations Management, 21, 501-522
Hess, J., Story, J., (2005), “ Trust-based commitment: multidimensional consumer– brand relationships”. Journal of Consumer Marketing. vol 22 (6), pp 313–322. Hill Terry, (1993), “ Manufacturing strategy : the strategic management of the manufacturing function Basingstoke”, Hampshire : Macmillan, Hill, C.A. and Scudder, G.C., (2002), “The use of Electronic Data Interchange for supply chain coordination in the food industry”. J. Oper. Manag., vol 20,pp 375–387 Hill, T. (1995), “Manufacturing Strategy”, 2nd edition. Basingstoke: Macmillan.
Hill, T.J (1987), "Teaching manufacturing strategy", International Journal of Operations & Production Management, Vol. 6 No.3, pp.10-20..
Huang, G. Q., Lau, J. S. K., & Mak, K. L. (2003), “The Impacts of Sharing Production Information on Supply Chain Dynamics: A Review of the Literature”. InternationalJournal of Production Research, Vol. 41, No. 7, pp. 1483-1517.

280
Hult, G.T.M., Ketchen, D.J. and Slater, S.F., (2004), “Information processing, knowledge development, andstrategic supply chain performance”, in Academy of Management Journal vol. 47 (2), pp. 241-253
Ireland, R.D. & Webb, J.W. 2007, ” Strategic entrepreneurship: Creating competitive advantage through streams of innovation”, Business Horizons, 50(1): 49-59.
Ismail Erol, Meltem Nurtanis Velioglu, Funda Sivrikaya Serifoglu, Gülçin Büyüközkan, Necati Aras, Nigar Demircan Çakar, Aybek Korugan, (2010) “Exploring reverse supply chain management practices in Turkey”, Supply Chain Management: An International Journal Volume: 15 Issue: 1 J. Lee, Y. Kim, (1999) “ Effect of partnership quality on IS outsourcing: conceptual framework and empirical validation”, Journal of Management Information Systems,vol15 (4) pp 26–61 Jobber, D. (1989). “An examination of the effects of questionnaire factors on response to an industrial mail survey”. “International Journal of Research in Marketing”, 6(2), 129. Johnson H.T. and R.S. Kaplan, (1987). "Relevance Lost, The Rise and Fall of Management Accounting", Harvard Business School Press, Boston. John McLaughlin,(2003), “ Jaideep Motwani, Manu S Madan, A, Gunasekaran”. Business Process Management Journal. Bradford: 2003.Vol.9, Iss. 1; pg. 69, 12 pgs. Jones C.(1998), “ Moving beyond ERP: making the missing link. Logistics Focus “,vol6(7) ,pp 2–7. Jones, D.T., Simons, D., (2000). Future directions for the supply side of ECR. In: Corsten, D., Jones, D.T. (Eds.), ECR in the Third Millennium: Academic Perspectives on the Future of Consumer Goods Industry. ECR Academic Partnership,Brussels, pp. 34–40. Kalakota, R. (2000), “Inter-enterprise fusion – the future of supply chains”, eAI Journal, May,pp. 72-4 Kanji, G.K. and Yui, H. (1997), “Total Quality Culture”. Total Quality Management, vol 8(6), pp.417-428 Kannan, V.R., Tan, K.C. (2002), "Supplier selection and assessment: their impact on business performance", Journal of Supply Chain Management, Vol. 38 No.4, pp.11-22. Kannan, V.R., Tan, K.C., Handfield, R.B., Ghosh, S. (2002), "Tools and techniques of quality management: an empirical investigation of their impact on performance", Quality Management Journal, Vol. 6 No.3, pp.34-49.

281
Kaplan, R.S. (1983), “Measuring performance - a new challenge for managerial accounting research”, The Accounting Review, Vol. 58 No. 4,1983, pp. 686-705.
Kaplan, R.S. and Norton, D.P.,(1992) "The Balanced Scorecard-- Measures that Drive Performance", Harvard Business Review, January-February , pp. 71-9. Karen Butner, (2010), “The smarter supply chain of the future”, Strategy and Leadership Journal Vol. 38 No. 1, pp. 22-31, Q Emerald Group Publishing Limited, ISSN 1087-8572
Kelle, P. and Akbulut, A. (2005), “The role of ERP tools in supply chain information sharing,cooperation and cost optimizing”, International Journal of Production Economics, Vol. 93/94, pp. 41-52.
Kelley-Ott, K. E. (1989), “An historical explanatory study of the evolution and development of organization culture in organizational communication within the speech communication discipline”. (Doctoral dissertation. University of Minnesota. 1989) Dissertation Abstracts International, 51, AAT9020264.
Kerr, A. (1989), "Information technology – creating strategic opportunities for logistics", International Journal of Physical Distribution & Logistics Management, Vol. 19 No.5. Ketchen Jr, D.J. and Tomas M. Hult, G.,( 2007), “ Bridging organization theory and supply chain management: The case of best value supply chains”, in Journal of Operations Management vol. 25, pp. 573-580. Kim, S.W. and Narasimhan, R., (2002), “Information system utilization in supply chain integration efforts”. Int. J. Prod. Res., vol 40, pp 4585–4609. Klausner, M., Hendrickson, C.T. (2000), "Reverse-logistics strategy for product take-back", Interfaces, Vol. 30 No.3, pp.156-65. Konovsky, M. A., and Cropanzano, R. (1991), “ Perceived Fairness of Employee Drug Testing as a Predictor of Employee Attitudes and Job Performance”. Journal of Applied Psychology.vol 76,pp 689–707 Kull, T.J., Boyer, K. and Calantone, R. (2007), “Last-mile supply chain efficiency: an analysis of learning curves in online ordering”, International Journal of Operations & Production Management, Vol. 27 No. 4, pp. 409-34. Kwong Yeung,1, Honggeng Zhou, Andy C.L. Yeung, T.C.E.Cheng (2011), “The impact of third-party logistics providers’ capabilities on exporters’ performance”, Int. J. Production Economics 135 741–753 Lalonde BJ.(1998), “ Building a supply chain relationship”. Supply Chain Management Review vol 2(2) ,pp 7–8. LaLonde, B.J., Cooper, M.C., (1989), “ Partnerships in Providing Customer Service: A Third Party Perspective”. Council of Logistics Management, Oakbrook,

282
IL. Lambert, D., & Stock, J. (1993), “Strategic logistics management (3rd ed.)”. Irwin. Lambert, D.M. and Cooper, M.C., (2000), "Issues in supply chain management. Industr. Market. Mgmt,vol 29,pp 65–83. Lamming, R.C., (1993), “ Beyond Partnership: Strategies for Innovation and Lean Supply”. Prentice Hall, Hemel, Hempstead. Lascelles, D.M. and B.G. Dale.(1990), "Examining the Barriers to Supplier Development," International Journal of Quality & Reliability Management, vol (7:2), pp. 46-56. Lascelles, D.M. and Dale, B.G. (1990). "Quality management: The Chief Executive’s Perception and Role. European Management Journal, 8(1), pp.67-75. Lawler, LE., Mohrman, SA and Ledford, G.E. Jr (1998), “Strategies for High Performance Organizations: Employee Involvement, TQM, and Reengineering Programs in Fortune 1000 Corporations”, Jossey-Bass, San Francisco, CA. Lee, H. L. (2000). ”Creating value through supply chain integration”. Supply Chain Management Review, Vol. 4 No. 4, pp. 30-36. Lee, H.L. and Whang, S. (2000), “Information sharing in a supply chain”, International Journal of Technology Management, Vol. 20 No. 3/4, pp. 373-83. Lee, H.L., (2004), “A triple-A supply chain”, in Harvard Business Review vol. 82 (10), pp. 102-112. Lee, H.L., Padmanabhan, V., Whang, S., (1997). “The bullwhip effect in supply chains”. Sloan Management Review,vol38,pp 93–102. Lee, Y.W. and Strong, D.M. (2004), “Knowing-why about data processing and data quality”, Journal of Management Information Systems, Vol. 20 No. 3, pp. 13-39. Lee, Y.W., Strong, D.M., Kahn, B.K. and Wang, R.Y. (2002), “AIMQ: A method for information quality assessment”, Information & Management, Vol. 40 No. 2002, pp. 133-46. Levary, R.R. (2000), "Better supply chains through information technology", Industrial Management, Vol. 42 No.3, pp.24-30. Li, J., Sikora, R., Shaw, M.J. and Woo Tan, G.A., (2006), Strategic analysis of inter-organizational information sharing. Decis. Support Syst.,Volume 42,pp 251–266. Li, J., Sikora, R., Shaw, M.J. and Woo Tan, G.A., (2005) "Strategic analysis of inter-organizational information sharing. Decis. Support Syst., 2006, 42, 251–266.

283
Li, S., Ragu-Nathan, B., Ragu-Nathan, T. S., & Rao, S. S. (2006). "The impact of supply chain management practices on competitive advantage and organizational performance. Omega, 34(2), 107–124.) Lieckens, K., & Vandaele, N. (2007), “Reverse logistics network design with stochastic lead times”. Computers and Operations Research, vol 34(2), pp 395–416. Lin, F., S. Huang, and S. Lin, (2002), "Effects of Information Sharing on Supply Chain Performance in Electronic Commerce," IEEE Transactions on Engineering Management, 49:3, pp. 258-268. Lin, F., S. Huang, and S. Lin. (2002) "Effects of Information Sharing on Supply Chain Performance in Electronic Commerce," IEEE Transactions on Engineering Management, 49:3, pp. 258-268. Lisa M. Ellram Daniel R.(1997), “Krause Success factors in supplier development”, International Journal of Physical Distribution & Logistics Management; Volume: 27 Issue: 1 Liu, E. & Kumar, A. (2003), “Leveraging Information Sharing to Increase Supply Chain Configurability”. Twenty-Fourth International Conference on Information Systems, pp 523- 537, Seattle, WA Lockamy, A., McCormick, K. (2004), "Linking SCOR planning practices to supply chain performance: an exploratory study", International Journal of Production and Operations Management, Vol. 24 No.11-12, pp.1192-209. Lummus, R.R., Vokurka, R.J., Alber, K.L. (1998), "Strategic supply chain planning", Production & Inventory Management Journal, Vol. 39 No.3, pp.49-58. M.A.Pipino, L., Lee, Y.W. and Wang, R.Y. (2002), “Data quality assessment”, Communications of the ACM, Vol. 45 No. 4, pp. 211-8. Manheim, M.L. (1999), "Integrating people and technology for supply-chain advantage", Achieving Supply Chain Excellence Through Technology, San Francisco, CA, Montgomery Research, pp.304-313 Marien, E.J. (2000), “The four supply chain enablers”, Supply Chain Management Review, Vol. 4, No. 1, pp. 60-8. Mark A. Vonderembse, Michael Tracey (1999), “The Impact of Supplier Selection Criteria and Supplier Involvement on Manufacturing Performance" The Journal of Supply Chain Management, Vol.35 No. 3, pp 33-39. Maron, B., Brückner, J. (1998), "Aktives lieferantenmanagement", Qualität und Zuverlässigkeit, Vol. 6 pp.718-22. Martinsons, M., Davison, R., Tse, D. (1999), "The balanced scorecard: a foundation for the strategic management of information systems", Decision Support Systems, Vol. 25 No.1, pp.71-88.

284
Martland, C.D., Waters, W.G. II (1984), "The adoption of microcomputers: strategies and implications", Logistics and Transportation Review, Vol. 20 No.4, pp.309-14.
Mason, T. (1996), "Getting your suppliers on the team", Logistics Focus, Vol. 4 No.1, pp.10-12. Mathieu, J.E. and D.M. Zajac, (1990), “A review and meta-analysis of the antecedents, correlates and consequences of organizational commitment”, Psychological Bulletin,vol 108(2),pp 171-194. McCarthy, T. and Golicic, S. (2002), “Implementing collaborative forecasting to improve supply chain performance”, International Journal of Physical Distribution & Logistics Management, Vol. 32 No. 6, pp. 431-54. McNabb, D.E., & Sepic, F.T. (1995), “Culture, climate, and total quality management:Measuring readiness for change”, Public Productivity and Management Review, 18:369-386. M.E. and Whang, S. (2002), “E-business and supply chain management: an overview and framework”, Production and Operations Management, Vol. 11 No. 4, pp. 413-23 Mentzer JT (2004), “ Fundamentals of supply chain management: twelve drivers of competitive advantage”,Thousand Oaks Calif.: Sage, 2004. ISBN 0761929088 Mentzer JT, Min S, Zacharia ZG.(2000), “ The nature of inter-firm partnering in supply chain management”. Journal of Retailing vol 76(4), pp 549–68.
Meyer H.(1999), “ Many happy returns”. Journal of Business Strategy, vol 80(7) ,pp 27–31. Meyer, John P. and Natalie J. Allen (1984), "Testing the 'Side- Bet Theory' of Organizational Commitment: Some Methodolog- ical Considerations," Journal of Applied Psychology,vol 69 (3), pp 372-78. Miller, H. (1996), “The multiple dimensions of information quality”, Information Systems Management, Vol. 13 No. 2, pp. 79-83. Miller, Jeffrey G. & Aleda V. Roth (1994), “A Taxonomy of Manufacturing Strategy”. Management Science, Vol. 40, No. 3, pp. 285-304. Mills, J., Platts, K. and Gregory, M. (1995). “A framework for the design of manufacturing strategy process”. International Journal of Operations and Production Management, vol 15, 4, pp 17–49. Mintzberg, H. 1973. The Nature of Management Work. New York, NY: Harper & Row

285
Mohr, J., & Spekman, R. (1994), “Characteristics of partnership success: partnership attributes, communication behavior, and conflict resolution techniques. Strategic Management Journal,vol 15, pp 135– 152. Monczka RM, Petersen KJ, Handfield RB, Ragatz GL. (1998), “ Success factors in strategic supplier alliances: the buying company perspective”. Decision Science.vol 29(3), pp5553–77. Moorman, C., Zaltman, G., & Deshpande, R. (1992). Relationships between providers and users of market research: the dynamics of trust within and between organizations. Journal of Marketing Research, vol 29, pp 314– 328. Morgan, J. (1996), "Integrated supply chains: how to make them work", Purchasing, Vol. 120 No.1, pp.110-13. Morgan, R. M., & Hunt, S. D. (1994), “The commitment– trust theory of relationship marketing”. Journal of Marketing, vol 58, pp 20–38. Nakayama, M. (2003), “An assessment of EDI use and other channel communications on trading behavior and trading partner knowledge”, Information & Management, Vol. 40 No. 6, pp. 563-80. Neely, A., Mills, J., Platts, K., Richards, H., Gregory, M., Bourne, M. and Kennerley, M. (2000). “Performance measurement system design: developing and testing a process based approach”, International Journal of Operations & Production Management, Vol. 20, No. 10, pp. 1119-1145. Neely, A.D., Mills, J.F., Platts, K.W., Gregory, M.J. and Richards, A.H. (1994), "Realising strategy through measurement", International Journal of Operations & Production Management, Vol. 14 No. 3, pp. 140-52. Nelson, K. (2000), "B to B portal directory: show me the markets: every industry has its own portals” .here is hundreds of the best, B to B, Vol. 85 pp.1. Neuman, William, N.(1997). "Social research methods: qualitative and quantitative approaches. Boston: Allyn & Bacon Publications. Noordewier, T.G., G. John and J.R. Nevin, (1990), ”Performance outcomes of purchasing agents in industrial buyer-vendor relationships”, Journal of Marketing 54 (October), pp 80-93. Novack RA, Langley Jr CJ, Rinehart LM.(1995), “Creating logistics value: themes for the future”. Oak Brook, IL: Council of Logistics Management; Nunnally, J. C. (1994). "Psychometric theory, 3rd edn. New York: McGraw-Hill. O’Brien, J.A. (2001), "Management Information Systems: Managing Information Technology.

286
Opasanont, C. (2000), “ How to Start Your Business”. Operations and Production Management, vol 6, 3, pp 10-20. Parker, D., Hartley, K., (1997), “The economics of partnership sourcing vs. adversarial competition: a critique”. European Journal of Purchasing &Purchasing Managementvol 3 (2), pp 115–125. Parsons, G.L.,(1983), “Information technology: a new competitive weapon”, Sloan Management Review, Fall, pp. 3-14 Paul Humphreysa, George Huangb, Trevor Caddena, Ronan McIvora (2007), "Integrating design metrics within the early supplier selection process", Journal of Purchasing & Supply Management, Vol. 13, pp 42–52 Payne, A., Christopher, M., Clark, M. and Peck, H. (1995), “Relationship Marketing for Competitive Advantage, Butterworth-Heinemann, Oxford Pearson, J.N., Ellram, L.M. (1995), "Supplier selection and evaluation in small versus large electronics firms", Journal of Small Business Management, Vol. 33 No.4, pp.53-65. Pettigrew, A., Whipp, R. and Rosenfield, R. (1989). "Competitiveness and the management of Press, Harcourt College Publishers. Pfau, Loren D (1989) "Total Quality Management Gives Companies A Way to Enhance Position in Global Marketplace." Industrial Engineering. Vol 21 (4), pp 17-21. Pipino, L., Lee, Y.W. and Wang, R.Y. (2002), “Data quality assessment”, Communications of the ACM, Vol. 45 No. 4, pp. 211-8. Platts, K., Mills, J.F., Neely, A.D., Gregory, M.J. and Richards, H. (1994), “Evaluating manufacturing strategy formulation processes”, 8th International Working Seminar on Production Economics, Austria, February, pp. 351-65. Platts, K.W. (1992), “Characteristics of Methodologies for Manufacturing Strategy Formulation. Computer Integrated Manufacturing Systems, vol 7 (2), Pohlen, T. L. and Farris, M. T., II (1992), “Reverse logistics in plastics recycling,” International Journal of Physical Distribution and Logistics, Vol. 22, No. 7, pp. 35–47. Poirier, C.C. (1999), "The convergence of business and technology", Supply Chain Management Review, Vol. 3 No.3, pp.52-8. Porter, L.W., Steers, R.M., Mowday, R.T. and Boulian, P.V. (1974), “Organisational commitment, job satisfaction and turnover among psychiatric technicians”, Journal of Applied Psychology, Vol. 59 No. 5, pp. 603-10. Porter, M.E. and Millar, V.E.,(1985) “How information gives you competitive

287
advantage”, Harvard Business Review, Vol. 63 No. 4, pp. 149-60. Porter, M.E., (1995), " Competitive Advantage, Free Press, New York, NY, 1985. Prahalad, C.K., Hamel, G. (1990), "The core competence of the corporation", Harvard Business Review, Vol. 68 No.3, pp.79-91. Pritchard, Mark, Mark Havitz, and Dennis Howard (1999), “Analyzing the Commitment-Loyalty Link in Service Relationships,” Journal of the Academy of Marketing Science, vol 27 (3),pp 333-48. R.E. Spekman, J.W. Kamauff, N. Myhr, (1998), “ An empirical investigation into supply chain management: a perspective on partnerships”, Supply Chain Management, vol 3 (2), pp 53–67. R.M. Monczka, K.J. Petersen, R.B. Handfield, G.L. Ragatz, (1998), “ Success factors in strategic supplier alliances: the buying company perspective”, Decision Science, vol 29 (3) pp 5553–5577. R.Y. (2004), “Assuring information quality”, Journal of Management Information Systems, Vol. 20 No. 3, p. 11. Raghunathan, S. (2003). "Impact of Demand Correlation of the Value of and Incentives for Information Sharing in a Supply Chain. European Journal of Operational Research, Vol.146, pp 634-649. Reichheld F. F. (1996), "The Loyalty Effect. Boston, MA: Harvard Business School Press Review, 80, 25–27.
Rindfleisch, A., & Heide, J. B. (1997), “ Transaction cost analysis: past, present, and future applications”. Journal of Marketing, vol 61,pp 30–54. Ritchie, L., Burnes, B., Whittle, P. and Hey, R. (2000), “The benefits of reverse logistics: the case of Manchester Royal Infirmary Pharmacy”, Supply Chain Management, Vol. 5, pp. 226-34. Ritchie, L., Burnes, B., Whittle, P., Hey, R. (1999), "The benefits of reverse logistics: the case of the Manchester Royal Infirmary Pharmacy", Supply Chain Management: An International Journal, Vol. 5 No.5, pp.226-331. Rittenberg, L. and T.D.(1999), “ Tregarthen. Economics, 2nd ed., Worth Publishing, New York, 1999. Robert M. Morgan and Shelby D. Hunt (1994),”The Commitment-Trust Theory of Relationship Marketing”, Journal of Marketing, Vol. 58, No. 3, pp. 20-38. Robson, C (1993), Real World Research: a Resource for Social Scientists and Practitioners-Researchers, Rogers, D., Tibben-Lembke, R. (2001), “An examination of reverse logistics

288
practices”. Journal of Business Logistics,vol 22(2), pp 129-148. Rogers, D.S., Tibben-Lembke, R.S., (1999), “ Going Backwards: Reverse Logistics Trends and Practices. Reverse Logistics Executive”, Council, Pittsburgh, PA. Rosenberg, L. & Czepiel, J. (1984). “A Marketing Approach to Customer Retention.” Journal of Consumer Marketing, pp. 45-51 Rousso, A.S., Shah, S.P., (1994), “ Packaging taxes and recycling incentives – the German green dot program”. National Tax Journal ,vol 47 (3), pp 689–701. Roy, R., Potter, S., (1996), “Managing engineering design in complex supply chains”. International Journal of Technology Management vol 12 (4),pp 403–420. Rubio S, Chamorro A, Miranda F. (2005), “Characteristics of the research on reverse logistics”. International Journal of Production Research .vol 46(4):pp 1099–120. Rushton, A. & Oxley, J.(1989), "Handbook of Logistics and Distribution Management. Kogan Page Ltd., London Russell, R.M., Krajewski, L.J., (1992), “Coordinated replenishments from a common supplier”. Decision Sciences.vol 23,pp 610–632. Sandberg, E. (2005), "Logistics collaboration in supply chains – a survey of Swedish manufacturing companies", Department of Management and Economics, Linköping University, Linköping, . Santori and Anderson (1987), "Underscored the importance of non-financial measures as tools to motivate personnel and monitor their progress. Saunders, D. E., Peterson, G. W., Sampson, J. P., Jr., & Reardon, R. C. (2000). "Relation of depression and dysfunctional career thinking to career indecision. Journal of Vocational Behavior, 56, 288-298.
Schary P.(1977), “Transportation rates and the recycling problem”. Transportation Journal vol 16(3): pp 46–56.
Schein, E.H. (1992), “Organizational Culture and Leadership”, (2nd edition.). San Francisco; Wiley & Sons.
Scholtes, P.R. (1992), “The Team Handbook”, Joiner, Madison, WI,
Seidmann, A., & Sundararajan, A. (1997), “Building and sustaining interorganizational information sharing relationships: the competitive impact of interfacing supply chain operations with marketing strategy”. Paper presented at the Proceedings of the eighteenth international conference on Information systems, Atlanta, Georgia, United States.

289
Sekaran, U. (2000). "Research methods for business. New York: John Wiley & Sons, Inc.
Shepetuk, A. J. (1991) "Is your product development process a tortoise or a hare?, Management Review, 80, pp. 25–27. Shin, H., Collier, D.A., Wilson, D.D. (2000), "Supply management orientation and supplier/buyer performance", Journal of Operations Management, Vol. 18 pp.317-33. Shore, B. (2001), “Information sharing in global supply chains”, Journal of Global Information Technology Management, Vol. 4 No. 3, pp. 27-46. Simchi-Levi, D., Kaminsky, P. and Simchi-Levi, E. (2003), Designing and Managing the Supply Chain: Concepts, Strategies, and Case Studies, McGraw-Hill, New York, NY Skinner,W..(1969), “Manufacturing Management”. Harvard Business Review,vol. 29, pp. 65-83. Skjoett-Larsen, T. (2000), "European logistics beyond 2000", International Journal of Physical Distribution & Logistics Management, Vol. 30 No.5, pp.377-87.
Slack, N. (1991), "The Manufacturing Advantage, Mercury Books, London Spalding, J.O. (1998), "Transportation industry takes the right-of-way in the supply chain", ILE Solutions, Vol. 30 No.7, pp.24-8. Spekman, R. E., J. Spear., and J. Kamauff. (2001), “Supply Chain Competency: Learning as a Key Component. Working paper”, University of Virginia. Spekman, R.E., Kamauff Jr., J.W., Salmond, D.J., (1994), “At last purchasing is becoming strategic”. Long Range Planning.vol 27 (2),pp 76–84. S.S. Nudurupati, U.S. Bititci, V. Kumar, F.T.S. Chan, (2011), “State of the art literature review on performance measurement, Computers & Industrial Engineering 60 279–290 Stalk, G., Evans, P. and Schulman, L.E. (1992), “Competing on capabilities: the new rules of corporate strategy”, Harvard Business Review, Vol. 70 No. 2, pp. 57-69. Stanley E. Fawcett, Jeffrey A. Ogden, and Gregory M. Magnan, (2006), “Organizational commitment and governance for supply chain success”. International Journal of Physical Distribution & Logistics Management Volume: 36 Number: 1 Year. pp22-35 Stanley E. Fawcett, Paul Osterhaus, Gregory M. Magnan, and James C. Brau, (2007) “Information sharing and supply chain performance: the role of

290
connectivity and willingness” Supply Chain Management: An International Journal. Vol. 12, issue 5, pp 358–368 Stein T, Sweat J.(1998) “ Killer supply chains”. Information week ,vol 708(9),pp 36–46. Stobaugh, R. and Telesio, P. (1983), “Match manufacturing policies and product strategy”. Harvard Business Review, vol 61, 2, pp 111–20. Stock, J. R. (1992), “ Reverse Logistics, Council of Logistics Management, Oak Brook”, Illinois. Sturgess Stump, R.L. and Sriram, V. (1997), “Employing information technology in purchasing: buyer-supplier relationships and size of the supplier base”, Industrial Marketing Management, Vol. 26, pp. 127-36. Subramani, M., (2004), "How Do Suppliers Benefit from information technology use in Supply Chain Relationships Mis Quarterly, - JSTOR Suhong Li, Bhanu Ragu-Nathan, T.S. Ragu-Nathan, S. Subba Rao (2006), "The impact of supply chain management practices on competitive advantage and organizational performance Omega, Volum 34, Issue 2, April Pages 107-124. Swamidass, P. M. and Newell, W. T. (1987). “Manufacturing strategy, environment uncertainty and performance: a path analytical model”. Management Science,vol 33, 4, pp 509–24. Swift, C.O. (1995), "Preferences for single sourcing and supplier selection criteria", Journal of Business Research, Vol. 32 No.2, pp.105-11.
Takeuchi, H. & Quelch, J. A. (1983), "Quality is more than making a good product. Harvard business review, 61, 139-146. Talluri, S. and R. Narasimhan. (2005),‘‘A Note on a Methodology for Supply Base Optimization,’’ IEEE Transactions on Engineering Management, vol (52:1), p. 130. Tan KC, Kannan VR, Handfield RB. (1999), "Supply chain management: supplier performance and firm performance. International Journal of Purchasing and Materials Management, 34(3):2–9. Taylor, D. A. (2003). "Supply Chains: A Manager's Guide: Addison Wesley. Thatcher, M.E. and Oliver, J.R. (2001), “The impact of technology investments on a firm’s production efficiency, product quality, and productivity”, Journal of Management Thierry M, Salomon M, van Nunen J, Van Wassenhove L.(1995), “ Strategic issues in product recovery management. California”, Management Review .vol 37(2),pp114–34.

291
Thorn BK, Rogerson P. (2002), “ Take it back”. Industrial Engineer;vol 34(4):pp 34–40. Tibben-Lembke RS, Rogers DS. (2002) "Differences between forward and reverse logistics in a retail environment. Supply Chain Management: An International Journal . Toffel MW.(2003), “ The growing strategic importance of end-of life product management”. California Management Review .vol 45(3),pp102–29. Tompkins J, Ang D.(1999), "What are your greatest challenges related to supply chain performance measurement?. IIE Solutions, vol 31(6) pp 66. Towill DR,(1997) “The seamless chain—the predator’s strategic advantage. International Journal of Technology Management,vol13(1) pp 37–56. Towill DR. (2003), "Simplified material flow holds the key to supply chain integration. OMEGA ,vol 31(1),pp 17–27. Tracey, M. (1998), "The importance of logistics efficiency to customer service and firm performance", International Journal of Logistics Management, Vol. 9 No.2, pp.65-81. Tracey, M., Vonderembse, M.A. (2000), "Building supply chains: a key to enhancing manufacturing performance", Mid-American Journal of Business, Vol. 15 No.2, pp.11-20. Trebilcock B.(2002), “ The seven deadly sins of reverse logistics”, Logistics Management 2002, pp31–4. Trevelen, M., (1987), ‘‘Single sourcing a management tool for the quality supplier”. Journal of Purchasing and Materials Management.vol 23, pp 19–24. Tully, S. (1995), "Purchasing's new muscle", Fortune, vol No.20, pp.76. Turner JR. (1993) “Integrated supply chain management: what’s wrong with this picture”. Industrial Engineering, vol25(12), pp52–5. Vachon, S. and R.D. Klassen (2002), "An Exploratory Investigation of the Effects of Supply Chain Complexity on Delivery Performance, IEEE Transactions on Engineering Management, Vol. 49, No. 3, Van der Vorst, J. and Beulens, A. (2002), “Identifying sources of uncertainty to generate supply chain redesign strategies”, International Journal of Physical Distribution & Logistics Management, Vol. 32 No. 6, pp. 409-30.
Veera Pandiyan Kaliani Sundram, Abdul Razak Ibrahim, V.G.R. Chandran Govindaraju, (2011), “Supply chain management practices in the electronics industry in Malaysia: Consequences for supply chain performance”,

292
Benchmarking: An International Journal Volume: 18 Issue: 6
Verity, J.W.,(1991) “Is it time to junk the way you use computers?”, Business Week,, Vickery, S. K. et al (2003),"The Effects of an Integrative Supply Chain Strategy on Customer Service and Financial Performance: An Analysis of Direct Versus Indirect Relationships", Journal of Operations Management, vol 21 , pp 523-539. Vickery, S., Calantone, R., Dröge, C. (1999), "Supply chain flexibility: an empirical study", The Journal of Supply Chain Management, Vol. 35 No.1, pp.16-24. Viswanadham, N., Srinivasa Raghavan, N.R., (1997), “Flexibility in manufacturing enterprises”, in Sädhanä vol. 22 (2), pp. 135-163. Vonderembse, M.A. and Tracey .M.,(1999),”The Impact of Supplier Selection Criteria and Supplier Involvement on Manufacturing Performance” , The Journal of Supply Chain Management , Summer , pp.33-39. Voss, C. (1992), "Manufacturing Strategy: Process and Content, London: Chapman and Hall. WA Cook, Karen S. and Richard M. Emerson (1978), "Power, Equity and Commitment in Exchange Networks," American Sociolog- ical Review, vol 43 .pp 721-39. Wann-Yih Wu, Chwan-Yi Chiag, Ya-Jung Wu, Hui-Ju Tu (2004), “The influencing factors of commitment and business integration on supply chain management”, Industrial Management & Data Systems; Volume: 104 Issue: 4 Webster S, Mitra S.(2007), “Competitive strategy in remanufacturing and the impact of take back laws”. Journal of Operations Management .vol 25(6):pp 1123–40. Well, P.; Seitz, M. (2006),"Business models and closed-loop supply chains: a typology. Suppl. Chain Manag. 10, 249–251. William M. Lankford (2004), “Supply chain management and the Internet”, Online Information Review Volume: 28 Number: 4 pp: 301-305 Williamson, Oliver E. (1985), “The Economic Institutions of Capitalism”. New York: The Free Press. Woodcock, D.J., (1989), "Measuring Strategic Control and Improvement in Manufacturing", International Journal of Operations Production Management, Vol. 9 No. 5, , pp. 47-55. Wu, J-H., Wang, Y-M. (2006), "Measuring ERP-success: the ultimate users' view", International Journal of Operations & Production Management, Vol. 26

293
No.8, pp.882-903. W.H. Ip, S.L. Chan, C.Y. Lam, (2011), “Modeling supply chain performance and stability”, Industrial Management & Data Systems Volume: 111 Issue: 8 X. Zhao, J. Xie, W.J. Zhang, (2002), "The impact of information sharing and order-coordination on supply chain performance, Supply Chain Management: an International Journal, vol7 (1) pp 24–40. X. Zhao, J. Xie, W.J. Zhang, (2002), "The impact of information sharing and order-coordination on supply chain performance, Supply Chain Management: an International Journal 7 (1) 24–40. Yin, R. (1994). "Case study research: Design and methods (2nd ed.). Beverly Hills, CA: Sage Zikmund, W. G. (2000). "Business research methods. Orlando, Philadelphia, USA: The Dryden
ZikmundW, StantonW.(1971), “Recycling solid wastes: a channels-of-distribution problem”,Journal of Marketing , vol 35:pp 34–9.
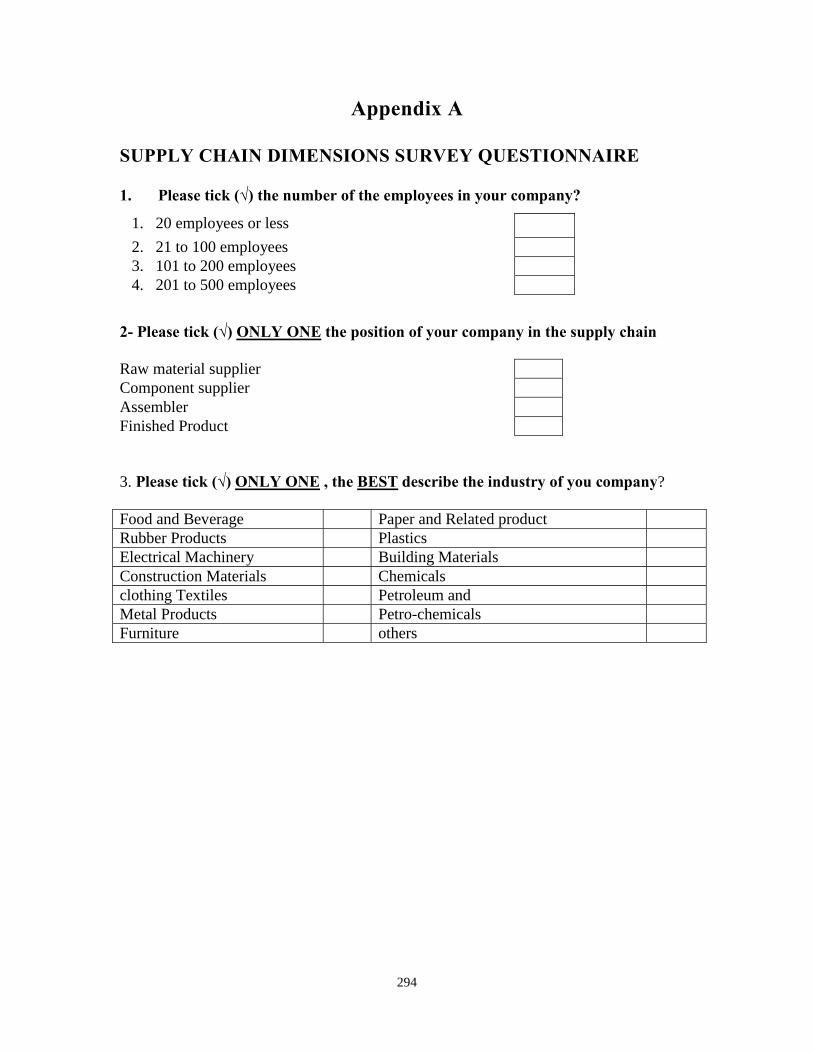
294
Appendix A
SUPPLY CHAIN DIMENSIONS SURVEY QUESTIONNAIRE 1. Please tick (√) the number of the employees in your company?
1. 20 employees or less 2. 21 to 100 employees 3. 101 to 200 employees 4. 201 to 500 employees
2- Please tick (√) ONLY ONE the position of your company in the supply chain Raw material supplier Component supplier Assembler Finished Product
3. Please tick (√) ONLY ONE , the BEST describe the industry of you company? Food and Beverage Paper and Related product Rubber Products Plastics Electrical Machinery Building Materials Construction Materials Chemicals clothing Textiles Petroleum and Metal Products Petro-chemicals Furniture others

295
1. MANUFACTURING STRATEGY 1.1 How important are the following manufacturing strategies in your organization? (1) Very unimportant (2) Unimportant (3) ) Neutral (4) Important (5) Very important
1.4 How important are the following delivery practices to your organization? (1) Very unimportant (2) Unimportant (3) ) Neutral (4) Important(5) Very important
1.1.1 Quality Practices 1 2 3 4 5 1.4.1 Delivery the kind of products needed 1 2 3 4 5
1.1.2 Cost 1 2 3 4 5 1.4.2 Delivery customer order on time 1 2 3 4 5
1.1.3 Delivery 1 2 3 4 5 1.4.3 Provide dependable delivery 1 2 3 4 5
1.4.4 Implement shipment tracking 1 2 3 4 5
1.2 How important are each of the following quality 1.4.5 Short order-to delivery time 1 2 3 4 5 practices to your firm? (1) Very unimportant (2) Unimportant (3) ) Neutral (4) Important
2. SUPPLIER PARTNERSHIP STRATEGY (5) Very important
1.2.1 Quality Approach 1 2 3 4 5 2.1 How important are the following supplier partnership strategies to your organization?
1.2.2 Implementation of TQM 1 2 3 4 5
(1) Very unimportant (2) Unimportant (3) ) Neutral (4) Important (5) Very important
1.2.3 Continuous improvement tools 1 2 3 4 5 2.1.1 Supplier Selection Practice 1 2 3 4 5
1.2.4 Benchmark 1 2 3 4 5 2.1.2 Supplier involvement practice 1 2 3 4 5
1.2.5 Quality awareness 1 2 3 4 5 2.1.3 Supply base reduction 1 2 3 4 5
1.3 Please tick (√) the number that accurately reflects your organization present practice in lowering total supply chain cost. (1) Strongly disagree (2) Disagree (3) Neutral (4) Agree (5) Strongly Agree
2.2 Please tick (√) the number that accurately reflects your organization present practice in selecting your business partner supplier. (1) Strongly disagree (2) Disagree (3) Neutral (4) Agree (5) Strongly Agree
1.3.1 Sourcing Cost 1 2 3 4 5 2.2.1 Trustworthy 1 2 3 4 5
1.3.2 Manufacturing Cost 1 2 3 4 5 2.2.2 Quality product 1 2 3 4 5
1.3.3 Sales and distribution cost 1 2 3 4 5 2.2.3 Delivery lead time 1 2 3 4 5
1.3.4 Returns and after sales cost 1 2 3 4 5 2.2.4 Competitive price 1 2 3 4 5
2.2.5 Technical competence 1 2 3 4 5

296
3.2.3 Determine future customer expectations 1 2 3 4 5
2.3 How important are the following supplier 3.2.4 Have joint venture improvement program 1 2 3 4 5 Involvement techniques to your organization? (1) Strongly disagree (2) Disagree (3) Neutral (4) Agree (5) Strongly Agree 3.3 Please tick (√) the number that accurately reflects your firms’ present conditions.
2.3.1 Product design and development 1 2 3 4 5 (1) Strongly disagree (2) Disagree (3) Neutral (4) Agree Stage (5) Strongly Agree
2.3.2 Continuous improvement 1 2 3 4 5 3.3.1 Conveying accurate information 1 2 3 4 5 Programs
3.3.2 Developing and maintaining a positive 1 2 3 4 5 relationship 2.4 Please tick (√) the number that accurately reflects your 3.3.3 Using compatible technologies 1 2 3 4 5 organization present practice. 3.3.4 Opening lines of communication and 1 2 3 4 5 (1) Strongly disagree (2) Disagree (3) Neutral (4) Agree engaging in cross-function discussion (5) Strongly Agree 3.3.5 Engaging in problem solving and managing 1 2 3 4 5 2.4.1 We rely on a small number of 1 2 3 4 5 conflicts high quality suppliers
2.4.2 We get multiple price quotes 1 2 3 4 5 4. INFORMATION IN SUPPLY CHAIN from suppliers before ordering 4.1 How important are the information startegies
2.4.3 We drop suppliers for price reasons 1 2 3 4 5 to your organization? (1) Very unimportant (2) Unimportant (3) ) Neutral (4) Important (5) Very important
2.4.4 We drop suppliers for quality 1 2 3 4 5 4.1.1 Information Quality 1 2 3 4 5 Reasons
3. CUSTOMER RELATION 4.1.2 Information Sharing 1 2 3 4 5
3.1 How important are the following supplier partnership 4.2 Please tick (√) the number that accurately reflects yourStrategies to your organization? organization present practice (1) Very unimportant (2) Unimportant (3) ) Neutral (4) Important (1) Strongly disagree (2) Disagree (3) Neutral (4) Agree (5) Very important (5) Strongly Agree 4.2.1 Information exchange between supply 1 2 3 4 5 3.1.1 Customer Relation Practices 1 2 3 4 5 chain partners is timely.
3.1.2 Customer-Supplier Relationships 1 2 3 4 5 4.2.2 Information exchange between supply 1 2 3 4 5 chain partners is accurate. 4.2.3 Information exchange between supply 1 2 3 4 5 3.2 Please tick (√) the number that accurately reflects your chain partners is complete. firms’ present conditions 4.2.4 Information exchange between supply chain 1 2 3 4 5 (1) Strongly disagree (2) Disagree (3) Neutral (4) Agree partners is adequate. (5) Strongly Agree 4.2.5Information exchange between our trading 1 2 3 4 5 3.2.1 Set reliability, responsiveness, 1 2 3 4 5 partners and us is reliable. and other business ethics standards jointly
3.2.2Measure and evaluate customer 1 2 3 4 5 Satisfaction

297
5. LOGISTIC INTEGRATION
4.3 Please tick (√) the number that accurately reflects your 5.1 Please tick (√) the number that accurately reflects yourorganization present practice. organization present practice.
(1) Strongly disagree (2) Disagree (3) Neutral (4) Agree (5) Strongly Agree
(1) Strongly disagree (2) Disagree (3) Neutral (4) Agree (5) Strongly Agree
4.3.1 We inform trading partners in 1 2 3 4 5 5.1.1 Inter-organizational logistic activities are 1 2 3 4 5 advance of changing needs closely coordinated
4.3.2 Our trading partners share 1 2 3 4 5 5.1.2 Information and materials flow smoothly 1 2 3 4 5 proprietary information with us between our supplier firms and us
4.3.3 Our trading partners share 1 2 3 4 5 5.1.3The inbound and outbound distribution of 1 2 3 4 5 business knowledge of core business process with us goods with our suppliers is integrated
4.3.4 We and our trading partners 1 2 3 4 5 6. THE CURRENT AND FUTURE exchange information that helps establishment of SCM INITIATIVES
business planning 6.1 Please tick (√) the number that accurately reflects your organization present practice.
4.3.5 We and our trading partners keep 1 2 3 4 5 each other informed about events or changes that may (1) Not likely (2) Maybe (3) Planned (4) In place
affect the other partners
6.1.1 Greater use of technology 1 2 3 4
4.4 Please tick (√) the number that accurately reflects your 6.1.2 Internet link to suppliers 1 2 3 4organization present practice. 6.1.3 E-Business 1 2 3 4(1) Strongly disagree (2) Disagree (3) Neutral (4) Agree (5) Strongly Agree 6.1.4 Bar Coding 1 2 3 4
4.4.1 Schedule and planning 1 2 3 4 5 6.1.5 EDI 1 2 3 4
4.4.2 Production data 1 2 3 4 5 7 PERFORMANCE MEASURE
4.4.3 Order quantities 1 2 3 4 5 7.1 How important are the following performance measures to your organization?
4.4.4 Inventory Status 1 2 3 4 5
(1) Very unimportant (2) Unimportant (3) ) Neutral (4) Important
(5) Very important
4.5 Please tick (√) ALL IT application (s) used in your business interactions with your suppliers.
7.1.1 Financial Performance 1 2 3 4 5
7.1.2 Operational Performance 1 2 3 4 5
4.5.1 Phone 4.5.2 Fax 4.5.3 E-mail 7.2 Please tick (√) the number that accurately best indicates
4.5.4 EDI 4.5.5 Intranet 4.5.6 Extranet your organization financial performance.
4.5.7 MRP 4.5.8 MRPII 4.5.9 ERP (1) Strongly disagree (2) Disagree (3) Neutral (4) Agree
4.5.10BarCode 4.5.11E Commerce
4.5.12 CAD (5) Strongly Agree
4.5.13 Engineering data management 7.2.1 growth in sales 1 2 3 4 5
4.5.14 Manufacturing execution system 7.2.2 growth on assets 1 2 3 4 5
4.5.15 Computer-aided process planning 7.2.3 market share gain 1 2 3 4 5

298
7.2.4 Return on investment 1 2 3 4 5
7.2.5 Profit margin on sales 1 2 3 4 5
7.3 Please tick (√) the number that accurately best indicates your organization operational performance.
(1) Strongly disagree (2) Disagree (3) Neutral (4) Agree (5) Strongly Agree
7.3.1 Volume Flexibility 1 2 3 4 5
7.3.2 Scheduling Flexibility 1 2 3 4 5
7.3.3Delivery reliability & consistency 1 2 3 4 5
7.3.4 Product quality 1 2 3 4 5
7.3.5 Customer satisfaction index 1 2 3 4 5
Respondent Information:
Do your need a copy of the questionnaire results? Yes No.
Name:_____________________________________
Company Name:_____________________________________________________
Address:___________________________________________________________
Tel.____________________________ Fax:______________________________
E-Mail:____________________________ Name: Mosa Saleh Al-Haddad P.O.Box: 7600, Dammam 31472 Tel. 00966 3 812 1143 Fax: 00966 3 812 1059 E-mail: [email protected] Kingdom of Saudi Arabia