supply chain performance measurement system based … · supply chain performance measurement...
TRANSCRIPT

DOI:10.2298/CSIS090608018S
Supply Chain Performance Measurement System
Based on Scorecards and Web Portals
Nenad Stefanović and Dušan Stefanović
Faculty of Science, University of Kragujevac, Radoja Domanovica 12, 34000 Kragujevac, Serbia
{nenads, dusans}@kg.ac.rs
Abstract. Successful supply chain management becomes essential for the ultimate success of corporations. Companies today seek an effective performance measurement (PM) system to maximize the bottom line. Unfortunately, performance measurement in the supply-chain field has not kept pace with today’s world of interdependent business relationships. What companies need is a new PM system that unifies different business elements, concepts, technologies and tools. In this paper, the architecture of such a pervasive PM system is introduced. The main system elements such as process model, metrics and data warehouse are described. Finally, a specialized PM web portal which enables proactive performance monitoring and fosters the improvement and optimization is presented.
Keywords: supply chain, performance, scorecard, web portal.
1. Introduction
Supply chains are growing increasingly complex, from linear arrangements to synchronized, multi-echelon, outward-facing networks of distributed servers. There is much more information that needs to be monitored than there was just a few years ago. Most companies lack the tools that can quickly shift through and present data coming from supply chain partners and systems.
The overall performance of the supply chain significantly affects the financial health of all member companies. Therefore, an effective supply chain performance measurement process should be able to directly address performance areas that create sustainable profitability and financial strength.
In order to accomplish this requirement, the performance measurement process will need to provide a reliable indication of the contribution of supply chain operations to the areas like growth, cost minimization, working capital efficiency and fixed asset utilization
A robust and scalable performance management system is the platform for improvement. It must be exception-based and allow users to prevent problems, resolve issues, capture knowledge, and sustain improvements. The system must be able to handle an increasing number of users and amounts of

Nenad Stefanović and Dušan Stefanović
ComSIS Vol. 8, No. 1, January 2011 168
information (due to expanded products, members of the supply chain, geography, and time). While it must be personalized and easy to use, it must also ensure high levels of security and privacy.
Supply chain PM cycle is not just for the supply chain, but for all aspects of the enterprise as well as for the extended supply chain. Ultimately, by managing the performance of myriad processes across enterprise boundaries, companies will have achieved the vision of Enterprise Performance Management (EPM) [1].
In supply chain, large volumes of raw transactional data are generated by each process and stored. The challenge for many companies lies in determining what information is necessary to drive improvements and efficiencies at each process in the supply chain, and designing an information management environment to turn the raw data into meaningful metrics and key performance indicators (KPI). Key performance indicators are measurements that directly relate to key business requirements. KPI come in various forms from simple reporting measurements to very complex, cross correlated analytic results.
Information from supply chain management (SCM) processes must be collected, measured, analyzed and continuously monitored. This requires integration of data coming out of ERP (Enterprise Resource Planning), SCM and all other systems supporting these business processes. Data from transactional systems should be summarized into the Data Warehouse (DW), which should be able to scale to large sizes and be continually updated.
A well designed and integrated PM framework increases the capability of business intelligence (BI) systems to provide accurate insights for effective supply chain decision making. BI is evolving from traditional BI to pervasive BI (PBI), which empowers everyone in the organization, at all levels, with analytics, alerts and feedback mechanisms. On the benefits side, PBI promises to [2]:
More effectively leverage the strengths of the whole supply chain by giving every employee the power to contribute to and enhance key performance indicators that have been set by management.
Increase sustainable competitive advantage by helping every employee to make the right decisions at the right time in step with company and customer objectives.
Improve operational efficiency by uncovering new best practices and driving those practices from the bottom up as well as the top down.
2. Background Research and Literature Review
Business performance management [3] describes the methods, metrics, processes and systems used in organizations to translate strategies into plans, monitor execution, and provide insight to improve financial and operational performance. It represents the strategic, integrated evolution of business intelligence to support the management process.

Supply Chain Performance Measurement System Based on Scorecards and Web Portals
ComSIS Vol. 8, No. 1, January 2011 169
The importance of performance measurement in the context of SCM cannot be overstated. Timely and accurate assessment of overall system and individual system component performance is paramount. An effective performance measurement system provides the basis to understand the system, influences behavior throughout the system, and provides information regarding the results of system efforts to supply chain members and outside stakeholders. In effect, performance measurement is the glue that holds the complex value-creating system together, directing strategic formulation as well as playing a major role in monitoring the implementation of that strategy. In addition, research findings suggest that measuring supply chain performance in and of itself leads to improvements in overall performance [4]. Despite its importance, supply chain performance often was measured in oversimplified and sometimes counterproductive (cost-reduction-based) terms [5]. Lack of an appropriate performance measurement system has been cited as a major obstacle to effective supply chain management [6].
Traditionally, companies have tracked performance based largely on financial accounting principles. Financial accounting measures are certainly important in assessing whether or not operational changes are improving the financial health of an enterprise, but insufficient to measure supply chain performance for the following reasons [7]:
The measures tend to be historically oriented and not focused on providing a forward-looking perspective.
The measures do not relate to important strategic, non-financial performance.
The measures do not directly tie to operational effectiveness and efficiency.
Most performance measurement systems are functionally focused. Until few years ago, there were several reasons why most companies did
not implement supply chain performance measurement systems [8]: 1. No clear established approach or set of measures was available. 2. Software vendor products offered only a limited range of supply chain
metrics. 3. Companies were too busy with other more important initiatives.
The traditional approaches to monitoring performance had been metrics projects and balanced scorecards. In metrics projects, functional organizations and workgroups established and tracked metrics that were considered most relevant for measuring performance. Unfortunately, there were a number of limitations with metrics projects:
By focusing on functional metrics, they ended up driving locally optimized ―silo‖ behavior at the expense of the overall company.
It was time consuming to compile and analyze information, so visibility often came too late to make a difference. In addition, they only provided information on limited history, not insight into the future.
Metric tracking was manual, so numbers were often calculated incorrectly or inconsistently over time.
Many times, workers didn’t know what to do with the data. It wasn’t always clear what constituted poor performance, when to act, or how to act. Or
Nenad Stefanović and Dušan Stefanović
ComSIS Vol. 8, No. 1, January 2011 170
else, people were so distracted and confused by the measuring process itself that they didn’t act.
Although selected metrics were called key performance indicators, there was no feedback or validation to ensure that organizations were actually measuring the most relevant business drivers.
Experienced managers learned how to ―game‖ or ―tinker with‖ the metrics to make themselves look good. In an attempt to overcome some of these limitations, many companies
have initiated balanced scorecard (BSC) projects. Based on the methodology of Robert Kaplan and David Norton [9],
these organizations created a
balanced set of metrics representing financials, customers, internal business processes and innovation. The goal was to enable better decision-making by providing managers with a broader perspective of both tangible and intangible assets. Although conceptually compelling, most balanced scorecards were implemented as static management dashboards, unable to drive action or performance improvement because [10]:
These dashboards are usually driven out of finance organizations, therefore are typically highly weighted by financial information. Much of the important non-financial data and qualitative information is not captured or synthesized.
Information is often manually aggregated from operational data sources and is prone to errors and significant delays.
Infrequent sourcing of information allows people to play tricks operationally to improve the numbers. Who hasn’t heard of the manager who shipped orders early or incomplete to reduce inventory levels?
Where there is data integration, it is often ―hard-wired‖ and difficult to modify over time as strategies and objectives change. Static systems – which encourage the improvement of specific metrics, not necessarily overall business performance – become self-perpetuating due to the fact that those managers successful under the old systems do not want to introduce new ones.
Executive-level systems are often disconnected from tactics and operations. Because the metrics are high level and presented without regard to their implicit interdependencies, managers are uncertain what action to take to improve overall performance.
Dashboards do not track decisions and their effectiveness over time so it is difficult for organizations to improve by learning from experience. Moreover, there is no mechanism to embed business rules to help improve the decision-making and problem resolution process itself.
There is little or no support for collaborative processes across organizations, up and down the chain of command. The Balanced Scorecard has been successfully implemented at hundreds
of companies, however, many companies still need a practical measurement system that will enable them to improve profitability. As Kaplan and Norton state in [11], the execution of the measurement system is more important than the measurement system itself. Accordingly, fewer than 10 percent of the strategies outlined on the Business Scorecard were successfully

Supply Chain Performance Measurement System Based on Scorecards and Web Portals
ComSIS Vol. 8, No. 1, January 2011 171
implemented. This implies that the measurement strategy must be simplified for a successful execution. 80 percent of enterprises that fail to integrate the balanced scorecard into PM methods and tools will drop the balanced scorecard and return to a less organized and less effective set of metrics [12].
There is a need to establish dynamic supply chain performance measurement systems to effectively manage supply chain operations and meet financial and nonfinancial business objectives. In the following sections, we present a comprehensive supply chain PM model and its realization through a specialized PM web portal that is an integral part of the overall BI model.
3. Architecture of PM System
A robust infrastructure is crucial to realize the benefits of various PM initiatives. Figure 1 shows how main components fit together to create an environment to support PM solution.
Fig. 1. PM Platform Architecture
The data sources are the basis of all the business intelligence solution extracted from IT systems. They can be anything from ERP backends, CRM systems, HR databases, billing systems, operational databases or any other database that forms a critical part of the SCM business processes. Specific data needs to be extracted from these databases and loaded into a data warehouse to support the kind of heavy analysis and querying that a BI system allows. This layer also referred as ETL (Extraction, Transformation and Loading), is probably the most critical phase in the BI chain. The quality of the data in the warehouse depends on the configuration and capabilities of the ETL engine. A data warehouse is not always the ideal place to fetch data for complex queries and analysis. By extracting data specific to the type of analysis required, data marts improve the speed of queries and processing.

Nenad Stefanović and Dušan Stefanović
ComSIS Vol. 8, No. 1, January 2011 172
The proposed PM model unifies people, processes, methodologies and tools into a single business solution. PM model is developed in such a way to seamlessly integrate within overall BI and collaboration platform [13].
The architecture of the PM model is presented in Figure 2. The starting point is the SCM process model which provides a library of the supply chain specific set of processes, relationships, metrics and best practices. The developed SCM Metamodel enables flexible modelling and creation of different supply chain configurations (models). These models are the basis for the construction of DW metadata (measures, dimensions, KPI).
Fig. 2. Architecture of the PM Model
The data warehouse approach, allows the single version of the truth because of the integrated and consolidated data repository. Server-based definition of KPIs offers centralized metadata management and enables creation of various front-end PM and analytical applications. Data warehouse acts as an integrated data source upon which different BI elements are developed such as planning models, performance monitoring systems, reporting and data mining models.
PM web portal holds the central place in the model, as it comprises a portfolio of analytic, collaboration and communication services that connect people, information, processes, and systems both inside and outside the corporate firewall.
We have designed a specialized PM web portal with an adequate set of elements (reports, dashboards and scorecards). The web portal also integrates collaboration and analytical services, and enables users to take actions.

Supply Chain Performance Measurement System Based on Scorecards and Web Portals
ComSIS Vol. 8, No. 1, January 2011 173
3.1. Supply Chain Metrics
A standardized supply chain process model provides significant benefits. Standardized models provide companies’ maps toward business process engineering, establish benchmarking for performance comparison and uncover best business practices for gaining competitive advantage. By standardizing supply chain operations and metrics for managing such operations, companies can not only compare their results against others, but they are also able to gain visibility of operations over a supply chain that may cross corporate borders. Partners in a supply chain can communicate more unambiguously and can collaboratively measure, manage, and control their processes.
The SCM process model contains the standard name for each process element, the notation for the process element, standard definition for the process element, performance attributes that are associated with the process element, metrics that are associated with the performance attributes, and best practices that are associated with the process.
Table 1. SCM Scorecard with Top Level Metrics
Performance Attributes
Top Level Metrics Customer-Facing Internal-Facing
Reliability Responsiveness Flexibility Cost Assets
Perfect Order Fulfillment
x
Order Fulfillment Cycle Time
x
Upside Supply Chain
Flexibility x
Upside Supply Chain
Adaptability x
Downside Supply Chain
Adaptability
x
Supply Chain Management
Cost
x
Cost of Goods Sold x
Cash-To-Cash Cycle Time
x
Return on Supply Chain Fixed Assets
x
Return on Working Capital
x

Nenad Stefanović and Dušan Stefanović
ComSIS Vol. 8, No. 1, January 2011 174
All process metrics are an aspect of a performance attribute. The performance attributes for any given process are characterized as either customer-facing (reliability, responsiveness and flexibility) or internal-facing (cost and assets) metrics. A SCM scorecard with all the top-level attributes defined by the SCM process model is provided in Table 1.
These top level metrics are the calculations by which an implementing organization can measure how successful they are in achieving their desired positioning within the competitive market space. Lower level calculations (level 2 metrics) are generally associated with a narrower subset of processes. For example, Delivery Performance is calculated as the total number of products delivered on time and in full based on a commit date. Additionally, even lower level metrics (diagnostics) are used to diagnose variations in performance against plan. For example, an organization may wish to examine the correlation between the request date and commit date.
Each process from the process model has its related metrics, best practices and inputs and outputs. All the metrics follow the same template which consists of the following elements:
Name
Definition
Hierarchical metric structure
Qualitative relationship description
Quantitative relationship (optional, if calculable)
Calculation
Data collection For example, the Table 2 contains all the data for the top level metric -
Cash-to-Cash Cycle Time. Based on the SCM process model, we have created the SCM Metamodel
[14] (Fig. 3), which enables creation of any supply chain configuration and is the basis for further modelling. The Metamodel is normalized and contains all SCM elements such as processes, metrics, best practices, inputs and outputs. It also incorporates business logic through relationships, cardinality, and constrains.
The Metamodel is extended with additional entities to support supply network modelling. That way, processes, metrics and best practices can be related to the specific node and tier in the supply network. With this Metamodel, processes at different levels can be modelled thus providing more detailed view of supply chain processes and metrics.
This method offers several advantages:
Better functionality and flexibility of the model
Metamodel contains SCM knowledge which enables domain-specific modeling.
The usage of relational database enables integrity of data and models, data importing and exporting, as well as option to use the standard language (SQL) for querying.
Security and user access control.

Supply Chain Performance Measurement System Based on Scorecards and Web Portals
ComSIS Vol. 8, No. 1, January 2011 175
It is possible to design front-end web application that can serve as the interface for collaborative supply network modeling.
Possibility to add or change both the library data (processes, metrics, best practices, etc.) and the data related to models (supply network configurations).
Table 2. Structure of the Cash-to-Cash Cycle Time metric
Metric Definition
The time it takes for an investment made to flow back into a company after it has been spent for raw materials.
Hierarchical Metric Structure
Level 1
Level 2
Qualitative Relationship Description
The longer the cash-to-cash cycle, the more current assets needed (relative to current liabilities) since it takes longer to convert inventories and receivables into cash.
Calculation
[Cash-to-Cash Cycle Time = Inventory Days of Supply + Days Sales Outstanding – Days Payable Outstanding
Level 2 Metrics: Inventory Days of Supply = the amount of inventory (stock) expressed in
days of sales. The [5 point rolling average of gross value of inventory at standard cost] / [annual cost of goods sold (COGS) / 365]
Days Sales Outstanding = the length of time from when a sale is made until cash for it is received from customers. The [5 point rolling average of gross accounts receivable (AR)] / [total gross annual sales / 365].
Days Payable Outstanding = the length of time from purchasing materials, labour and/or conversion resources until cash payments must be made expressed in days. The [5 point rolling average of gross accounts payable (AP)] / [total gross annual material purchases / 365].
Data Collection
general ledger system, accounts receivable system, accounts payable system, purchasing system, production reporting system, customer relationship management system
Cash-to-Cash Cycle Time
Days Payable
Outstanding
Inventory Days of Supply
Days Sales Outstanding

Nenad Stefanović and Dušan Stefanović
ComSIS Vol. 8, No. 1, January 2011 176
Fig. 3. SCM Metamodel
The presented supply network modeling method and the Metamodel can also be the basis for design of simulation models and scenario analysis.
3.2. PM Data Warehouse
Design of the data warehouse as one of the main components of the supply network BI system is more complex and dynamic that the standard IT projects. The main reasons are: broader business context, heterogeneous and distributed data sources, different software tools and technologies (databases, ETL, analytics, etc.), compound definition of business requirements along the supply chain, the need for specific skilled workforce, cultural and organizational barriers.
A user who wants to retrieve information directly from a data source, such as an ERP database, faces several significant challenges:
The contents of such data sources are frequently very hard to understand, being designed with systems and developers instead of users in mind.
Information of interest to the user is typically distributed among multiple heterogeneous data sources.
Whereas many data sources are oriented toward holding large quantities of transaction level detail, frequently the queries that support business decision-making involve summary, aggregated information.

Supply Chain Performance Measurement System Based on Scorecards and Web Portals
ComSIS Vol. 8, No. 1, January 2011 177
Business rules are generally not encapsulated in the data sources. Users are left to make their own interpretation of the data. In order to overcome these problems, we have constructed the Unified
Dimensional Model (UDM) (Figure 3) [15]. The role of a UDM is to provide a bridge between the user and the data sources. A UDM is constructed over one or more physical data sources. The user issues queries against the UDM using a variety of client tools.
Construction of the UDM as an additional layer over the data sources offers more clearly data model, isolation from the heterogeneous data platforms and formats, and improved performance for aggregated queries. UDM also allows business rules to be embedded in the model, as well as option to define actions in relation to query results.
Another advantage of this approach is that UDM does not require data warehouse or data mart. It is possible to construct UDM directly on top of OLTP (On-Line Transactional Processing) systems, and to combine OLTP and DW systems within a single UDM.
Fig. 3. Unified Dimensional Model
In the UDM we can define cubes, measures, dimensions, hierarchies, and other OLAP (On-Line Analytical Processing) elements, from the DW schemas or directly from the relational database. This enables providing the BI information to the business users even without previously built DW, which can be very useful having in mind facts that within the supply network there can be many nonintegrated data sources which require time to connect, integrate, and design the data warehouse.
Flexibility of UDM also manifests in the fact that tables and fields can be given names and descriptions that are understandable to the end-user and hide unnecessary system fields. These metadata is further used in throughout

Nenad Stefanović and Dušan Stefanović
ComSIS Vol. 8, No. 1, January 2011 178
the UDM, so all the measures, dimensions and hierarchies that are created based on these table fields will use these new names.
Definitions of all UDM elements are stored as XML (eXtensible Markup Language) files. Each data source, view, dimension or cube definition is stored in separate XML file. For dimensions, these files contain data about tables and fields which store dimension members. OLAP cube definition files also contain information on how the preprocessed aggregates will be managed. This metadata approach enables centralized management of the dimensional model for the entire supply network and provides option for model integration and metadata exchange.
UDM allow creation of one data source view (DSV) for use by the system. The data source view is an abstraction layer that is used to extend the objects (relational tables and views) that are exposed by the data source to a collection of objects from which OLAP server objects are created.
Within the data source view we included all of the relational views that were used to create dimensions, hierarchies, and attributes. Data source views have two important roles:
First, they are a layer of abstraction between the objects that are used by OLAP Server and the data source. This allows creation of objects such as named queries and computed columns, which could be created in the data source itself (for example, in relational views). This is important because OLAP designers might not have the rights necessary to make metadata changes in the supply chain partner’s source system.
Data source views allow you to create relationships between tables and views that are not physically located in the database or that are impossible because they are between databases.
Additionally data source views allow you to cache the metadata about the data sources so that you can develop cubes without having a connection to the source data systems.
UDM also enables the creation of hierarchies. Although the consolidation of all the attributes of an entity into a dimension greatly simplifies the model for the user, there are additional relationships between the attributes that a simple list cannot express. For example, product category, subcategory and stock keeping unit, define one of the hierarchies in which products can be organized.
The model can also provide translations of data. An attribute can map to different elements in the data source, and provide the translations for those elements in different languages, which is very beneficial in the supply chain context.
Real-world supply chain models might include tens of measures and dimensions, with each dimension including tens or hundreds of attributes. The UDM also provides special views, called perspectives. A UDM can have many perspectives, each one presenting only a specific subset of the model (measures, dimensions, attributes, and so on) that is relevant to a particular group of users.
Companies often define key performance indicators, which are important metrics used to measure the health of the business. The UDM allows such

Supply Chain Performance Measurement System Based on Scorecards and Web Portals
ComSIS Vol. 8, No. 1, January 2011 179
KPIs to be defined, enabling a much more understandable grouping and presentation of data. Key performance indicator is a collection of calculations that are associated with a measure group in a cube that are used to evaluate business success. Typically, these calculations are a combination of Multidimensional Expressions (MDX) expressions or calculated members. KPIs also have additional metadata that provides information about how client applications should display the results of the KPI's calculations.
Table 3 lists common KPI elements and their definitions.
Table 3. OLAP KPI Structure
Term Definition
Goal An MDX numeric expression that returns the target value of the KPI.
Value An MDX numeric expression that returns the actual value of the KPI.
Status An MDX expression that represents the state of the KPI at a specified point in time. The status MDX expression should return a normalized value between -1 and 1.
Trend An MDX expression that evaluates the value of the KPI over time. The trend can be any time-based criterion that makes sense in a specific business context.
Status indicator
A visual element that provides a quick indication of the status for a KPI. The display of the element is determined by the value of the status MDX expression.
Trend indicator
A visual element that provides a quick indication of the trend for a KPI. The display of the element is determined by the value of the trend MDX expression.
Display Folder
The folder in which the KPI will appear to the user when browsing the cube.
Parent KPI A reference to an existing KPI that uses the value of the child KPI as part of the KPI's computation.
Current time member
An MDX expression that returns the member that identifies the temporal context of the KPI.
Weight An MDX numeric expression that assigns a relative importance to a KPI. If the KPI is assigned to a parent KPI, the weight is used to proportionally adjust the results of the KPI value during the calculation.
The use of OLAP-based KPIs allows client tools to present related
measures in a way that is much more readily understood by the user. The Figure 4 shows an example of how three KPIs, organized into display folders, might be displayed by a client tool.

Nenad Stefanović and Dušan Stefanović
ComSIS Vol. 8, No. 1, January 2011 180
Fig. 4. OLAP KPI
4. PM Portal
As the business intelligence market continues to gain momentum, it underscores the increasing need to integrate the growing amounts of information found in disparate locations throughout the supply chain into an integrated framework.
For many organizations, this framework is the enterprise portal. With its ability to integrate the foundations of a strategic BI offering - from collaboration tools to third-party applications to exponentially growing content - enterprise portals remain at the top of the IT agenda as part of a successful PM strategy.
4.1. PM Web Portal
In order to overcome the shortcomings of the existing BI and PM client tools we have designed a specialized web portal that enables supply chain users to monitor business processes, collaborate and take actions [16].
Portal represents the single point of access to all relevant information in a personalized and secured manner. Its composite and service-oriented architecture enables inclusion of different PM components and tools (KPIs, dashboards, scorecards, reports, etc.). PM elements can be personalized and adjusted, and information can be filtered just by using a web browser. PM elements can be defined within the portal and also embedded form the external source (OLAP, another application, spreadsheets) via web services. This information is presented through different special web parts. The portal itself can be a provider (via web services or RSS-Really Simple Syndication) to other applications.
With the PM portal capabilities, supply network partners and teams can:

Supply Chain Performance Measurement System Based on Scorecards and Web Portals
ComSIS Vol. 8, No. 1, January 2011 181
Use predefined PM portal template with out of the box modules optimized for access and management of reports, data connections, spreadsheets and dashboards. Dashboard pages can contain several web parts, each of them showing information from different data sources.
Communicate strategy and monitor its execution at different levels of the supply network. KPIs status and trend can be tracked using the special KPI and scorecard web parts. KPIs can display information from different data sources (for example OLAP cubes or Excel spreadsheets).
Customize and personalize sites, pages or modules by adding or removing certain web parts and by applying filter web parts. Filters allow dashboards to be personalized by communicating shared parameters amongst web parts on a dashboard. For example, the current user filter web part automatically filters information based on who is logged on to the computer. This is useful when you want to display only information, such as customer accounts or tasks that is currently assigned to that user. Figure 5 shows the specialized SCM Scorecard for the global supply chain
performance management.
Fig. 5. Supply Chain Scorecard
Nenad Stefanović and Dušan Stefanović
ComSIS Vol. 8, No. 1, January 2011 182
It is constructed based on top of the OLAP KPIs, which are again based on the SCM process model and metrics. KPI are created by SCM segments (plan, source, make, deliver and return) as hierarchies, so it is possible to perform drill-down analysis and track performance against defined goals.
The presented solution is very flexible in terms of presenting the KPIs. Owing to several specific BI web parts, the portal can display KPIs from the OLAP server, spreadsheets, and other sources (portals, report servers, etc.).
Besides, the portal also support KPI management directly from the portal, meaning that the user can use the KPI web part template to create the new module on the certain web page and manually define KPIs, target, goals, graphic indicators, data sources, etc. This way, the end-users can define, update and track the KPIs without the help of the IT specialist.
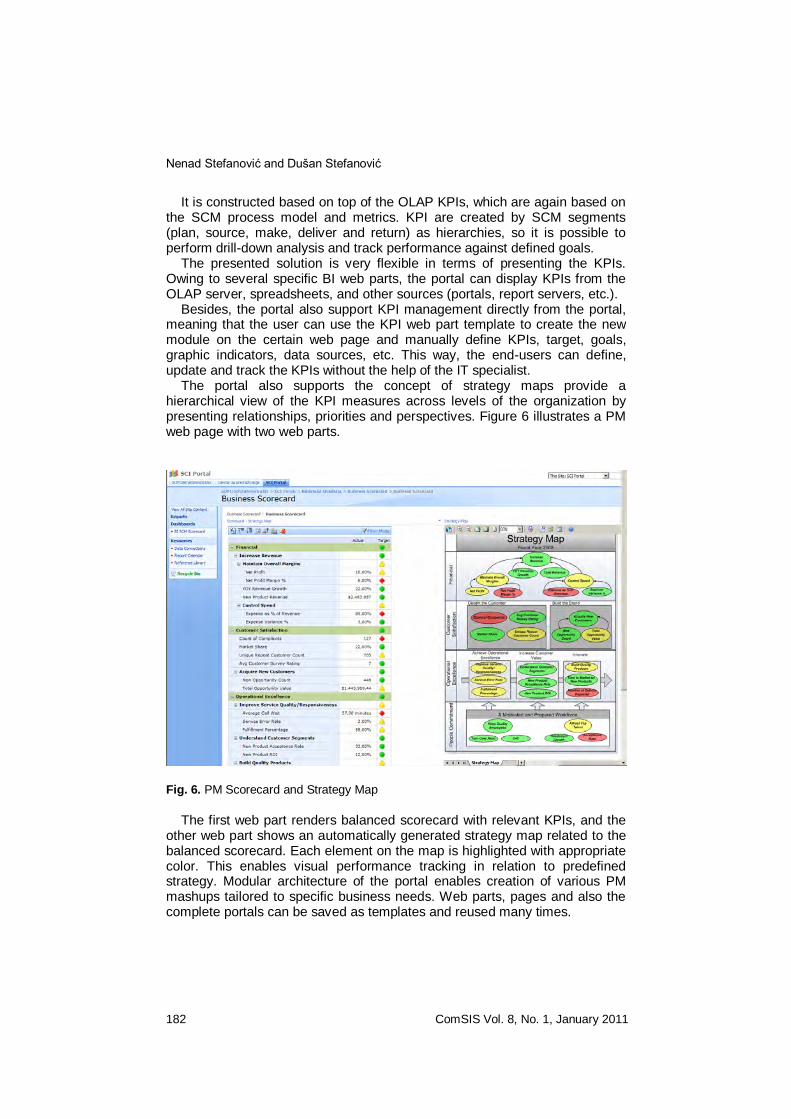
The portal also supports the concept of strategy maps provide a hierarchical view of the KPI measures across levels of the organization by presenting relationships, priorities and perspectives. Figure 6 illustrates a PM web page with two web parts.
Fig. 6. PM Scorecard and Strategy Map
The first web part renders balanced scorecard with relevant KPIs, and the other web part shows an automatically generated strategy map related to the balanced scorecard. Each element on the map is highlighted with appropriate color. This enables visual performance tracking in relation to predefined strategy. Modular architecture of the portal enables creation of various PM mashups tailored to specific business needs. Web parts, pages and also the complete portals can be saved as templates and reused many times.

Supply Chain Performance Measurement System Based on Scorecards and Web Portals
ComSIS Vol. 8, No. 1, January 2011 183
These electronic and dynamic strategy maps help explain high-level causes and effects that facilitate making choices. With strategy maps and their resultant choices of strategic objectives and the action items to attain them, managers and employees easily see the priorities and adjust their plans accordingly.
The dashboard page can display numerous metrics and views business on a single screen. Portal supports quick deployment of dashboards assembled from web parts. Each web part can contain a particular view or metric, and users can customize their individual dashboards to display the views that are most meaningful to them, such as those with the metrics they need to monitor on a daily basis.
Additionally, portal supports events and automatic alerting. Users can subscribe to specific documents or keywords and categories, to be notified when metrics are updated or new intelligence becomes available. They can also use other features, such as planning, enterprise search, subscription, and routing functions, to work with team members on a single item (i.e. scorecard, KPI, etc.), and to automate collaborative performance management processes. Portal also provides fine-grained authentication and authorization.
PM portal enables business users to define and use scorecards and key performance indicators to drive accountability and alignment across the supply chain. Scorecards and KPIs reflect planning, budgeting, and forecasting changes in real time to help users understand the business drivers, challenges, and opportunities they face. Monitoring becomes a part of the regular, day-to-day management process.
PM portal enables business users to define and use scorecards and key performance indicators to drive accountability and alignment across the supply chain. Scorecards and KPIs reflect planning, budgeting, and forecasting changes in real time to help users understand the business drivers, challenges, and opportunities they face. Monitoring becomes a part of the regular, day-to-day management process.
Visualization elements and up-to-date performance dashboards and scorecards help business users align their actions with strategic goals. All users can gain insight into business drivers and collaborate more efficiently using detailed, contextual supply chain analysis gained from structured information as well as unstructured information. Rich collaboration capabilities, strategy maps, accountability mapping, and spreadsheet integration, make business information more actionable because all users better understand the context of performance. These PM and analytical functionalities help users rapidly identify trends, opportunities, and even threats hidden within large quantities of data.
Because PM portal gives users easy-to-use functionality for setting up their own performance dashboards and scorecards, IT department is freed for more critical functions such as meeting security and compliance requirements.
Nenad Stefanović and Dušan Stefanović
ComSIS Vol. 8, No. 1, January 2011 184
4.2. Business Activity Monitoring Web Portal
Most businesses are probably not using BI to continually and automatically monitor events in their operational business processes as their businesses operate to rapidly respond to detected problems or to predict if problems lie ahead. In general, therefore, companies have no active real-time element to their BI systems. The consequences are that nothing is helping the business to automatically respond immediately when problems occur or opportunities arise. Also, there is no automatic notification or flagging of alerts to take action that may avoid unnecessary costs, business disruption, operational mistakes and unhappy customers in the future.
Business Activity Monitoring (BAM) is a collection of tools that allow you to manage aggregations, alerts, and profiles to monitor relevant business metrics (Key Performance Indicators - KPIs). It gives users end-to-end visibility into business processes, providing accurate information about the status and results of various operations, processes, and transactions so they can address problem areas and resolve issues within your business. BAM software products incorporate concepts from — and sometimes are built on — ERP, business intelligence, business process management and enterprise application integration (EAI) software.
We propose the specialized BAM model and architecture based on the data warehouse technology, messaging, business process orchestration and web portals. The Figure 7 shows BAM architecture and how data and messages flow within the BAM system [17].
BAM gives a different perspective on a business process. For example, a BAM system might provide graphical depictions of per-product sales trends or current inventory levels or other key performance indicators. The information might be updated every day, every hour, or more frequently.
There are two important BAM components that we should examine first: activities and views.
BAM relies on one or more BAM activities. A BAM activity refers to the encapsulation and representation of an end-to-end process. An activity could be a single process or a collection of many orchestrations or applications.
Within the activity definition, you generally find two entities:
Milestones represent how long it takes to process something.
Data of interest is made up of individual data points that we want to monitor (price, stock level, and so on). By assembling the milestones and/or the data of interest, we create a BAM
activity. A BAM view is a tailored representation of the data involved similar to the
database views. By implementing BAM views, we can disseminate our processes in a manner that is appropriate for the end user. For instance, we may have payroll logic for the accounting department that shelters the actual individual pay rates but presents the final cost of labor for a particular department.

Supply Chain Performance Measurement System Based on Scorecards and Web Portals
ComSIS Vol. 8, No. 1, January 2011 185
Fig. 7. BAM Architecture
The need for automation and interaction of business processes necessitate the use of modern technologies for managing business process, trading partner relationships and monitoring and analyzing in real-time. For these purposes we have designed two specialized web portals - Business Activity Services (BAS) and Business Activities Monitoring (BAM) portal.
Nenad Stefanović and Dušan Stefanović
ComSIS Vol. 8, No. 1, January 2011 186
Business Activity Services
Business Activity Services (BAS) provides an interaction and collaboration self-service portal Web site for information workers. BAS enables you to easily configure and interact with business processes and collaborate with trading partners.
BAS provides the infrastructure to capture business user input into a business process easily. Then based on the human input, the business process (defined and automated as BPMS-Business Process Management System orchestration) can continue with the subsequent steps in the pre-defined workflow.
BAS web portal architecture consists of the following modules:
Business User Portal - The self-service Web site that enables business users to interact with partners and business processes through familiar metaphors such as Mailboxes. The business process delivers message documents into the mailboxes where the business user can manage them. A business user can respond to a business process, by saving the document in the Outbox. Then the message is picked by the business process as a response to the previous Inbox message.
Trading Partner Management (TPM) - A set of interactive tools and forms that enable the business user to manage online interactions with trading partners. These include the following: creating and maintaining the partner profiles and the agreements, tracking the daily interactions with them such as the exchange of purchase orders, invoices, payments, and others, and monitoring the status and the statistics regarding the interactions and the documents.
Business Process Configuration - This primarily includes the design and programming of the Orchestrations and TPM elements on the BAS site in such a way that the business users can interact with them. Orchestrations are complex technical workflow schedules. Developers typically create orchestrations. The developer first defines parameter constructs in the orchestration and in TPM. This configuration enables BAS to combine the collaboration portal with the friendly InfoPath forms, with the power of the BPMS Workflow and Messaging engines, creating an effective self-service solution for the business users. Business users can then set the values for these parameters as needed, for different business partners or for different parts of the organization.
Business User Interaction and Collaboration - This is the ultimate business goal of BAS. As soon as the orchestrations and TPM elements go through the configuration process by using the key parameters, the business users can use the end-to-end infrastructure to perform the daily interactions with the trading partners. Business users set the values of the pre-defined parameters that enable them to control and adjust the behavior of the business process orchestrations. The following are the brief descriptions of the key concepts in BAS:
Trading Partner - An external or internal organization with which your organization exchanges electronic documents and data to perform

Supply Chain Performance Measurement System Based on Scorecards and Web Portals
ComSIS Vol. 8, No. 1, January 2011 187
business operations and transactions. For example, a trading partner could be a supplier, a customer, or an internal department.
Partner Profile - The basic business information about the partner such as the company name and related contact details. A profile is conceptually similar to a business card. BAS takes advantage of InfoPath forms and templates to manage partner profiles effectively. Figure 8 shows web page for Partner Profiles.
Self Profile - The self profile contains information about your own company in a way such that when a document sends to a partner you can use the information to identify your company's details to the partner.
Fig. 8. BAS Portal
Agreement - The key concept in BAS for defining the relationship with a trading partner. Agreement organizes the definition of business terms in an intuitive manner so that business users can change it with ease. Then the business parameters defined in an agreement translate into the technical elements that drive the business process orchestrations in BPMS.
Addendum - Addendum is a segment in an agreement that defines the orchestration, policies and parameters involved in the trading relationship.
Inbox - A document library that BAS uses for receiving messages and documents from a running business process (BPMS Orchestration). This is conceptually analogous to the Inbox used in a typical e-mail system.

Nenad Stefanović and Dušan Stefanović
ComSIS Vol. 8, No. 1, January 2011 188
Outbox - A document library that BAS uses for sending messages and documents to a running business process (BPMS Orchestration). This is conceptually analogous to the Outbox used in a typical e-mail system.
Sent Items - A document library that BAS uses for archiving messages and sent documents. The Sent Items folder serves as the storing mechanism for tracking the sent business documents for future reference and auditing needs.
Business Activity Monitoring
One of the newest technology trends is toward the integration of BAM systems with web portals. Business end users can use the BAM portals to monitor KPIs, which measure progress toward a business goal, as well as other information about their business process. Information workers use BAM portal to gain a real-time holistic view of business processes that span heterogeneous applications, regardless of the infrastructure implementation.
There are two ways information workers can use BAM to view business processes: using the spreadsheet application and through BAM web portal.
Each view gives a different perspective on a business process. For example, a BAM view might provide graphical depictions of per-product sales trends or current inventory levels or other key performance indicators. The information in these views might be updated every day, every hour, or more frequently.
Each BAM view relies on one or more BAM activities. A BAM activity represents a specific business process, such as handling purchase orders or shipping a product, and each one has a defined set of milestones and business data. For example, a purchase order activity might have milestones such as Approved, Denied, and Delivered along with business data like Customer Name and Product.
The following list describes how other ways information workers can use BAM features [18]:
View a single activity instance such as a purchase order or loan (process) in real-time or as historical data.
This view shows only the data relevant to the business process the knowledge worker is concerned with and hides complexity of the heterogeneous implementation.
Search for activity instances based on their progress or business data (Figure 9). For example, we can search for loans that are waiting for customer signature and the dollar amount is greater than a given value.
Browse aggregations (which are key performance indicators) around all the business activities that are currently being processed or have already happened. The aggregations can be done in real-time or can be based on a snapshot of the activities taken at specific time.
Navigate to the related activity instances such as shipments associated with given purchase order, or the Invoice in which it is included.

Supply Chain Performance Measurement System Based on Scorecards and Web Portals
ComSIS Vol. 8, No. 1, January 2011 189
Fig. 9. BAM search interface
Additionally, it is possible to create different activity-related alerts. Alerts allow us to define important events about business processes, such as Key Performance Indicators, that can be delivered to users on a real-time basis. Users subscribe to alerts to receive notification of the business event that the alert monitors.
There are two types of alerts, aggregate and instance. An aggregate alert allows users to specify threshold data across a time frame whereas an instance alert is based on specific qualifying data points.
Alerts are delivered in one of two methods, through an e-mail message to the subscribers or as a file written to a system-specified location (e.g. network file share or web folder).
The key benefit of the presented BAM environment is that operational processes can be monitored and exceptions acted on in close to real time. Other benefits include better supply chain visibility, operational productivity, risk avoidance and business continuity.
Some of the supply chain processes that are the best candidates for the BAM are: order management, product recalls, quality control and monitoring,

Nenad Stefanović and Dušan Stefanović
ComSIS Vol. 8, No. 1, January 2011 190
sales forecasting and pipeline monitoring, just-in-time inventory monitoring and parts receivable, real-time inventory analysis, real-time marketing and promotions, transportation tracking, and product recalls.
For example, in an order management process, we can define KPIs for how many orders are received, their money amounts, and whether they are processed successfully. It is also possible to define KPIs that compare order volumes by channel, customer type, or other categorizations.
Another good example of the BAM use case is one related to the supplier delivery. It is possible to specify that if the activity confirming the receipt of the order is not finished by five days after the order has been initiated, then the order will most likely be late. In that case, the user should be notified via some graphical indicators (typically a red bar to indicate that a threshold has been exceeded). Additionally, the BAM solution can be configured to notify the user via email, desktop message or even SMS, so that he can then notify the affected parties or consider an alternative solution. Afterward, he can drill down to the individual activity to get additional details on why the order was late (lack of resources, for example).
5. Conclusion
Supply chain performance measurement is vital for a company in order to survive in today’s competitive business environment. Supply chain performance measurement should be a business-critical process, driven by metrics and supported by business intelligence. With increasing competition and changing market forces, tapping into this critical asset is essential in sustaining competitive advantage in the global space.
PM model presented in this paper fuses all relevant elements such as people, business processes, metrics, KPIs and tools into a single comprehensive system. The underlying architecture supports the complete cycle of BI/PM processes like ETL, DW, OLAP and reporting.
The unified data model helps to establish a single version of the truth on supply chain performance, which is quantifiable and understood by all entities in the supply chain.
Specialized PM web portal offers the following benefits:
Real-time supply chain monitoring and alerting.
Flexibility, personalization and customization.
Integration with existing transactional, BI and collaboration systems
Built-in knowledge and best practices through predefined web parts and templates. The presented BAM portal provides a rich view into data collected via BAS
system and enables activity data to be searched and viewed in a variety of ways. Because the BAM data is held in database tables and views, it’s easy to access the information from a variety of tools, including different reporting tools, which can produce a highly detailed tracking portal providing very rich business intelligence.

Supply Chain Performance Measurement System Based on Scorecards and Web Portals
ComSIS Vol. 8, No. 1, January 2011 191
With PM and BAM systems in place, all parties in a supply chain network can track the real-time flow of goods, money, and information across the network. They can also answer customer questions on the state of the process, no matter who is handling the process at a given point in time.
References
1. Parker, B.: EPM: From Concept to Implementation, AMR Research's Spring Executive Conference: Creating the Real-Time Enterprise, May 29-31. (2002)
2. Mittlender, D.: Pervasive Business Intelligence: Enhancing Key Performance Indicators, DM Review. (August 2005)
3. Vriens, D.: Information and Communications Technology for Competitive Intelligence, Idea Group Publishing. (2004)
4. Bello, D. C., Gilliland, D. I.: The Effects of Output Controls, Process Controls, and Flexibility on Export Channel Performance, Journal of Marketing 61 p. 22 (Winter 1997); and Stank, T. P., Lackey Jr., C. W.: Enhancing Performance Through Logistical Capabilities in Mexican Maquiladora Firms, Journal of Business Logistics Vol. 18, No. 1, 91–123. (1997)
5. Foster, T. A.: It Pays to Measure Performance: Logistics Performance Compensation Programs, Chilton's Distribution 90. (September 1991)
6. Lee, H. L., Billington, C.: Managing Supply chain Inventory: Pitfalls and Opportunities, Sloan Management Review, Vol. 33, No. 3, 65–73. (1992)
7. Lappide, L.: What About Measuring Supply Chain Performance, ASCET, Vol. 3, Montgomery Research. (2002)
8. Gintic.: Measuring supply chain performance using a SCOR-based approach, March. (2002)
9. Kaplan, R. and Norton, D.: The Balanced Scorecard, Harvard Business School Press, Boston. (1996)
10. Hammer, M.: The Agenda, Chapter 6: Measure Like You Mean It, Crown Business, New York. (2001)
11. Kaplan, R., Norton, D.: Strategy-Focused Organization How Balanced Scorecard Companies Thrive in the New Business Environment, Boston, MA : Harvard Business School Press. (2006)
12. Leahy, T.: The Balanced Scorecard Meets BPM. Business Finance, Vol. 33. (June 2003)
13. Stefanovic, D., Majstorovic, V., Stefanovic, N.: Methodology for Process Integration in Supply Networks, 38th CIRP Manufacturing Systems Seminar, Brazil, May 16-18. (2005)
14. Stefanovic, D. and Stefanovic, N.: Methodology for Modeling and Analysis of Supply Networks, Journal of Intelligent Manufacturing, Springer, Vol. 19, No. 4, 485-503. (2008)
15. Stefanovic, N., Radenkovic, B., Stefanovic, D.: Designing OLAP Multidimensional Systems For Supply Chain Management, International Journal of Pure and Applied Mathematics, IJPAM, ISSN 1311-8080. (2007).
16. Stefanovic, N., Radenkovic, B., Stefanovic, D.: Supply chain intelligence, In: D.T. Pham, D.T., Eldukhri, E.E., Soroka, A.J. (eds.): Intelligent Production Machines and Systems, Whittles Publishing, Whittles Publishing, 292-297. (2008)
17. Stefanovic, N., Stefanovic, D., Misic, M.: Application of Business Intelligence for Business Process Management. In: Bramer, M. (ed.): Artificial Intelligence in

Nenad Stefanović and Dušan Stefanović
ComSIS Vol. 8, No. 1, January 2011 192
Theory and Practice II, IFIP State of the Art Series, Vol. 276. Springer Boston, 445–449. (2008)
18. Stefanovic, N. and Stefanovic, D.: Methodology for BPM in Supply Networks. 5th CIRP International Seminar on Intelligent Computation in Manufacturing Engineering, Ischia, Italy, July 25-28. (2006)
Nenad Stefanović completed his BSc in Mechanical Engineering with the University of Kragujevac, where he also got his MSc in Information Systems. He received his PhD in Electronic Business from the Faculty of science, University of Belgrade. Nenad works as an ICT Operation & Architectures Manager at the Fiat Automobiles Serbia. He is also an assistant professor at the Faculty of Science, Department of Mathematics and Informatics, University of Kragujevac. His research interests include business intelligence, supply chain management, management information systems, and web portals. Nenad is a member of several national and international ICT and business related societies and research projects. He has published more than 60 research papers, book chapters and invited lectures, and published in national and international journals, conference proceedings and books.
Dušan Stefanović is a professor of computer science at the Faculty of Science, University of Kragujevac, Serbia. His main research interests include supply chain management, business process simulation, databases and information systems development. Dusan has published more than 80 research papers and authored/coauthored several books. He designed and developed a number of enterprise information systems and participated in many national and international research projects.
Received: June 08, 2009; Accepted: February 19, 2010.