supply chain strategy and performance measures 1 chapter 2
TRANSCRIPT
Supply Chain Strategy and Performance Measures
1
Chapter 2
Content…….
Customer service and cost trade offsSupply chain performance measuresLinking supply chain and business
performanceEnhancing supply chain performance
Cost Versus Service
A firm must ensure a smooth fit between its business strategy and supply chain strategy
Business strategy: the firm decides the market segment in which it wants to operate and the level of customer services it wants to offer
Supply chain strategy: issues of costs that the firm has to incur to provide the targeted level of customer service

Supply Chain Performance Measures
Cost
of
serv
ice
Service LevelLow High

Cost
Service LevelLow High
Existing Position
Managing Supply Chains Efficiently
.
Inefficient Practices
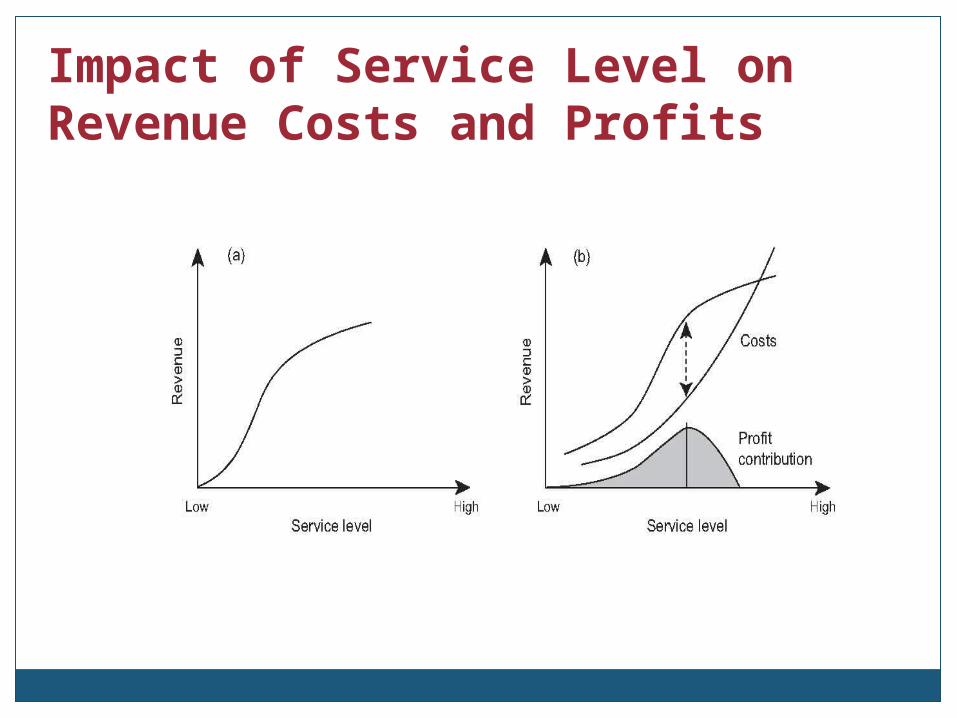
Impact of Service Level on Revenue Costs and Profits
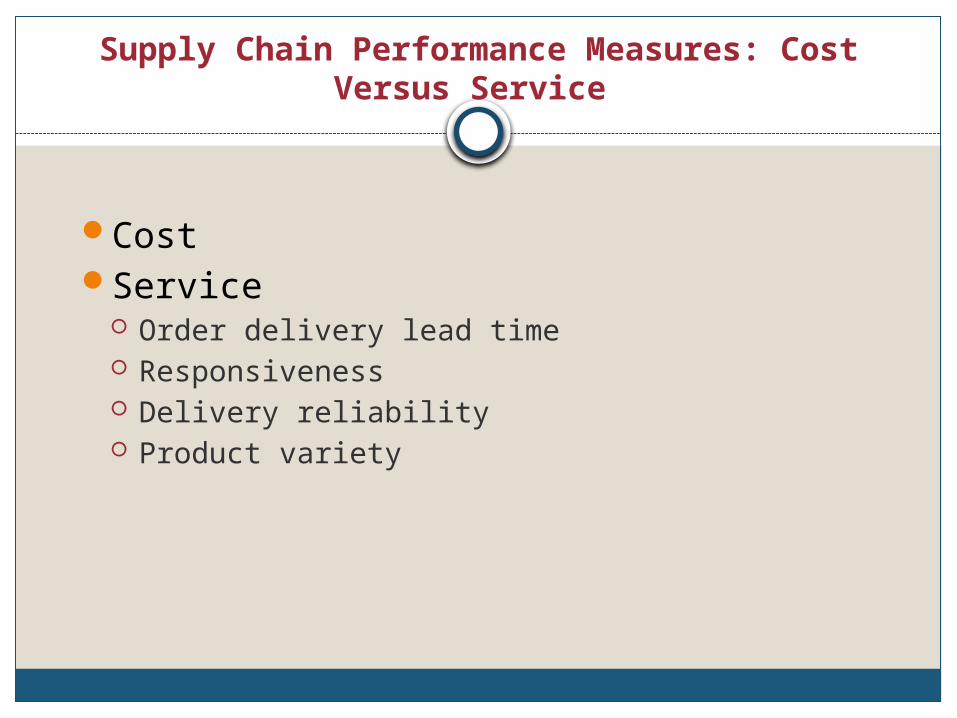
Supply Chain Performance Measures: Cost Versus Service
CostService
Order delivery lead time Responsiveness Delivery reliability Product variety

Order delivery lead time
It is the time taken by the supply chain to complete all the activities from order to delivery
Supply chain lead time
Order penetration point/decoupling point
Customer order
Order delivery lead time

Supply Chain Typology
Order Penetration Point/ Decoupling Point Make to Stock Make to Order Configure to Order
Supply Chain Focus Efficiency Responsiveness

Supply Chain Typology: Order Penetration Point/ Decoupling Point

Push-Pull Boundary of Supply Chains

Supply Chains responsiveness
Responsiveness captures the firm’s ability to handle the uncertainty of market demand
Functional products are those that satisfy the basic needs of a customer and therefore have low variety, stable and predictable demand, long life cycles and low profit margins
Innovative products are those that try to satisfy a broad rand of customers’ wants and have the high variety, unstable, very hard to predict demand, short life cycles, high profit margins and frequent stock outs and markdowns
Physical function is the process of converting materials into parts, then to finished products and then transporting them across the various stages of the chain
Market mediation function ensures that the variety of products reaching the market matches the needs of the customers

Aspects of demand Functional (predictable Demand)
Innovative (Unpredictable Demand)
Product Life cycle More than 2 years 3 months to 1 year
Contribution margin ( % of sales price)
5% to 20% 20% to 60%
Product variety Low ( 10 to 20 variants per category)
High ( often thousands of variants per category)
Likely forecast error 5% to 20% 40% to 100%
Average stock-out rate 1% to 2% 10% to 40%
End-of-season mark markdown
0% 10% to 30%
Functional Versus Innovative Products: Differences in Demand
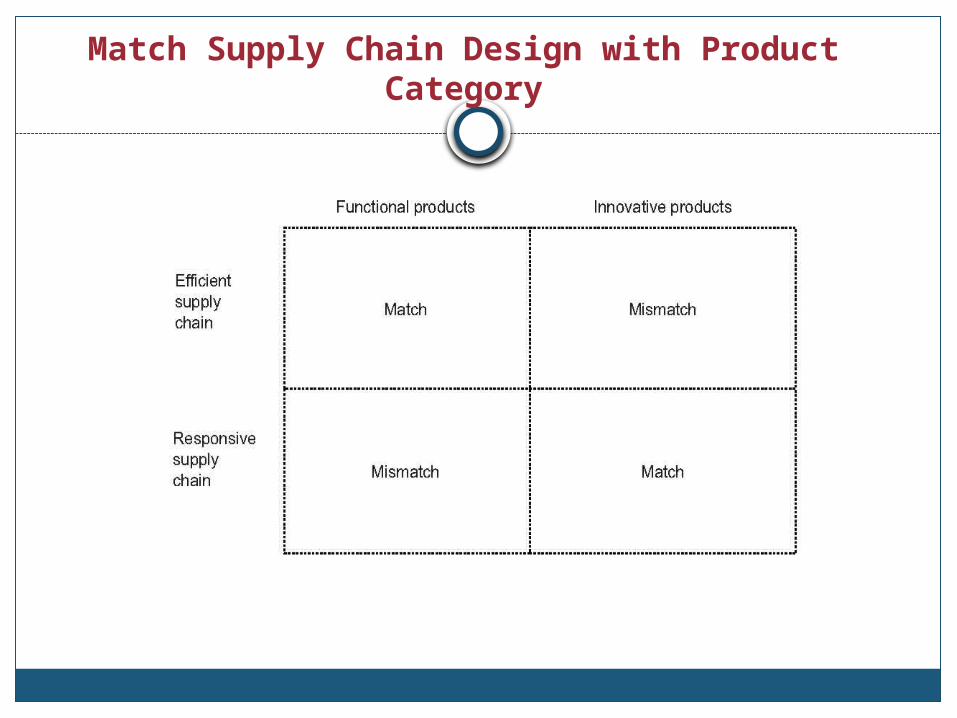
Match Supply Chain Design with Product Category
Delivery reliability
It is the degree to which a firm is able to service its customers within the promised delivery time
Product varietyThe quantum of variety offered by a firm Variety explosion
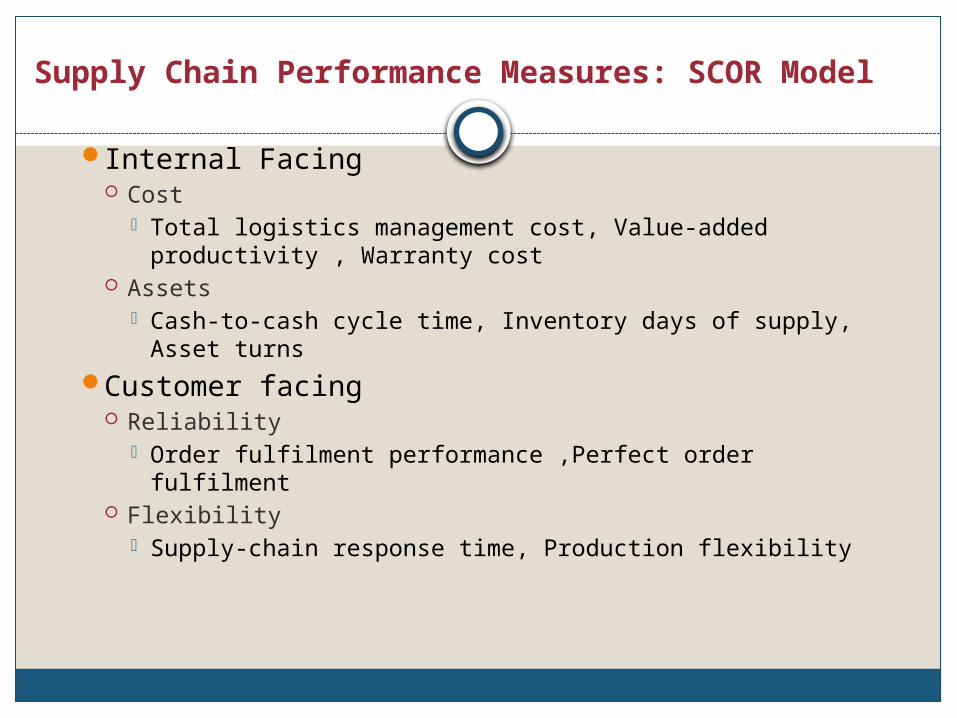
Supply Chain Performance Measures: SCOR Model
Internal Facing Cost
Total logistics management cost, Value-added productivity , Warranty cost
Assets Cash-to-cash cycle time, Inventory days of supply,
Asset turnsCustomer facing
Reliability Order fulfilment performance ,Perfect order fulfilment
Flexibility Supply-chain response time, Production flexibility
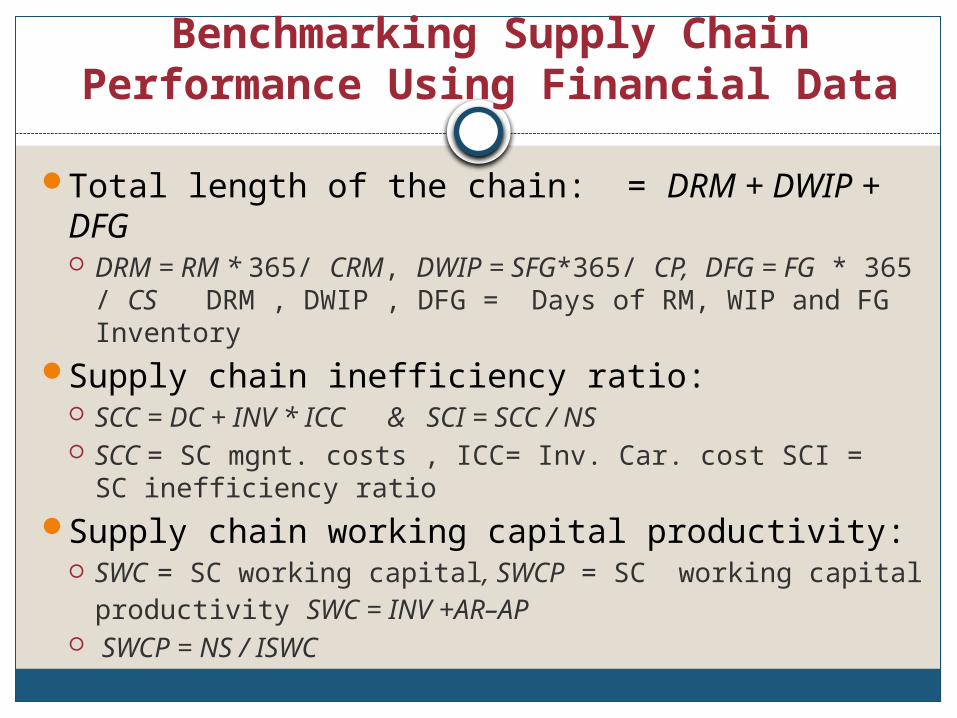
Benchmarking Supply Chain Performance Using Financial Data
Total length of the chain: = DRM + DWIP + DFG DRM = RM * 365/ CRM, DWIP = SFG*365/ CP, DFG =
FG * 365 / CS DRM , DWIP , DFG = Days of RM, WIP and FG Inventory
Supply chain inefficiency ratio: SCC = DC + INV * ICC & SCI = SCC / NS SCC = SC mgnt. costs , ICC= Inv. Car. cost SCI = SC
inefficiency ratioSupply chain working capital productivity:
SWC = SC working capital, SWCP = SC working capital productivity SWC = INV +AR–AP
SWCP = NS / ISWC

The Strategic Profit Model
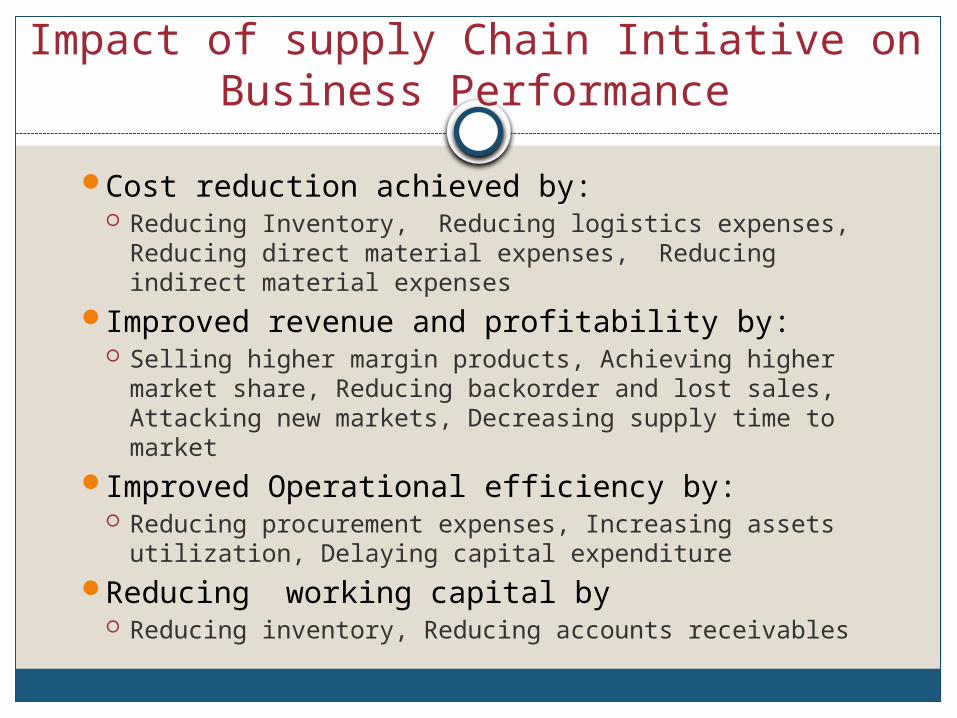
Impact of supply Chain Intiative on Business Performance
Cost reduction achieved by: Reducing Inventory, Reducing logistics expenses,
Reducing direct material expenses, Reducing indirect material expenses
Improved revenue and profitability by: Selling higher margin products, Achieving higher
market share, Reducing backorder and lost sales, Attacking new markets, Decreasing supply time to market
Improved Operational efficiency by: Reducing procurement expenses, Increasing assets
utilization, Delaying capital expenditureReducing working capital by
Reducing inventory, Reducing accounts receivables
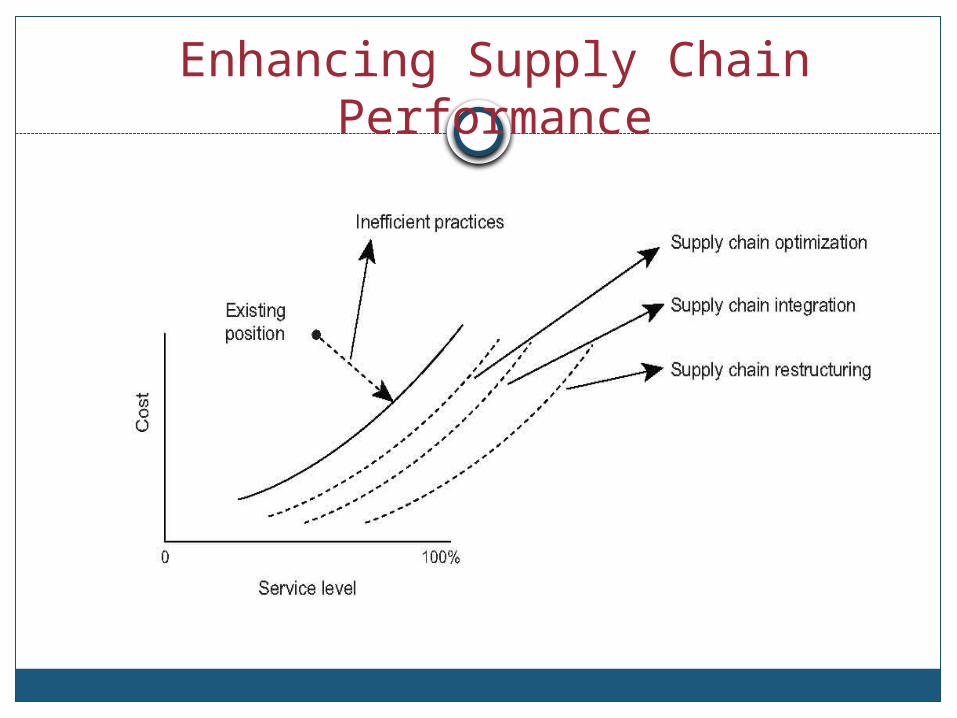
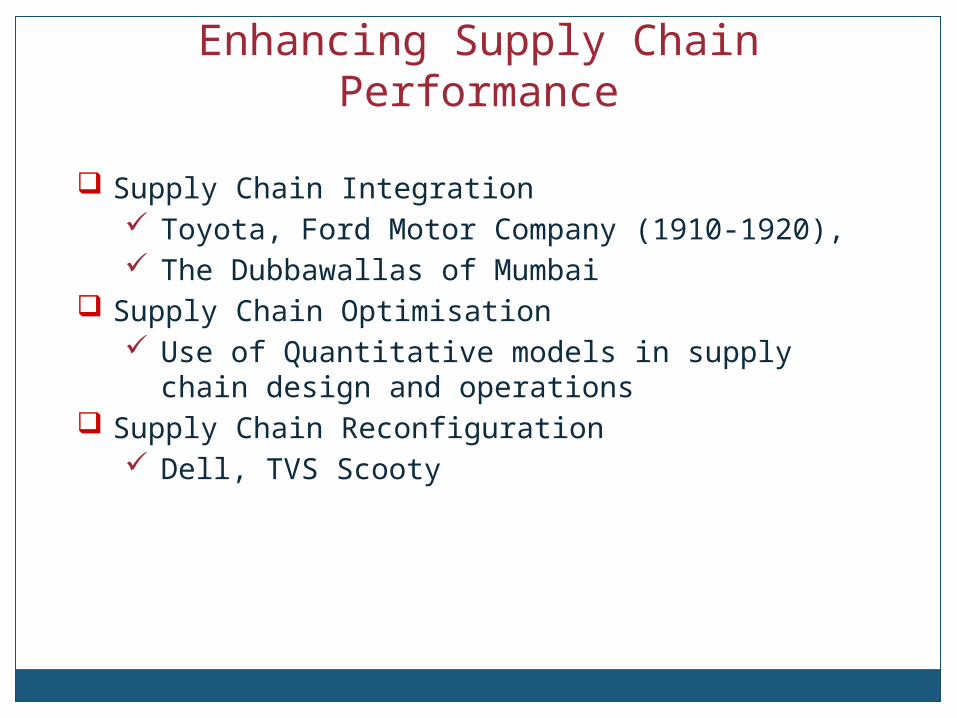
Enhancing Supply Chain Performance
Enhancing Supply Chain Performance
Supply Chain Integration Toyota, Ford Motor Company (1910-1920), The Dubbawallas of Mumbai
Supply Chain Optimisation Use of Quantitative models in supply chain
design and operations Supply Chain Reconfiguration
Dell, TVS Scooty