supply-demand forecast for electric utilities 2011-2020 · supply-demand forecast for electric ......
TRANSCRIPT

Supply-Demand Forecast For Electric Utilities
2011-2020
Report to the West Virginia Legislature West Virginia Code §24-1-1(d)(3)
201 Brooks Street Charleston, WV 25323
1-800-344-5113 General 1-800-642-8544 Complaints
www.psc.state.wv.us
Michael A. Albert, Chairman Jon W. McKinney, Commissioner Ryan B. Palmer, Commissioner

Supply – Demand Forecast for Electric Utilities 2011 – 2020
Table of Contents
Executive Summary ..................................................................................................... 1 Forecast Procedure ...................................................................................................... 5 Regional Projections .................................................................................................... 6
Reliability First Corporation .................................................................................... 8 American Electric Power Company ........................................................................ 11 Appalachian Power Company ............................................................................... 11
Wheeling Power Company ................................................................................... 12 AEP Forecasting .................................................................................................... 12 American Electric Power East ............................................................................... 13
Projected Summer Peak Demand ............................................................... 13 APCO Projected Winter Peak Demand ...................................................... 14 Reserve Margins .................................................................................................... 14 Capacity Planning ....................................................................................... 14 APCO Reserve Margin ............................................................................... 15 AEP Capacity Plan ...................................................................................... 15 AEP System (East Zone) Reserve Margin Projections ............................... 17 Potential Threats to Reliability for AEP ............................................................... 17 Restructuring of the Electric Industry ......................................................... 17 Environmental Issues ................................................................................. 18 Aging Generation Units .............................................................................. 23 Loss of Interruptible Load .......................................................................... 23 Lack of Participation in Load Modification Programs ............................... 24 Transmission Issues ..................................................................................... 24 Conclusion ............................................................................................................. 25 Allegheny Power ........................................................................................................ 33 MPCO and PECO .................................................................................................. 33 Monongahela Power Company .............................................................................. 33 Potomac Edison Company .................................................................................... 34 AP Forecasting ....................................................................................................... 34 AP Projected Winter Peak Demand ............................................................ 35 MPCO Projected Winter Peak Demand ...................................................... 36

Table of Contents - Continued PECO Projected Winter Peak Demand ....................................................... 36 Reserve Margins Planning and Projections .......................................................... 37 Capacity Planning ....................................................................................... 37 Allegheny Power Planning Philosophy ...................................................... 37 Projected Supply Side Resources for AP ..................................................... 38 Projected Demand Side Resources for AP ................................................. 38 AP Reserve Margin Projections ................................................................... 40 Potential Threats to Reliability for AP ................................................................... 40 Restructuring of the Electric Industry ......................................................... 40 Environmental Issues .................................................................................. 40 Global Climate Change ............................................................................... 41 Clean Air Act Compliance .......................................................................... 43 Clean Air Act Litigation ............................................................................. 44 Canadian Toxic-Tort Class Action ............................................................. 46 Global Warming Class Action .................................................................... 46 Claims Related to Alleged Asbestos Exposure........................................... 47 Aging Generation Units .............................................................................. 47 Conclusion ............................................................................................................. 48 Appendixes ................................................................................................................. 52 Appendix A: List of Maps, Tables and Charts ...................................................... 52 Appendix B: Existing Plants and Summaries of Interchanges .............................. 53
Executive Summary
The Sixty-Fourth Legislature (1979) directed the Public Service Commission of West Virginia (Commission) to make an annual report to the Legislature on the status of the supply and demand balance for the next ten years for the electric utilities in West Virginia (WVA Code 24-1-1(d)(3)). Pursuant to this mandate, the Commission Staff conducts a yearly examination of major forecasting methodologies presently in use by each of the major electric utilities in West Virginia.
The four largest regulated electric utilities in West Virginia are: Appalachian
Power Company, Monongahela Power Company, The Potomac Edison Company, and Wheeling Power Company. Appalachian Power Company and Wheeling Power Company are sister companies in American Electric Power. Monongahela Power Company and the Potomac Edison Company are sister companies in Allegheny Power. Appalachian Power Company and Monongahela Power Company are the State’s only regulated electric power generators. The large utilities account for approximately 96% of total West Virginia residential sales and 98% of total West Virginia commercial and industrial sales.
Currently, there are eight (8) electric utilities purchasing power at wholesale prices
that distribute purchased power to local residential, commercial and industrial customers at retail market rates approved by the Commission. Those companies reselling power are:
1. Wheeling Power Company (WPCO)
2. Harrison Rural Electrification Association
3. Black Diamond Power Company
4. Shenandoah Valley Electric Cooperative
5. Craig-Botetourt Electric Cooperative
6. New Martinsville Municipal Utilities
7. Philippi Municipal Electric
8. The Potomac Edison Company
____________________________________________________________________________________ Public Service Commission – Supply-Demand Forecast for Electric Utilities 2011 - 2020 ‾‾‾‾‾‾‾‾‾‾‾‾‾‾‾‾‾‾‾‾‾‾‾‾‾‾‾‾‾‾‾‾‾‾‾‾‾‾‾‾‾‾‾‾‾‾‾‾‾‾‾‾‾‾‾‾‾‾‾‾‾‾‾‾‾‾‾‾‾‾‾‾‾‾‾‾‾‾‾‾‾‾‾‾‾‾‾‾‾‾‾‾‾‾‾‾‾‾‾‾‾‾‾‾‾‾‾‾‾‾‾‾‾‾‾‾‾‾‾‾‾‾‾‾‾‾
____________________________________________________________________________________ Page 1 ‾‾‾‾‾‾‾‾‾‾‾‾‾‾‾‾‾‾‾‾‾‾‾‾‾‾‾‾‾‾‾‾‾‾‾‾‾‾‾‾‾‾‾‾‾‾‾‾‾‾‾‾‾‾‾‾‾‾‾‾‾‾‾‾‾‾‾‾‾‾‾‾‾‾‾‾‾‾‾‾‾‾‾‾‾‾‾‾‾‾‾‾‾‾‾‾‾‾‾‾‾‾‾‾‾‾‾‾‾‾‾‾‾‾‾‾‾‾‾‾‾‾‾‾‾‾

Each of these companies (reseller) purchase power from larger regulated utility generators then resell purchased power to residential and commercial customers in their service territories at approved retail rates. The net demand of each reselling company is reflected in the demand projection of their wholesale power provider.
In addition to the major utilities’ supply and demand forecasts, the Commission
Staff also considers the regional utility forecasts conducted by Reliability First Corporation. Reliability First Corporation is a member of the North American Electric Reliability Corporation (NERC). One of NERC’s many responsibilities is assessing future adequacy of North America’s transmission grid and energy supply.1 RFC assesses “future adequacy” of its region including the Pennsylvania, New Jersey, and Maryland Regional Transmission Organization (PJM-RTO or RTO) in which Allegheny Power and American Electric Power are members.2 The role of any RTO is controlling each regional utility generator’s output (regional supply) such that it meets residential, commercial and industrial customer instantaneous power requirements (regional demand). If a sudden loss of one or more generators and/or transmission lines should occur, PJM relies on a “reserve generating capacity margin” (reserve capacity) of approximately sixteen (16) percent.
The Commission’s annual electric utility supply and demand report consists of ten
(10) year load growth forecast and customer demand data furnished by American Electric Power, Allegheny Power and the Reliability First Corporation.3 American Electric Power and Allegheny Power furnish additional information in the form of a capacity (supply) expansion plan also known as integrated resource planning (IRP). An IRP enables each utility to project future equipment upgrades, additional generating units and/or purchased generation needed to meet the State’s increasing customer demand for the next ten years. The Commission’s staff (Staff) reviews the information to determine whether the State’s peak load electric supply is equal to the State’s peak customer demand plus an additional sixteen (16) percent reserve capacity for reliable operation should one or more sudden losses of power occur for the next ten (10) years.
1 NERC develops and enforces reliability standards; monitors the bulk power system; assesses future adequacy; audits owners, operators, and users for preparedness; and educates and trains industry personnel. NERC is a self-regulatory organization that relies on the diverse and collective expertise of industry participants. As the Electric Reliability Organization, NERC is subject to audit by the U.S. Federal Energy Regulatory Commission and governmental authorities in Canada.” See the NERC website at www.nerc.com. 2 Please refer to the NERC Regional Reliability Councils map shown on page 16. 3 American Electric Power and Allegheny Power supply data for the State’s project load growth and customer demand. Reliability First Corporation (RFC) projects load growth and customer demand for the region including West Virginia and surrounding states. RFC’s regional forecast is the only regional forecast considered in the report.
____________________________________________________________________________________ Public Service Commission – Supply-Demand Forecast for Electric Utilities 2011 - 2020 ‾‾‾‾‾‾‾‾‾‾‾‾‾‾‾‾‾‾‾‾‾‾‾‾‾‾‾‾‾‾‾‾‾‾‾‾‾‾‾‾‾‾‾‾‾‾‾‾‾‾‾‾‾‾‾‾‾‾‾‾‾‾‾‾‾‾‾‾‾‾‾‾‾‾‾‾‾‾‾‾‾‾‾‾‾‾‾‾‾‾‾‾‾‾‾‾‾‾‾‾‾‾‾‾‾‾‾‾‾‾‾‾‾‾‾‾‾‾‾‾‾‾‾‾‾‾
____________________________________________________________________________________ Page 2 ‾‾‾‾‾‾‾‾‾‾‾‾‾‾‾‾‾‾‾‾‾‾‾‾‾‾‾‾‾‾‾‾‾‾‾‾‾‾‾‾‾‾‾‾‾‾‾‾‾‾‾‾‾‾‾‾‾‾‾‾‾‾‾‾‾‾‾‾‾‾‾‾‾‾‾‾‾‾‾‾‾‾‾‾‾‾‾‾‾‾‾‾‾‾‾‾‾‾‾‾‾‾‾‾‾‾‾‾‾‾‾‾‾‾‾‾‾‾‾‾‾‾‾‾‾‾

For the forecast period of winter 2010/2011 through the winter of 2019/2020, Staff concludes the following:
1. West Virginia’s expected peak electric demand could average 1.4% to 2.2%.
Generation capacity will be greater than customer demand;
2. Capacity plans based on current demand projections indicate the State’s electric supply in addition to reserve capacity will exceed customer demand;
3. Projected peak electric demand will continue to increase at a modest rate; 4. Average annual peak load growth for each utility is:
Utility American Electric Power 0.1% Appalachian Power Company 0.2% Allegheny Power 1.5% Monongahela Power 1.7% The Potomac Edison Company 2.2% Wheeling Power 1.5%
5. American Electric Power developed a generation expansion plan consisting of new
generation sources added within the forecast period. Additional new generation resources up to 1,469 MW may be possible for 2011 through 2020. Current projections indicate American Electric Power’s expansion plan will assist in maintaining PJM’s reserve capacity margin;
6. Allegheny Power’s IRP for 2007 indicated Allegheny Power’s generation fleet
configuration for West Virginia following the implementation of the ownership restructuring which was approved by the Commission in its April 7, 2006 Order in Case Nos. 00-0801-E-PC, 00-1246-E-PC, 00-1616-E-PC, and 03-0695-E-PC (Allegheny Power Ownership Restructuring Order). The ownership restructuring, which among other things, enabled AEP to utilize securitized financing to fund the construction of a planned flue gas desulphurization retrofit project at the Ft. Martin generating station, was completed by Allegheny Power effective January 1, 2007. The need for utility-owned capacity is likely unnecessary for 2008 through 2017. Allegheny Power’s capacity purchases continue to increase substantially during the forecast period. This is due to the anticipated reliance on the deregulated power market to maintain sufficient Reserve Margins as well as being a participating member of the Regional Transmission Organization. Continued
____________________________________________________________________________________ Public Service Commission – Supply-Demand Forecast for Electric Utilities 2011 - 2020 ‾‾‾‾‾‾‾‾‾‾‾‾‾‾‾‾‾‾‾‾‾‾‾‾‾‾‾‾‾‾‾‾‾‾‾‾‾‾‾‾‾‾‾‾‾‾‾‾‾‾‾‾‾‾‾‾‾‾‾‾‾‾‾‾‾‾‾‾‾‾‾‾‾‾‾‾‾‾‾‾‾‾‾‾‾‾‾‾‾‾‾‾‾‾‾‾‾‾‾‾‾‾‾‾‾‾‾‾‾‾‾‾‾‾‾‾‾‾‾‾‾‾‾‾‾‾
____________________________________________________________________________________ Page 3 ‾‾‾‾‾‾‾‾‾‾‾‾‾‾‾‾‾‾‾‾‾‾‾‾‾‾‾‾‾‾‾‾‾‾‾‾‾‾‾‾‾‾‾‾‾‾‾‾‾‾‾‾‾‾‾‾‾‾‾‾‾‾‾‾‾‾‾‾‾‾‾‾‾‾‾‾‾‾‾‾‾‾‾‾‾‾‾‾‾‾‾‾‾‾‾‾‾‾‾‾‾‾‾‾‾‾‾‾‾‾‾‾‾‾‾‾‾‾‾‾‾‾‾‾‾‾

reliance on power markets to provide firm capacity assumes that capacity will be available from a market source;
7. Appalachian Power Company invested in emission control equipment responding
to requirements under the Clean Air Act (CAA), CAA Amendments, NOX SIP Call and the Clean Air Interstate Rule (CAIR). The impact of the emission control requirements on Appalachian Power’s supply and demand balance is significant. A number of other environmental rules under development could result in additional significant changes in Appalachian Power’s generating units during the 2011-2020 period. One requirement, issued on July 6, 2010, proposes to replace CAIR as required by a 2008 federal court decision. The “Transport Rule” establishes a state specific emission limit for SO2 and both Annual and Seasonal (May-September) emission limit for NOX. The proposed new limits would take effect in 2012 for NOX. New SO2 limits would take effect in two phases (2012 and 2014) using newly created emission allowances with limited opportunities for trading on an interstate basis. The timing and level of required reductions is more stringent than CAIR. The Clean Air Mercury Rule (CAMR), vacated in early 2008, replaces a more comprehensive unit-by-unit “maximum achievable control technology” (MACT) standard for all hazardous air pollutant emissions. The U.S. Environmental Protection Agency (EPA) plans to issue a proposed rule containing the MACT standards in Spring 2011, finalizing the rule later that same year.
On May 13, 2010, the EPA issued a final rule that addresses greenhouse gas emissions (GHGs) from stationary sources under the Clean Air Act (CAA) permitting programs more commonly referred to as the GHG “Tailoring Rule.” The Tailoring Rule sets thresholds for GHG emissions whereby permits under the New Source Review Prevention of Significant Deterioration (PSD) and title V Operating Permit programs are required for new and existing industrial facilities. In addition, new rules propose regulation of handling and disposal of Coal Combustion Residuals (CCRs) requiring federal management standards on all ponds and landfills handling CCRs. EPA proposed options to manage CCR materials as either solid wastes or hazardous wastes. Regulations are being developed under §316(b) of the Clean Water Act regulating cooling water intake structures and new technology-based effluent limitation guidelines for regulating wastewater discharges under the National Pollutant Discharge Elimination System (NPDES) permitting program. The EPA is considering new requirements requiring extensive additional pollution control equipment retrofits for the American Electric Power East system through
____________________________________________________________________________________ Public Service Commission – Supply-Demand Forecast for Electric Utilities 2011 - 2020 ‾‾‾‾‾‾‾‾‾‾‾‾‾‾‾‾‾‾‾‾‾‾‾‾‾‾‾‾‾‾‾‾‾‾‾‾‾‾‾‾‾‾‾‾‾‾‾‾‾‾‾‾‾‾‾‾‾‾‾‾‾‾‾‾‾‾‾‾‾‾‾‾‾‾‾‾‾‾‾‾‾‾‾‾‾‾‾‾‾‾‾‾‾‾‾‾‾‾‾‾‾‾‾‾‾‾‾‾‾‾‾‾‾‾‾‾‾‾‾‾‾‾‾‾‾‾
____________________________________________________________________________________ Page 4 ‾‾‾‾‾‾‾‾‾‾‾‾‾‾‾‾‾‾‾‾‾‾‾‾‾‾‾‾‾‾‾‾‾‾‾‾‾‾‾‾‾‾‾‾‾‾‾‾‾‾‾‾‾‾‾‾‾‾‾‾‾‾‾‾‾‾‾‾‾‾‾‾‾‾‾‾‾‾‾‾‾‾‾‾‾‾‾‾‾‾‾‾‾‾‾‾‾‾‾‾‾‾‾‾‾‾‾‾‾‾‾‾‾‾‾‾‾‾‾‾‾‾‾‾‾‾

2020. Future equipment retrofits may include retrofitting flue gas desulfurization, selective catalytic reduction, selective non-catalytic reduction technologies, installing new CCR disposal and wastewater treatment systems. Additional costs may be necessary to close existing CCR management systems.
8. As a result of the Energy Policy Act of 1992, the Federal Energy Regulatory
Commission (FERC) promoted continued competition in the natural gas market in addition to greater competition in the electric market. As of April 1996, FERC issued Order 888 concerning wholesale competition and stranded investments. Retail competition among electric utilities is not a factor since West Virginia electric utilities remain regulated.
9. The North American Electric Reliability Corporation (NERC) maintains a
traditional role ensuring electric reliability throughout North America using a non-mandatory system of compliance, certification and enforcement. However, the Energy Policy Act of 2005 calls for an end to a former voluntary reliability regime by placing national reliability authority in FERC’s hands with authority implementing a strong industry-based organization called the Electric Reliability Organization (ERO). On July 20, 2006, FERC issued an order certifying NERC as the ERO for the United States.
Forecast Procedure
The procedure for determining a ten-year supply and demand forecast is comprised of two basic steps. Step one is collecting data on historical electric peaks, coincident economic conditions and coincident weather conditions. Additionally, utilities will provide forecasts of future electrical requirements and recommendations for the narrative parts of this report. Since all four companies use econometric forecasting models requiring explicit economic and demographic assumptions, an evaluation of the appropriateness of some of the models’ assumed values is also made. However, data provided by private forecasting services precluded independent verification of some input variables.
Step two of the forecast procedure involves examination of the supply side
resource plans of the utilities. These plans are developed to ensure that an adequate amount of resources exist to meet the forecasted peak demands and contingencies.
____________________________________________________________________________________ Public Service Commission – Supply-Demand Forecast for Electric Utilities 2011 - 2020 ‾‾‾‾‾‾‾‾‾‾‾‾‾‾‾‾‾‾‾‾‾‾‾‾‾‾‾‾‾‾‾‾‾‾‾‾‾‾‾‾‾‾‾‾‾‾‾‾‾‾‾‾‾‾‾‾‾‾‾‾‾‾‾‾‾‾‾‾‾‾‾‾‾‾‾‾‾‾‾‾‾‾‾‾‾‾‾‾‾‾‾‾‾‾‾‾‾‾‾‾‾‾‾‾‾‾‾‾‾‾‾‾‾‾‾‾‾‾‾‾‾‾‾‾‾‾
____________________________________________________________________________________ Page 5 ‾‾‾‾‾‾‾‾‾‾‾‾‾‾‾‾‾‾‾‾‾‾‾‾‾‾‾‾‾‾‾‾‾‾‾‾‾‾‾‾‾‾‾‾‾‾‾‾‾‾‾‾‾‾‾‾‾‾‾‾‾‾‾‾‾‾‾‾‾‾‾‾‾‾‾‾‾‾‾‾‾‾‾‾‾‾‾‾‾‾‾‾‾‾‾‾‾‾‾‾‾‾‾‾‾‾‾‾‾‾‾‾‾‾‾‾‾‾‾‾‾‾‾‾‾‾

Since the reliability of an electric system, assuming an adequate supply of fuel, is a function of megawatts of demand rather than megawatt hours of energy, no energy supply data is incorporated in this study.4
Utility forecasts, aggregated by Reliability First Corporation (RFC), are included
in this report (Report). RFC’s study is regional in scope and provides an important overview of the area in which electric utilities in West Virginia and other participants might buy and sell electrical power. This Report provides average annual growth rates to permit comparisons to previous Reports. Use of compound growth rates sensitive to starting and ending dates requires caution.
Projections and conclusions of this Report are specific to a particular point in time.
The analyses are subject to both known and unknown uncertainties possibly influencing the need for capacity by West Virginia electric utilities during the forecast period. FERC’s attempt to restructure the electric utility industry to provide greater competition introduces new uncertainties affecting peak supply and demand reliability. Therefore, the Commission’s annual supply and demand report does not preclude a determination of different capacity requirements in future proceedings or any other case related basis.
Regional Projections
This section examines the ten-year projections of all electric utilities serving the Mid-Atlantic and East Central region of the United States.
All Reliability First Corporation (RFC) members are affiliated with either the
Midwest Independent Transmission System Operator, Inc. (MISO) or PJM for operations and reliability coordination with the exception of the Ohio Valley Electric Corporation (OVEC)5. Resource adequacy of RFC is determined via assessments of MISO and PJM against their individual adequacy standards. RFC compiles long-term supply and demand projections of member utilities to ensure a reliable supply of electrical energy. Forecasted average rates of demand growth from winter 2010/2011 to winter 2019/2020 are expected to be 1.1% per year. RFC’s winter Reserve Margin should remain 39 percent higher than customer demand throughout the forecast period. The aggregate demand of the RFC region typically peaks in the summer. Forecasted rates of demand growth, from summer 2011 to summer 2020, should average 1.2% per year. RFC’s summer Reserve Margin should decline to approximately 9.5% of customer demand by
4"Demand" is the average electrical energy required in any given interval of time (usually one hour) by a utility's customers, measured in megawatts. "Energy", on the other hand, is the total amount of electricity used, measured in megawatt hours. 5 OVEC a generation and transmission utility located in Kentucky and Ohio
____________________________________________________________________________________ Public Service Commission – Supply-Demand Forecast for Electric Utilities 2011 - 2020 ‾‾‾‾‾‾‾‾‾‾‾‾‾‾‾‾‾‾‾‾‾‾‾‾‾‾‾‾‾‾‾‾‾‾‾‾‾‾‾‾‾‾‾‾‾‾‾‾‾‾‾‾‾‾‾‾‾‾‾‾‾‾‾‾‾‾‾‾‾‾‾‾‾‾‾‾‾‾‾‾‾‾‾‾‾‾‾‾‾‾‾‾‾‾‾‾‾‾‾‾‾‾‾‾‾‾‾‾‾‾‾‾‾‾‾‾‾‾‾‾‾‾‾‾‾‾
____________________________________________________________________________________ Page 6 ‾‾‾‾‾‾‾‾‾‾‾‾‾‾‾‾‾‾‾‾‾‾‾‾‾‾‾‾‾‾‾‾‾‾‾‾‾‾‾‾‾‾‾‾‾‾‾‾‾‾‾‾‾‾‾‾‾‾‾‾‾‾‾‾‾‾‾‾‾‾‾‾‾‾‾‾‾‾‾‾‾‾‾‾‾‾‾‾‾‾‾‾‾‾‾‾‾‾‾‾‾‾‾‾‾‾‾‾‾‾‾‾‾‾‾‾‾‾‾‾‾‾‾‾‾‾

the end of the forecast period without the inclusion of Independent Power Producers (IPP).
RFC’s regional map is available in this report. NERC Regional Reliability
Council’s ten-year supply and demand forecast for summer and winter peaks is included in Tables 1 and 2 on pages 18 and 19 of this Report.6 The bulk electric system in the RFC region is expected to perform well during the forecast period.
RFC’s annual peak total internal demand should continue to occur during the
summer. Forecasted economic factors and average weather conditions will determine summer time growth of peak demand. Therefore, the actual peak demands may vary significantly from year to year. The 2010 forecast is 12.8% above the 2009 actual. RFC resource projections indicate direct-controlled and interruptible load-management programs will provide 8,400 MW of supplemental resources during the 2010-2019 forecast periods. RFC’s net internal demand is approximately 192,200 MW in 2019 by removing interruptible demand and loads under demand-side management.
6 Map is courtesy of the NERC Long Term Reliability Assessment 2007 published on October 2007 available at www.nerc.com.
____________________________________________________________________________________ Public Service Commission – Supply-Demand Forecast for Electric Utilities 2011 - 2020 ‾‾‾‾‾‾‾‾‾‾‾‾‾‾‾‾‾‾‾‾‾‾‾‾‾‾‾‾‾‾‾‾‾‾‾‾‾‾‾‾‾‾‾‾‾‾‾‾‾‾‾‾‾‾‾‾‾‾‾‾‾‾‾‾‾‾‾‾‾‾‾‾‾‾‾‾‾‾‾‾‾‾‾‾‾‾‾‾‾‾‾‾‾‾‾‾‾‾‾‾‾‾‾‾‾‾‾‾‾‾‾‾‾‾‾‾‾‾‾‾‾‾‾‾‾‾
____________________________________________________________________________________ Page 7 ‾‾‾‾‾‾‾‾‾‾‾‾‾‾‾‾‾‾‾‾‾‾‾‾‾‾‾‾‾‾‾‾‾‾‾‾‾‾‾‾‾‾‾‾‾‾‾‾‾‾‾‾‾‾‾‾‾‾‾‾‾‾‾‾‾‾‾‾‾‾‾‾‾‾‾‾‾‾‾‾‾‾‾‾‾‾‾‾‾‾‾‾‾‾‾‾‾‾‾‾‾‾‾‾‾‾‾‾‾‾‾‾‾‾‾‾‾‾‾‾‾‾‾‾‾‾

Reliability First Corporation
Map No. 1 North American Electric Reliability Council
____________________________________________________________________________________ Public Service Commission – Supply-Demand Forecast for Electric Utilities 2011 - 2020 ‾‾‾‾‾‾‾‾‾‾‾‾‾‾‾‾‾‾‾‾‾‾‾‾‾‾‾‾‾‾‾‾‾‾‾‾‾‾‾‾‾‾‾‾‾‾‾‾‾‾‾‾‾‾‾‾‾‾‾‾‾‾‾‾‾‾‾‾‾‾‾‾‾‾‾‾‾‾‾‾‾‾‾‾‾‾‾‾‾‾‾‾‾‾‾‾‾‾‾‾‾‾‾‾‾‾‾‾‾‾‾‾‾‾‾‾‾‾‾‾‾‾‾‾‾‾
____________________________________________________________________________________ Page 8 ‾‾‾‾‾‾‾‾‾‾‾‾‾‾‾‾‾‾‾‾‾‾‾‾‾‾‾‾‾‾‾‾‾‾‾‾‾‾‾‾‾‾‾‾‾‾‾‾‾‾‾‾‾‾‾‾‾‾‾‾‾‾‾‾‾‾‾‾‾‾‾‾‾‾‾‾‾‾‾‾‾‾‾‾‾‾‾‾‾‾‾‾‾‾‾‾‾‾‾‾‾‾‾‾‾‾‾‾‾‾‾‾‾‾‾‾‾‾‾‾‾‾‾‾‾‾

Table No. 1RFC Regional Council
Winter Supply and Demand Analysis
Winter of
Load (1) MW
Generation (2) MW
Reserve
%
Annual Load
GrowthRate %
2009/10 138,200 (3) 213,100 (4) 54.2 (5.4) 2010/11 143,040 219,583 53.5 3.5 2011/12 146,591 219,583 49.8 2.5 2012/13 149,000 219,583 47.4 1.6 2013/14 150,300 219,583 46.1 0.9 2014/15 151,400 219,583 45.0 0.7 2015/16 152,900 219,583 43.6 1.0 2016/17 154,400 219,583 42.2 1.0 2017/18 155,500 219,583 41.2 0.7 2018/19 156,500 219,583 40.3 0.6 2019/20 157,200 219,583 39.7 0.4
Source: 2010 Electricity Supply and Demand 2010-2019, September 2010, North American Electric Reliability Corporation, Princeton, N. J.
Notes: 1. Includes both firm and interruptible demands. 2. Represents capacity (market ratings) committed to the MISO and PJM markets.
Includes total installed generation capacity which is existing, presently under construction, or in various stages of planning; plus scheduled capacity purchases, less capacity sales. Does not include amounts of capacity for power projects that have been announced for the region.
3. Actual 4. Estimated
____________________________________________________________________________________ Public Service Commission – Supply-Demand Forecast for Electric Utilities 2011 - 2020 ‾‾‾‾‾‾‾‾‾‾‾‾‾‾‾‾‾‾‾‾‾‾‾‾‾‾‾‾‾‾‾‾‾‾‾‾‾‾‾‾‾‾‾‾‾‾‾‾‾‾‾‾‾‾‾‾‾‾‾‾‾‾‾‾‾‾‾‾‾‾‾‾‾‾‾‾‾‾‾‾‾‾‾‾‾‾‾‾‾‾‾‾‾‾‾‾‾‾‾‾‾‾‾‾‾‾‾‾‾‾‾‾‾‾‾‾‾‾‾‾‾‾‾‾‾‾
____________________________________________________________________________________ Page 9 ‾‾‾‾‾‾‾‾‾‾‾‾‾‾‾‾‾‾‾‾‾‾‾‾‾‾‾‾‾‾‾‾‾‾‾‾‾‾‾‾‾‾‾‾‾‾‾‾‾‾‾‾‾‾‾‾‾‾‾‾‾‾‾‾‾‾‾‾‾‾‾‾‾‾‾‾‾‾‾‾‾‾‾‾‾‾‾‾‾‾‾‾‾‾‾‾‾‾‾‾‾‾‾‾‾‾‾‾‾‾‾‾‾‾‾‾‾‾‾‾‾‾‾‾‾‾

Table No. 2
RFC Regional Council Summer Supply and Demand Analysis
Summer of
Load (1) MW
Generation (2) MW
Reserve %
Annual Load
GrowthRate %
2010 174,400 (3) 219,600 (4) 25.9 7.0 2011 181,867 219,583 20.7 4.3 2012 186,900 219,583 17.5 2.8 2013 189,900 219,583 15.6 1.6 2014 192,000 219,583 14.4 1.1 2015 193,700 219,583 13.4 0.9 2016 195,600 219,583 12.3 1.0 2017 197,300 219,583 11.3 0.9 2018 198,900 219,583 10.4 0.8 2019 200,600 219,583 9.5 0.9
Source: 2010 Electricity Supply and Demand 2010-2019, September 2010, North American Electric Reliability Corporation, Princeton, N. J.
Notes: 1. Includes both firm and interruptible demands. MISO and PJM markets. Includes
total installed generation capacity which is existing, presently under construction, or in various stages of planning; plus scheduled capacity purchases, less capacity sales. Does not include amounts of capacity for power projects that have been announced for the region.
2. Represents capacity (market ratings) committed to the
3. Actual
4. Estimated
____________________________________________________________________________________ Public Service Commission – Supply-Demand Forecast for Electric Utilities 2011 - 2020 ‾‾‾‾‾‾‾‾‾‾‾‾‾‾‾‾‾‾‾‾‾‾‾‾‾‾‾‾‾‾‾‾‾‾‾‾‾‾‾‾‾‾‾‾‾‾‾‾‾‾‾‾‾‾‾‾‾‾‾‾‾‾‾‾‾‾‾‾‾‾‾‾‾‾‾‾‾‾‾‾‾‾‾‾‾‾‾‾‾‾‾‾‾‾‾‾‾‾‾‾‾‾‾‾‾‾‾‾‾‾‾‾‾‾‾‾‾‾‾‾‾‾‾‾‾‾
____________________________________________________________________________________ Page 10 ‾‾‾‾‾‾‾‾‾‾‾‾‾‾‾‾‾‾‾‾‾‾‾‾‾‾‾‾‾‾‾‾‾‾‾‾‾‾‾‾‾‾‾‾‾‾‾‾‾‾‾‾‾‾‾‾‾‾‾‾‾‾‾‾‾‾‾‾‾‾‾‾‾‾‾‾‾‾‾‾‾‾‾‾‾‾‾‾‾‾‾‾‾‾‾‾‾‾‾‾‾‾‾‾‾‾‾‾‾‾‾‾‾‾‾‾‾‾‾‾‾‾‾‾‾‾

American Electric Power Company
Generating companies of the American Electric Power (AEP) System (East Zone) continue to be parties to the AEP Interconnection Agreement (IA). AEP’s interconnection “pool agreement” includes five other AEP System operating companies. Each member of the pool is responsible for a proportionate share of the aggregate AEP System pool generating capacity. Four AEP System (West Zone) operating companies are parties to a separate interconnection agreement. System integration agreements tie the eastern and western AEP zones together. However, AEP indicates there is relatively little effect on the AEP System (East Zone) companies’ reserve outlook from the system integration agreement.
Appalachian Power Company (APCO) is one of the generating companies of the AEP System (East Zone). Wheeling Power (WPCO) is a non-generating AEP Company. However, each company remains a separate entity for regulatory purposes.
The focus of this report is the balance of electric supply and demand within West Virginia. Therefore, the Staff of the Public Service Commission undertook an examination of APCO's and WPCO's West Virginia jurisdictional peak demand and supply. Because APCO’s and WPCO’s forecasted demand and supply resources were modeled as part of the AEP System (East Zone), Staff's examination necessarily extends to that system's capacity capabilities and planning. Appalachian Power Company
Appalachian Power Company (APCO) is the largest AEP subsidiary in terms of population served, number of customers and area of service territory of the operating companies that comprise the AEP System (East Zone). In 2009, APCO provided electric service to approximately 960,000 customers in the States of Virginia and West Virginia, with approximately 440,000 of those customers located in the southern 21 counties of West Virginia. APCO's generation mix includes coal fired steam plants and hydroelectric facilities and one natural gas-fired combustion turbine plant (detailed on Chart No. 1 in the Appendix). Additionally, APCO has interconnections with other utilities (detailed on Chart No. 2 in the Appendix). These interconnections provide for reliability across a broad interconnected electrical network and allow economic sales and purchases of power among the interconnected companies.
____________________________________________________________________________________ Public Service Commission – Supply-Demand Forecast for Electric Utilities 2011 - 2020 ‾‾‾‾‾‾‾‾‾‾‾‾‾‾‾‾‾‾‾‾‾‾‾‾‾‾‾‾‾‾‾‾‾‾‾‾‾‾‾‾‾‾‾‾‾‾‾‾‾‾‾‾‾‾‾‾‾‾‾‾‾‾‾‾‾‾‾‾‾‾‾‾‾‾‾‾‾‾‾‾‾‾‾‾‾‾‾‾‾‾‾‾‾‾‾‾‾‾‾‾‾‾‾‾‾‾‾‾‾‾‾‾‾‾‾‾‾‾‾‾‾‾‾‾‾‾
____________________________________________________________________________________ Page 11 ‾‾‾‾‾‾‾‾‾‾‾‾‾‾‾‾‾‾‾‾‾‾‾‾‾‾‾‾‾‾‾‾‾‾‾‾‾‾‾‾‾‾‾‾‾‾‾‾‾‾‾‾‾‾‾‾‾‾‾‾‾‾‾‾‾‾‾‾‾‾‾‾‾‾‾‾‾‾‾‾‾‾‾‾‾‾‾‾‾‾‾‾‾‾‾‾‾‾‾‾‾‾‾‾‾‾‾‾‾‾‾‾‾‾‾‾‾‾‾‾‾‾‾‾‾‾

Wheeling Power Company
Wheeling Power Company (WPCO) provides electric service to approximately 41,000 customers (at year-end 2009) primarily in Ohio and Marshall Counties of West Virginia's northern panhandle. Currently, Wheeling Power is solely a transmission and distribution company that purchases all its power from Ohio Power Company. AEP Forecasting
The AEP System is a fully integrated system, with much of the engineering, accounting, purchasing and other functions accomplished using a professional staff located at the system offices in Columbus, Ohio and Tulsa, Oklahoma. The AEP Service Corporation (AEPSC) in Columbus and Tulsa, in consultation with each of the AEP System operating companies, do all of the forecasting for APCO as well as other affiliated companies. To evaluate APCO, then, one has to review the technique employed by AEPSC.
Generally, AEPSC reviews, prepares and revises all forecasts as necessary. In the third or fourth quarter of each year, short-term (up to two years) and long-term (two to twenty years) projections of the peak demand and energy requirements of each of the AEP System (East Zone) operating companies, as well as the aggregate AEP System, are usually issued. AEPSC reviews each short-term forecast, in detail, during the year. If necessary, each forecast is revised reflecting recent experiences and changes in short-term outlook. The current load forecast is the “5+7 Version" of the 2010 forecast, completed in April 2010.
The AEP System (East Zone) peak demand forecast is derived by summing the forecast for its operating companies, taking into account diversity effects. The following provides an overview of more important considerations in developing the current AEP Base Case forecast.
Growth will continue in the number of residential customers served by the AEP System (East Zone) at the rate of 0.4% per year.
Electricity prices for the AEP System (East Zone) operating companies incorporate expectations concerning the need for new generation, compliance with environmental laws, fuel costs and other factors that may affect price during the 2011-2020 periods.
The forecast of peak internal demand for each individual operating company is determined by developing a monthly peak electric demand forecast model that simulates typical peak loads by jurisdiction. This model, in conjunction with monthly energy forecasts, produces a preliminary weather-normalized peak load forecast for each month and
____________________________________________________________________________________ Public Service Commission – Supply-Demand Forecast for Electric Utilities 2011 - 2020 ‾‾‾‾‾‾‾‾‾‾‾‾‾‾‾‾‾‾‾‾‾‾‾‾‾‾‾‾‾‾‾‾‾‾‾‾‾‾‾‾‾‾‾‾‾‾‾‾‾‾‾‾‾‾‾‾‾‾‾‾‾‾‾‾‾‾‾‾‾‾‾‾‾‾‾‾‾‾‾‾‾‾‾‾‾‾‾‾‾‾‾‾‾‾‾‾‾‾‾‾‾‾‾‾‾‾‾‾‾‾‾‾‾‾‾‾‾‾‾‾‾‾‾‾‾‾
____________________________________________________________________________________ Page 12 ‾‾‾‾‾‾‾‾‾‾‾‾‾‾‾‾‾‾‾‾‾‾‾‾‾‾‾‾‾‾‾‾‾‾‾‾‾‾‾‾‾‾‾‾‾‾‾‾‾‾‾‾‾‾‾‾‾‾‾‾‾‾‾‾‾‾‾‾‾‾‾‾‾‾‾‾‾‾‾‾‾‾‾‾‾‾‾‾‾‾‾‾‾‾‾‾‾‾‾‾‾‾‾‾‾‾‾‾‾‾‾‾‾‾‾‾‾‾‾‾‾‾‾‾‾‾

season. Forecasted peak demands are evaluated for reasonableness of both projected load factor and growth rate.
The projected seasonal peak demand requirements of the AEP System (East Zone) utilize aggregate projected hourly peak demands of System's operating companies.7 Currently, the AEP System (East Zone) annual load factor forecast is between 66% and 67% over the forecast period.
In addition to system records, the AEP forecast uses a large array of data from national, state and local sources, and consulting services. In particular, historical and projected data relating to factors such as weather, demographics, economic activity, industrial production, appliance saturation characteristics and future technological outlook are sources of interest. American Electric Power East Projected Summer Peak Demand
This report focuses on the AEP System (East Zone) summer peak demand since the AEP System (East Zone) system is forecasting a summer peaking system over the forecast period. For example, the AEP System (East Zone) projected summer peak demand for 2011 is 2.3% greater than the winter 2010/2011 projected system peak, and by summer 2020 the projected summer peak is 3.9% greater than the 2019/2020 winter peak. The projected winter peak demands for AEP System (East Zone) system and most of its member companies are shown on Table 3. Average annual growth rates (AGR) are provided on this table and throughout this report. These growth rates are compound growth rates and are sensitive to the choice of starting and ending dates; therefore, they should be used with care. For the AEP System (East Zone) as a whole, the ten-year average annual growth rate in the summer peak internal demand is forecasted to be 0.1%. AEP predicts that over the forecast period, summer 2011 through summer 2020, demand will rise from a level of 20,792 MW to 20,909 MW. This represents a 117 MW increase in peak load. In terms of megawatt hours of electrical energy the long term growth rate of AEP System (East Zone) requirements over the same ten-year period is approximately 0.1% per year.
7The internal demand reported for each of the operating companies in subsequent tables is a non-coincident peak. This means that not all operating companies experience their peaks on the same hour and, accordingly, the sum of the individual companies' peaks will exceed the reported peak AEP System internal demand.
____________________________________________________________________________________ Public Service Commission – Supply-Demand Forecast for Electric Utilities 2011 - 2020 ‾‾‾‾‾‾‾‾‾‾‾‾‾‾‾‾‾‾‾‾‾‾‾‾‾‾‾‾‾‾‾‾‾‾‾‾‾‾‾‾‾‾‾‾‾‾‾‾‾‾‾‾‾‾‾‾‾‾‾‾‾‾‾‾‾‾‾‾‾‾‾‾‾‾‾‾‾‾‾‾‾‾‾‾‾‾‾‾‾‾‾‾‾‾‾‾‾‾‾‾‾‾‾‾‾‾‾‾‾‾‾‾‾‾‾‾‾‾‾‾‾‾‾‾‾‾
____________________________________________________________________________________ Page 13 ‾‾‾‾‾‾‾‾‾‾‾‾‾‾‾‾‾‾‾‾‾‾‾‾‾‾‾‾‾‾‾‾‾‾‾‾‾‾‾‾‾‾‾‾‾‾‾‾‾‾‾‾‾‾‾‾‾‾‾‾‾‾‾‾‾‾‾‾‾‾‾‾‾‾‾‾‾‾‾‾‾‾‾‾‾‾‾‾‾‾‾‾‾‾‾‾‾‾‾‾‾‾‾‾‾‾‾‾‾‾‾‾‾‾‾‾‾‾‾‾‾‾‾‾‾‾

APCO Projected Winter Peak Demand
AEP's projection of APCO's winter peak demand is shown on Table 3, column (2). Further, the West Virginia jurisdictional projection, coincident with APCO's peak demand, is shown in column (1) as APWV. The major assumptions of the APCO forecast are:
Growth in the number of West Virginia residential customers is expected to increase at 0.2% annual rate. Energy conservation will continue to play a role in reducing the rate of growth in electrical demand from historical levels. The non-mining industrial load will continue to increase but at a rate that will lag economic advances by the nation as a whole.
Since the 1980's, coal mining employment continues to decline primarily because of significant increases in productivity resulting from changes in mining techniques. Mining employment should continue to decline, during the forecast period, but at a much slower pace. The forecast also assumes increased output with continued productivity increases.
In summary, APCO's annual load factor in 2009 was 50% and is expected to be between 58% and 59% through 2020, based on normal weather. During the forecast period it is projected that APCO's West Virginia jurisdictional winter demand, APWV, will grow at an annual rate of 0.2%. Reserve Margins Capacity Planning
To adequately serve the needs of its customers, an electric utility must plan to have generating resources greater than its forecasted peak load. This margin above peak is necessary to allow for maintenance, forced outages, severe weather and other contingencies. The size of this planning margin will vary among utilities and is often a point of litigation between utilities and intervenors before State Commissions.
Perhaps the two most widely-used measures of adequate capacity are Reserve Margin and Loss of Load Expectation (LOLE). Reserve Margin is defined as:
R.M. % = Capacity - Load x 100
Load
LOLE can be defined in terms of the number of days when available generating capacity, including the effect of interconnections, is not sufficient to meet the load demand during the peak hour. During such days it may be necessary to shed load. A typical LOLE criterion is one day in ten years.
____________________________________________________________________________________ Public Service Commission – Supply-Demand Forecast for Electric Utilities 2011 - 2020 ‾‾‾‾‾‾‾‾‾‾‾‾‾‾‾‾‾‾‾‾‾‾‾‾‾‾‾‾‾‾‾‾‾‾‾‾‾‾‾‾‾‾‾‾‾‾‾‾‾‾‾‾‾‾‾‾‾‾‾‾‾‾‾‾‾‾‾‾‾‾‾‾‾‾‾‾‾‾‾‾‾‾‾‾‾‾‾‾‾‾‾‾‾‾‾‾‾‾‾‾‾‾‾‾‾‾‾‾‾‾‾‾‾‾‾‾‾‾‾‾‾‾‾‾‾‾
____________________________________________________________________________________ Page 14 ‾‾‾‾‾‾‾‾‾‾‾‾‾‾‾‾‾‾‾‾‾‾‾‾‾‾‾‾‾‾‾‾‾‾‾‾‾‾‾‾‾‾‾‾‾‾‾‾‾‾‾‾‾‾‾‾‾‾‾‾‾‾‾‾‾‾‾‾‾‾‾‾‾‾‾‾‾‾‾‾‾‾‾‾‾‾‾‾‾‾‾‾‾‾‾‾‾‾‾‾‾‾‾‾‾‾‾‾‾‾‾‾‾‾‾‾‾‾‾‾‾‾‾‾‾‾

Reserve Margin is that portion of the generation resources which exceeds peak demand. Continuity of supply cannot be assured unless the utility has sufficient generating resources to supply peak summer and winter demands, but also an additional Reserve Margin to provide for contingencies. On October 1, 2004, AEP joined PJM Interconnection, LLC a Regional Transmission Organization (RTO). PJM determines the amount of Reserve Margin each of its member utilities is to provide to meet a LOLE of one day in ten years, considering load diversity among load serving entities in PJM and PJM and load serving entity forced outage rates. PJM reserve requirements, established for no more than four years into the future, generally are about 15% to 16% for PJM as a whole. Considering peak load diversity, the corresponding AEP reserve requirement is expected to be about 12%. Appalachian Power Company Reserve Margin
Appalachian Power Company is projected to remain winter peaking over the next ten years, but APCO is part of the integrated AEP System (East Zone). In order to judge the adequacy of APCO's Reserve Margin, it is necessary to examine the Reserve Margins of the AEP System (East Zone). Since the system experiences a summer peak, the summer supply and demand projections for APCO are important considerations. AEP Capacity Plan
The AEP System’s (East Zone) operating companies jointly plan to meet their combined coincident peak. The five generating companies, Appalachian Power, Columbus Southern Power, Indiana-Michigan Power, Kentucky Power, and Ohio Power Company participate in a power supply pool agreement. Under this agreement, these companies share in their combined capacity resources.
Table 4 lists all of the AEP System – East Zone (system) generating additions planned for the forecast period (through 2020). Table 5 lists all of the forecasted non-system or “off-system” capacity sales and purchases. Each table represents AEP’s and APCO’s current capacity addition plans. The Capacity changes noted in Table 4 are comprised of efficiency improvements, auxiliary power increases, generating unit retirements, solar and wind generation additions, and generating unit additions. The efficiency improvements increase the megawatt availability of a generating unit by improvements of operating equipment such as turbine blades, steam valves, control equipment, etc. Auxiliary power increases are actually decreases in megawatt availability because of additional emission control equipment consuming power that is normally available for market sales. For the years 2012, 2014, 2015, 2016, 2017, 2018, and 2019 AEP is planning to retire several generating units. However, generation unit retirements are subject to an ongoing review of system capacity needs, and therefore, retirements dates will vary from one forecast to another. Generating capacity is planned to be supplemented via solar and wind energy generation for the entire
____________________________________________________________________________________ Public Service Commission – Supply-Demand Forecast for Electric Utilities 2011 - 2020 ‾‾‾‾‾‾‾‾‾‾‾‾‾‾‾‾‾‾‾‾‾‾‾‾‾‾‾‾‾‾‾‾‾‾‾‾‾‾‾‾‾‾‾‾‾‾‾‾‾‾‾‾‾‾‾‾‾‾‾‾‾‾‾‾‾‾‾‾‾‾‾‾‾‾‾‾‾‾‾‾‾‾‾‾‾‾‾‾‾‾‾‾‾‾‾‾‾‾‾‾‾‾‾‾‾‾‾‾‾‾‾‾‾‾‾‾‾‾‾‾‾‾‾‾‾‾
____________________________________________________________________________________ Page 15 ‾‾‾‾‾‾‾‾‾‾‾‾‾‾‾‾‾‾‾‾‾‾‾‾‾‾‾‾‾‾‾‾‾‾‾‾‾‾‾‾‾‾‾‾‾‾‾‾‾‾‾‾‾‾‾‾‾‾‾‾‾‾‾‾‾‾‾‾‾‾‾‾‾‾‾‾‾‾‾‾‾‾‾‾‾‾‾‾‾‾‾‾‾‾‾‾‾‾‾‾‾‾‾‾‾‾‾‾‾‾‾‾‾‾‾‾‾‾‾‾‾‾‾‾‾‾

forecast period of 2011 through 2020. A total of one combined cycle and eight combustion turbines complete the forecasted generating capacity additions.
On September 19, 2007, AEP completed the purchase of a natural gas-fired power plant under construction near Dresden, Ohio, from Dresden Energy LLC, a subsidiary of Dominion. When completed, Dresden will be a nominal 580 MW natural gas-fired combined-cycle plant assigned to APCO. In addition, several formal agreements that AEP System (East Zone) operating companies have entered into are discussed briefly below.
Four AEP companies (Appalachian Power, Columbus Southern Power, Indiana-Michigan Power, and Ohio Power Company) are among the fifteen investor-owned electric utilities in the Ohio Valley region which sponsored the formation in 1952 of the Ohio Valley Electric Corporation (OVEC) and its subsidiary, Indiana-Kentucky Electric Corporation (IKEC), for the purpose of supplying the electrical power for the Federal Government’s Portsmouth Area Project, that was originally under the responsibility of the Atomic Energy Commission, and later the Department of Energy (DOE). Effective April 2003, the Sponsoring Companies are entitled to purchase from OVEC their participation share of any available power from the eleven OVEC units. As of April 2004, the sponsors have agreed to extend the OVEC operating agreement for an additional twenty years.
Ohio Power Company (OPCO) owns Unit 1 of the three-unit Cardinal Plant, located in Brilliant, Ohio. Buckeye Power, Inc. owns Units 2 and 3. Buckeye Power supplies the power requirements of Ohio’s rural electric cooperatives under terms of an agreement with Ohio’s investor-owned electric utilities, whereby power is transmitted over investor-owned transmission systems to each cooperative. Ohio Power provides Buckeye Power with an alternate source of power when Cardinal Units 2 and 3 are out of service. Ohio Power is entitled to utilize generating capacity from either Cardinal unit not needed for Buckeye Power’s load. OPCO has an agreement with Buckeye Power entitling OPCO to 20% of Buckeye Power’s Robert P. Mone Plant (three 182 MW combustion turbines) generating capacity.
By the end of 2010, AEP operating companies Indiana Michigan Power, APCO, and AEP-Ohio (Columbus Southern Power & Ohio Power Company) will be receiving energy from at least nine wind farm contracts and one solar project contract, totaling 636 MW. Recently, APCO began receiving additional wind power related to the long-term purchase agreement of 100.5 MW from Beech Ridge, and two long-term purchase agreements for 51 MW (nameplate capacity) from the Grand Ridge II Wind Farm and 49.5 MW from the Grand Ridge III Wind Farm. Also, AEP-Ohio is purchasing all of the output from PSEG’s Wyandot Solar project (10 MW, nameplate), which went into commercial operation May 2010.
____________________________________________________________________________________ Public Service Commission – Supply-Demand Forecast for Electric Utilities 2011 - 2020 ‾‾‾‾‾‾‾‾‾‾‾‾‾‾‾‾‾‾‾‾‾‾‾‾‾‾‾‾‾‾‾‾‾‾‾‾‾‾‾‾‾‾‾‾‾‾‾‾‾‾‾‾‾‾‾‾‾‾‾‾‾‾‾‾‾‾‾‾‾‾‾‾‾‾‾‾‾‾‾‾‾‾‾‾‾‾‾‾‾‾‾‾‾‾‾‾‾‾‾‾‾‾‾‾‾‾‾‾‾‾‾‾‾‾‾‾‾‾‾‾‾‾‾‾‾‾
____________________________________________________________________________________ Page 16 ‾‾‾‾‾‾‾‾‾‾‾‾‾‾‾‾‾‾‾‾‾‾‾‾‾‾‾‾‾‾‾‾‾‾‾‾‾‾‾‾‾‾‾‾‾‾‾‾‾‾‾‾‾‾‾‾‾‾‾‾‾‾‾‾‾‾‾‾‾‾‾‾‾‾‾‾‾‾‾‾‾‾‾‾‾‾‾‾‾‾‾‾‾‾‾‾‾‾‾‾‾‾‾‾‾‾‾‾‾‾‾‾‾‾‾‾‾‾‾‾‾‾‾‾‾‾

The capacity purchases shown in Table 5 represent new AEP capacity. The listed resources indicate the types and amounts of capacity that may be required. They do not represent a rigid plan. AEP System (East Zone) Reserve Margin Projections
The forecasted summer Reserve Margin for AEP System (East Zone) based on AEP System (East Zone) own supply and demand projections, is shown on line 11 of Table 6 on page 48. In the calculations of Reserve Margins, the interruptible loads are subtracted from the projected peak; however, these interruptible customers are expected to be served during the peak if possible.
AEP System (East Zone) expects to maintain a minimum Reserve Margin of about 12 percent. AEP System (East Zone) is projecting that it will need additional supply side resources to maintain reliability.
No capacity deficiency is projected for the AEP System (East Zone). Therefore, even though APCO might be capacity deficient on a stand-alone basis during the forecast period, its capacity requirements are expected to be met by capacity available from the other AEP System (East Zone) operating companies in accordance with the provisions of the AEP Interconnection Agreement. Potential Threats to Reliability for AEP Restructuring of the Electric Industry
The movement to a competitive electric market, as well as other reliability issues, will have a profound impact on the electric supply and demand balance throughout the country. Power station maintenance staff is being reduced across the country. The general industry trend is to provide these services through contractors. The impact on the reliability of the plants as a result of staffing reductions is uncertain. Utilities have historically provided neighboring utilities with much cooperation in sharing equipment, manpower, information and other types of emergency assistance. Because neighboring utilities are now competitors, that cooperation is diminishing. Transmission line loadings may increase as a result of more transactions between distant buyers and sellers. Higher loading levels could result in more voltage or outage events.
Utilities are stockpiling less fuel than historical levels. Lower stockpiles increase the
risk of fuel shortages if a disruption in fuel supply occurs. Competition may increase local opposition to transmission line construction. Many residents view new transmission
____________________________________________________________________________________ Public Service Commission – Supply-Demand Forecast for Electric Utilities 2011 - 2020 ‾‾‾‾‾‾‾‾‾‾‾‾‾‾‾‾‾‾‾‾‾‾‾‾‾‾‾‾‾‾‾‾‾‾‾‾‾‾‾‾‾‾‾‾‾‾‾‾‾‾‾‾‾‾‾‾‾‾‾‾‾‾‾‾‾‾‾‾‾‾‾‾‾‾‾‾‾‾‾‾‾‾‾‾‾‾‾‾‾‾‾‾‾‾‾‾‾‾‾‾‾‾‾‾‾‾‾‾‾‾‾‾‾‾‾‾‾‾‾‾‾‾‾‾‾‾
____________________________________________________________________________________ Page 17 ‾‾‾‾‾‾‾‾‾‾‾‾‾‾‾‾‾‾‾‾‾‾‾‾‾‾‾‾‾‾‾‾‾‾‾‾‾‾‾‾‾‾‾‾‾‾‾‾‾‾‾‾‾‾‾‾‾‾‾‾‾‾‾‾‾‾‾‾‾‾‾‾‾‾‾‾‾‾‾‾‾‾‾‾‾‾‾‾‾‾‾‾‾‾‾‾‾‾‾‾‾‾‾‾‾‾‾‾‾‾‾‾‾‾‾‾‾‾‾‾‾‾‾‾‾‾

line construction as a way to accommodate sales between distant buyers and sellers, and not as necessary to support their local distribution company. Environmental Issues
AEP and its operating companies (such as APCO) have historically developed compliance strategies to meet the requirements of the Clean Air Act (CAA) and its Amendments (CAAA) as each rule becomes known. In addition to the CAAA Title IV (Acid Rain Program) Phase I and II emission requirements for SO2 and NOX, these rules have included the NOX State Implementation Plan (SIP) Call, Clean Air Visibility Rule (CAVR), the remanded Clean Air Interstate Rule (CAIR) and vacated Clean Air Mercury Rule (CAMR). Compliance with Title IV SO2 requirements involved continually evaluating alternative fuel strategies, exercising opportunities to purchase sulfur dioxide allowances, and retrofitting post-combustion technologies in order to lower the overall cost of compliance. For Title IV NOX compliance, AEP’s strategy included installing low-NOX burner technologies on its Phase II NOX units and using an averaging plan for its remaining generating units.
In 2000, the level of allowable NOX emissions was further reduced when the Federal Court of Appeals for the District of Columbia upheld an EPA rule requiring 19 states, including West Virginia, to revise their air quality regulations to substantially reduce NOX
emissions (the NOX SIP call) during the five-month Ozone Season (May-September). In response to the Federal requirements, West Virginia promulgated state NOX SIP Call regulations for electric generating units in 45 CSR 26 during the spring of 2003. As a result of these regulations, AEP committed significant resources to install and operate Selective Catalytic Reduction (SCR) systems (supplemented by allowance trading) to meet these new restrictions by the initial compliance deadline of May 31, 2004. AEP’s continuing compliance strategy for compliance with the NOX SIP Call involved a phased-in construction program for installation of additional NOX control equipment beyond the initial compliance date.
On May 12, 2005, the EPA published in the Federal Register the final CAIR that became effective 60 days later on July 11, 2005. As originally promulgated, the CAIR was a two-phase program that called for significant reductions of NOX and SO2. The CAIR incorporated the following three subprograms:
1. An Ozone Season NOX reduction program that would replace the NOX SIP Call program;
2. An annual NOX reduction program; and
____________________________________________________________________________________ Public Service Commission – Supply-Demand Forecast for Electric Utilities 2011 - 2020 ‾‾‾‾‾‾‾‾‾‾‾‾‾‾‾‾‾‾‾‾‾‾‾‾‾‾‾‾‾‾‾‾‾‾‾‾‾‾‾‾‾‾‾‾‾‾‾‾‾‾‾‾‾‾‾‾‾‾‾‾‾‾‾‾‾‾‾‾‾‾‾‾‾‾‾‾‾‾‾‾‾‾‾‾‾‾‾‾‾‾‾‾‾‾‾‾‾‾‾‾‾‾‾‾‾‾‾‾‾‾‾‾‾‾‾‾‾‾‾‾‾‾‾‾‾‾
____________________________________________________________________________________ Page 18 ‾‾‾‾‾‾‾‾‾‾‾‾‾‾‾‾‾‾‾‾‾‾‾‾‾‾‾‾‾‾‾‾‾‾‾‾‾‾‾‾‾‾‾‾‾‾‾‾‾‾‾‾‾‾‾‾‾‾‾‾‾‾‾‾‾‾‾‾‾‾‾‾‾‾‾‾‾‾‾‾‾‾‾‾‾‾‾‾‾‾‾‾‾‾‾‾‾‾‾‾‾‾‾‾‾‾‾‾‾‾‾‾‾‾‾‾‾‾‾‾‾‾‾‾‾‾

3. An annual SO2 reduction program that would be administered through the Title IV Acid Rain Program.
As discussed later in this section, the CAIR was vacated by the United States Court of
Appeals for the District of Columbia Circuit on July 11, 2008 and remanded to the EPA.
The two CAIR NOX programs were to be implemented with a two-phase process in 2009 and 2015. In 2009, the CAIR would reduce NOX emissions by 1.7 million tons, or 53% from 2003 levels, across states covered by the rule. In 2015, the CAIR would reduce NOX emissions by 2 million tons, achieving a regional emissions level of 1.3 million tons, a 61% reduction from 2003 levels.
The CAIR SO2 program was to be implemented in a two-phase process in 2010 and 2015. In 2010, the CAIR would reduce SO2 emissions by 4.3 million tons or 55% lower than 2003 levels, across states covered by the rule. By 2015, the CAIR would reduce SO2 emissions by 5.4 million tons, or 69%, from 2003 levels in these states.
On March 15, 2005 the EPA issued the CAMR which became effective on July 18, 2005. Similar to the CAIR, the CAMR program was also a two-phase program, to be implemented in 2010 and 2018. The CAMR applied nationwide, requiring a 20% reduction in mercury emissions by 2010 and a 70% reduction by 2018. As discussed on page 34 below, the CAMR program was vacated by the United States Court of Appeals for the District of Columbia Circuit on February 8, 2008.
States within the AEP service territory were required to modify their State Implementation Plans to incorporate rules equivalent to the federal CAIR and CAMR programs. These rules were then submitted to and approved by EPA as part of the State's Implementation Plan (SIP). The West Virginia Department of Environmental Protection (WVDEP), Division of Air Quality developed and finalized CAIR and CAMR implementation rules in the spring of 2006. The annual CAIR NOX program rule (45 CSR 39), the ozone-season CAIR NOX program rule (45 CSR 40), the annual CAIR SO2 program rule (45 CSR 41), and CAMR mercury budget program (45 CSR 37) were each promulgated by the WVDEP and issued with an effective date of May 1, 2006. The WVDEP CAIR and CAMR implementation rules are patterned primarily after the federal model rules for the CAIR and CAMR.
The analysis conducted by AEP indicated that the Flue Gas Desulfurization (FGD) and Selective Catalytic Reduction (SCR) scrubbers being installed on its system, including at APCO generating facilities, were all part of a least-cost compliance plan to meet EPA regulations, including the CAIR and CAMR. The analysis also indicated that all the SCR investments needed to meet the NOX SIP Call requirements were also needed to comply with the annual NOX reductions required under the CAIR rule. The requirements of the CAMR
____________________________________________________________________________________ Public Service Commission – Supply-Demand Forecast for Electric Utilities 2011 - 2020 ‾‾‾‾‾‾‾‾‾‾‾‾‾‾‾‾‾‾‾‾‾‾‾‾‾‾‾‾‾‾‾‾‾‾‾‾‾‾‾‾‾‾‾‾‾‾‾‾‾‾‾‾‾‾‾‾‾‾‾‾‾‾‾‾‾‾‾‾‾‾‾‾‾‾‾‾‾‾‾‾‾‾‾‾‾‾‾‾‾‾‾‾‾‾‾‾‾‾‾‾‾‾‾‾‾‾‾‾‾‾‾‾‾‾‾‾‾‾‾‾‾‾‾‾‾‾
____________________________________________________________________________________ Page 19 ‾‾‾‾‾‾‾‾‾‾‾‾‾‾‾‾‾‾‾‾‾‾‾‾‾‾‾‾‾‾‾‾‾‾‾‾‾‾‾‾‾‾‾‾‾‾‾‾‾‾‾‾‾‾‾‾‾‾‾‾‾‾‾‾‾‾‾‾‾‾‾‾‾‾‾‾‾‾‾‾‾‾‾‾‾‾‾‾‾‾‾‾‾‾‾‾‾‾‾‾‾‾‾‾‾‾‾‾‾‾‾‾‾‾‾‾‾‾‾‾‾‾‾‾‾‾

also required installation of activated carbon injection at several units with the injected carbon captured by the existing electrostatic precipitator and disposed of with the unit’s fly ash.
Subsequent to AEP and APCO initiating the retrofit of pollution control technologies to meet the requirements of the CAIR and CAMR, on October 9, 2007, AEP entered into a consent decree with the Department of Justice to settle all complaints filed against AEP and its affiliates including APCO and Ohio Power (OPCO). With respect to generating facilities in West Virginia, these companies are bound by the decree to install and continuously operate an SCR on Mountaineer Unit 1, Amos Units 1, 2 and 3, and Mitchell Units 1 and 2. The companies are also required to install and continuously operate an FGD on Mountaineer Unit 1, Mitchell Units 1 and 2, and Amos Units 1, 2 and 3.
In addition, OPCO and APCO are required to continuously operate overfired air on Kammer Units 1-3 and low NOX burners on Kanawha River Units 1 and 2, respectively, beginning on October 9, 2007. As well, beginning on the same date Kanawha River Units 1 and 2 can only burn coal with sulfur content no greater than 1.75 lb/mmBTU on an annual average basis. Finally, OPCO is required to retire, repower, or retrofit environmental controls on Sporn Unit 5 by December 31, 2013.
As AEP continued implementation of its least-cost environmental compliance strategy, the United States Court of Appeals for the District of Columbia Circuit vacated the CAMR on February 8, 2008. The Court remanded the rule back to EPA for further rulemaking under the Maximum Achievable Control Technology (MACT) provisions of Section 112 of the Clean Air Act. On March 14, 2008, the three-judge panel granted a motion mandating immediate implementation of its February 8, 2008 decision. In response to this court decision, AEP and APCO cancelled the scheduled retrofits of activated carbon injection technology on all units except for two outside of APCO.
With the vacation of the CAMR and the completion of the appeals process, the EPA has announced its intent to develop a new regulatory program for mercury emissions and other Hazardous Air Pollutants (HAP), including, among others, arsenic, selenium, lead, cadmium and various acid gases (collectively “HAPs” or “HAPs rulemaking”) under the MACT provision of the Clean Air Act. The EPA has set a deadline for a proposed MACT rule to be issued for public review and comment in March 2011 and a final rule to be issued in November 2011. This rule is expected to take effect as early as December 2015. However, the MACT standards for HAPs have not been established, and the requirements will not be even tentatively known until a proposed rule is issued and will not be definitively known until a final rule is issued late in 2011. Although not definitively known, AEP Engineering Project and Field Services (EP&FS) and AEP Environmental Services attempted to identify reasonable proxies for a MACT at each AEP coal unit. For the most
____________________________________________________________________________________ Public Service Commission – Supply-Demand Forecast for Electric Utilities 2011 - 2020 ‾‾‾‾‾‾‾‾‾‾‾‾‾‾‾‾‾‾‾‾‾‾‾‾‾‾‾‾‾‾‾‾‾‾‾‾‾‾‾‾‾‾‾‾‾‾‾‾‾‾‾‾‾‾‾‾‾‾‾‾‾‾‾‾‾‾‾‾‾‾‾‾‾‾‾‾‾‾‾‾‾‾‾‾‾‾‾‾‾‾‾‾‾‾‾‾‾‾‾‾‾‾‾‾‾‾‾‾‾‾‾‾‾‾‾‾‾‾‾‾‾‾‾‾‾‾
____________________________________________________________________________________ Page 20 ‾‾‾‾‾‾‾‾‾‾‾‾‾‾‾‾‾‾‾‾‾‾‾‾‾‾‾‾‾‾‾‾‾‾‾‾‾‾‾‾‾‾‾‾‾‾‾‾‾‾‾‾‾‾‾‾‾‾‾‾‾‾‾‾‾‾‾‾‾‾‾‾‾‾‾‾‾‾‾‾‾‾‾‾‾‾‾‾‾‾‾‾‾‾‾‾‾‾‾‾‾‾‾‾‾‾‾‾‾‾‾‾‾‾‾‾‾‾‾‾‾‾‾‾‾‾

part, either FGD and SCR or Activated Carbon Injection (ACI) with fabric filter fugitive dust collection systems would likely be required for compliance.
Similarly, on July 11, 2008, the same Court issued an opinion to vacate and remand the CAIR. The Court granted rehearing on its initial decision before the mandate was issued based on petitions from multiple parties. In the interim between the initial decision and the decision on rehearing, APCO and AEP continued to plan for compliance with the CAIR, pending final resolution of the petitions by the Court. On December 23, 2008, the District of Columbia Circuit Court of Appeals issued an order remanding the CAIR back to the EPA for new rulemaking without vacating the CAIR rule.
The EPA issued a proposed rulemaking on July 6, 2010, to replace CAIR. In lieu of a regional cap-and-trade program, the “Transport Rule” would potentially establish state specific emission budgets for SO2 and both Annual and Seasonal (May-September) NOX. In the AEP East zone states, including West Virginia, the emission reduction requirements proposed in the Transport Rule may involve acceleration of already-planned environmental retrofits to as early as January 2014 in-service dates that may be impossible to achieve given the minimum time spans needed for any regulatory certification, permitting, and construction. Until the proposed rulemaking is finalized, the CAIR rule remains in effect, and AEP currently is required to meet the emission reduction requirements set forth under the CAIR.
The electric utility industry, as a major producer of CO2, will be significantly affected by any GHG legislation. This final rule “tailors” the requirements of these CAA permitting programs to limit which facilities will be required to obtain PSD and Title V permits. The EPA will phase in the CAA permitting requirements for GHGs in two initial phases.
Phase 1, in effect from January 2, 2011 through June 30, 2011, requires permitting for GHG emissions under PSD for sources otherwise subject to the New Source Review (NSR) permitting program due to new sources or modifications that increase emissions of conventional pollutants that also significantly increases emissions of GHGs. For these projects, any increase of 75,000 tons or more of total GHG, on a CO2 equivalent basis, would trigger the need to determine the Best Available Control Technology (BACT) for GHG emissions. Similarly, for the operating permit program, only sources currently subject to the Title V program for a non-GHG pollutant would be subject to Title V permitting requirements for GHG emissions. During this time period, no sources would be subject to CAA permitting requirements due solely to GHG emissions.
Phase 2, in effect from July 1, 2011 through June 30, 2013, will build on Phase 1. In this phase, PSD permitting requirements will cover for the first time new construction projects that emit GHG emissions of at least 100,000 tons even if they do not exceed the permitting thresholds for any other pollutant. Modifications at existing facilities that
____________________________________________________________________________________ Public Service Commission – Supply-Demand Forecast for Electric Utilities 2011 - 2020 ‾‾‾‾‾‾‾‾‾‾‾‾‾‾‾‾‾‾‾‾‾‾‾‾‾‾‾‾‾‾‾‾‾‾‾‾‾‾‾‾‾‾‾‾‾‾‾‾‾‾‾‾‾‾‾‾‾‾‾‾‾‾‾‾‾‾‾‾‾‾‾‾‾‾‾‾‾‾‾‾‾‾‾‾‾‾‾‾‾‾‾‾‾‾‾‾‾‾‾‾‾‾‾‾‾‾‾‾‾‾‾‾‾‾‾‾‾‾‾‾‾‾‾‾‾‾
____________________________________________________________________________________ Page 21 ‾‾‾‾‾‾‾‾‾‾‾‾‾‾‾‾‾‾‾‾‾‾‾‾‾‾‾‾‾‾‾‾‾‾‾‾‾‾‾‾‾‾‾‾‾‾‾‾‾‾‾‾‾‾‾‾‾‾‾‾‾‾‾‾‾‾‾‾‾‾‾‾‾‾‾‾‾‾‾‾‾‾‾‾‾‾‾‾‾‾‾‾‾‾‾‾‾‾‾‾‾‾‾‾‾‾‾‾‾‾‾‾‾‾‾‾‾‾‾‾‾‾‾‾‾‾

increase GHG emissions by at least 75,000 tons will be subject to permitting requirements, even if they do not significantly increase emissions of any other pollutant. In Phase 2, operating permit requirements will, for the first time, apply to sources based on their GHG emissions even if they would not apply based on emissions of any other pollutant. Facilities that emit at least 100,000 tons CO2 equivalent will be subject to Title V permitting requirements. Newly-permitted solid waste landfills will also need to obtain Title V permits for the first time due to their GHG emissions.
The EPA has plans to implement future phases and will undertake another rulemaking, to begin in 2011 and conclude no later than July 1, 2012. The EPA will not require permits for sources that emit 50,000 ton of GHG or less in Phase 3 or through any other regulatory action until at least April 30, 2016.
By the end of April 2015, the EPA will complete a study on remaining GHG permitting burdens that would exist if the program was applied to smaller sources. A final rule further addressing CAA permitting for smaller sources is forecasted to be completed by April 30, 2016.
In addition, new rules on the handling and disposal of Coal Combustion Residuals (CCRs) are being developed and could likewise be implemented as early as 2017, requiring significant additional capital investment in the coal fleet to convert “wet” flyash and bottom ash disposal equipment and systems—including attendant landfills and ponds—to “dry” systems, plus build wastewater treatment facilities to address plant groundwater runoff.
Further proposed new regulation surrounds the Clean Water Act §316(b) that requires the EPA to promulgate regulations to ensure that the location, design, construction, and capacity of cooling water intake structures reflect the Best Available Technology (BAT) to protect aquatic organisms from being killed or injured by impingement or entrainment. EPA is also in the process of updating the technology-based effluent limitation guidelines for steam electric generating facilities. This could lead to more stringent discharge limitations in the NPDES permits for our utilities’ facilities.
Existing and proposed environmental regulations may result in either the retirement or costly retrofitting of existing AEP East coal units.
With respect to a carbon constrained future, AEP has been proactively planning for the potential of federal carbon-related emission legislation or regulation by developing a portfolio of activities, resources and responses. This portfolio includes:
1. Being proactive and engaged in the development of climate policy including support for sensible cost effective climate policy, including support for The American Clean
____________________________________________________________________________________ Public Service Commission – Supply-Demand Forecast for Electric Utilities 2011 - 2020 ‾‾‾‾‾‾‾‾‾‾‾‾‾‾‾‾‾‾‾‾‾‾‾‾‾‾‾‾‾‾‾‾‾‾‾‾‾‾‾‾‾‾‾‾‾‾‾‾‾‾‾‾‾‾‾‾‾‾‾‾‾‾‾‾‾‾‾‾‾‾‾‾‾‾‾‾‾‾‾‾‾‾‾‾‾‾‾‾‾‾‾‾‾‾‾‾‾‾‾‾‾‾‾‾‾‾‾‾‾‾‾‾‾‾‾‾‾‾‾‾‾‾‾‾‾‾
____________________________________________________________________________________ Page 22 ‾‾‾‾‾‾‾‾‾‾‾‾‾‾‾‾‾‾‾‾‾‾‾‾‾‾‾‾‾‾‾‾‾‾‾‾‾‾‾‾‾‾‾‾‾‾‾‾‾‾‾‾‾‾‾‾‾‾‾‾‾‾‾‾‾‾‾‾‾‾‾‾‾‾‾‾‾‾‾‾‾‾‾‾‾‾‾‾‾‾‾‾‾‾‾‾‾‾‾‾‾‾‾‾‾‾‾‾‾‾‾‾‾‾‾‾‾‾‾‾‾‾‾‾‾‾

Energy and Security Act of 2009 and our involvement in EPA’s GHG BACT Working Group;
2. Investing in science/technology research and development through the Electric Power
Research Institute and the Asia Pacific Partnership;
3. Taking voluntary, proactive steps to advance the technologies and offset programs that achieved real emissions reductions and set policy precedents through the Chicago Climate Exchange and EPA Climate Leaders;
4. Reducing its carbon dioxide emissions by about 75 million cumulative tons during
2003 through 2009;
5. Investing in longer term technology solutions including new ultra-supercritical pulverized coal generating units, chilled ammonia technology for post-combustion carbon capture and storage for new or existing pulverized coal-fired generating units, and wind and solar energy projects; and
6. Reducing demand resulting in benefits to customers, along with reductions in
resulting emissions, by implementing new energy efficiency programs and conducting Smart Grid pilot programs.
Aging Generating Units
Currently, there are 45 coal-fired units on the AEP System (East Zone) that are 30 or more years old. These units represent 17,230 MW, or 65 percent of AEP System (East Zone) total capability. Assuming no retirements, by 2020 the number of coal-fired units more than 30 years old would increase to 47 units representing 19,850 MW, or 75 percent of total existing system capability. The availability of units may deteriorate as a result of the aging process unless appropriate measures are taken. Loss of Interruptible Load
In 2010, the AEP System (East Zone) served a significant amount of interruptible load (1,021 MW based on contract demands). However, after reflecting diversity of the various customer loads plus an allowance for customer curtailments because of economic price signals, the estimated load available for interruption is 519 MW at summer peak and 553 MW at winter peak. It should be noted that this interruptible load does not reflect customers participating in PJM’s demand response programs. As AEP System (East Zone) Reserve Margins decline, the threat of increased interruptions may lead some interruptible customers to seek to become firm customers.
____________________________________________________________________________________ Public Service Commission – Supply-Demand Forecast for Electric Utilities 2011 - 2020 ‾‾‾‾‾‾‾‾‾‾‾‾‾‾‾‾‾‾‾‾‾‾‾‾‾‾‾‾‾‾‾‾‾‾‾‾‾‾‾‾‾‾‾‾‾‾‾‾‾‾‾‾‾‾‾‾‾‾‾‾‾‾‾‾‾‾‾‾‾‾‾‾‾‾‾‾‾‾‾‾‾‾‾‾‾‾‾‾‾‾‾‾‾‾‾‾‾‾‾‾‾‾‾‾‾‾‾‾‾‾‾‾‾‾‾‾‾‾‾‾‾‾‾‾‾‾
____________________________________________________________________________________ Page 23 ‾‾‾‾‾‾‾‾‾‾‾‾‾‾‾‾‾‾‾‾‾‾‾‾‾‾‾‾‾‾‾‾‾‾‾‾‾‾‾‾‾‾‾‾‾‾‾‾‾‾‾‾‾‾‾‾‾‾‾‾‾‾‾‾‾‾‾‾‾‾‾‾‾‾‾‾‾‾‾‾‾‾‾‾‾‾‾‾‾‾‾‾‾‾‾‾‾‾‾‾‾‾‾‾‾‾‾‾‾‾‾‾‾‾‾‾‾‾‾‾‾‾‾‾‾‾

Lack of Participation in Load Modification Programs
Customer participation in possible future load modification programs is beyond the control of AEP. Therefore, there is the potential to achieve lower than expected peak reductions. Transmission Issues On June 22, 2007, the PJM Board approved a transmission project, now known as the Potomac-Appalachian Transmission Highline (PATH) Project, for inclusion in PJM's Regional Transmission Expansion Plan. The PATH Project was approved by the PJM Board for the purpose of maintaining the reliability of the PJM transmission system. In 2007, subsidiaries of American Electric Power Company, Inc. (AEP) and Allegheny Energy, Inc formed a joint venture to build the PATH Project. As currently proposed, the PATH Project includes construction of a 765-kilovolt (kV) transmission line from AEP’s Amos Substation near St. Albans, West Virginia, to the proposed Welton Spring Substation in Hardy County, West Virginia and continuing through West Virginia, Virginia and Maryland to the proposed Kemptown Substation in Frederick County, Maryland. The proposed in-service date for the project as directed by PJM is June 1, 2015, at the latest. On May 15, 2009, PATH West Virginia Transmission Company, LLC, PATH Allegheny Transmission Company, LLC, PATH-WV Land Acquisition Company and PATH-Allegheny Land Acquisition Company filed with the West Virginia Public Service Commission (PSC) a joint application for certificates of public convenience and necessity and for related relief pursuant to W.Va. Code 24-2-11 and 24-2-11a. An evidentiary hearing on the application is currently scheduled for March 2011 but requests to extend that hearing schedule further have been made.
Applications for authorization to construct the PATH Project in Maryland and Virginia are pending with the utility commissions in those states with decisions on those applications expected during the third quarter of 2011.
____________________________________________________________________________________ Public Service Commission – Supply-Demand Forecast for Electric Utilities 2011 - 2020 ‾‾‾‾‾‾‾‾‾‾‾‾‾‾‾‾‾‾‾‾‾‾‾‾‾‾‾‾‾‾‾‾‾‾‾‾‾‾‾‾‾‾‾‾‾‾‾‾‾‾‾‾‾‾‾‾‾‾‾‾‾‾‾‾‾‾‾‾‾‾‾‾‾‾‾‾‾‾‾‾‾‾‾‾‾‾‾‾‾‾‾‾‾‾‾‾‾‾‾‾‾‾‾‾‾‾‾‾‾‾‾‾‾‾‾‾‾‾‾‾‾‾‾‾‾‾
____________________________________________________________________________________ Page 24 ‾‾‾‾‾‾‾‾‾‾‾‾‾‾‾‾‾‾‾‾‾‾‾‾‾‾‾‾‾‾‾‾‾‾‾‾‾‾‾‾‾‾‾‾‾‾‾‾‾‾‾‾‾‾‾‾‾‾‾‾‾‾‾‾‾‾‾‾‾‾‾‾‾‾‾‾‾‾‾‾‾‾‾‾‾‾‾‾‾‾‾‾‾‾‾‾‾‾‾‾‾‾‾‾‾‾‾‾‾‾‾‾‾‾‾‾‾‾‾‾‾‾‾‾‾‾

Conclusion
The AEP System’s current resource plans assume that up to 1,469 MW of capacity from new generation resources are to be acquired on the AEP System from 2011 through 2020. After taking into account the unit capacity changes of efficiency improvements, auxiliary power increases and retirements, the new generation resources result in a net decrease of 4,080 MW over the forecast period. AEP has developed a plan of capacity additions for the long term.
The effects of the CAA on the economic and demographic conditions of West
Virginia are potentially extensive. To the extent that affected utilities continue to use both low and high sulfur coal along with pollution control equipment to meet the SO2 emission requirements of the CAA, this scenario may result in greater mining employment, greater personal income, and greater population than would have occurred otherwise in the coal regions within APCO’s service territory. An extensive FGD/SCR retrofit was completed for AEP to meet the requirements of the CAA Title IV Acid Rain program, the NOx SIP Call and CAIR. To the extent that a new “Transport Rule” or other regulations require significantly greater reductions of SO2 and NOX emissions at coal-fired generating plants, they may accelerate already-planned environmental retrofits or retirements to as early as January, 2014. Accelerated in-service dates for environmental retrofits may be impossible to achieve given the minimum time spans needed for any regulatory certification, permitting, and construction. New CCR requirements may impose significant additional costs for converting existing ash handling systems, constructing new landfills, closing existing pond systems and installing new wastewater treatment systems. New standards under §316(b) and the effluent limitation guidelines could require additional investments. Finally, the proposed Greenhouse Gas Tailoring Rule will impact New Source Review and Title V operating permits based on GHG emissions. Over the ten-year forecast period considered in this report we expect moderate to slow growth in the internal economic and demographic factors affecting electric demand within APCO’s and WPCo’s West Virginia Service areas.
____________________________________________________________________________________ Public Service Commission – Supply-Demand Forecast for Electric Utilities 2011 - 2020 ‾‾‾‾‾‾‾‾‾‾‾‾‾‾‾‾‾‾‾‾‾‾‾‾‾‾‾‾‾‾‾‾‾‾‾‾‾‾‾‾‾‾‾‾‾‾‾‾‾‾‾‾‾‾‾‾‾‾‾‾‾‾‾‾‾‾‾‾‾‾‾‾‾‾‾‾‾‾‾‾‾‾‾‾‾‾‾‾‾‾‾‾‾‾‾‾‾‾‾‾‾‾‾‾‾‾‾‾‾‾‾‾‾‾‾‾‾‾‾‾‾‾‾‾‾‾
____________________________________________________________________________________ Page 25 ‾‾‾‾‾‾‾‾‾‾‾‾‾‾‾‾‾‾‾‾‾‾‾‾‾‾‾‾‾‾‾‾‾‾‾‾‾‾‾‾‾‾‾‾‾‾‾‾‾‾‾‾‾‾‾‾‾‾‾‾‾‾‾‾‾‾‾‾‾‾‾‾‾‾‾‾‾‾‾‾‾‾‾‾‾‾‾‾‾‾‾‾‾‾‾‾‾‾‾‾‾‾‾‾‾‾‾‾‾‾‾‾‾‾‾‾‾‾‾‾‾‾‾‾‾‾

____________________________________________________________________________________ Public Service Commission – Supply-Demand Forecast for Electric Utilities 2011 - 2020 ‾‾‾‾‾‾‾‾‾‾‾‾‾‾‾‾‾‾‾‾‾‾‾‾‾‾‾‾‾‾‾‾‾‾‾‾‾‾‾‾‾‾‾‾‾‾‾‾‾‾‾‾‾‾‾‾‾‾‾‾‾‾‾‾‾‾‾‾‾‾‾‾‾‾‾‾‾‾‾‾‾‾‾‾‾‾‾‾‾‾‾‾‾‾‾‾‾‾‾‾‾‾‾‾‾‾‾‾‾‾‾‾‾‾‾‾‾‾‾‾‾‾‾‾‾‾
____________________________________________________________________________________ Page 26 ‾‾‾‾‾‾‾‾‾‾‾‾‾‾‾‾‾‾‾‾‾‾‾‾‾‾‾‾‾‾‾‾‾‾‾‾‾‾‾‾‾‾‾‾‾‾‾‾‾‾‾‾‾‾‾‾‾‾‾‾‾‾‾‾‾‾‾‾‾‾‾‾‾‾‾‾‾‾‾‾‾‾‾‾‾‾‾‾‾‾‾‾‾‾‾‾‾‾‾‾‾‾‾‾‾‾‾‾‾‾‾‾‾‾‾‾‾‾‾‾‾‾‾‾‾‾

____________________________________________________________________________________ Public Service Commission – Supply-Demand Forecast for Electric Utilities 2011 - 2020 ‾‾‾‾‾‾‾‾‾‾‾‾‾‾‾‾‾‾‾‾‾‾‾‾‾‾‾‾‾‾‾‾‾‾‾‾‾‾‾‾‾‾‾‾‾‾‾‾‾‾‾‾‾‾‾‾‾‾‾‾‾‾‾‾‾‾‾‾‾‾‾‾‾‾‾‾‾‾‾‾‾‾‾‾‾‾‾‾‾‾‾‾‾‾‾‾‾‾‾‾‾‾‾‾‾‾‾‾‾‾‾‾‾‾‾‾‾‾‾‾‾‾‾‾‾‾
____________________________________________________________________________________ Page 27 ‾‾‾‾‾‾‾‾‾‾‾‾‾‾‾‾‾‾‾‾‾‾‾‾‾‾‾‾‾‾‾‾‾‾‾‾‾‾‾‾‾‾‾‾‾‾‾‾‾‾‾‾‾‾‾‾‾‾‾‾‾‾‾‾‾‾‾‾‾‾‾‾‾‾‾‾‾‾‾‾‾‾‾‾‾‾‾‾‾‾‾‾‾‾‾‾‾‾‾‾‾‾‾‾‾‾‾‾‾‾‾‾‾‾‾‾‾‾‾‾‾‾‾‾‾‾

____________________________________________________________________________________ Public Service Commission – Supply-Demand Forecast for Electric Utilities 2011 - 2020 ‾‾‾‾‾‾‾‾‾‾‾‾‾‾‾‾‾‾‾‾‾‾‾‾‾‾‾‾‾‾‾‾‾‾‾‾‾‾‾‾‾‾‾‾‾‾‾‾‾‾‾‾‾‾‾‾‾‾‾‾‾‾‾‾‾‾‾‾‾‾‾‾‾‾‾‾‾‾‾‾‾‾‾‾‾‾‾‾‾‾‾‾‾‾‾‾‾‾‾‾‾‾‾‾‾‾‾‾‾‾‾‾‾‾‾‾‾‾‾‾‾‾‾‾‾‾
____________________________________________________________________________________ Page 28 ‾‾‾‾‾‾‾‾‾‾‾‾‾‾‾‾‾‾‾‾‾‾‾‾‾‾‾‾‾‾‾‾‾‾‾‾‾‾‾‾‾‾‾‾‾‾‾‾‾‾‾‾‾‾‾‾‾‾‾‾‾‾‾‾‾‾‾‾‾‾‾‾‾‾‾‾‾‾‾‾‾‾‾‾‾‾‾‾‾‾‾‾‾‾‾‾‾‾‾‾‾‾‾‾‾‾‾‾‾‾‾‾‾‾‾‾‾‾‾‾‾‾‾‾‾‾

____________________________________________________________________________________ Public Service Commission – Supply-Demand Forecast for Electric Utilities 2011 - 2020 ‾‾‾‾‾‾‾‾‾‾‾‾‾‾‾‾‾‾‾‾‾‾‾‾‾‾‾‾‾‾‾‾‾‾‾‾‾‾‾‾‾‾‾‾‾‾‾‾‾‾‾‾‾‾‾‾‾‾‾‾‾‾‾‾‾‾‾‾‾‾‾‾‾‾‾‾‾‾‾‾‾‾‾‾‾‾‾‾‾‾‾‾‾‾‾‾‾‾‾‾‾‾‾‾‾‾‾‾‾‾‾‾‾‾‾‾‾‾‾‾‾‾‾‾‾‾
____________________________________________________________________________________ Page 29 ‾‾‾‾‾‾‾‾‾‾‾‾‾‾‾‾‾‾‾‾‾‾‾‾‾‾‾‾‾‾‾‾‾‾‾‾‾‾‾‾‾‾‾‾‾‾‾‾‾‾‾‾‾‾‾‾‾‾‾‾‾‾‾‾‾‾‾‾‾‾‾‾‾‾‾‾‾‾‾‾‾‾‾‾‾‾‾‾‾‾‾‾‾‾‾‾‾‾‾‾‾‾‾‾‾‾‾‾‾‾‾‾‾‾‾‾‾‾‾‾‾‾‾‾‾‾

____________________________________________________________________________________ Public Service Commission – Supply-Demand Forecast for Electric Utilities 2011 - 2020 ‾‾‾‾‾‾‾‾‾‾‾‾‾‾‾‾‾‾‾‾‾‾‾‾‾‾‾‾‾‾‾‾‾‾‾‾‾‾‾‾‾‾‾‾‾‾‾‾‾‾‾‾‾‾‾‾‾‾‾‾‾‾‾‾‾‾‾‾‾‾‾‾‾‾‾‾‾‾‾‾‾‾‾‾‾‾‾‾‾‾‾‾‾‾‾‾‾‾‾‾‾‾‾‾‾‾‾‾‾‾‾‾‾‾‾‾‾‾‾‾‾‾‾‾‾‾
____________________________________________________________________________________ Page 30 ‾‾‾‾‾‾‾‾‾‾‾‾‾‾‾‾‾‾‾‾‾‾‾‾‾‾‾‾‾‾‾‾‾‾‾‾‾‾‾‾‾‾‾‾‾‾‾‾‾‾‾‾‾‾‾‾‾‾‾‾‾‾‾‾‾‾‾‾‾‾‾‾‾‾‾‾‾‾‾‾‾‾‾‾‾‾‾‾‾‾‾‾‾‾‾‾‾‾‾‾‾‾‾‾‾‾‾‾‾‾‾‾‾‾‾‾‾‾‾‾‾‾‾‾‾‾

____________________________________________________________________________________ Public Service Commission – Supply-Demand Forecast for Electric Utilities 2011 - 2020 ‾‾‾‾‾‾‾‾‾‾‾‾‾‾‾‾‾‾‾‾‾‾‾‾‾‾‾‾‾‾‾‾‾‾‾‾‾‾‾‾‾‾‾‾‾‾‾‾‾‾‾‾‾‾‾‾‾‾‾‾‾‾‾‾‾‾‾‾‾‾‾‾‾‾‾‾‾‾‾‾‾‾‾‾‾‾‾‾‾‾‾‾‾‾‾‾‾‾‾‾‾‾‾‾‾‾‾‾‾‾‾‾‾‾‾‾‾‾‾‾‾‾‾‾‾‾
____________________________________________________________________________________ Page 31 ‾‾‾‾‾‾‾‾‾‾‾‾‾‾‾‾‾‾‾‾‾‾‾‾‾‾‾‾‾‾‾‾‾‾‾‾‾‾‾‾‾‾‾‾‾‾‾‾‾‾‾‾‾‾‾‾‾‾‾‾‾‾‾‾‾‾‾‾‾‾‾‾‾‾‾‾‾‾‾‾‾‾‾‾‾‾‾‾‾‾‾‾‾‾‾‾‾‾‾‾‾‾‾‾‾‾‾‾‾‾‾‾‾‾‾‾‾‾‾‾‾‾‾‾‾‾

____________________________________________________________________________________ Public Service Commission – Supply-Demand Forecast for Electric Utilities 2011 - 2020 ‾‾‾‾‾‾‾‾‾‾‾‾‾‾‾‾‾‾‾‾‾‾‾‾‾‾‾‾‾‾‾‾‾‾‾‾‾‾‾‾‾‾‾‾‾‾‾‾‾‾‾‾‾‾‾‾‾‾‾‾‾‾‾‾‾‾‾‾‾‾‾‾‾‾‾‾‾‾‾‾‾‾‾‾‾‾‾‾‾‾‾‾‾‾‾‾‾‾‾‾‾‾‾‾‾‾‾‾‾‾‾‾‾‾‾‾‾‾‾‾‾‾‾‾‾‾
____________________________________________________________________________________ Page 32 ‾‾‾‾‾‾‾‾‾‾‾‾‾‾‾‾‾‾‾‾‾‾‾‾‾‾‾‾‾‾‾‾‾‾‾‾‾‾‾‾‾‾‾‾‾‾‾‾‾‾‾‾‾‾‾‾‾‾‾‾‾‾‾‾‾‾‾‾‾‾‾‾‾‾‾‾‾‾‾‾‾‾‾‾‾‾‾‾‾‾‾‾‾‾‾‾‾‾‾‾‾‾‾‾‾‾‾‾‾‾‾‾‾‾‾‾‾‾‾‾‾‾‾‾‾‾

Allegheny Power Monongahela Power Company and the Potomac Edison Company
Monongahela Power Company (MPCO) and The Potomac Edison Company (PECO) comprise the regulated operating companies of Allegheny Energy, Inc. in West Virginia. These companies are now doing business as Allegheny Power (AP). However, for regulatory purposes each company remains a separate legal entity.
The focus of this report is the balance of electric supply and demand within West Virginia. Therefore, AP undertook an examination of MPCO's and PECO's jurisdictional peak demand and supply.
The projections of AP include some estimated impact of the 1990 Clean Air Act Amendments (CAAA). The CAAA will affect both future demand and capacity. The AP operating companies have completed a flue gas desulfurization facility at the Harrison Power Station in Harrison County, West Virginia (in compliance with Phase I of the CAAA, this facility was placed in service on January 1, 1995) and have installed scrubbers at its Fort Marin generation facilities during 2009.
The AP response to Staff's data request for information to produce this report included its October 2010 Load Forecast for the System and individual operating companies, suggested text changes, and many useful comments to help make this Report possible. The supply side resource information provided by AP, in Table 8, is based upon the November 2009 Integrated Resource Plan. Monongahela Power Company
In 2010, MPCO is providing electric service to approximately 386,000 customers in West Virginia. MPCO's present generation is nearly exclusively coal-fired steam plants as detailed on Chart No. 4 in the Appendix, but also includes pumped storage and PURPA capacity. As of April 2009, MPCO has approximately 41% equity ownership in the Allegheny Generating Company (AGC). AGC is a subsidiary of MPCO and Allegheny Energy Supply Co., LLC. AGC owns 40% of the Bath County facility (2,773 MW as of March 2009) pumped storage facility located in Bath County, VA. The Bath County facility was placed in service in 1985. MPCO also has three PURPA contracts for a total of approximately 160MW. MPCO is also a member of PJM, giving it access to very liquid competitive wholesale energy and capacity markets.
____________________________________________________________________________________ Public Service Commission – Supply-Demand Forecast for Electric Utilities 2011 - 2020 ‾‾‾‾‾‾‾‾‾‾‾‾‾‾‾‾‾‾‾‾‾‾‾‾‾‾‾‾‾‾‾‾‾‾‾‾‾‾‾‾‾‾‾‾‾‾‾‾‾‾‾‾‾‾‾‾‾‾‾‾‾‾‾‾‾‾‾‾‾‾‾‾‾‾‾‾‾‾‾‾‾‾‾‾‾‾‾‾‾‾‾‾‾‾‾‾‾‾‾‾‾‾‾‾‾‾‾‾‾‾‾‾‾‾‾‾‾‾‾‾‾‾‾‾‾‾
____________________________________________________________________________________ Page 33 ‾‾‾‾‾‾‾‾‾‾‾‾‾‾‾‾‾‾‾‾‾‾‾‾‾‾‾‾‾‾‾‾‾‾‾‾‾‾‾‾‾‾‾‾‾‾‾‾‾‾‾‾‾‾‾‾‾‾‾‾‾‾‾‾‾‾‾‾‾‾‾‾‾‾‾‾‾‾‾‾‾‾‾‾‾‾‾‾‾‾‾‾‾‾‾‾‾‾‾‾‾‾‾‾‾‾‾‾‾‾‾‾‾‾‾‾‾‾‾‾‾‾‾‾‾‾

Potomac Edison Company
PECO provided electric service to approximately 486,000 customers in 2010 in the States of West Virginia, Virginia and Maryland, with approximately 133,000 of those customers located in the Eastern Panhandle counties of West Virginia.8
PECO transferred approximately 2,100 MW of its Maryland, Virginia, and West Virginia jurisdictional generating assets to Allegheny Energy Supply on August 1, 2000. To serve PECO’s retail load responsibilities in West Virginia, PECO previously entered into a power supply arrangement with its affiliate Allegheny Energy Supply. This supply arrangement terminated with AP’s implementation of its generation ownership restructuring in West Virginia and PECO will serve its West Virginia retail load responsibilities through generation assets owned in whole and in part by MPCO and a PURPA contract for a facility located in Maryland. AP Forecasting
Allegheny Power (AP) is a fully integrated electrical system with much of the engineering, accounting, purchasing and other functions accomplished through the use of a consolidated professional staff located at the corporate office in Fairmont, West Virginia, and Greensburg, Pennsylvania. A discussion of the load forecasting techniques of MPCO and PECO involves a discussion of the techniques used by AP.
A comprehensive load forecast report is prepared annually for AP. In that report,
peak loads, kilowatt-hour energy use and load factors are projected for a 20-year period. The forecast is monitored on a monthly basis. New forecasts are made periodically, but an update to the forecast might be done at any time if economic events indicate a significant variation in the long run.
The AP forecasting methodology employs both econometric and end-use models.
The residential kilowatt-hour use per customer model is a statistically adjusted end-use model that blends econometric methodology driven by weather, price of electricity, and economic conditions with end-use methodology to capture equipment efficiency trends and saturations. The number of residential customers’ model uses econometric techniques based on the projected service area state population. Residential energy sales are the product of the forecast of use per customer and total residential customers. The commercial energy sales forecast also blends both econometric and end-use modeling methodologies. The
8 PECO sold its Virginia jurisdictional service territory to Rappahannock Electric Cooperative and Shenandoah Valley Electric Cooperative effective June 1, 2010. The sale resulted in about 102,000 less distribution customers in the Potomac Edison Company operating company service territory. The transmission assets were retained.
____________________________________________________________________________________ Public Service Commission – Supply-Demand Forecast for Electric Utilities 2011 - 2020 ‾‾‾‾‾‾‾‾‾‾‾‾‾‾‾‾‾‾‾‾‾‾‾‾‾‾‾‾‾‾‾‾‾‾‾‾‾‾‾‾‾‾‾‾‾‾‾‾‾‾‾‾‾‾‾‾‾‾‾‾‾‾‾‾‾‾‾‾‾‾‾‾‾‾‾‾‾‾‾‾‾‾‾‾‾‾‾‾‾‾‾‾‾‾‾‾‾‾‾‾‾‾‾‾‾‾‾‾‾‾‾‾‾‾‾‾‾‾‾‾‾‾‾‾‾‾
____________________________________________________________________________________ Page 34 ‾‾‾‾‾‾‾‾‾‾‾‾‾‾‾‾‾‾‾‾‾‾‾‾‾‾‾‾‾‾‾‾‾‾‾‾‾‾‾‾‾‾‾‾‾‾‾‾‾‾‾‾‾‾‾‾‾‾‾‾‾‾‾‾‾‾‾‾‾‾‾‾‾‾‾‾‾‾‾‾‾‾‾‾‾‾‾‾‾‾‾‾‾‾‾‾‾‾‾‾‾‾‾‾‾‾‾‾‾‾‾‾‾‾‾‾‾‾‾‾‾‾‾‾‾‾

commercial statistically adjusted end use model combines econometric techniques driven by weather, price of electricity, number of residential customers, and service area state non-manufacturing employment along with the end-use structure that captures equipment efficiency trends and saturations over time.
The industrial energy sales sector is separated into major two-digit Standard Industrial Classification (SIC) groups served by AP. Econometric models, driven by employment, production and industrial electric prices, are used to estimate the forecasting equation for each SIC group. Total industrial energy sales are the sum all forecasted SIC groups. Adjustments to the forecast are made for large load additions or losses.
Peak load forecasts are based on a model that considers end-use stock estimates and class load diversity based on projected residential, commercial and industrial sales. These are derived from the energy sales models. Major economic features of AP WV forecast in the interval 2011 through 2020 are:
1. West Virginia population growth will occur at an average rate of 0.14% per year. 2. West Virginia personal income is expected to increase by 3.7% per year from 2011 to
2012 and increase by 2.5% between 2011 and 2020. 3. West Virginia non-farm employment will increase at 1.3% per year from 2011
through 2020. 4. The real (inflation adjusted) price of electricity, in general, declines.
The principal sources of demographic data for AP analyses and forecasts are company
records, state agencies and local agencies. National economic data and service area economic data are supplied to AP by Moody’s Economy.com. These data are employed in the various models used to make the AP forecasts. AP Projected Winter Peak Demand Table 7 shows the AP winter peak demand for the forecast period of the winter of 2010/11 through the winter of 2019/20. This Table 7 also reflects the projected winter peak demands of each of the West Virginia AP operating companies. Table 7 represents AP Control Area load as well as the demand for West Virginia Power. The average annual growth rate in the winter peak demand for the entire AP Control Area is projected to be 1.4% over the forecast period of winter 2010/11 to winter 2019/20. AP
____________________________________________________________________________________ Public Service Commission – Supply-Demand Forecast for Electric Utilities 2011 - 2020 ‾‾‾‾‾‾‾‾‾‾‾‾‾‾‾‾‾‾‾‾‾‾‾‾‾‾‾‾‾‾‾‾‾‾‾‾‾‾‾‾‾‾‾‾‾‾‾‾‾‾‾‾‾‾‾‾‾‾‾‾‾‾‾‾‾‾‾‾‾‾‾‾‾‾‾‾‾‾‾‾‾‾‾‾‾‾‾‾‾‾‾‾‾‾‾‾‾‾‾‾‾‾‾‾‾‾‾‾‾‾‾‾‾‾‾‾‾‾‾‾‾‾‾‾‾‾
____________________________________________________________________________________ Page 35 ‾‾‾‾‾‾‾‾‾‾‾‾‾‾‾‾‾‾‾‾‾‾‾‾‾‾‾‾‾‾‾‾‾‾‾‾‾‾‾‾‾‾‾‾‾‾‾‾‾‾‾‾‾‾‾‾‾‾‾‾‾‾‾‾‾‾‾‾‾‾‾‾‾‾‾‾‾‾‾‾‾‾‾‾‾‾‾‾‾‾‾‾‾‾‾‾‾‾‾‾‾‾‾‾‾‾‾‾‾‾‾‾‾‾‾‾‾‾‾‾‾‾‾‾‾‾

projected a 1,088 MW increase over the forecast period from 8,287 MW to 9,375 MW. These forecasts are based upon the AP October 2010 Load Forecast. Table 7 results from an RFC requirement to provide forecasts of the connected load delivered by each operating company without regard to the actual generation supplier. MPCO Projected Winter Peak Demand
AP's projection of MPCO's winter peak demand is shown on Table 7, column (2). Further, the West Virginia jurisdictional projection is shown in column (1) as MPWV.
Two of the principle assumptions regarding MPCO's service territory embedded in these October 2010 demand forecasts are:
1. MPCO residential customers are projected to increase at an annual 0.6% rate. 2. The residential electric heat saturation is expected to increase from 22.8% in 2010 to
about 29.2% in 2020.
Reference to Table 7, column (2) shows that AP projects that MPCO's peak winter demand will increase from 1,809 MW to 2,072 MW at an annual growth rate of 1.5% over the winter 2010/11 to winter 2019/20 period. While West Virginia Power (WVP) is now a division of MPCO, WVP’s service territory is not part of AP’s Control Area. Therefore, AP has not included WVP peak demand forecasts in the forecasts for MPCO or MPWV on Table 7. West Virginia Power’s peak demand is expected to increase from 127 MW to 144 MW, at an annual growth of 1.3% over the forecast period and is also provided in column (I) on Table 7. PECO Projected Winter Peak
The AP projections of PECO winter peak demands are shown on Table 7, column (4). The West Virginia jurisdictional demand projections for PECO are shown in column (3) as PEWV. Some of the assumptions regarding PECO's service territory embedded in these October 2010 demand forecasts are:
1. PECO residential customers are projected to increase at an annual 1.5% rate.
2. Residential electric heat saturation is expected to increase from 57.9% in 2010 to 62.6% in 2020.
____________________________________________________________________________________ Public Service Commission – Supply-Demand Forecast for Electric Utilities 2011 - 2020 ‾‾‾‾‾‾‾‾‾‾‾‾‾‾‾‾‾‾‾‾‾‾‾‾‾‾‾‾‾‾‾‾‾‾‾‾‾‾‾‾‾‾‾‾‾‾‾‾‾‾‾‾‾‾‾‾‾‾‾‾‾‾‾‾‾‾‾‾‾‾‾‾‾‾‾‾‾‾‾‾‾‾‾‾‾‾‾‾‾‾‾‾‾‾‾‾‾‾‾‾‾‾‾‾‾‾‾‾‾‾‾‾‾‾‾‾‾‾‾‾‾‾‾‾‾‾
____________________________________________________________________________________ Page 36 ‾‾‾‾‾‾‾‾‾‾‾‾‾‾‾‾‾‾‾‾‾‾‾‾‾‾‾‾‾‾‾‾‾‾‾‾‾‾‾‾‾‾‾‾‾‾‾‾‾‾‾‾‾‾‾‾‾‾‾‾‾‾‾‾‾‾‾‾‾‾‾‾‾‾‾‾‾‾‾‾‾‾‾‾‾‾‾‾‾‾‾‾‾‾‾‾‾‾‾‾‾‾‾‾‾‾‾‾‾‾‾‾‾‾‾‾‾‾‾‾‾‾‾‾‾‾

3. The costs associated with the AES Warrior Run project will not be reflected in the rates of PECO customers in West Virginia.
Table 7, column (4) shows the AP projected gross winter peaks for PECO increasing
from 3,043 MW in winter 2010/11 to 3,443 MW in winter 2019/20 at an annual growth rate of 1.4%. PEWV, the PECO West Virginia jurisdictional demand, is forecast to grow at an average annual rate of 2% over the same period. Reserve Margins Planning and Projections Capacity Planning
The November 2009 Integrated Resource Plan (IRP) reflects generation and load projections as they were expected to occur at the time of preparation of the IRP and load forecast, including any supplemental capacity needed to meet the reliability standards of PJM and Reliability First over the forecast period and any Interruptible Load Resources (ILR). AP is in the midst of transition to competitive retail markets in Pennsylvania and Maryland. As a result, this IRP represents one of many possible scenarios, based on current statutory and regulatory requirements.
The AP IRP reflects all West Penn Power customers eligible to select an alternative generation supplier as of January 2, 2000 and all Potomac Edison’s Maryland customers eligible to select an alternate generation supplies as of July 1, 2000. In 2007, the Virginia legislature amended the restructuring act, terminating Virginia’s transition to competitive markets, except for customers of 5 MWs or greater and aggregated residential load. West Virginia is not expected to enact retail access (Customer Choice) in the foreseeable future.9 Allegheny Power Planning Philosophy
Mon Power is part of the greater PJM footprint. Numerous system planning benefits are realized as a member and participant of PJM. These benefits include numerous cost savings and efficiencies gained through coordinated regionalized markets and system planning for reliability. The PJM regional transmission organization operates and monitors the markets to effectuate market based solutions for reliability including the Regional Transmission Expansion Planning (RTEP) process with system planning solutions being effectuated through the energy market and the Reliability Pricing Model (RPM) capacity market. 9 PECO recently sold its Virginia jurisdictional service territory to Rappahannock Electric Cooperative and Shenandoah Valley Electric Cooperative.
____________________________________________________________________________________ Public Service Commission – Supply-Demand Forecast for Electric Utilities 2011 - 2020 ‾‾‾‾‾‾‾‾‾‾‾‾‾‾‾‾‾‾‾‾‾‾‾‾‾‾‾‾‾‾‾‾‾‾‾‾‾‾‾‾‾‾‾‾‾‾‾‾‾‾‾‾‾‾‾‾‾‾‾‾‾‾‾‾‾‾‾‾‾‾‾‾‾‾‾‾‾‾‾‾‾‾‾‾‾‾‾‾‾‾‾‾‾‾‾‾‾‾‾‾‾‾‾‾‾‾‾‾‾‾‾‾‾‾‾‾‾‾‾‾‾‾‾‾‾‾
____________________________________________________________________________________ Page 37 ‾‾‾‾‾‾‾‾‾‾‾‾‾‾‾‾‾‾‾‾‾‾‾‾‾‾‾‾‾‾‾‾‾‾‾‾‾‾‾‾‾‾‾‾‾‾‾‾‾‾‾‾‾‾‾‾‾‾‾‾‾‾‾‾‾‾‾‾‾‾‾‾‾‾‾‾‾‾‾‾‾‾‾‾‾‾‾‾‾‾‾‾‾‾‾‾‾‾‾‾‾‾‾‾‾‾‾‾‾‾‾‾‾‾‾‾‾‾‾‾‾‾‾‾‾‾

The Reserve Requirement Study, which is performed on an annual basis by PJM to support an average loss of load expectation of once every ten years, is the criteria used to determine the planning parameters for the RPM capacity market. This study provides a ten-year projection consistent with RFC and NERC standards for resource planning reserve requirements for all PJM shared reserve group members. PJM’s study currently recommends an RTO average installed Reserve Margin of 15.5% for the 2012 / 2013 delivery year and 15.3% for the 2013 / 2014 and 2014 / 2015 delivery years. Further, PJM’s study currently estimates an RTO average forecasted 11-year Reserve Margin of 20.6% for the period 2010 through 2020.10 The annual RPM capacity auction provides market signals to participants three years from the auction date. The prices are determined on a regional basis taking into consideration transmission limitations of the various PJM regions. The forward capacity prices developed from these capacity auctions provide a basis for system planning build or buy decisions of the market participants and PJM. Projected Supply Side Resources for AP
Table 8 assumes no planned retirements of generating units by AP in the next ten years. Currently, MPCO plans to meet its RPM capacity obligations using its owned assets and through participation in the PJM RPM capacity market. Currently, Allegheny Power has a total of 262 customers with interruptible loads under the PJM ILR program.11 Projected Demand Side Resources for AP
The most recent Allegheny Power load forecast for the West Virginia service territory does not contain any specific estimates of future peak demand or energy impacts from current demand side management (DSM) programs. Any actual impacts from DSM programs are included in the historical load data used to develop the load forecast models. Current PJM programs, which are described below, are reviewed each year in order to determine if a material and predictable amount of load impact is expected in the future from these programs. For the present time, Allegheny Power has determined that because the load reductions from current programs are either voluntary or have not yet been material and predictable, it is not prudent to include any load and energy reduction assumptions based on such programs.
In April of 2002, Allegheny Power turned over functional control of its transmission facilities to PJM and became a member of PJM. Since June 2002, all Allegheny Power
10 2010 PJM Reserve Requirement Study with a 11-year Planning Horizon: 2010 - 2020. http://www.pjm.com/~/media/committees-groups/committees/pc/20101006/20101006-item-08-2010-pjm-reserve-requirement-study.ashx 11 Allegheny Power acts as the Curtailment Service Provider for 4 of the customers.
____________________________________________________________________________________ Public Service Commission – Supply-Demand Forecast for Electric Utilities 2011 - 2020 ‾‾‾‾‾‾‾‾‾‾‾‾‾‾‾‾‾‾‾‾‾‾‾‾‾‾‾‾‾‾‾‾‾‾‾‾‾‾‾‾‾‾‾‾‾‾‾‾‾‾‾‾‾‾‾‾‾‾‾‾‾‾‾‾‾‾‾‾‾‾‾‾‾‾‾‾‾‾‾‾‾‾‾‾‾‾‾‾‾‾‾‾‾‾‾‾‾‾‾‾‾‾‾‾‾‾‾‾‾‾‾‾‾‾‾‾‾‾‾‾‾‾‾‾‾‾
____________________________________________________________________________________ Page 38 ‾‾‾‾‾‾‾‾‾‾‾‾‾‾‾‾‾‾‾‾‾‾‾‾‾‾‾‾‾‾‾‾‾‾‾‾‾‾‾‾‾‾‾‾‾‾‾‾‾‾‾‾‾‾‾‾‾‾‾‾‾‾‾‾‾‾‾‾‾‾‾‾‾‾‾‾‾‾‾‾‾‾‾‾‾‾‾‾‾‾‾‾‾‾‾‾‾‾‾‾‾‾‾‾‾‾‾‾‾‾‾‾‾‾‾‾‾‾‾‾‾‾‾‾‾‾

commercial and industrial customers have had the opportunity to participate in PJM demand side programs. Allegheny Power commercial and industrial customers currently have the opportunity to participate in two demand response programs through PJM: the Economic Load Response Program (ELRP) and the Interruptible Load Resource (ILR) program, as described below. The purpose of these programs is to provide customers options to aid in reducing their electricity costs through flexibility in their operations while benefiting the PJM generation market with additional load resources.
The PJM Economic Load Response Program (ELRP) is a voluntary peak load reduction plan that offers financial compensation to customers who can reduce their power consumption during periods of high electrical demand or prices. Participating businesses are paid a percentage of the wholesale cost of power in return for reducing energy consumption, which will lower their overall energy costs. To qualify, customers must have the ability to reduce their electric demand by a minimum of 100 kilowatts (kW) per hour. Enrolled customers may choose to not participate during each event, making participation, and the impact on the load forecast, unpredictable. Because of the voluntary nature of the program, PJM does not include any load reductions from the ELRP program in its load forecast. Similarly, for the present time, Allegheny Power has determined that because the load reductions from this program are voluntary, it is not prudent to include any load and energy reduction assumptions based on the ELRP program.
The PJM Interruptible Load Resource (ILR) Program pays customers if they are called to reduce electrical usage during system emergencies. To participate, customers must agree to be available for up to 10 reductions per year and have the ability to reduce demand by a minimum of 100 kW per hour. These customers must have the ability to reduce metered load when an emergency event is called by PJM. To date, the ILR program has been used twice in the Allegheny Power zone on September 23 and 24, 2010. The impact on Allegheny’s load demand, from each emergency event, has not been quantified. For the present time, Allegheny Power determined that load reductions from this program are currently not material or predictable. Therefore, it is not prudent to include load and energy reduction assumptions based on the ILR program. Allegheny Power is continuing to monitor the impact from the ILR program as it relates to the load forecast.
Allegheny Power is developing an energy efficiency program, which will be filed in March 2011, to offer to its customers in the State of West Virginia. Allegheny Power has also filed, received commission approval and implemented new energy efficiency and conservation programs, as well as demand response programs, in the Maryland and Pennsylvania portions of its service territory. As these programs are implemented, the impacts are being included in future load forecasts.
____________________________________________________________________________________ Public Service Commission – Supply-Demand Forecast for Electric Utilities 2011 - 2020 ‾‾‾‾‾‾‾‾‾‾‾‾‾‾‾‾‾‾‾‾‾‾‾‾‾‾‾‾‾‾‾‾‾‾‾‾‾‾‾‾‾‾‾‾‾‾‾‾‾‾‾‾‾‾‾‾‾‾‾‾‾‾‾‾‾‾‾‾‾‾‾‾‾‾‾‾‾‾‾‾‾‾‾‾‾‾‾‾‾‾‾‾‾‾‾‾‾‾‾‾‾‾‾‾‾‾‾‾‾‾‾‾‾‾‾‾‾‾‾‾‾‾‾‾‾‾
____________________________________________________________________________________ Page 39 ‾‾‾‾‾‾‾‾‾‾‾‾‾‾‾‾‾‾‾‾‾‾‾‾‾‾‾‾‾‾‾‾‾‾‾‾‾‾‾‾‾‾‾‾‾‾‾‾‾‾‾‾‾‾‾‾‾‾‾‾‾‾‾‾‾‾‾‾‾‾‾‾‾‾‾‾‾‾‾‾‾‾‾‾‾‾‾‾‾‾‾‾‾‾‾‾‾‾‾‾‾‾‾‾‾‾‾‾‾‾‾‾‾‾‾‾‾‾‾‾‾‾‾‾‾‾

AP Reserve Margin Projections
AP expects to purchase any needed supplemental capacity from the wholesale market to meet the required PJM RPM capacity requirement. The required PJM Installed Reserve Margin requirement for the 2010/2011 planning period is 15.6%. Potential Threats to Reliability for AP Restructuring of the Electric Industry
The movement to a competitive electric market will have a profound impact on the electric supply and demand balance throughout the country as well as other reliability issues.
Utility transmission systems were designed to deliver native generation to native load. As deregulation increases and the competitive market develops, utilities and Load Serving Entities (LSE) may increasingly rely on the wholesale market for capacity and energy resources and, as a result, bulk power transfers on the utility transmission systems will continue to be stressed as never before. As residents may view new construction as a way to accommodate sales between distant buyers and sellers and not as necessary to support their local distribution company, competition may increase local opposition to transmission line construction.
Additionally, potential market price volatility in the unregulated power supply industry will foster price uncertainty which may in turn foster regulatory uncertainty and thus present market confusion on the development and purchase of capacity and energy resources for utilities and other wholesale market participants. Environmental Issues
The operations of Allegheny’s owned facilities, including its generation facilities, are subject to various federal, state and local laws, regulations and uncertainties as to air and water quality, hazardous and solid waste disposal and other environmental matters. Compliance may require Allegheny to incur substantial additional costs to modify or replace existing and proposed equipment and facilities. These costs may adversely affect the cost of Allegheny’s future operations.
____________________________________________________________________________________ Public Service Commission – Supply-Demand Forecast for Electric Utilities 2011 - 2020 ‾‾‾‾‾‾‾‾‾‾‾‾‾‾‾‾‾‾‾‾‾‾‾‾‾‾‾‾‾‾‾‾‾‾‾‾‾‾‾‾‾‾‾‾‾‾‾‾‾‾‾‾‾‾‾‾‾‾‾‾‾‾‾‾‾‾‾‾‾‾‾‾‾‾‾‾‾‾‾‾‾‾‾‾‾‾‾‾‾‾‾‾‾‾‾‾‾‾‾‾‾‾‾‾‾‾‾‾‾‾‾‾‾‾‾‾‾‾‾‾‾‾‾‾‾‾
____________________________________________________________________________________ Page 40 ‾‾‾‾‾‾‾‾‾‾‾‾‾‾‾‾‾‾‾‾‾‾‾‾‾‾‾‾‾‾‾‾‾‾‾‾‾‾‾‾‾‾‾‾‾‾‾‾‾‾‾‾‾‾‾‾‾‾‾‾‾‾‾‾‾‾‾‾‾‾‾‾‾‾‾‾‾‾‾‾‾‾‾‾‾‾‾‾‾‾‾‾‾‾‾‾‾‾‾‾‾‾‾‾‾‾‾‾‾‾‾‾‾‾‾‾‾‾‾‾‾‾‾‾‾‾

Global Climate Change
The United States relies on coal-fired power plants for more than 45 percent of its energy. However, coal-fired power plants have been under increased scrutiny because of their emission of gases implicated in climate change, primarily carbon dioxide, or “CO2.”
Allegheny produces more than 90 percent of its electricity at coal-fired facilities and currently produces approximately 45 million tons of CO2 annually through its energy production. While there are many unknowns concerning the final regulation of GHG in the United States, federal and/or state legislation and implementing regulations addressing climate change likely will be adopted some time in the future, and may include limits on emissions of CO2. Thus, CO2 legislation and regulation, if not reasonably designed, could have a significant adverse impact on Allegheny’s operations. Several legislative initiatives have been introduced in both houses of Congress with varying levels of support but to date, no CO2-specific law has been passed. Allegheny can provide no assurance that limits on CO2 emissions, if imposed, will be set at levels that can accommodate its generation facilities absent the installation of controls.
Concurrently, the U.S. Environmental Protection Agency (the "EPA") is moving to regulate GHG emissions under the Clean Air Act of 1970 (the "Clean Air Act"). On December 7, 2009, the EPA announced its Greenhouse Gas Endangerment Finding, stating that GHG emissions from cars and light trucks, when mixed in the atmosphere, endanger public health. The finding provides the EPA with a basis on which to regulate GHG emissions from vehicle tailpipes under the provisions of the Clean Air Act. Once a pollutant is regulated under the Clean Air Act for one source category, the EPA has authority to apply similar regulations to other source categories. On April 1, 2010, the EPA and the Department of Transportation's National Highway Traffic Safety Administration ("NHTSA") announced a joint final rule that applies to passenger cars, light-duty trucks and medium-duty passenger vehicles, covering model years 2012 through 2016. Under the Clean Air Act, regulation of GHG emissions from vehicles also triggers requirements for new and modified stationary sources to control greenhouse gas emissions under the Prevention of Significant Deterioration ("PSD") program. Regulation of the stationary sources will be implemented through the final version of the "Tailoring Rule" issued on June 3, 2010. The Tailoring Rule will become effective on January 2, 2011. For six months, only new and modified sources already required to control emissions of other air pollutants will be required to control GHG emissions. Beginning July 2, 2011, new sources above 100,000 tons per year and modified existing sources with emissions above 75,000 tons per year will be required to control emissions.
There is a gap between the current capabilities of technology and the desired GHG reduction levels in the currently proposed legislation and regulation. There is no existing
____________________________________________________________________________________ Public Service Commission – Supply-Demand Forecast for Electric Utilities 2011 - 2020 ‾‾‾‾‾‾‾‾‾‾‾‾‾‾‾‾‾‾‾‾‾‾‾‾‾‾‾‾‾‾‾‾‾‾‾‾‾‾‾‾‾‾‾‾‾‾‾‾‾‾‾‾‾‾‾‾‾‾‾‾‾‾‾‾‾‾‾‾‾‾‾‾‾‾‾‾‾‾‾‾‾‾‾‾‾‾‾‾‾‾‾‾‾‾‾‾‾‾‾‾‾‾‾‾‾‾‾‾‾‾‾‾‾‾‾‾‾‾‾‾‾‾‾‾‾‾
____________________________________________________________________________________ Page 41 ‾‾‾‾‾‾‾‾‾‾‾‾‾‾‾‾‾‾‾‾‾‾‾‾‾‾‾‾‾‾‾‾‾‾‾‾‾‾‾‾‾‾‾‾‾‾‾‾‾‾‾‾‾‾‾‾‾‾‾‾‾‾‾‾‾‾‾‾‾‾‾‾‾‾‾‾‾‾‾‾‾‾‾‾‾‾‾‾‾‾‾‾‾‾‾‾‾‾‾‾‾‾‾‾‾‾‾‾‾‾‾‾‾‾‾‾‾‾‾‾‾‾‾‾‾‾

commercial-scale technology enabling many of the reduction levels being proposed in national, regional and state proposals. Such technology may not become available prior to future climate control legislation. To the extent commercial-scale technology does become available, Allegheny can not be assured that the technology will be suitable and/or cost effective for installation at Allegheny’s generation facilities. Based on estimates from a 2007 U.S. Department of Energy (DOE) National Electric Technology Laboratory report, it could cost more than $5,500 per kW to replace existing coal-based power generation with fossil fuel stations capable of capturing and sequestering CO2 emissions. However, exact estimates are difficult because of the variance in the legislative proposals and the current lack of deployable technology.
Regardless of the eventual mechanism for limiting CO2 emissions, compliance will be a major and costly challenge for Allegheny, its customers and the region in which it operates. Most notable will be the potential impact on customer bills and disproportionate increases in energy cost in areas that have built their energy and industrial infrastructure over the past century based on coal-fired electric generation.
Because the legislative process and applicable technology each is in its infancy, it is difficult for Allegheny to aggressively implement greenhouse gas emission expenditures until the exact nature and requirements of any regulation are known and the capabilities of control or reduction technologies are more fully understood. Allegheny’s current strategy in response to climate change initiatives focuses on:
maintaining an accurate CO2 emissions data base;
improving the efficiency of its existing coal-burning generation facilities;
following developing technologies for clean-coal energy and for CO2 emission controls at coal-fired power plants, including carbon sequestration;
analyzing options for future energy investment (e.g. renewables, clean-coal, etc.); and
improving demand-side efficiency programs, as evidenced by customer conservation
outreach plans and Allegheny’s Watt Watchers initiatives.
Allegheny’s energy portfolio also includes more than 1,180 MWs of renewable hydroelectric and pumped storage power generation. Allegheny obtained a permit to allow for a limited use of bio-mass (wood chips and saw dust) at one of its coal-fired stations in West Virginia and currently has approval to use waste-tire derived fuel at another of its coal-based power stations in West Virginia.
____________________________________________________________________________________ Public Service Commission – Supply-Demand Forecast for Electric Utilities 2011 - 2020 ‾‾‾‾‾‾‾‾‾‾‾‾‾‾‾‾‾‾‾‾‾‾‾‾‾‾‾‾‾‾‾‾‾‾‾‾‾‾‾‾‾‾‾‾‾‾‾‾‾‾‾‾‾‾‾‾‾‾‾‾‾‾‾‾‾‾‾‾‾‾‾‾‾‾‾‾‾‾‾‾‾‾‾‾‾‾‾‾‾‾‾‾‾‾‾‾‾‾‾‾‾‾‾‾‾‾‾‾‾‾‾‾‾‾‾‾‾‾‾‾‾‾‾‾‾‾
____________________________________________________________________________________ Page 42 ‾‾‾‾‾‾‾‾‾‾‾‾‾‾‾‾‾‾‾‾‾‾‾‾‾‾‾‾‾‾‾‾‾‾‾‾‾‾‾‾‾‾‾‾‾‾‾‾‾‾‾‾‾‾‾‾‾‾‾‾‾‾‾‾‾‾‾‾‾‾‾‾‾‾‾‾‾‾‾‾‾‾‾‾‾‾‾‾‾‾‾‾‾‾‾‾‾‾‾‾‾‾‾‾‾‾‾‾‾‾‾‾‾‾‾‾‾‾‾‾‾‾‾‾‾‾

Allegheny is participating in the dialogue that will shape the regulatory landscape surrounding CO2 emissions. Additionally, Allegheny intends to pursue proven and cost-effective measures to manage its emissions while maintaining an affordable and reliable supply of electricity for its customers. Clean Air Act Compliance
Allegheny Energy’s West Virginia based generation complies with the Clean Air Act Amendments of 1990 (CAAA) through the installation and use of various emission reduction controls on its stations and/or operational constraints (use of varying types of fuels) in accord with all applicable state and federal regulations to primarily control the emissions of nitrogen oxides (NOx) and sulfur dioxide (SO2). Allegheny Energy utilizes a NOx Averaging Plan filed with both the West Virginia Department of Environmental Protection and the U.S. EPA. This plan is updated every five years. Currently Allegheny Power is responsible for complying with the Acid Rain Program (ARP) and Clean Air Interstate Rules (CAIR) relative to the Clean Air Act Amendments of 1990.
Allegheny Energy’s generation assets meet the existing CAIR ozone season and annual NOx reduction requirements by using low NOx burners, Selective Catalytic Reduction (SCR), Selective Non-Catalytic Reduction trim (SNCR-trim), over-fired air, and optimization software. Compliance is achieved through the surrender of CAIR annual and CAIR ozone NOx allowances to the West Virginia Department of Environmental Protection equivalent to NOx emissions, in tons, for the mandated regulatory time-frame (May 1 – September 30 for ozone season and January 1 – December 31 for the annual season).
The Acid Rain Program controls SO2 emissions and Allegheny Energy’s generation assets meet those reductions through the use of scrubbers. Compliance is achieved through the surrender of ARP allowances to the U.S. EPA equivalent to SO2 emissions, in tons, for the calendar year.
Allegheny’s compliance with the CAAA has required, and may require in the future, that Allegheny install control technologies on many of its generation facilities at significant cost. The proposed Clean Air Transport Rule ("CATR") released by the EPA on July 6, 2010 may accelerate the need to install this equipment by phasing out a portion of the currently available allowances, limiting trading and accelerating federal emission reduction goals. The proposed CATR replaces certain portions of the Clean Air Interstate Rule that were invalidated by the U.S. Court of Appeals for the District of Columbia Circuit.
Following the February 2008 vacation of EPA’s 2005 Clean Air Mercury Rule ("CAMR") by the U.S. Court of Appeals for the District of Columbia, EPA announced plans to propose a new maximum achievable control technology rule for hazardous air pollutant
____________________________________________________________________________________ Public Service Commission – Supply-Demand Forecast for Electric Utilities 2011 - 2020 ‾‾‾‾‾‾‾‾‾‾‾‾‾‾‾‾‾‾‾‾‾‾‾‾‾‾‾‾‾‾‾‾‾‾‾‾‾‾‾‾‾‾‾‾‾‾‾‾‾‾‾‾‾‾‾‾‾‾‾‾‾‾‾‾‾‾‾‾‾‾‾‾‾‾‾‾‾‾‾‾‾‾‾‾‾‾‾‾‾‾‾‾‾‾‾‾‾‾‾‾‾‾‾‾‾‾‾‾‾‾‾‾‾‾‾‾‾‾‾‾‾‾‾‾‾‾
____________________________________________________________________________________ Page 43 ‾‾‾‾‾‾‾‾‾‾‾‾‾‾‾‾‾‾‾‾‾‾‾‾‾‾‾‾‾‾‾‾‾‾‾‾‾‾‾‾‾‾‾‾‾‾‾‾‾‾‾‾‾‾‾‾‾‾‾‾‾‾‾‾‾‾‾‾‾‾‾‾‾‾‾‾‾‾‾‾‾‾‾‾‾‾‾‾‾‾‾‾‾‾‾‾‾‾‾‾‾‾‾‾‾‾‾‾‾‾‾‾‾‾‾‾‾‾‾‾‾‾‾‾‾‾

emissions from electric utility steam generating units in the first half of 2011. The EPA plans to finalize the new rule by November 2011. Allegheny is monitoring the EPA's efforts to promulgate hazardous air pollutant rules that will include, but will not be limited to, mercury limits. To establish these standards, the EPA must identify the best performing 12% of sources in each source category and, to that end, issued an information request to members of the fossil fuel-fired generating industry that included a requirement to conduct extensive stack emissions testing on selected generating units. Allegheny conducted stack testing on five of its West Virginia generating units. Depending on the final hazardous air pollution limits set by the EPA, Allegheny could incur significant costs for additional control equipment. Clean Air Act Litigation
In August 2000, Allegheny Energy received a letter from the EPA requesting that it provide information and documentation relevant to the operation and maintenance of the following ten electric generation facilities, which collectively include 22 generation units: Albright, Armstrong, Fort Martin, Harrison, Hatfield’s Ferry, Mitchell, Pleasants, Rivesville, R. Paul Smith and Willow Island. AE Supply and/or Monongahela own these generation facilities. The letter requested information under Section 114 of the Clean Air Act to determine compliance with the Clean Air Act and related requirements, including potential application of the New Source Review (NSR) standards of the Clean Air Act, which can require the installation of additional air emission control equipment when the major modification of an existing facility results in an increase in emissions. AE has provided responsive information to this and a subsequent request.
If NSR requirements are imposed on Allegheny’s generation facilities, in addition to the possible imposition of fines, compliance would entail significant capital investments in emission control technology.
On May 20, 2004, AE, AE Supply, MPCO and West Penn received a Notice of Intent to Sue Pursuant to Clean Air Act §7604 (Notice) from the Attorneys General of New York, New Jersey and Connecticut and from the PA DEP. The Notice alleged that Allegheny made major modifications to some of its West Virginia facilities in violation of the Prevention of Significant Deterioration (PSD) provisions of the Clean Air Act at the following coal-fired facilities: Albright Unit No. 3; Fort Martin Units No. 1 and 2; Harrison Units No. 1, 2 and 3; Pleasants Units No. 1 and 2 and Willow Island Unit No. 2. The Notice also alleged PSD violations at the Armstrong, Hatfield’s Ferry and Mitchell generation facilities in Pennsylvania and identifies PA DEP as the lead agency regarding those facilities. On September 8, 2004, AE, AE Supply, MPCO and West Penn received a separate Notice of Intent to Sue from the Maryland Attorney General that essentially mirrored the previous Notice.
____________________________________________________________________________________ Public Service Commission – Supply-Demand Forecast for Electric Utilities 2011 - 2020 ‾‾‾‾‾‾‾‾‾‾‾‾‾‾‾‾‾‾‾‾‾‾‾‾‾‾‾‾‾‾‾‾‾‾‾‾‾‾‾‾‾‾‾‾‾‾‾‾‾‾‾‾‾‾‾‾‾‾‾‾‾‾‾‾‾‾‾‾‾‾‾‾‾‾‾‾‾‾‾‾‾‾‾‾‾‾‾‾‾‾‾‾‾‾‾‾‾‾‾‾‾‾‾‾‾‾‾‾‾‾‾‾‾‾‾‾‾‾‾‾‾‾‾‾‾‾
____________________________________________________________________________________ Page 44 ‾‾‾‾‾‾‾‾‾‾‾‾‾‾‾‾‾‾‾‾‾‾‾‾‾‾‾‾‾‾‾‾‾‾‾‾‾‾‾‾‾‾‾‾‾‾‾‾‾‾‾‾‾‾‾‾‾‾‾‾‾‾‾‾‾‾‾‾‾‾‾‾‾‾‾‾‾‾‾‾‾‾‾‾‾‾‾‾‾‾‾‾‾‾‾‾‾‾‾‾‾‾‾‾‾‾‾‾‾‾‾‾‾‾‾‾‾‾‾‾‾‾‾‾‾‾

On January 6, 2005, AE Supply and MPCO filed a declaratory judgment action
against the Attorneys General of New York, Connecticut and New Jersey in federal District Court in West Virginia (West Virginia DJ Action). This action requests that the court declare that AE Supply’s and MPCO’s coal-fired generation facilities in Pennsylvania and West Virginia comply with the Clean Air Act. The Attorneys General filed a motion to dismiss the West Virginia DJ Action. It is possible that the EPA and other state authorities may join or move to transfer the West Virginia DJ Action.
On June 28, 2005, the PA DEP and the Attorneys General of New York, New Jersey, Connecticut and Maryland filed suit against AE, AE Supply and the Distribution Companies in the United States District Court for the Western District of Pennsylvania (PA Enforcement Action). This action alleges NSR violations under the federal Clean Air Act and the Pennsylvania Air Pollution Control Act at the Hatfield’s Ferry, Armstrong and Mitchell facilities in Pennsylvania. The PA Enforcement Action appears to raise the same issues regarding Allegheny’s Pennsylvania generation facilities that are before the federal District Court in the West Virginia DJ Action, except that the PA Enforcement Action also includes the PA DEP and the Maryland Attorney General. On January 17, 2006, the PA DEP and the Attorneys General filed an amended complaint. On May 30, 2006, the District Court denied Allegheny’s motion to dismiss the amended complaint. On July 26, 2006, at a status conference, the Court determined that discovery would proceed regarding liability issues, but not remedies. Discovery on the liability phase closed on December 31, 2007, and summary judgment briefing was completed during the first quarter of 2008. On September 2, 2008, the Magistrate Judge issued a Report and Recommendation that all parties’ motions for summary judgment be denied. Objections to this report and responses to those objections have been filed by all parties. The District Court Judge will hear oral argument and then decide whether to accept, reject or modify the Report and Recommendation. A trial date has yet to be scheduled.
In addition to this lawsuit, on September 21, 2007, Allegheny received a Notice of Violation (NOV) from the EPA alleging NSR and PSD violations under the federal Clean Air Act, as well as Pennsylvania and West Virginia state laws. The NOV was directed to AE, MPCO and West Penn and alleges violations at the Hatfield’s Ferry and Armstrong generation facilities in Pennsylvania and the Fort Martin and Willow Island generation facilities in West Virginia. The projects identified in the NOV are essentially the same as the projects at issue for these four facilities in the May 20, 2004 Notice, the West Virginia DJ Action and the PA Enforcement Action.
On April 2, 2007, the United States Supreme Court issued a decision in the Duke Energy case vacating the Fourth Circuit’s decision that had supported the industry’s understanding of NSR requirements and remanded the case to the lower court. The Supreme
____________________________________________________________________________________ Public Service Commission – Supply-Demand Forecast for Electric Utilities 2011 - 2020 ‾‾‾‾‾‾‾‾‾‾‾‾‾‾‾‾‾‾‾‾‾‾‾‾‾‾‾‾‾‾‾‾‾‾‾‾‾‾‾‾‾‾‾‾‾‾‾‾‾‾‾‾‾‾‾‾‾‾‾‾‾‾‾‾‾‾‾‾‾‾‾‾‾‾‾‾‾‾‾‾‾‾‾‾‾‾‾‾‾‾‾‾‾‾‾‾‾‾‾‾‾‾‾‾‾‾‾‾‾‾‾‾‾‾‾‾‾‾‾‾‾‾‾‾‾‾
____________________________________________________________________________________ Page 45 ‾‾‾‾‾‾‾‾‾‾‾‾‾‾‾‾‾‾‾‾‾‾‾‾‾‾‾‾‾‾‾‾‾‾‾‾‾‾‾‾‾‾‾‾‾‾‾‾‾‾‾‾‾‾‾‾‾‾‾‾‾‾‾‾‾‾‾‾‾‾‾‾‾‾‾‾‾‾‾‾‾‾‾‾‾‾‾‾‾‾‾‾‾‾‾‾‾‾‾‾‾‾‾‾‾‾‾‾‾‾‾‾‾‾‾‾‾‾‾‾‾‾‾‾‾‾

Court rejected the industry’s position on an hourly emissions standard and adopted an annual emissions standard favored by environmental groups. However, the Supreme Court did not specify a testing standard for how to calculate annual emissions and otherwise provided little clarity on whether the industry’s or the government’s interpretation of other aspects of the NSR regulations will prevail. Allegheny intends to vigorously pursue and defend against the Clean Air Act matters described above but cannot predict their outcomes. Canadian Toxic-Tort Class Action
On June 30, 2005, AE Supply, Monongahela and AGC, and18 other companies with coal-fired generation facilities, were named as defendants in a toxic-tort, purported class action lawsuit filed in the Ontario Superior Court of Justice. On behalf of a purported class comprised of all persons residing in Ontario within the past six years (and/or their family members or heirs), the named plaintiffs allege that the defendants negligently failed to prevent their generation facilities from emitting air pollutants in such a manner as to cause death and multiple adverse health effects, as well as economic damages, to the plaintiff class. The plaintiffs seek damages in the approximate amount of Canadian $49.1 billion (approximately US $47.05 billion, assuming an exchange rate of 1.0435 Canadian dollars per US dollar), along with continuing damages in the amount of Canadian $4.1 billion per year and punitive damages of Canadian $1.0 billion (approximately US $3.9 billion and US $958 million, respectively, assuming an exchange rate of 1.0435 Canadian dollars per US dollar) along with such other relief as the court deems just. Allegheny has not yet been served with this lawsuit, and the time for service of the original lawsuit has expired. Allegheny intends to vigorously defend against this action but cannot predict its outcome. Global Warming Class Action
On April 9, 2006, AE, and numerous other companies with coal-fired generation facilities and companies in other industries, were named as defendants in a class action lawsuit in the United States District Court for the Southern District of Mississippi. On behalf of a purported class of residents and property owners in Mississippi who were harmed by Hurricane Katrina, the named plaintiffs allege that the emission of GHG by the defendants contributed to global warming, thereby causing Hurricane Katrina and plaintiffs’ damages. The plaintiffs seek unspecified damages. On December 6, 2006, AE filed a motion to dismiss plaintiffs’ complaint on jurisdictional grounds and then joined a motion filed by other defendants to dismiss the complaint for failure to state a claim. At a hearing on August 30, 2007, the Court granted the motion to dismiss that AE had joined and dismissed all of the plaintiffs’ claims against all defendants. Plaintiffs filed a notice of appeal of that ruling on September 17, 2007. The case has been fully briefed to the United States Court of Appeals for the Fifth Circuit, and oral argument took place on August 6, 2008. Before a decision was issued, the parties were notified that one of the presiding judges had disqualified himself
____________________________________________________________________________________ Public Service Commission – Supply-Demand Forecast for Electric Utilities 2011 - 2020 ‾‾‾‾‾‾‾‾‾‾‾‾‾‾‾‾‾‾‾‾‾‾‾‾‾‾‾‾‾‾‾‾‾‾‾‾‾‾‾‾‾‾‾‾‾‾‾‾‾‾‾‾‾‾‾‾‾‾‾‾‾‾‾‾‾‾‾‾‾‾‾‾‾‾‾‾‾‾‾‾‾‾‾‾‾‾‾‾‾‾‾‾‾‾‾‾‾‾‾‾‾‾‾‾‾‾‾‾‾‾‾‾‾‾‾‾‾‾‾‾‾‾‾‾‾‾
____________________________________________________________________________________ Page 46 ‾‾‾‾‾‾‾‾‾‾‾‾‾‾‾‾‾‾‾‾‾‾‾‾‾‾‾‾‾‾‾‾‾‾‾‾‾‾‾‾‾‾‾‾‾‾‾‾‾‾‾‾‾‾‾‾‾‾‾‾‾‾‾‾‾‾‾‾‾‾‾‾‾‾‾‾‾‾‾‾‾‾‾‾‾‾‾‾‾‾‾‾‾‾‾‾‾‾‾‾‾‾‾‾‾‾‾‾‾‾‾‾‾‾‾‾‾‾‾‾‾‾‾‾‾‾

from participating in the decision. Oral argument before a new panel took place on November 3, 2008, but no decision was recorded at that time. AE intends to vigorously defend against this action but cannot predict its outcome. Claims Related to Alleged Asbestos Exposure
The Distribution Companies have been named as defendants, along with multiple other defendants, in pending asbestos cases alleging bodily injury and do not involve allegations of the manufacture, sale or distribution of asbestos-containing products by Allegheny. Asbestos suits arise out of historical operations related to the installation and removal of asbestos-containing materials at Allegheny’s generation facilities. Historically, Allegheny Power was insured by various foreign and domestic insurers, including Lloyd’s of London. Asbestos-related litigation expenses have been reimbursed in full by recoveries from each insurer; Allegheny Power has adequate insurance to fully respond to each asbestos suit. The existence or pendency of either the asbestos suits or the actions involving its insurance will not have a material impact on its consolidated financial position, results of operations or cash flows. Aging Generation Units
By the end of 2011 all of the active steam units will be over 30 years of age.
____________________________________________________________________________________ Public Service Commission – Supply-Demand Forecast for Electric Utilities 2011 - 2020 ‾‾‾‾‾‾‾‾‾‾‾‾‾‾‾‾‾‾‾‾‾‾‾‾‾‾‾‾‾‾‾‾‾‾‾‾‾‾‾‾‾‾‾‾‾‾‾‾‾‾‾‾‾‾‾‾‾‾‾‾‾‾‾‾‾‾‾‾‾‾‾‾‾‾‾‾‾‾‾‾‾‾‾‾‾‾‾‾‾‾‾‾‾‾‾‾‾‾‾‾‾‾‾‾‾‾‾‾‾‾‾‾‾‾‾‾‾‾‾‾‾‾‾‾‾‾
____________________________________________________________________________________ Page 47 ‾‾‾‾‾‾‾‾‾‾‾‾‾‾‾‾‾‾‾‾‾‾‾‾‾‾‾‾‾‾‾‾‾‾‾‾‾‾‾‾‾‾‾‾‾‾‾‾‾‾‾‾‾‾‾‾‾‾‾‾‾‾‾‾‾‾‾‾‾‾‾‾‾‾‾‾‾‾‾‾‾‾‾‾‾‾‾‾‾‾‾‾‾‾‾‾‾‾‾‾‾‾‾‾‾‾‾‾‾‾‾‾‾‾‾‾‾‾‾‾‾‾‾‾‾‾

Conclusion
Over the ten-year forecast period considered in this report we expect moderate growth in the internal economic and demographic factors affecting electric demand within AP's and MPCO's West Virginia service areas. The major uncertainties are related to the external factors. Both the utilities and Staff foresee a need for generation additions on the AP system in the foreseeable future. The System is planning to satisfy that need through a least cost approach. Additional uncertainty related to environmental issues concerns nitrous oxide and carbon dioxide emissions of coal-fired generating plants. New standards are being proposed at both the national and international level. Adoption of more stringent standards would most likely increase electric generating costs. As noted in a prior report, in 2005, AP filed an application with the Commission for (i) a Certificate of Public Convenience and Necessity (CPCN) to install emissions controls on its Fort Martin Generating Station, and (ii) an order (Financing Order) authorizing AP to utilize securitization financing pursuant to the provisions of W. Va. Code §24-2-4e (Section 4e). On April 7, 2006, and in conjunction with its issuance of the AP Ownership Restructuring Order, the Commission issued a Financing Order granting AP’s request for a CPCN to retrofit the emissions controls technology planned for Ft. Martin and authorizing AP to utilized securitization financing. The installation of emissions controls at Ft. Martin will significantly reduce SO2 emissions at Ft. Martin while enabling AP to utilize West Virginia coal supplies. AP’s ownership restructuring also brings AP’s generation fleet for its West Virginia retail electric load responsibilities fully under the regulatory authority of the Commission.
____________________________________________________________________________________ Public Service Commission – Supply-Demand Forecast for Electric Utilities 2011 - 2020 ‾‾‾‾‾‾‾‾‾‾‾‾‾‾‾‾‾‾‾‾‾‾‾‾‾‾‾‾‾‾‾‾‾‾‾‾‾‾‾‾‾‾‾‾‾‾‾‾‾‾‾‾‾‾‾‾‾‾‾‾‾‾‾‾‾‾‾‾‾‾‾‾‾‾‾‾‾‾‾‾‾‾‾‾‾‾‾‾‾‾‾‾‾‾‾‾‾‾‾‾‾‾‾‾‾‾‾‾‾‾‾‾‾‾‾‾‾‾‾‾‾‾‾‾‾‾
____________________________________________________________________________________ Page 48 ‾‾‾‾‾‾‾‾‾‾‾‾‾‾‾‾‾‾‾‾‾‾‾‾‾‾‾‾‾‾‾‾‾‾‾‾‾‾‾‾‾‾‾‾‾‾‾‾‾‾‾‾‾‾‾‾‾‾‾‾‾‾‾‾‾‾‾‾‾‾‾‾‾‾‾‾‾‾‾‾‾‾‾‾‾‾‾‾‾‾‾‾‾‾‾‾‾‾‾‾‾‾‾‾‾‾‾‾‾‾‾‾‾‾‾‾‾‾‾‾‾‾‾‾‾‾

ALLE
GH
EN
Y P
OW
ER
PR
OJE
CT
ED
WIN
TE
R P
EA
K I
NT
ER
NA
L D
EM
AN
DS
(A
)F
RO
M D
AT
A P
RO
VID
ED
BY
ALLE
GH
EN
Y P
OW
ER
(MW
)
SU
M O
FA
PW
INT
ER
WE
ST
INT
ER
NA
LS
YS
TE
MD
IVE
RS
ITY
WE
ST
VIR
GIN
IAP
EA
K O
FM
PW
V (
C)
MP
CO
(D
)P
EW
V (
E)
PE
CO
(F
)P
EN
N (
G)
PE
AK
DE
MA
ND
SP
EA
K (
H)
AD
JUS
TM
EN
TP
OW
ER
(I)
(1)
(2)
(3)
(4)
(5)
(6)
= (
2)
+ (
4)
+ (
5)
(7)
(8)
= (
6)
- (7
)
08/0
9(B
)1,7
99
1,7
99
836
3,1
91
3,6
71
8,6
61
8,5
27
134
137
09/1
01,6
95
1,6
95
771
2,9
65
3,4
98
8,1
57
8,0
10
148
118
10/1
11,7
13
1,7
13
797
3,0
08
3,4
96
8,2
17
8,0
67
149
119
11/1
21,7
61
1,7
61
820
3,0
57
3,4
92
8,3
10
8,1
58
152
121
12/1
31,8
02
1,8
02
837
3,1
00
3,5
12
8,4
14
8,2
60
154
122
13/1
41,8
34
1,8
34
854
3,1
37
3,6
27
8,5
97
8,4
41
157
123
14/1
51,8
67
1,8
67
872
3,1
73
3,7
11
8,7
51
8,5
92
159
125
15/1
61,8
98
1,8
98
891
3,2
17
3,7
75
8,8
90
8,7
28
162
127
16/1
71,9
24
1,9
24
908
3,2
70
3,8
35
9,0
30
8,8
65
164
128
17/1
81,9
53
1,9
53
926
3,3
25
3,9
01
9,1
80
9,0
13
167
130
18/1
91,9
81
1,9
81
942
3,3
76
3,9
59
9,3
16
9,1
47
170
131
AG
R 0
8/0
9 -
19
/19(%
)1
.01.0
1.2
0.6
0.8
0.7
-0.4
AG
R 0
9/1
0 -
18
/19(%
)1
.71.7
2.2
1.5
1.4
1.5
1.1
NO
TE
S:
1,137
(A)
TH
ES
E V
AL
UE
S R
EP
RE
SE
NT
CO
NN
EC
TE
D L
OA
D D
EL
IVE
RE
D B
Y E
AC
HO
PE
RA
TIN
G C
OM
PA
NY
WIT
HO
UT
RE
GA
RD
TO
GE
NE
RA
TIO
N S
UP
PL
IER
.(B
) A
CT
UA
L.
(C)
BA
SE
D U
PO
N O
CT
OB
ER
20
09
CO
NN
EC
TE
D L
OA
D F
OR
EC
AS
T.
(D)
BA
SE
D U
PO
N O
CT
OB
ER
20
09
CO
NN
EC
TE
D L
OA
D F
OR
EC
AS
T.
(E)
BA
SE
D U
PO
N O
CT
OB
ER
20
09
CO
NN
EC
TE
D L
OA
D
FO
RE
CA
ST
.(F
) B
AS
ED
UP
ON
OC
TO
BE
R 2
00
9 C
ON
NE
CT
ED
LO
AD
F
OR
EC
AS
T.
(G)
BA
SE
D U
PO
N O
CT
OB
ER
20
09 C
ON
NE
CT
ED
LO
AD
F
OR
EC
AS
T.
(H)
BA
SE
D U
PO
N O
CT
OB
ER
20
09
CO
NN
EC
TE
D L
OA
D F
OR
EC
AS
T.
(I)
A
T T
HIS
TIM
E,
WE
ST
VIR
GIN
IA P
OW
ER
TE
RR
ITO
RY
IS
NO
T P
AR
T O
F A
P'S
CO
NT
RO
L A
RE
A,
BU
T R
AT
HE
R I
S S
ER
VE
D T
HR
OU
GH
A S
UP
PL
Y C
ON
TR
AC
T W
ITH
A T
HIR
D-P
AR
TY
SU
PP
LIE
R.
*
The
se v
alu
es
rep
rese
nt
the
conn
ect
ed
loa
d d
eliv
ere
d b
y e
ach
op
era
ting
co
mp
an
y. E
CA
R d
efin
es
con
ne
cte
d lo
ad
as
the
load
se
rve
d b
y a t
ran
smis
sio
n p
rovi
de
r, in
clu
din
g lo
sse
s a
nd
with
out
reg
ard
to
ge
ne
ratio
n s
up
plie
r.
Table No. 7
____________________________________________________________________________________ Public Service Commission – Supply-Demand Forecast for Electric Utilities 2011 - 2020 ‾‾‾‾‾‾‾‾‾‾‾‾‾‾‾‾‾‾‾‾‾‾‾‾‾‾‾‾‾‾‾‾‾‾‾‾‾‾‾‾‾‾‾‾‾‾‾‾‾‾‾‾‾‾‾‾‾‾‾‾‾‾‾‾‾‾‾‾‾‾‾‾‾‾‾‾‾‾‾‾‾‾‾‾‾‾‾‾‾‾‾‾‾‾‾‾‾‾‾‾‾‾‾‾‾‾‾‾‾‾‾‾‾‾‾‾‾‾‾‾‾‾‾‾‾‾
____________________________________________________________________________________ Page 49 ‾‾‾‾‾‾‾‾‾‾‾‾‾‾‾‾‾‾‾‾‾‾‾‾‾‾‾‾‾‾‾‾‾‾‾‾‾‾‾‾‾‾‾‾‾‾‾‾‾‾‾‾‾‾‾‾‾‾‾‾‾‾‾‾‾‾‾‾‾‾‾‾‾‾‾‾‾‾‾‾‾‾‾‾‾‾‾‾‾‾‾‾‾‾‾‾‾‾‾‾‾‾‾‾‾‾‾‾‾‾‾‾‾‾‾‾‾‾‾‾‾‾‾‾‾‾

A
llegh
eny
Pow
er S
yste
m
Win
ter S
easo
n Pr
ojec
ted
Meg
awat
tt Ca
pacit
y an
d De
man
d
Bund
led S
ervi
ce (R
egul
ated
)20
07/0
820
08/0
920
09/1
020
10/1
120
11/1
220
12/1
320
13/1
420
14/1
520
15/1
620
16/1
7
Dem
and-
Side
(MW
) W
est V
irgin
ia M
onon
gahe
la Po
wer
1,69
31,
702
1,70
21,
712
1,72
71,
743
1,75
11,
758
1,76
81,
813
Pot
omac
Edi
son
681
691
700
712
725
740
748
761
773
799
Wes
t Virg
inia
Powe
r10
510
510
510
610
710
710
810
810
811
1To
tal
2 ,46
72,
485
2,49
42,
517
2,54
62,
576
2,59
42,
613
2,63
52,
708
Tota
l (In
cludi
ng 7
.90%
PJM
FPR
) [b]
2,66
22,
681
2,69
12,
715
2,74
72,
779
2,79
92,
819
2,84
32,
922
Supp
ly-S
ide (
MW
)Ow
ned
Capa
city [
c]2,
600
2,60
02,
600
2,60
02,
600
2,60
02,
600
2,60
02,
600
2,60
0PU
RPA
Capa
city [
d]15
515
515
515
515
515
515
515
515
515
5Pu
rcha
sed
(Exc
ess)
Capa
city
[e]
(93)
(74)
(63)
(39)
(8)
2544
6488
168
Activ
e Loa
d M
anag
emen
t [f]
00
00
00
00
00
Tota
l2 ,
662
2,68
12,
691
2,71
52,
747
2,77
92,
799
2,81
92,
843
2,92
2
Gen
erat
ion
Buy-
Back
Pro
gram
[g]
(42)
(42)
(42)
(42)
(42)
(42)
(42)
(42)
(42)
(42)
Defa
ult S
ervi
ce (D
e-Re
gula
ted)
Dem
and-
Side
(MW
) M
aryl
and
1,15
21,
171
1,20
11,
217
1,24
11,
257
1,26
81,
280
1,29
31,
333
Virg
inia
631
635
645
656
669
676
684
692
701
724
Tota
l [a]
5,02
75,
059
5,13
05,
110
4,86
64,
797
4,81
74,
842
4,87
04,
996
Tota
l (In
cludi
ng 7
.90%
PJM
FPR
) [b]
5,42
45,
458
5,53
65,
514
5,25
15,
176
5,19
85,
225
5,25
45,
390
Supp
ly-S
ide (
MW
)Ow
ned
Capa
city [
c]0
00
00
00
00
0PU
RPA
Capa
city [
d]12
612
612
612
612
612
612
612
612
612
6Pu
rcha
sed
(Exc
ess)
Capa
city
[e]
5,28
95,
323
5,40
15,
379
5,11
65,
041
5,06
35,
090
5,12
05,
256
Activ
e Loa
d M
anag
emen
t [f]
99
99
99
99
99
Tota
l5,
424
5,45
85,
536
5,51
45,
251
5,17
65,
198
5,22
55,
254
5,39
0
Gen
erat
ion
Buy-
Back
Pro
gram
[g]
(18)
(18)
(18)
(18)
(18)
(18)
(18)
(18)
(18)
(18)
Tabl
e 8
____________________________________________________________________________________ Public Service Commission – Supply-Demand Forecast for Electric Utilities 2011 - 2020 ‾‾‾‾‾‾‾‾‾‾‾‾‾‾‾‾‾‾‾‾‾‾‾‾‾‾‾‾‾‾‾‾‾‾‾‾‾‾‾‾‾‾‾‾‾‾‾‾‾‾‾‾‾‾‾‾‾‾‾‾‾‾‾‾‾‾‾‾‾‾‾‾‾‾‾‾‾‾‾‾‾‾‾‾‾‾‾‾‾‾‾‾‾‾‾‾‾‾‾‾‾‾‾‾‾‾‾‾‾‾‾‾‾‾‾‾‾‾‾‾‾‾‾‾‾‾
____________________________________________________________________________________ Page 50 ‾‾‾‾‾‾‾‾‾‾‾‾‾‾‾‾‾‾‾‾‾‾‾‾‾‾‾‾‾‾‾‾‾‾‾‾‾‾‾‾‾‾‾‾‾‾‾‾‾‾‾‾‾‾‾‾‾‾‾‾‾‾‾‾‾‾‾‾‾‾‾‾‾‾‾‾‾‾‾‾‾‾‾‾‾‾‾‾‾‾‾‾‾‾‾‾‾‾‾‾‾‾‾‾‾‾‾‾‾‾‾‾‾‾‾‾‾‾‾‾‾‾‾‾‾‾

Notes
for T
able
8
a.
is as
sume
d to o
ccur
in A
ugus
t and
the w
inter
peak
is as
sume
d to o
ccur
in Ja
nuary
of th
e foll
owing
year.
Bund
led S
ervice
load
cons
ists o
f AP
electr
ic cu
stome
rs wh
o do n
ot ha
ve re
tail c
hoice
.
b. c. d. e. f. g. h. i.
Summ
er an
d wint
er pe
ak de
mand
s are
base
d on A
P's sh
are of
the 2
007/2
008 P
JM R
TO pe
ak fo
recas
t and
the A
llegh
eny P
ower
(AP)
For
ecas
t of P
eak D
eman
d and
Net
Powe
r Sup
ply
(LF0
6Q3 -
Octo
ber 2
006)
. AP
defau
lt se
rvice
peak
dema
nds a
re de
rived
from
dive
rsifie
d stat
e (PA
, MD,
VA)
peak
dema
nds a
nd A
P bu
ndled
serv
ice (W
V) pe
ak de
mand
s are
deriv
ed
from
divers
ified
comp
any(
MP
PEW
VP)p
eakd
eman
dsAc
tual p
eak h
our d
eman
ds ha
ve an
equa
l pro
babil
ity of
being
over
or un
der t
he fo
recas
t valu
es du
e to w
eathe
r vari
ation
s. F
or th
e pur
pose
s of t
his re
port,
the s
umme
r pea
k
Defau
lt Se
rvice
load
cons
ists o
f AP
custo
mers
who h
ave c
hoice
and a
re no
t tak
ing se
rvice
from
an al
terna
te ge
nerat
ion su
pplie
r. T
he la
test e
stima
tes of
AP
custo
mers
serv
ed by
To
tal lo
ads i
nclud
e the
PJM
Wes
t For
ecas
t Poo
l Req
uirem
ent (
FPR)
of 7.
90%
. The
se lo
ad va
lues,
in co
njunc
tion w
ith P
JM U
CAP
value
s for
capa
city,
comp
rise t
he P
JM In
stalle
d R e
serv
e Marg
in (IR
M) r
equir
emen
t of 1
5%, w
hich i
s in e
ffect
until
May
31, 2
008.
The g
enera
tion b
uy-b
ack p
rogr
am is
a vo
luntar
y pro
gram
that
enab
les A
P to
buy b
ack e
lectri
c gen
eratio
n cap
acity
from
retai
l cus
tomers
durin
g high
cost
perio
ds. D
ue to
this
prog
ram
being
strict
lyvo
luntar
y,the
seva
luesa
resh
owna
srefe
rence
only
anda
reno
tuse
dinc
alcula
tingP
JMIR
Mreq
uirem
ents.
This
plan r
epres
ents
one o
f man
y pos
sible
futur
es ba
sed o
n cur
rent l
egal
requir
emen
ts. W
hile t
he pl
an is
show
n for
an ex
tende
d peri
od of
time
beca
use o
f fili
ng re
quire
ments
, any
pr
ojecti
onbe
yond
thene
arter
mha
save
rylow
prob
abili
tyof
occu
rrenc
edue
toun
certa
inties
inthe
loadf
orec
asta
ndin
thereg
ulator
yenv
ironm
ent.
Some
value
s may
not s
um ex
actly
due t
o rou
nding
.
As of
Janu
ary 1,
2007
, AP's
gene
ration
capa
city c
onsis
ts of
MP
gene
ration
, alon
g with
MP's
share
of B
ath C
ounty
and O
VEC.
The
capa
city v
alues
liste
d are
Janu
ary an
d Aug
ust 2
007
P JM
UCA
P va
lues.
PURP
A Ca
pacit
y is g
enera
tion p
urch
ased
from
small
powe
r pro
ducti
on an
d cog
enera
tion q
ualif
ying f
acili
ties p
ursu
ant t
o the
Pub
lic U
tility
Reg
ulator
y Poli
cies A
ct of
1978
(PUR
PA).
P U
RPA
gene
ration
is cu
rrentl
y use
d by A
P to
serv
e bun
dled s
ervice
and d
efault
serv
ice lo
ad. T
his ca
pacit
y is b
ased
on P
JM U
CAP
(Unf
orce
d Cap
acity
) valu
es.
Purch
ased
capa
city i
s cap
acity
purch
ases
mad
e by A
P fo
r bun
dled s
ervice
and d
efault
serv
ice lo
ad re
quire
ments
, inclu
ding t
he P
JM In
stalle
d Res
erve M
argin
(IRM
) req
uirem
ent o
f 15%
.
Activ
e Loa
d Man
agem
ent (
ALM
) pro
gram
, whic
h beg
an on
June
1, 20
03, is
base
d on P
JM's
requir
emen
t tha
t a cu
stome
r mus
t be a
ble to
be in
terru
pted w
ithin
two h
ours
for a
mini
mum
____________________________________________________________________________________ Public Service Commission – Supply-Demand Forecast for Electric Utilities 2011 - 2020 ‾‾‾‾‾‾‾‾‾‾‾‾‾‾‾‾‾‾‾‾‾‾‾‾‾‾‾‾‾‾‾‾‾‾‾‾‾‾‾‾‾‾‾‾‾‾‾‾‾‾‾‾‾‾‾‾‾‾‾‾‾‾‾‾‾‾‾‾‾‾‾‾‾‾‾‾‾‾‾‾‾‾‾‾‾‾‾‾‾‾‾‾‾‾‾‾‾‾‾‾‾‾‾‾‾‾‾‾‾‾‾‾‾‾‾‾‾‾‾‾‾‾‾‾‾‾
____________________________________________________________________________________ Page 51 ‾‾‾‾‾‾‾‾‾‾‾‾‾‾‾‾‾‾‾‾‾‾‾‾‾‾‾‾‾‾‾‾‾‾‾‾‾‾‾‾‾‾‾‾‾‾‾‾‾‾‾‾‾‾‾‾‾‾‾‾‾‾‾‾‾‾‾‾‾‾‾‾‾‾‾‾‾‾‾‾‾‾‾‾‾‾‾‾‾‾‾‾‾‾‾‾‾‾‾‾‾‾‾‾‾‾‾‾‾‾‾‾‾‾‾‾‾‾‾‾‾‾‾‾‾‾

Appendix A
Lists Of Maps, Tables, & Charts
Page
Map No. 1 North American Electric Reliability Council 8 Table No. 1 RFC Winter Load Demand Analysis 9 Table No. 2 RFC Summer Load Demand Analysis 10 Table No. 3 AEP System (East Zone) Projected Peak Demand 26-27 Table No. 4 AEP System (East Zone) Projected Capacity Changes 28 Table No. 5 AEP System (East Zone) Projected Capacity Sales and 29-30 Purchases Table No. 6 AEP System (East Zone) Projected Capacity and Demand 31-32 (Summer Season) Table No. 7 AP Projected Gross Winter Peak Demand 49 Table No. 8 AP Projected Capacity and Demand 50-51 Chart No. 1 APCO Existing Plants 54-56 Chart No. 2 APCO Interchange Locations 57-58 Chart No. 3 WPCO Interchange Locations 59 Chart No. 4 MPCO Existing Plants 60 Chart No. 5 MPCO Interchange Locations 61
____________________________________________________________________________________ Public Service Commission – Supply-Demand Forecast for Electric Utilities 2011 - 2020 ‾‾‾‾‾‾‾‾‾‾‾‾‾‾‾‾‾‾‾‾‾‾‾‾‾‾‾‾‾‾‾‾‾‾‾‾‾‾‾‾‾‾‾‾‾‾‾‾‾‾‾‾‾‾‾‾‾‾‾‾‾‾‾‾‾‾‾‾‾‾‾‾‾‾‾‾‾‾‾‾‾‾‾‾‾‾‾‾‾‾‾‾‾‾‾‾‾‾‾‾‾‾‾‾‾‾‾‾‾‾‾‾‾‾‾‾‾‾‾‾‾‾‾‾‾‾
____________________________________________________________________________________ Page 52 ‾‾‾‾‾‾‾‾‾‾‾‾‾‾‾‾‾‾‾‾‾‾‾‾‾‾‾‾‾‾‾‾‾‾‾‾‾‾‾‾‾‾‾‾‾‾‾‾‾‾‾‾‾‾‾‾‾‾‾‾‾‾‾‾‾‾‾‾‾‾‾‾‾‾‾‾‾‾‾‾‾‾‾‾‾‾‾‾‾‾‾‾‾‾‾‾‾‾‾‾‾‾‾‾‾‾‾‾‾‾‾‾‾‾‾‾‾‾‾‾‾‾‾‾‾‾

APPENDIX B
Existing Plants and Summaries of Interchanges
____________________________________________________________________________________ Public Service Commission – Supply-Demand Forecast for Electric Utilities 2011 - 2020 ‾‾‾‾‾‾‾‾‾‾‾‾‾‾‾‾‾‾‾‾‾‾‾‾‾‾‾‾‾‾‾‾‾‾‾‾‾‾‾‾‾‾‾‾‾‾‾‾‾‾‾‾‾‾‾‾‾‾‾‾‾‾‾‾‾‾‾‾‾‾‾‾‾‾‾‾‾‾‾‾‾‾‾‾‾‾‾‾‾‾‾‾‾‾‾‾‾‾‾‾‾‾‾‾‾‾‾‾‾‾‾‾‾‾‾‾‾‾‾‾‾‾‾‾‾‾
____________________________________________________________________________________ Page 53 ‾‾‾‾‾‾‾‾‾‾‾‾‾‾‾‾‾‾‾‾‾‾‾‾‾‾‾‾‾‾‾‾‾‾‾‾‾‾‾‾‾‾‾‾‾‾‾‾‾‾‾‾‾‾‾‾‾‾‾‾‾‾‾‾‾‾‾‾‾‾‾‾‾‾‾‾‾‾‾‾‾‾‾‾‾‾‾‾‾‾‾‾‾‾‾‾‾‾‾‾‾‾‾‾‾‾‾‾‾‾‾‾‾‾‾‾‾‾‾‾‾‾‾‾‾‾

A
ppala
chia
n P
ow
er
Com
pany
E
xist
ing P
lants
AP
Co
Unit
Unit
Unit
Ye
ar
In
Perc
ent
Nam
epla
teC
apabili
tyP
lant N
am
eLoca
tion
No.
Serv
ice
Kin
dF
ue
lO
wn
ers
hip
Capaci
ty (
Kw
)K
w
Kanaw
ha R
iver
Gla
sgow
, W
V1
1953
Ste
am
Coal
100
219,6
88
200,0
00
K
anaw
ha R
iver
Gla
sgow
, W
V2
1953
Ste
am
Coal
100
219,6
88
200,0
00
John E
. A
mos
Sain
t A
lbans,
WV
11
97
1S
team
Coal
10
08
16
,300
800,0
00
Jo
hn E
. A
mos
Sain
t A
lbans,
WV
21
97
2S
team
Coal
10
08
16
,300
800,0
00
John E
. A
mos
Sain
t A
lbans,
WV
31
97
3S
team
Coal
33
.33*
433,0
00
433,0
00
Gle
n L
ynG
len L
yn, W
V5
1944
Ste
am
Coal
100
100,0
00
95,0
00
Gle
n L
ynG
len L
yn, W
V6
1957
Ste
am
Coal
100
237,5
00
240,0
00
Phili
p S
porn
Ghaham
Sta
tion, W
V1
1950
Ste
am
Coal
100
152,5
00
150,0
00
Phili
p S
porn
Ghaham
Sta
tion, W
V3
1951
Ste
am
Coal
100
152,5
00
150,0
00
Clin
ch R
iver
Carb
o, V
A1
195
8S
team
Coal
10
02
37
,500
235,0
00
C
linch
Riv
er
Carb
o, V
A2
195
8S
team
Coal
10
02
37
,500
235,0
00
Clin
ch R
iver
Carb
o, V
A3
196
1S
team
Coal
10
02
37
,500
235,0
00
Mounta
ineer
New
Have
n, W
V1
1980
Ste
am
Coal
100
1,3
00,0
00
1,3
00
,000
Tota
ls
5,1
59,9
76
5,0
73,0
00
* O
hio
Pow
er
Com
pany
ow
ns
66.6
7%
of
the 1
,300,0
00 K
w u
nit
Cha
rt 1
of
3 (
Pa
ge
1 o
f 3
)
____________________________________________________________________________________ Public Service Commission – Supply-Demand Forecast for Electric Utilities 2011 - 2020 ‾‾‾‾‾‾‾‾‾‾‾‾‾‾‾‾‾‾‾‾‾‾‾‾‾‾‾‾‾‾‾‾‾‾‾‾‾‾‾‾‾‾‾‾‾‾‾‾‾‾‾‾‾‾‾‾‾‾‾‾‾‾‾‾‾‾‾‾‾‾‾‾‾‾‾‾‾‾‾‾‾‾‾‾‾‾‾‾‾‾‾‾‾‾‾‾‾‾‾‾‾‾‾‾‾‾‾‾‾‾‾‾‾‾‾‾‾‾‾‾‾‾‾‾‾‾
____________________________________________________________________________________ Page 54 ‾‾‾‾‾‾‾‾‾‾‾‾‾‾‾‾‾‾‾‾‾‾‾‾‾‾‾‾‾‾‾‾‾‾‾‾‾‾‾‾‾‾‾‾‾‾‾‾‾‾‾‾‾‾‾‾‾‾‾‾‾‾‾‾‾‾‾‾‾‾‾‾‾‾‾‾‾‾‾‾‾‾‾‾‾‾‾‾‾‾‾‾‾‾‾‾‾‾‾‾‾‾‾‾‾‾‾‾‾‾‾‾‾‾‾‾‾‾‾‾‾‾‾‾‾‾

____________________________________________________________________________________ Public Service Commission – Supply-Demand Forecast for Electric Utilities 2011 - 2020 ‾‾‾‾‾‾‾‾‾‾‾‾‾‾‾‾‾‾‾‾‾‾‾‾‾‾‾‾‾‾‾‾‾‾‾‾‾‾‾‾‾‾‾‾‾‾‾‾‾‾‾‾‾‾‾‾‾‾‾‾‾‾‾‾‾‾‾‾‾‾‾‾‾‾‾‾‾‾‾‾‾‾‾‾‾‾‾‾‾‾‾‾‾‾‾‾‾‾‾‾‾‾‾‾‾‾‾‾‾‾‾‾‾‾‾‾‾‾‾‾‾‾‾‾‾‾
____________________________________________________________________________________ Page 55 ‾‾‾‾‾‾‾‾‾‾‾‾‾‾‾‾‾‾‾‾‾‾‾‾‾‾‾‾‾‾‾‾‾‾‾‾‾‾‾‾‾‾‾‾‾‾‾‾‾‾‾‾‾‾‾‾‾‾‾‾‾‾‾‾‾‾‾‾‾‾‾‾‾‾‾‾‾‾‾‾‾‾‾‾‾‾‾‾‾‾‾‾‾‾‾‾‾‾‾‾‾‾‾‾‾‾‾‾‾‾‾‾‾‾‾‾‾‾‾‾‾‾‾‾‾‾

____________________________________________________________________________________ Public Service Commission – Supply-Demand Forecast for Electric Utilities 2011 - 2020 ‾‾‾‾‾‾‾‾‾‾‾‾‾‾‾‾‾‾‾‾‾‾‾‾‾‾‾‾‾‾‾‾‾‾‾‾‾‾‾‾‾‾‾‾‾‾‾‾‾‾‾‾‾‾‾‾‾‾‾‾‾‾‾‾‾‾‾‾‾‾‾‾‾‾‾‾‾‾‾‾‾‾‾‾‾‾‾‾‾‾‾‾‾‾‾‾‾‾‾‾‾‾‾‾‾‾‾‾‾‾‾‾‾‾‾‾‾‾‾‾‾‾‾‾‾‾
____________________________________________________________________________________ Page 56 ‾‾‾‾‾‾‾‾‾‾‾‾‾‾‾‾‾‾‾‾‾‾‾‾‾‾‾‾‾‾‾‾‾‾‾‾‾‾‾‾‾‾‾‾‾‾‾‾‾‾‾‾‾‾‾‾‾‾‾‾‾‾‾‾‾‾‾‾‾‾‾‾‾‾‾‾‾‾‾‾‾‾‾‾‾‾‾‾‾‾‾‾‾‾‾‾‾‾‾‾‾‾‾‾‾‾‾‾‾‾‾‾‾‾‾‾‾‾‾‾‾‾‾‾‾‾

Appalachian Power CompanySummary of Interchange Locations
Non-Associated Utilities ContinuedVoltage of
Name of Company Points of Interchange Interchange
Virginia Power Company Roanoke, VA 500kVScottsville, VA 138kVAltavista, VA 138kVRonceverte, WV 138kVPhilpott, VA* 138kVRed Hill, VA* 115kVBearskin, VA* 138kVBanister, VA 138kVBig Island, VA 115kVNew Haven, WV 345kVHuntington, WV 345kV
Public Authorities
Tennesee Valley Authority Near Bristol, TN 138kVKingsport, TN 138kVKingsport, TN 500kVNear Bluff City, TN 500kV
* Serves Local Load or Generation only
Chart No. 2 (Page 2 of 2)
____________________________________________________________________________________ Public Service Commission – Supply-Demand Forecast for Electric Utilities 2011 - 2020 ‾‾‾‾‾‾‾‾‾‾‾‾‾‾‾‾‾‾‾‾‾‾‾‾‾‾‾‾‾‾‾‾‾‾‾‾‾‾‾‾‾‾‾‾‾‾‾‾‾‾‾‾‾‾‾‾‾‾‾‾‾‾‾‾‾‾‾‾‾‾‾‾‾‾‾‾‾‾‾‾‾‾‾‾‾‾‾‾‾‾‾‾‾‾‾‾‾‾‾‾‾‾‾‾‾‾‾‾‾‾‾‾‾‾‾‾‾‾‾‾‾‾‾‾‾‾
____________________________________________________________________________________ Page 57 ‾‾‾‾‾‾‾‾‾‾‾‾‾‾‾‾‾‾‾‾‾‾‾‾‾‾‾‾‾‾‾‾‾‾‾‾‾‾‾‾‾‾‾‾‾‾‾‾‾‾‾‾‾‾‾‾‾‾‾‾‾‾‾‾‾‾‾‾‾‾‾‾‾‾‾‾‾‾‾‾‾‾‾‾‾‾‾‾‾‾‾‾‾‾‾‾‾‾‾‾‾‾‾‾‾‾‾‾‾‾‾‾‾‾‾‾‾‾‾‾‾‾‾‾‾‾

Appala
chia
n P
ow
er
Com
pany
S
um
mary
of
Inte
rcha
nge
Lo
catio
ns
Volta
ge o
fN
am
e o
f C
om
pa
ny
Po
ints
of
Inte
rch
ang
eIn
terc
han
ge
Asso
cia
ted U
tiliti
es
Ohio
Po
wer
Com
pa
ny
Un
de
r T
erm
s o
f th
e I
nte
rcon
nectio
n A
gre
em
en
t (7
/6/1
951
)V
ariou
s
India
na M
ichig
an P
ow
er
Com
opay
Kentu
cky
Pow
er
Com
pany
Co
lum
bus S
outh
ern
Pow
er
Co
mp
an
y*
Non-A
sso
ciate
d U
tiliti
es
Ca
rolin
a P
ow
er
& L
ight
Co
mp
an
yD
anvi
lle,
VA
23
0kV
Kin
gsp
ort
, T
N13
8kV
Kin
gsp
ort
, T
N23
0kV
Duke P
ow
er
Com
pany
Rid
gew
ay,
VA
138kV
Aust
invi
lle, V
A500kV
Monogahela
Poiw
er
Com
pany
Bentr
ee,
WV
138kV
Quin
wood,
WV
138kV
Belm
ont, W
V765kV
* F
orm
erl
y C
olu
mbus a
nd S
outh
ern
Ohio
Ele
ctri
c C
om
pany
whic
h b
ecam
e a
part
of
the A
EP
Sys
tem
in M
ay,
1980
Ch
art
2 (
Pa
ge 1
of
2)
____________________________________________________________________________________ Public Service Commission – Supply-Demand Forecast for Electric Utilities 2011 - 2020 ‾‾‾‾‾‾‾‾‾‾‾‾‾‾‾‾‾‾‾‾‾‾‾‾‾‾‾‾‾‾‾‾‾‾‾‾‾‾‾‾‾‾‾‾‾‾‾‾‾‾‾‾‾‾‾‾‾‾‾‾‾‾‾‾‾‾‾‾‾‾‾‾‾‾‾‾‾‾‾‾‾‾‾‾‾‾‾‾‾‾‾‾‾‾‾‾‾‾‾‾‾‾‾‾‾‾‾‾‾‾‾‾‾‾‾‾‾‾‾‾‾‾‾‾‾‾
____________________________________________________________________________________ Page 58 ‾‾‾‾‾‾‾‾‾‾‾‾‾‾‾‾‾‾‾‾‾‾‾‾‾‾‾‾‾‾‾‾‾‾‾‾‾‾‾‾‾‾‾‾‾‾‾‾‾‾‾‾‾‾‾‾‾‾‾‾‾‾‾‾‾‾‾‾‾‾‾‾‾‾‾‾‾‾‾‾‾‾‾‾‾‾‾‾‾‾‾‾‾‾‾‾‾‾‾‾‾‾‾‾‾‾‾‾‾‾‾‾‾‾‾‾‾‾‾‾‾‾‾‾‾‾
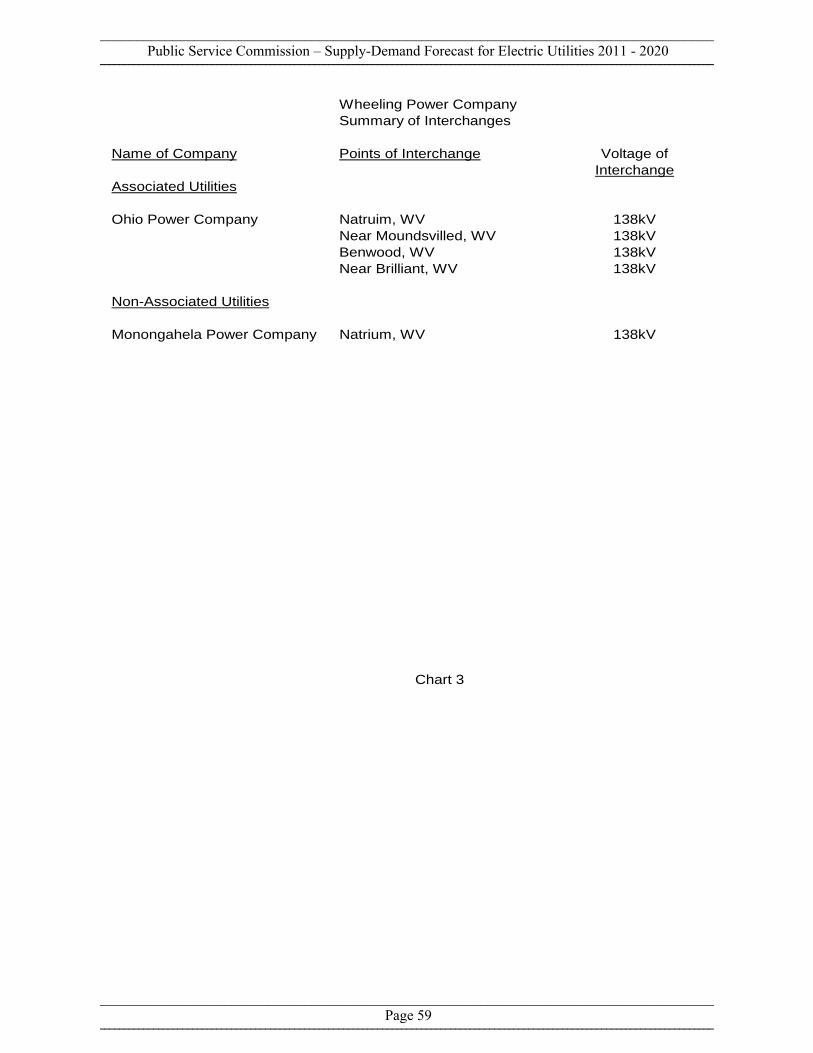
Wheeling Power CompanySummary of Interchanges
Name of Company Points of Interchange Voltage ofInterchange
Associated Utilities
Ohio Power Company Natruim, WV 138kVNear Moundsvilled, WV 138kVBenwood, WV 138kVNear Brilliant, WV 138kV
Non-Associated Utilities
Monongahela Power Company Natrium, WV 138kV
Chart 3
____________________________________________________________________________________ Public Service Commission – Supply-Demand Forecast for Electric Utilities 2011 - 2020 ‾‾‾‾‾‾‾‾‾‾‾‾‾‾‾‾‾‾‾‾‾‾‾‾‾‾‾‾‾‾‾‾‾‾‾‾‾‾‾‾‾‾‾‾‾‾‾‾‾‾‾‾‾‾‾‾‾‾‾‾‾‾‾‾‾‾‾‾‾‾‾‾‾‾‾‾‾‾‾‾‾‾‾‾‾‾‾‾‾‾‾‾‾‾‾‾‾‾‾‾‾‾‾‾‾‾‾‾‾‾‾‾‾‾‾‾‾‾‾‾‾‾‾‾‾‾
____________________________________________________________________________________ Page 59 ‾‾‾‾‾‾‾‾‾‾‾‾‾‾‾‾‾‾‾‾‾‾‾‾‾‾‾‾‾‾‾‾‾‾‾‾‾‾‾‾‾‾‾‾‾‾‾‾‾‾‾‾‾‾‾‾‾‾‾‾‾‾‾‾‾‾‾‾‾‾‾‾‾‾‾‾‾‾‾‾‾‾‾‾‾‾‾‾‾‾‾‾‾‾‾‾‾‾‾‾‾‾‾‾‾‾‾‾‾‾‾‾‾‾‾‾‾‾‾‾‾‾‾‾‾‾

M
onon
gahe
la P
ower
Com
pany
Exi
stin
g R
egul
ated
Pla
nts
MPC
oM
PCo
Reg
ulat
ed
Uni
t Y
ear
In
Perc
ent
Ow
ners
hip
Plan
t Nam
eL
ocat
ion
No.
Serv
ice
Kin
dFu
elO
wne
rshi
pC
apac
ity (
Kw
)*
Alb
righ
tA
lbri
ght,
WV
119
52St
eam
Coa
l10
076
,000
219
52St
eam
Coa
l10
076
,000
319
54St
eam
Coa
l10
014
0,00
0Fo
rt M
artin
Mai
dsvi
lle, W
V1
1967
Stea
mC
oal
100
552,
000
219
68St
eam
Coa
l10
055
5,00
0H
arri
sion
Hay
woo
d, W
V1
1972
Stea
mC
oal
2113
5,76
92
1973
Stea
mC
oal
2113
5,76
93
1974
Stea
mC
oal
2113
5,76
9Pl
easa
nts
Will
ow I
slan
d, W
V1
1979
Stea
mC
oal
849
,985
219
80St
eam
Coa
l8
49,9
85R
ives
ville
Riv
esvi
lle, W
V5
1943
Stea
mC
oal
100
48,0
006
1951
Stea
mC
oal
100
94,0
00W
illow
Isl
and
Will
ow I
slan
d, W
V1
1949
Stea
mC
oal
100
55,0
002
1960
Stea
mC
oal
100
188,
000
Tot
als
2,29
1,27
7
* M
PCo'
s re
gula
ted
capa
city
is b
ased
on
the
perc
enta
ge o
f ow
ners
hip
Cha
rt 4
____________________________________________________________________________________ Public Service Commission – Supply-Demand Forecast for Electric Utilities 2011 - 2020 ‾‾‾‾‾‾‾‾‾‾‾‾‾‾‾‾‾‾‾‾‾‾‾‾‾‾‾‾‾‾‾‾‾‾‾‾‾‾‾‾‾‾‾‾‾‾‾‾‾‾‾‾‾‾‾‾‾‾‾‾‾‾‾‾‾‾‾‾‾‾‾‾‾‾‾‾‾‾‾‾‾‾‾‾‾‾‾‾‾‾‾‾‾‾‾‾‾‾‾‾‾‾‾‾‾‾‾‾‾‾‾‾‾‾‾‾‾‾‾‾‾‾‾‾‾‾
____________________________________________________________________________________ Page 60 ‾‾‾‾‾‾‾‾‾‾‾‾‾‾‾‾‾‾‾‾‾‾‾‾‾‾‾‾‾‾‾‾‾‾‾‾‾‾‾‾‾‾‾‾‾‾‾‾‾‾‾‾‾‾‾‾‾‾‾‾‾‾‾‾‾‾‾‾‾‾‾‾‾‾‾‾‾‾‾‾‾‾‾‾‾‾‾‾‾‾‾‾‾‾‾‾‾‾‾‾‾‾‾‾‾‾‾‾‾‾‾‾‾‾‾‾‾‾‾‾‾‾‾‾‾‾

Mon
onga
hela
Pow
er C
ompa
ny
Sum
mar
y of
Inte
rcha
nge
Loca
tions
Vol
tage
of
Nam
e of
Com
pany
Poi
nts
of In
terc
hang
eIn
terc
hang
e
Ass
ocia
ted
Util
ities
Wes
t Pen
n P
ower
Com
pany
Var
ious
at o
r ne
ar th
e P
enns
ylva
nnia
and
Wes
t Virg
inia
500k
VS
tate
Lin
e13
8kV
The
Pot
omac
Edi
son
Com
pany
Nea
r La
ke L
ynn,
PA
, Alb
right
and
Pet
ersb
urg,
WV
138k
V
Non
-Ass
ocia
ted
Util
ities
PA
, NJ,
MD
(P
JM R
TO
Gro
up)
See
not
e be
low
500k
V, 2
30kV
138k
V, 1
15kV
App
alac
hian
Pow
er C
ompa
nyN
ear
Gilb
oa a
nd G
rass
y F
alls
, WV
138k
VN
ear
Bel
mon
t, W
V73
5kV
Whe
elin
g P
ower
Com
pany
Nea
r N
atriu
m, W
V13
8kV
Nea
r C
hest
er, W
V76
5kV
Ohi
o E
diso
n C
ompa
nyN
ear
Wei
rton
, WV
345k
VD
uque
sne
Ligh
t Com
pany
No
Dire
ct In
terc
onne
ctio
nIn
terc
hang
e oc
curs
thro
ugh
Wes
t Pen
n P
ower
Com
pany
138k
VO
hio
Pow
er C
ompa
nyV
ario
us n
ear
Bev
erly
and
Eas
t Liv
erpo
ol, O
H a
nd n
ear
Mon
ogah
ela
Poi
wer
Com
pany
Mou
ndsv
ille,
Wei
rton
, and
Bee
ch B
otto
m, W
V50
0kV
, 138
kV34
5kV
Virg
inia
Pow
er C
ompa
nyM
ount
Sto
rm, W
V50
0kV
N
ote:
As
a m
embe
r of
PJM
and
thou
gh th
e de
velo
pmen
t of t
he P
JM W
est R
TO
, AP
is o
pera
ted
as a
con
trol
zon
ew
ithin
the
PJM
con
trol
are
a fo
r co
ordi
natio
ng o
f mar
ket o
pera
tions
and
mar
ket s
ettle
men
t
Cha
rt 5
____________________________________________________________________________________ Public Service Commission – Supply-Demand Forecast for Electric Utilities 2011 - 2020 ‾‾‾‾‾‾‾‾‾‾‾‾‾‾‾‾‾‾‾‾‾‾‾‾‾‾‾‾‾‾‾‾‾‾‾‾‾‾‾‾‾‾‾‾‾‾‾‾‾‾‾‾‾‾‾‾‾‾‾‾‾‾‾‾‾‾‾‾‾‾‾‾‾‾‾‾‾‾‾‾‾‾‾‾‾‾‾‾‾‾‾‾‾‾‾‾‾‾‾‾‾‾‾‾‾‾‾‾‾‾‾‾‾‾‾‾‾‾‾‾‾‾‾‾‾‾
____________________________________________________________________________________ Page 61 ‾‾‾‾‾‾‾‾‾‾‾‾‾‾‾‾‾‾‾‾‾‾‾‾‾‾‾‾‾‾‾‾‾‾‾‾‾‾‾‾‾‾‾‾‾‾‾‾‾‾‾‾‾‾‾‾‾‾‾‾‾‾‾‾‾‾‾‾‾‾‾‾‾‾‾‾‾‾‾‾‾‾‾‾‾‾‾‾‾‾‾‾‾‾‾‾‾‾‾‾‾‾‾‾‾‾‾‾‾‾‾‾‾‾‾‾‾‾‾‾‾‾‾‾‾‾