support information package - vitalis kft · food texture analysis support information package page...
TRANSCRIPT

SUPPORTINFORMATION
PACKAGE
Brookfield Viscometers Limited1 Whitehall EstateFlex Meadow, Pinnacles WestHarlow, Essex CM19 5TJ EnglandTel: (44) 1279/451774Fax: (44) 1279/451775Website: www.brookfield.co.uk
Brookfield Engineering Labs., Inc.11 Commerce BoulevardMiddleboro, MA 02346, USATel: 508-946-6200 or 800-628-8139 (USA only)Fax: 508-946-6262Website: www.brookfieldengineering.com
Brookfield

TABLE OF CONTENTS
1. Texture Analysis…A Science to Learn From
2. An Overview to Texture Terminology
3. Probe Specifications
4. Glossary of Common Terminology
5. Quick Reference Glossary of Texture Terminology
6. Illustrated Parameters
Brookfield

SECTION 1: A Science to Learn From
Brookfield

TECHNICAL NOTEFOOD TEXTURE ANALYSIS
Support Information Package Page I-1
Brookfield
TEXTURE ANALYSIS… A SCIENCE TO LEARN FROM
Texture, appearance and flavour are the three major components of foodacceptability[1]. The importance of food texture on consumer perception hasundergone considerable review in recent years, where it has beencategorised into three principle characteristics:
1. MECHANICAL: Relating to a food reaction to stress (force application)2. GEOMETRICAL: Relating to the size, shape and orientation of the
particles within a food3. OTHER: Relating to the perception of moisture and fat contents of a
food[3]
Texture analysis is primarily concerned with the evaluation of mechanicalcharacteristics where a food is subjected to a controlled force from which adeformation curve of its response is generated. These mechanicalcharacteristics can be further sub-divided into primary and secondary sensorycharacteristics.
The parameters highlighted are discussed fully within our in-house publication“A Quick Reference Glossary of Texture Terminology”.
Characterisation of textural parameters is bias to either sensory orinstrumental procedures:
1. SENSORY ANALYSIS: A scientific discipline used to evoke, measure,analyse and interpret reactions to those characteristics of food andmaterials as perceived by the senses of: sight; smell; taste; hearingand touch.
(IFT, USA)
SENSORIAL MECHANICAL PARAMETERS
PRIMARY CHARACTERISTICS SECONDARY CHARACTERISTICS
HARDNESS SOFT⇒ FIRM⇒ HARD
COHESIVENESS CRUMBLY⇒CRUNCHY⇒ BRITTLE
ELASTICITY PLASTIC⇒ ELASTIC
VISCOSITY THIN ⇒ VISCOUS
ADHESIVENESS STICKY ⇒ TACKY ⇒GOOEY
BRITTLENESS
CHEWINESS
GUMMINESS
CRUMBLY⇒CRUNCHY⇒ BRITTLE
TENDER ⇒ CHEWY ⇒TOUGH
SHORT ⇒ MEALLY ⇒PASTY ⇒ GUMMY
(Adapted from [3])

TECHNICAL NOTEFOOD TEXTURE ANALYSIS
Support Information Package Page I-2
Brookfield
2. INSTRUMENTAL TEXTURE ANALYSIS: Is an analytical procedurewhich subjects a sample to known conditions (Stress or Strain) in acontrolled manner from which mechanical characteristics can beinterpreted.
Instrumental procedures are generally more sensitive and reproducible thantheir subjective sensory equivalents where variation in results is generallyattributed to variation in sample heterogeneity rather than instrumentalprecision.
There are two principle approaches to texture analysis adopted by theindustry:
Objective mechanical texture measurements, as employed within textureanalysis are subdivided into 3 categories: Fundamental; Empirical andImitative. Full reference to such definitions can be within the “in-house”publication “An Overview to Texture Terminology”.
Texture analysis is a versatile science which can be applied as a means ofprocess control.
CORRELATION BETWEEN HUMAN ANDINSTRUMENT.Related to sensorial correlation between instrumentand human where both parties are cross-correlatedand trends or patterns observed. The mostcommonly employed method being Texture ProfileAnalysis (TPA)
PROCESS CONTROL AND PRODUCTDEVELOPMENT.Key fundamental characteristics which affect finishedproduct texture (such as moisture content andcompositional quality) are identified throughout theinitial stages of development after which they can beselected for at-line process control measurements.
The formulation of a food product specifies the molecules whichgo into it. The processing of these molecules in turn leads to thedevelopment of “structures” desirable and expected by thecosumer. Most food products are manufactured from ingredients,which again have their own associated structures and a complexpicture of the finished product evolves. It is here that textureanalysis becomes an invaluable tool in the optimisation of productquality, characteristics and eventually process control in wastemanagement.

TECHNICAL NOTEFOOD TEXTURE ANALYSIS
Support Information Package Page I-3
Brookfield
Texture analysis is an integral part of the production chain, generatingbenefits throughout, from Research and Development to ProcessOptimisation and Production. e.g. the generation of higher and lower limitsof acceptance builds the initial precusor for optimal manufacture and wastereduction. It is these at- and off-line measures which are becoming anintegral part of process optimisation and control, where increased product andprocess knowledge has been shown help maintain product quality and thusultimately facilitate CUSTOMER SATISFACTION.
Texture analysis is an integral part of the production chain, generatingbenefits throughout, from Research and Development to ProcessOptimisation and Production. Key fundamental characteristics which affectfinished product texture quality are identified throughout the initial stages ofdevelopment after which they may be selected for at-line process controlmeasurements (e.g. the generation of higher and lower limits of acceptancebuilds the initial precursor for optimal manufacture and waste reduction).
These at- and off-line measures are rapidly becoming an integral part ofprocess optimisation and control, where increased product and processknowledge has been shown to help maintain product quality and thusultimately facilitate CUSTOMER SATISFACTION and REPEAT SALES.
In conclusion, the industry as whole is not utilising texture analysis to its fullpotential as rheological indicator, where tests should be exploited to gain fulladvantage and optimise procative manufacture within the “QUALITYCONTROL LOOP” maximising production efficiency and ultimately profitsthrough production of the right product at the right quality, consistently.
REFERENCES:
[1] Bourne, M. (1978). Texture Profile Analysis. Food Technology. 32 (7), 62-66, 72[2] Borwankar, R. (1992). Food Texture and Rheology. In: Rheology of Foods (Ed. Borwankar, R. and Shoemaker, C.(1992). Elsevier Applied Science Publishers Ltd, Essex, 1-16.[3] Szczesniak, A. (1963). Classification of Textural Characteristics. Journalof Food Science. 28, 981-985.
PRACTICAL APPLICATIONS OF TEXTURE ANALYSIS
PRODUCT DEVELOPMENT
- Scale-up Approval- Specification Development- Shelf-life Trials- Ingredient Changes and
product matching
TEXTUREANALYSIS
PROCESS DEVELOPMENT
- At-Line Process Control- Proactive rather than
Reactive Processing- Process Optimisation- Pipeline and Pump Design
QA & QC SYSTEMS
- Monitoring of Process CRITICAL QUALITY POINTS- Integral part of ISO 9002- Raw material and Supplier
conformance
PRODUCT EVALUATION
- Product Improvements- Sensory Correlations- Texture Profile Analysis- Consumer Studies- Product Matching
(Adapted from[2])

SECTION 2: An Overview to Texture Terminology
Brookfield

Support Information Package Page 2-1
Brookfield
An Overview to Texture Terminology
Food texture is considered as a human experience developed between foodstructure and its response or behaviour when handled. Instrumental methodsare used to objectively quantify mechanical characteristics of food texturewhere scientific apparatus is utilised to quantify a foods reaction to imposedconditions. The conditions imposed are either related to stress (application ofconstant force or load and quantification of distance travelled a response) orstrain (application of constant test distance and quantification of loadresistance as a response). Instrumental measure may only be utilised toquantify the physical aspects of food texture and make no allowance for theinfluence of factors such as physiology or psychology of perception.
Instrumental or mechanical methods for texture measurement are divided intothree classes (Szczesniak, 1963), Fundamental; Empirical and Imitative. Fulldiscussion to these techniques is given within Table 1.
Table. 1. A Breakdown of Experimental Classification
FUNDAMENTAL Fundamental tests measure well-defined physicalproperties and relate these characteristics to well definedphysical properties. These measures are familiar to thoseused by engineers e.g. Poisson’s ratio and other modulisuch as Young’s, Shear and Bulk moduli. Fundamentaltests relate the nature of the tested food in two basicrheological prototypes: A dashpot for Newtonian liquidsand a metal spring for Hookean solid. The complexity offoods means that models encompass both dashpots andsprings linked in series and/or parallel, where the formerallows for recoverable deformation and the latter accountsfor delayed elastic effects.
EMPIRICAL Empirical techniques are used to quantify product specificcharacteristics which can not be expressed in fundamentalrheological quantities. Results obtained from suchprocedures depend on the geometry of the system usedand are thus condition dependant. They cover amiscellany of tests incorporating forces such as puncture,shear and extrusion. Techniques involved, throughpractical experience, have been correlated with texturalqualities (Bourne, 1982), many of which have becomeindustrial standards such as the Bloom Test.
IMITATIVE Tests which attempt to imitate with instruments theconditions to which the food is subjected in the mouth oron the plate (Bourne, 1978). These types of test may beconsidered as an extension to empirical techniques.

Support Information Package Page 2-2
BrookfieldThe majority of food texture analysis is empirical and specific to the
application to which they are applied. Each of the recommended application
studies developed within CNS Farnell are specific to the application which
they have been developed, deviation from product or process recommended
will significantly change the results generated and thus data is no longer
cross-comparable. However, when comparisons are made like for like the
data formed is invaluable as within standard quality assurance practices or in
the development of new products where texture analysis becomes an integral
factor in the prediction and determination of rheological characteristics.
Texture Analysis and Fundamental Measurements:
Rheology characterises forces in relation to size and direction. These vectors
are termed as units of stress and strain.
• Stress is the intensity of force components acting on a material and is
expressed in units of force per unit area (Szczesniak, 1983).
• Strain is the change in size or shape of a body in response to the applied
force. It is a non-dimensional parameter, delineated as a ratio or
percentage, and is expressed as the change in relation to the original size
or shape (Giese, 1995).
A number of commonly employed fundamental tests are given in Table 2, the
first four listed apply to solids, while the fifth applies to fluids. Both the QTS
and LFRA TA are capable of calculating such parameters provided that
deformations are made within the linear region of elasticity (1-3% for
viscoelastic materials such as most foods). Samples must also be uniform in
both shape and consistency e.g. are isotropic, whilst measurements are made
at sufficiently low speed to permit accurate generation. Where all of these
conditions are not available the modulus of deformability has been utilised
where true-stress:true-strain ratios are calculated based on the expansion of
the sample caused through compression.

Support Information Package Page 2-3
Brookfield
Table. 2. Commonly Employed Fundamental Tests
Eq. No. Fundamental Test Factors Units
1 Young’s modulus of elasticity(E)(Longitudinal Compression
or extension)
StressStrain
F/A∆L/L
2 Shear Modulus (G)(Lateral Shear Deformation)
Shear StressShear Strain
F/Aγ/L
3 Bulk Modulus (K) Hydrostatic PressureVolume Strain
P∆V/V
4 Poisson’s Ratio µ Change in width per unit widthChange in length per unit length
∆D/D∆L/L
When the volume is unchanged during test, µ = _. If volume decreases, µ < _.
5 Viscosity σ/•γWhere F is applied force, A is cross-section area, L is unstressed length, ∆L is change in lengthcaused by the application of force F, γ is displaced (shear modulus), P is pressure, V is volume, Dis diameter, σ is shear stress (viscosity) and •γ is shear rate (viscosity)
(Adapted from Bourne, 1982)
Small Deformation:
Peleg (1976) stated that a rheological model should be capable of predicting
real material behaviour under any force-deformation history. To achieve this
goal, the model parameters might be functions time (t) and stress (σ) or strain
(ε). Provided that the magnitude of σ or ε is below certain limits, the
mechanical properties may depend on time only, thus leading to so called
linear elastic materials (Mancini, Moresi and Rancini, 1999). This region is
thought to be at less than 1% of original sample height in foods and is the
region where the food behaves as an ideal elastic material e.g. deformation
(strain) occurs instantaneously when stress is applied and disappears
instantaneously when stress is removed as if it possess a “memory”
(Borwankar, 1992) – This relates to the CNS Farnell Memory Parameter.
Large Deformations:
According to Borwankar (1992) large deformations relate to when stresses
are applied at levels above the yield value. The original shape is not regained
on removal of the applied stress and plastic deformation is exhibited involving
some structural breakdown. At even larger deformations macroscopic fracture
may occur, correlating with the mastication action and subsequent forces
developed within the mouth.

Support Information Package Page 2-4
BrookfieldStress Relaxation Tests:
The viscoelastic properties of solid foods have frequently been demonstrated
by relaxation curves (Peleg, 1979). Stress relaxation experiments involve the
rapid deformation of a sample where subsequent stress at a constant
deformation is measured as a function of time at a constant deformation.
Examples of typical stress relaxation curves for various materials are given in
Fig. 1. Ideally, the material is deformed in a step function, but in practice
deformation always takes time (van Vilet, 1999). Fig. 1 illustrates that
viscoelastic materials decay over a time period, the greater the elasticity of
the sample the shallower the relaxation gradient will appear until pure elastic
behaviour ensues.
The Usefulness of Fundamental Tests:
Fundamental tests are generally slow to perform, do not correlate as well with
sensory evaluation, as do empirical tests and use expensive equipment
(Bourne, 1982). The complexity of fundamental test procedures has limited
their application within the food industry, although they have become an
invaluable tool within the research laboratory.
IDEAL VISCOUS
VISCOELASTIC LIQUID
VISCOELASTIC
IDEAL ELASTIC
TIME
FORCEDeformation
Fig. 1. Stress Relaxation Curves Highlighting Various
(Adapted from Peleg, 1979)

Support Information Package Page 2-5
BrookfieldSzczesniak (1963) described the usefulness of fundamental tests as:
“Since most foodstuffs do not have simple rheological properties that
are independent of stress and strain conditions, and since rheological
properties once measured and defined are not meaningful in a
practical sense unless related to functional properties, fundamental
tests serve the greatest value to the food technologist by providing
bases for the development of more meaningful empirical tests”.
As very few foods exhibit true elastic, viscous or plastic behaviour, but more
often than not a combination of all three, when subjected to stress (Brennan,
1994) the classification of stress and strain is extremely complicated (Bourne,
1982) often showing little correlation with sensorial perception (Mohsenin, et
al, 1977). And as Bourne (1975) aptly reported objective rheology on its own,
is not enough to cover all the texture parameters of interest to the food
technologist.
Imitative Measures:
Food samples inherently possess and exhibit non-dominant textural
characteristics, and it is the perception and interaction of these characteristics
which is unknown (Meullenet, et al, 1998). The perception of food texture
follows a definite pattern regarding the order in which characteristics are
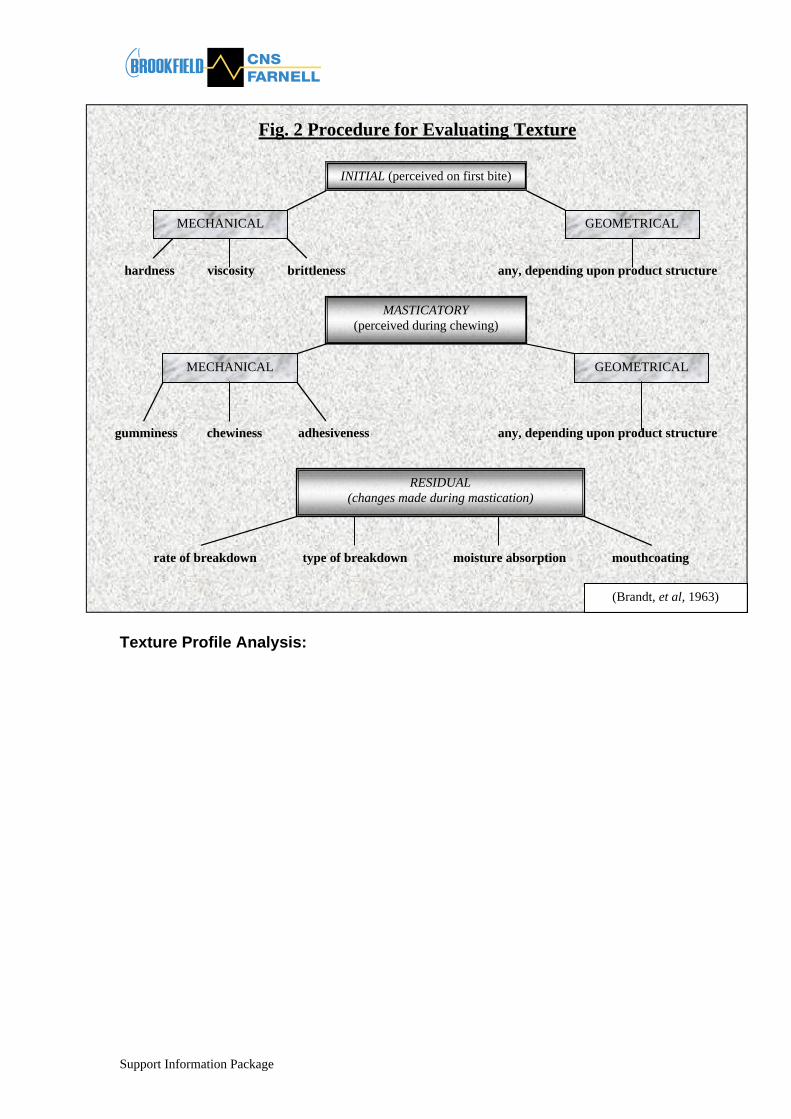
perceived. These characteristics were sub-divided by Brandt, et al, (1963) into
first-bite, masticatory, and residual and are illustrated in Fig. 2. Imitative
instrumental measures of mechanical texture thus attempt to simulate real-life
imposed conditions in a range of applications as diverse as assessing
spreadability of margarine or the effect of extrusion on product consistency.
Support Information Package Page 2-6
Brookfield
Texture Profile Analysis:
Texture Profile Analysis (TPA) evolved through work by General Foods in the
early 60’s where key textural parameters of a wide range of food stuffs were
identified. Mechanical instrumental parameters read from force:deformation
curves and cross compared with sensorial observed characteristics. These
parameters were later adopted and applied by Bourne (1978) using uniaxial
compression within the Instron Universal Testing Machine (IUTM) and in later
studies by additional authors using apparatus such as the QTS-25 and LFRA
TA.
Fig. 2 Procedure for Evaluating Texture
INITIAL (perceived on first bite)
MECHANICAL GEOMETRICAL
hardness viscosity brittleness any, depending upon product structure
MECHANICAL
MASTICATORY(perceived during chewing)
GEOMETRICAL
gumminess chewiness adhesiveness any, depending upon product structure
RESIDUAL(changes made during mastication)
rate of breakdown type of breakdown moisture absorption mouthcoating
(Brandt, et al, 1963)

Support Information Package Page 2-7
Brookfield
TABLE 3. Bourne (1978) Seven TPA Textural Characteristics
CHARACTERISTIC DEFINITIONFRACTURABILITY Defined as the first significant break in the first
compression cycleHARDNESS Peak force of the first compression cycleCOHESIVENESS The ratio of positive force during the second to that
during the first compression (A2/A1)ADHESIVENESS The negative area for the first bite, representing the
work necessary to pull the compressing plunger awayfrom the sample
SPRINGINESS Height that the food recovers during the that elapsesbetween the end of the first bite and the start of thesecond bite
GUMMINESS(SEMI-SOLID)
Calculated parameter: Product of Hardness xCohesiveness
CHEWINESS(SOLID)
Calculated parameter: Product of Gumminess xSpringiness (equivalent to Hardness x Cohesiveness xSpringiness)
The parameters listed in Table 3 have been used as the basis for practically
all subsequent instrumental TPA studies using the IUTM (Pons, et al, 1996). It
is imperative that the mechanical texture characteristics defined by Bourne
(1978) are considered in relation to the sensorial definitions originally defined
by Szczesniak (1963) and given in Fig 3, if valid correlations with sensory
perception are to be made. Units of the seven parameters discussed are
given in Table 4 as listed by Bourne (1978), the table also includes units of
measure noted by Breene (1975).

Support Information Package Page 2-8
Brookfield
Fig. 3. MECHANICAL PROPERTIES AND INTERPRETATION FROM GF TEXTUROMETER
PARAMETER SENSORIAL DEFINITION
PRIMARY CHARACTERISTICS – 5 Basic parameters (viscosity excluded) utilised in determining themanner in which a food handles and behaves in the mouth.
HARDNESS Force required to compress food between molars. Defined as force necessaryto attain a given deformation
ELASTICITY Rate at which a deformed material returns to its undeformed condition afterdeforming force is removed
COHESIVENESS The strength of the internal bonds making up the body of the product. (Greaterthe value the greater the cohesiveness).
Related to the forces of attraction acting between particles of food and opposing disintegration
ADHESIVENESS The work necessary to overcome the attractive forces between the surface ofthe food and the surface of other materials with which the food comes intocontact (e.g. Tongue, Teeth, palate). Work required to pull food away fromsurface.
SECONDARY CHARACTERISTICS – 3 Additional parameters included to make characterisation asmeaningful as possible to individuals accustomed to popular terminology, whilst retaining rheologicalprinciples.
BRITTLENESS Force at which the material fractures. Related to the primary parameters ofhardness and cohesiveness where brittle materials have low cohesiveness.Brittle foods are never adhesive.
CHEWINESS Energy required to chew a SOLID food product to a state where it was readyfor swallowing
GUMMINESS Energy required to disintegrate a SEMISOLID food product to a state ready for
F
t
BRITTLENESSHARDNESS
-ve
+ve
A2
A1
A3
ELASTICITYC-B
C = Time constant for clay
B
Adapted from Rosenthal, 1999; Szczesniak et al. 1963; Szczesniak, 1963)
INSTRUMENTATION

Support Information Package Page 2-9
Brookfield
TABLE 4. Parameter Units of Instrumental TPA
MechanicalParameter
MeasuredVariable
Bourne (1978)Unit
UnitName
Breene (1975)Unit
HARDNESS Force mlt-2 Newton kgCOHESIVENESS Ratio DimensionlessSPRINGINESS Distance l mmADHESIVENESS Work ml-2t-2 JouleFRACTURABILITY Force mlt-2 Newton kgGUMMINESS(SEMI-SOLID)
Force mlt-2 Newton kg
CHEWINESS(SOLID)
Work ml-2t-2 Joule kg mm
Since their original development an expansion and indisputable improvements
to the original terminology has been made. However care should be given to
use of these expanded parameters, where the addition of new ones (e.g.
Hardness 2 (Meullenet, et al, 1997)), have been made without demonstrating
their usefulness (Szczesniak, 1998). It is therefore imperative that all
additional parameters are considered with direct reference to food sample
being evaluated, as was the case with the original classification (Szczesniak,
et al, 1963; Brandt, et al. 1963) and thus retain a defined quantitative method
of evaluation of the mechanical parameters of texture.
Expanded Parameters at CNS Farnell:
The development of the new QTS TexturePro software has incorporated a
number of expanded textural parameters identified by previous authors.
These measures have been shown to have a valid baring on the evaluation of
commercial food products adopting the principles of fundamental, empirical
and imitative techniques in order to facilitate the application of simple and
reproducible tests. The use of such methods marks our continuos dedication
to improving the practical benefits of food textural assessment, whilst
understanding the limitations as well as functional benefits of instrumental
mechanical texture evaluation.

Support Information Package Page 2-10
Brookfield
References:
Bourne, M. (1978). Texture Profile Analysis. Food Technology. 32(7), 62-66,
72.
Bourne, M. (1982). Food Texture and Viscosity: Concept and Measurement.
Academic Press INC, New York.
Bourne, M. (1975). Is Reheology Enough for Food Texture Measurement?
Journal of Texure Studies, 6, 259-262.
Borwankar, R. (1992). Food Texture and Rheology. In Rheology of Foods
(Ed. Borwankar, R. and Shoemaker, C.(1992). Elsevier Applied Science
Publishers Ltd, Essex, 1-16.
Brandt, M., Skinner, E. and Coleman, J. (1963). Texture Profile Method.
Journal of Food Science, 25, 404-409.
Breene, W. (1975). Application of Texture Profile Analysis to Instrumental
Food Texture Evaluation. Journal of Texture Studies, 6 (53-82).
Fiszman, S., Pons, M. and Damasio, M. (1998). New Parameters For
instrumental Texture Profile Analysis: Instantaneous and Retarded
Recoverable Springiness. Journal of Texture Studies, 29, 499-508.
Giese, J. (1995). Measuring Physical Properties of Foods. Food Technology,
Feb, pp 54-63.
Mancini, M., Moresi, M. and Rancini, R. (1999). Uniaxial Compression and
Stress Relaxation Tests on Alginate Gels. Journal of Texture Studies, 30,
639-657.

Support Information Package Page 2-11
BrookfieldMeullenet, J., Lyon, B., Carpenter, J. and Lyon, C. (1997). Bi-cyclical
Instrument for Assessing Texture Profile Parameters and its Relationship to
Sensory Evaluation of Texture. Journal of Texture Studies. 28 101-118.
Meullenet, J., Lyon, B., Carpenter, J. and Lyon, C. (1998) Relationship
Between Sensory and Instrumental Texture Profile Attributes. Journal of
Sensory Studies. 13, 77-93.
Peleg, M. (1976) Texture Profile Analysis Parameters Obtained by an Instron
Universal Testing Machine. Journal of Food Science, 41, 721-722.
Peleg, M. (1979). Characterisation of the Stress Relaxation Curves of Solid
Foods. Journal of Food Science, 44, 277-281.
Pons, M. and Fiszman, S. (1996). Instrumental Texture Profile Analysis with
Particular Reference to Gelled Systems. Journal of Texture Studies. 27, 597-
624.
Smewing, J. (1996). Determination of a Shear Modulus from Penetration
Tests on Gelatin Gels. Mphil Thesis, University of Nottingham, 1996.
Szczesniak,A. (1963). Classification of Textural Characteristics. Journal of
Food Science, 28, 981-985.
Szczesniak, A., Brandt, M. and Freidman, H. (1963). Development of
Standard Rating Scales for Mechanical Parameters and Correlation Between
the Objective and Sensory Texture Measurements. Food Technology. 22, 50-
54.
Szczesniak, A. (1968). Correlations Between Objective and Sensory Texture
Measurements. Food Technology, 22, 981-985.
Szczesniak, A. (1975). General Foods Texture Profile Revisited – Ten Years
Perspective. Journal of Texture Studies, 6, 385-409.

Support Information Package Page 2-12
BrookfieldSzczesniak, A. and Hall, B. (1975). Application of the General Foods
Texturometer to Specific Food Products. Journal of Texture Studies. 6, 117-
138.
Szczesniak, A., Humbaugh, P. and Block, H. (1970). Behaviour of Different
Foods in a Standard Shear-Compression Cell and the Effect of Sample
Weight on Peak Area and Maximum Force. Journal of Texture Studies, 1,
356-387.
Szczesniak, A. (1983). Physical Properties of Foods: What they are and their
Relationship to Other Food Properties. In: Physical Properties of Foods. ed.
M. Peleg and E. Bagley. pp. 1-42. AVI Publishing Co., Inc., Westport, Conn.
(As quoted by Giese, 1995).
Szeczesniak, A. (1987). Review Paper: Correlating Sensory with Instrumental
Texture Measurements – An Overview of Recent Developments. Journal of
Texture Studies, 18, 1-15.
Szczesniak, A. (1998). Letter to the Editor: Issues pertaining to the Texture
Profile Analyisis. Journal of Texture Studies, 29, vii-viii
van Vilet, T. (1999). Rheological Classification of Foods and Instrumental
Techniques for their Study. In: Food Texture Measurement and Perception
(Ed. A. Rosenthal) Aspen Publishers, Inc. USA, 1-17.

SECTION 3: Probe Specifications
Brookfield

TECHNICAL NOTEACCESSORIES AND GENERAL APPLICATIONS
Brookfield
A group of flat ended probes ofvarying diameter between 2mmand 50mm. Cylinder probes areused to perform puncture andpenetration tests in dairy, bakery,fruits and vegetable, meat andmeat products, confectionery andmany other applications wherethey are used to quantify productHardness, Firmness, Yield Pointsand other profile information.Puncture tests impose bothcompression and shear forces andare commonly employed in theidentification of properties such as:• Visco-elastic creep• Compliance (elasticity)• Stress relaxation• Rigidity• Plasicity• Viscosity
Probes are manufactured fromstainless steel, perspex ordelrin. Our comprehensiverange includes:
PROBE REF:1mm ∅ stainless steel TA 452mm ∅ stainless steel TA 393mm ∅ stainless steel TA 424mm ∅ stainless steel TA 445mm ∅ stainless steel TA 356mm ∅ stainless steel TA 417mm∅ stainless steel TA 3610mm ∅ Kobe(1cm2
std. for agar gels)TA 19
_” (6.35mm) ∅ Delrin TA 6_” (12.7mm) ∅Perspex(with radius BS 757)
TA 5
_” (12.7mm) ∅ Delrin(No radius AOAC Bloom)
TA 10
1” (25,4mm) ∅ Perspex(with radius BS 757)
TA 3
1” (25,4mm) ∅ Perspex(No radius AOAC)
TA 11
1_” (38.1mm) Perspex TA 44.5mm ∅ stainlesssteel (Margarine)
TA 40
A range of seven conicalprobes with angles rangingbetween 15o to 90o isavailable for conepenetration tests on samplessuch as butter, margarine,soft cheese and other similarproducts. Results generatedcorrelate well with sensoryperceived spreadability andconsistency.
PROBE REF:15° stainless steel TA 2920° Perspex TA 2730° Perspex TA 1740° Perspex TA 1645° Perspex TA 1560° Perspex TA 290° Perspex TA 32
Spherical or ball probes are availablewith 1mm to 25.4mm ∅ . The rangeincorporates a number of industrialstandards such as the 1” ∅ nylonAvery adhesive test probe. They areutilised in the assessment offracturability characteristic of crisptype products. Such probes are alsoused in the assessment of surfacehardness characteristics throughindentation of cheeses, fruits andpackaging materials.
NEEDLE PROBE:
The needle probe is used withinpuncture tests on foods such asfruit, vegetables and variousconfectionery products. Thesetests quantify parameters suchas skin strength or bio yield infruit or hardness withinchocolate bars.10° taper stainless steel TA 9
COMPRESSIONPLATEN:
Used for compression tests ofstructured products such asbread or cheese where nocontaining vessel is utilised.Compression test denote thatthe sample surface area issmaller than that of the probe.50.8mm (2”) ∅ Perspex TA25
NARROW EDGECUTTING:
Range of shear force probesthat may be used to determinecut characteristics of foods suchas cheese, butter, pastes andpâté.PROBE REF:Perspex Knife Edge TA 7Bar ( 1.8mm ∅ 39mmwide)
TA 22
Cutting Wire (40mm TA 26
CYLINDER PROBES
Hardness
F
DistanceFinal loadFracture Point
Cylinder Biscuit fracture profileusing cylinder probe
CONICAL PROBES
F
Distance
Consistency
Hardness
Conical Comparison of butter andi f d d bili
SPHERICAL PROBES
PROBE REF:1mm ∅ stainless steel TA 312mm ∅ stainless steel TA 283mm ∅ stainless steel TA 3310mm ∅ stainless steel TA 38_” ∅ stainless steel TA 8_” ∅ stainless steel TA 181” ∅ Nylon (Avery test) TA 431” Hemispherical Perspex TA 49
Distance
F
Spherical Measurement offracturability of tortilla type snackproduct
Hardness
Multiplefractures
MISCELLANEOUS
Compression where sample contactarea is smaller than that of probe.
Penetration where sample contactarea is greater than that of probe.

TECHNICAL NOTE - GENERAL PROBE KIT
ACCESSORIES AND GENERAL APPLICATIONS
TA 25/100050mm Ø
TA 4/100038.1mm Ø
TA 11/1000
25.4mm
TA 1012.7mm Ø
TA 512.7mm Ø
TA 1730O TA 15/1000
45OTA 2/1000
60O
TA 4325.4mm Ø
TA 1812.7mm Ø
TA 444mm Ø
TA 392mm Ø
TA 416mm Ø
TA 91.5mm Ø
10O TAPER
TA 2640mm WIRE
TA 760mm BLADE
Brookfield

Support Information Package Page 3-3
SPECIFICATION OF PROBESwithin General Probe Kit
PROBETYPE
DIMENSIONS DESCRIPTION USE
CYLINDERS
TA11 25.4 MM DIA35MM LONG
CLEAR PLASTIC. AOAC BLOOM TEST ON GELATIN,YOGURTS AND DAIRY
TA4 38.1MM DIA20MM LONG.RAD .35- .43MM
CLEAR PLASTIC.BS757 GENERAL USE, YOGURTS, SAUCES,WHIPPED CREAM, MOUSSE,DESSERTS.
TA25 50MM DIA .20MM LONG.RAD .35 - .43MM. BS757.
CLEAR PLASTIC LARGE COMPRESSION PLATEN. USEDIN TPA TYPE ASSESSMENT, STRESSRELAXATION etc.
TA5 12.7MM DIA35MM LONG.RAD .35 - .43MM. BS757.
BLACK ACETATE. GENERAL USE, FRUIT PRESERVES,JAMS.BS757 BLOOM TEST
TA10 12.7MM DIA AOAC35MM LONG.
CLEAR PLASTIC. GENERAL USE, FRUIT PRESERVES,JAMS.AOAC BLOOM TEST
TA39 2MM DIA 20MM LONG.FLAT END
STAINLESS STEEL. GENERAL USE, STANDARDMARGARINE TEST
TA44 4MM DIA 35MM LONG.FLAT END.
STAINLESS STEEL GENERAL USE, LIPSTICKPENETRATION etc.
TA41 6MM DIAM .35MM LONG.
STAINLESS STEEL GENERAL USE. PENETRATION TESTS
CONICAL
TA17 30º. 25MM DIAMETER CLEAR PLASTIC GENERAL USE MARGARINE, BUTTER,MEAT PASTES, ICE-CREAM, SOFTCHEESE
TA15 45º . 30MM DIAMETER. CLEAR PLASTIC GENERAL USE MARGARINE, BUTTER,MEAT PASTES, ICE-CREAM, SOFTCHEESE
TA2 60º. 30MM DIAMETER. CLEAR PLASTIC GENERAL USE, MARGARINE, SPREADS(PRODUCT FLOW)
SPHERICAL
TA18 12.7MM DIA STAINLESS STEEL. GENERAL USE, CRISP FRACTURE,SAMPLE HARDNESS
TA43 25.4MM DIA NYLON. GENERAL USE, AVERY ADHESIVESTANDARD
GENERAL
TA7 KNIFE EDGE60MM WIDE.
CLEAR PLASTIC GENERAL USE, THREE POINT BEND,SNAP TESTS, CUTTING
TA9 NEEDLE PROBE .1.5MM DIAM.46MM LONG.10º MAXIMUM TAPER.
STAINLESS STEEL BITUMEN, TOFFEE, CHOCOLATEHARDNESS, CONFECTIONARY,FRUIT/VEG PUNCTURE,PHARMACEUTICAL TEST.
TA26 40MM WIDE CUTTINGWIRE
ALUMINIUM FRAME GENERAL CUTTING TESTS, CHEESE,BUTTER, PASTES.
. ALL PROBES ARE PRECISION MANUFACTURED TO TOLERANCES OF 0.1% OR BETTER
Brookfield

SECTION 4: Glossary of Common Terminology
Brookfield

TECHNICAL NOTEGLOSSARY OF COMMON TERMINOLOGY
Support Information Package Page 4-1
Brookfield
TERM DEFINITION VISUAL INTERPRETATIONYIELDPOINT
Minimum stress at which the sampleinitiates flow e.g. Bingham Plasticwhere the fluid behave as aNewtonian Fluid once minimumstress is reached. At stresses belowthis minimum level the samplebehaves as an elastic solid(Fig. 1.1).
Few materials behave in the simplemanner of Bingham plastics, andflow above the Yield point is non-Newtonian. It thus very difficult todetermine the exact point of yield,where most consider that thesematerials are fluid at all stressesand that the deformation is too smallto have been observed in the timeavailable. Fig. 1.2. illustrates thatwhen flow above the yield point isfar from Newtonian it is very difficultto identify the point at which flowcommences.
One practical definition wouldbe:Yield stress is the stressbelow which no observabledeformation occurs within thetime available for making theobservation (Prentice, 1995)
FRICTION Resistances between two surfaceswhen parallel plates are moved.
DEFOR-MATION
The change in height of a samplewhen a force is applied.
This is simply the height of theoriginal sample minus the distancetravelled by the probe.
3 types of deformation:1. Compressive2. Tension3. Shearing
VISCOUS Material which follows ideal liquid or viscous behaviourViscous materials start to flow at a certain rate when a stress isapplied, retaining the shape attained at the moment the force wasremoved
ELASTIC Material which follows ideal solid or elastic behaviourElastic materials deform instantaneously to a certain extent whenstress is applied and regain their original shape once the stress isremoved
VISCO-ELASTIC
Material which cannot be classified as either viscous or elastic aspossesses the properties of both
Stress
Fig. 1.2. Herschel and Bulkey Body
DISTANCE
ORIGINALSAMPLEHEIGHT COMPRES
SED ORPENET-RATED
SAMPLE
PROBE OR PLATEN
CHANGE INHEIGHT ORPROBETRAVELDISTANCE
DEFORMATION = ORIGINAL SAMPLEHEIGHT - DISTANCE
TRAVELLED BY PROBE
Shear Rate
Fig. 1.1. Bingham Plastic
Shear Rate
Stress

TECHNICAL NOTEGLOSSARY OF COMMON TERMINOLOGY
Support Information Package Page 4-2
Brookfield
An Analogy of Sample Viscosity:Layers persist within liquids as in a deck of cards, the first layers is the fastestmoving with each proceeding layer moving at a slower rate creating “drag”. It isthis “drag” between the parallel plates which is responsible for sample viscosity.STRESS The intensity of force components
acting on a material expressed inunits of force per unit area.
STRAIN The change in unit size or shape ofa body in response to an appliedforce.
SHEARRATE
Velocity gradient within a fluid generated as a result of an appliedstress. This parameter is expressed in units of reciprocal seconds(sec –1).
Is there anything else you think should be added? Emailus at [email protected] and we’ll gladly include yoursuggestions.
Stress-Strain Plot Showing Slope =Modulus
STRESS Slope = Modulus
STRAIN

SECTION 5: Quick Reference Glossary of Texture Terminology
Brookfield

APPLICATION NOTE
Support Information Package Page 5-1
Brookfield
QUICK REFERENCE GLOSSARY OF TEXTURE TERMINOLOGY.PARAMETER SENSORIAL DEFINITION INSTRUMENTAL DEFINITION UNITS
PARAMETERS AS DENOTED WITHIN ORIGINAL SZCZESNIAK et al (1963) AND BOURNE (1978) TPA WORKPRIMARY 5 basic parameters utilised in determining the manner in which a food handles and behaves in the mouth.HARDNESS Force required to compress a food between the molars.
Defined as force necessary to attain given deformation.Peak force of the first compression cycle.
Max force may occur when sample breaks, or it mayoccur later in the cycle as the sample is flattened anddeformed to a high given deformation.
Newtons(N)
SPRINGINESS Rate at which a deformed material goes back to itsundeformed condition after the deforming force is removed
Height that the food recovers during the time that elapsesbetween the end of the first bite and the start of thesecond bite.
Meters(m)
ADHESIVENESS The work necessary to overcome the attractive forces betweenthe surface of the food and the surface of other materials withwhich the food comes into contact (e.g. tongue, teeth, palate).Work required to pull food away from a surface.
The negative area for the first bite, representing the worknecessary to pull the compressing plunger away from thesample.Positioning of probe must ensure break is formed onretraction.
Joules(J)
COHESIVENESS The strength of internal bonds making up the body of theproduct (greater the value the greater the cohesiveness)
The ratio of positive force during the second to that ofthe first compression cycle (downward strokes only)
RatioDimensionless
VISCOSITY Force required to draw a liquid from a spoon over the tongue Rate of flow per unit forceSECONDARY 3 additional parameters included to make characterisation as meaningful as possible to individuals accustomed to popular terminology,
whilst retaining rheological principles.FRACTURABILITY
(BRITTLENESS)Force at which a material fractures. Related to the primaryparameters of hardness and cohesiveness, where brittlematerials have low cohesiveness. Not all foods fracture andthus value may relate to hardness if only single peak ispresent. Brittle foods are never adhesive.
The first significant break in the first compression cycle.
Taken as first peak force prior to force dropping by atleast 5%.
Newtons(N)
GUMMINESS Energy required to disintegrate a SEMI-SOLID food productto a state ready for swallowing. Related to foods with lowhardness levels.
Calculated parameter: Product of Hardness xCohesiveness
Semi-solid products undergo permanent deformationand have no springiness.
Newtons(N)
CHEWINESS Energy required to chew a SOLID food product to a statewhere it is ready for swallowing. Attribute is difficult toquantify precisely due to complexities of mastication e.g.saliva at body temp. with a variety of force actions (shear,compression, grinding, tearing and penetration).
Calculated Parameter: Product of Gumminess xSpringiness (essentially primary parameters of Hardnessx Cohesiveness x Springiness)
Joules(J)

APPLICATION NOTE
Support Information Package Page 5-2
Brookfield
EXPANDED TPA PARAMETERS (VARIOUS AUTHORS)PARAMETER SENSORIAL DEFINITION INSTRUMENTAL DEFINITION UNITS
ADHESIVE FORCE(Fiszman and Damasio, 2000)
Force required to pull probe from sample Maximum negative force generated during upstroke of probe. Newtons(N)
SPRINGINESS INDEX Ratio of height that the sample springs back after the firstcompression to the maximum deformation selected.
Springiness value divided by deformation.Enables the comparison of samples of different lengths.Interpreted as a recovery property such as relaxation, where:Values of 1 ! Complete recovery e.g. elastic material.Values of 0 ! No recovery of e.g. viscous material.
RatioDimensionless
CHEWINESS INDEX(Evolved from DRAKE,
1966)
Gumminess and chewiness are mutually exclusivetherefore must not confuse.
Gumminess multiplied by springiness index.Will be zero when cohesiveness is zero.
Newtons(N)
AREA(CYCLE 1 and 2)
(BOURNE, 1968, 1974;MASSEY, 1968; BREENE, et
al, 1973)
Internal strength of bonds within a product.
ENCOMPASSES TOTAL POSITIVE AREAS
The work done (energy) during a specified part of the test e.g.total positive area of either cycle 1 or 2.
Joules(J)
HARDNESS 1 WORKDONE
HARDNESS 2 WORKDONE
Internal strength of bonds within a product, related toparameter of consistency. Gives good sampledifferentiation in relation to sample firmness at highstrains when probe:sample contact area is small.
Calculates work done (energy) required to obtain givendeformation to target value e.g. distance or force.
Representative of work invested by instrument in deformingsample e.g. opposite to Recoverable Work Done.
Joules(J)
RESILIANCE(PELEG, 1976)
Measurement of how a sample recovers fromdeformation in relation to speed and forces derivedNot included within TexturePro but can be calculated
Ratio of Recoverable Work Done 1 to Hardness Work Done 1.Representing ratio of recoverable and non-recoverable worknecessary for deformation of sample.
RatioDimensionless
STRINGINESS LENGTH The distance a sample is extended during compressionbefore separation from compression probe.
Distance to peak negative force from point where load crosses0 value in decompression cycle.Provided break between probe and sample is formed
Meters(m)
STRINGINESS WORKDONE
Amount of work exhibited by a sample as it clings tocontact probe during decompression
Negative area between 0 value in decompression cycle andpeak negative force.
Joules(J)

APPLICATION NOTE
Support Information Package Page 5-3
Brookfield
PARAMETER SENSORIAL DEFINITION INSTRUMENTAL DEFINITION UNITSMODULUS OF
DEFORMABILITYCalzada and Peleg (1978);Sanderson, et al, (1988);
Tang, et al, (1995).
Acts as an indication of rigidity or stiffness of thematerial at selected points within stress-strain curve.Traditionally low deformations (less than 10%) areutilised.
Ec = σc/εc = σΤ/εΤ = Modulus of Elasticity from Compression
Ratio of the stress divided by strain during initial part of firstcompression.
Gradient of curve between 20 and 80% (or percentagesselected in Control Window) prior to sample fracture. If nofracture is shown gradient will be recorded to hardness value.
Derived from True Stress-Strain data. (variant of Young’sModulus)True Strain = εΤ = -ln(ho/ho-∆h/ho)True Stress = σΤ= Ft/A0*ho-∆h/ho(ho = original height; ∆h change in height during compression(Pons, et al, 1996).
Pascals(Pa)
CORRECTEDCOHESIVENESS
(PELEG, 1976)
Network invested in the non-recoverable deformations ofthe first and second bites.
Positive area of first compression cycle e.g. where the probeacts upon the sample minus the positive area of thedecompression cycle where the sample acts upon the probe.Calculation is repeated for second cycle to give correctedvalues for both A1 and A2 after which revised A2 is divided byA1.
RatioDimensionless
CORRECTEDPARAMETERS
Corrected parameters of chewiness and gumminess may be calculated utilising revised cohesiveness values based upon network invested incompression.
HARDNESS CYCLE 2 Force necessary to attain given deformation on secondchew. Not fully defined in relation to sensorial andinstrumental correlation.
Peak force of the second compression cycle, post firstdecompression.
The specimen which is subjected to the second bite is the samespecimen at the end of the first bite, its length is the sum of theresidual length after the predetermined deformation and therecovered deformation after the first bite.
Newtons(N)

APPLICATION NOTE
Support Information Package Page 5-4
Brookfield
EXPANSION OF FRACTURABILITY PARAMETERS !!!! ONLY APPLICABLE IF FOOD EXHIBITS FRACTURE CHARACTERISTIC. PARAMETERSGIVE DIRCT INDICATION OF BIOYIELD VALUES IN FRUITS AND VEGETABLES, AND CRISPINESS AND CRUNCHINESS ATTRIBUTES OF HIGH
FRACTURE FOODS e.g. BISCUITS, HONEYCOMBE etc.PARAMETER SENSORIAL DEFINITION INSTRUMENTAL DEFINITION UNITSQUANTITY OFFRACTURES
Related to fracturability parameter, giving goodindication of sample cripiness and crunchiness.
Number of occasions that the load drops off by 5% prior toreaching target value within cycle 1.
Dimensionless
1ST FRACTURE LOADDROP OFF
Decrease in load resultant of initial fracture e.g. forcerequired to puncture skin of fruit etc.
The amount load decreases at the first fracture point e.g.related to 5% force decrease criteria.
Newtons(N)
1ST FRACTUREDEFORMATION
(Drup Munoz, et al, 1986)
Strain or distance required to impose initial fracture ofsample.
Amount of deformation (probe distance travelled) to reachfirst fracture force
Meters(m)
1ST FRACTURE % DEFORMATION
% Strain or distance required to impose initial fracture ofsample relation to original sample height.
1st Fracture Deformation divided by original sample height,multiplied by 100.
Must enter original sample dimensions.
% value
1ST FRACTURE WORKDONE
(Arup Munoz, et al, 1986)
Related to the amount of work required to achievefracture of sample.
Positive area generated between start of compression and firstfracture.
Joules(J)

APPLICATION NOTE
Support Information Package Page 5-5
Brookfield
FUNDAMENTAL AND ASSOCIATED MEASURESPARAMETER SENSORIAL DEFINITION INSTRUMENTAL DEFINITION UNITS
YOUNG’S MODULUS(Unaxial Compression)
Measure of rigidity or stiffness of a material based on theration of stress, below proportional limit, tocorresponding strain
STRESSSTRAIN
F/A∆A/L
F = Applied force; A = Cross-section area;∆L = change in legth caused by application of
force; L = Unstressed length
Pascals(Pa)
STRESS RELAXATION(PELEG, 1979)
Samples are deformed through the application of stress to a pre-determined deformation very quickily and the ensuingstress is measured as a function of time at a constant deformation. Viscoelastic materials exhibit stress decay as timeincreases where resistance of sample to probe gradually decreases.
Seconds(s)
CREEP A constant force (stress) is applied to the sample at t=0 and the deformation is measured as a function of time. The systemexhibits an instantaneous increase in deformation (strain) as stress is applied. On removal of force ideal elastic materialsinstantaneously gain full recovery of their original dimensions. Viscoelastic materials exhibit elastic response as well assteady-state flow and gradually recover former shape and size over time, thus the greater the elastic component the quickerthe recovery.
HENCKY TRUE STRESS True Stress = σΤ= Ft/A0*ho-∆h/ho = F/∏r2 = F(ho-∆h) /∏ro2ho = σc
(ho = original height; ∆h change in height during compression, A0 = Original contact area; Ft = Force at Time; r = Radiusat compression; ro = Original radius; c = Compression)
Pascals(Pa)
HENCKY TRUE STRAIN True Strain = εΤ = -ln(ho/ho-∆h/ho) = εc
(ho = original height; ∆h change in height during compression)Ratio
DimensionlessSHEAR MODULUS(Shear Deformation)
Also known as the rigidity modulus, it is the ratio ofshear stress to the relative sideways displacement ofparallel surfaces (shear strain).
STRESSSTRAIN
F/Aϒ/L
F = Force applied; A = Cross-section area; ϒ =Displaced shear modulus; L = Unstressed
length
Pascals(Pa)

APPLICATION NOTE
Support Information Package Page 5-6
Brookfield
DEFORMATION RELATED MEASURESPARAMETER SENSORIAL DEFINITION INSTRUMENTAL DEFINITION UNITS
% DEFORMATION Change in sample dimensions as a result of applicationof compressing or extension forces.
Related to STRAIN applied to sample
Distance travelled in compressing the sample during cycle 1,divided by original sample length multiplied by 100.
Must enter original sample height into test set-up prior tocommencing compression.
% value
DEFORMATION Change in height of sample when force is applied. Original height of sample minus distance travelled by probefrom trigger. Expressed as % strain in relation to originalheight e.g. distance travelled as 5 original height.
Meters(m)
RECOVERABLEDEFORMATION 1RECOVERABLE
DEFORMATION 2
Height recovered by sample on removal of compressingforce.
Return distance travelled by probe during decompressioncycle from hardness to zero.
MUST MAKE SURE HARDNESS IS ACTULLY AT THEPOINT OF PROBE REVERSAL
Meters(m)
RECOVERABLE WORKDONE 1
RECOVERABLE WORKDONE 2
Representative of recoverable work invested indeformation where sample is acting on probe e.g. workperformed by the sample to the instrument duringdecompression.
Positive area of return stage of compression cycle related tosample springiness. Recoverable Deformations and WorkDone from each cycle will be equal if sample is ideal elastic.Visco- elastic properties of foods dictates that 2nd value mightbe slightly greater and dependant upon time elapsed betweenbites.
Joules(J)

APPLICATION NOTE
Support Information Package Page 5-7
Brookfield
ADDITIONAL MEASURES CALCULATED THROUGH USER DEFINED OPTIONPARAMETER SENSORIAL DEFINITION INSTRUMENTAL DEFINITION UNITS
INSTANTANEOUSSPRINGINESS
Sins acts as an index of ideal elastic materials wherevalues near or equal to 1 indicate the presence of a highelastic component and almost “instantaneous recovery”of their initial height.
Defined from first compression cycle as:
Ratio of distance (or time) recorded during decompression ofa sample to that recorded during its initial compression.
RatioDimensionless
RETARDED SPRINGINESS Sret reflects the characteristics due to viscous behaviourof the sample. In true elastic materials Sret will be equalto Sins.
The value of Sret will always be greater than that of Sins
for a specific percentage of a given system as Sret
includes Sins plus recovery. Where greater Sret to Sins
values persist viscous elements are thought topredominate.
Defined from both compression cycles as:
Ratio of distance (or time) recorded during the secondcompression cycle to that of the first. It is therefore indicativeof the height recovered during the time elapsed between thetwo cycles.
RatioDimensionless
SLOPE INITIAL(Meullenet, et al, 1999)
Sinitial = Slope calculated at the beginning of first compressioncycle (The first 25 (0.5mm displacement) data pointsacquired)
High slope initial values indicate greater resistance to smallstrains, with increased likelihood of breaking when higherstrains are applied.
Rate of change
SLOPE MAX(Meullenet, et al, 1999)
Slope gradients give a direct indication of internal bondstrength, and thus can be related to cohesivenesscharacteristics. Slope values represent initial resistanceto strains applied at low deformation and as a predictorof internal bonding at higher deformations.
Problem with Slope Max at high deformations wherebase effects arise through probe compression againsttexture analyser bed.
Slope max also represents sample hardness where it actsas a projection of what max load would be if strain wascontinued to be applied.
Smax = Max slope calculated from first compression cycle(Selection of data points made through visual assessment:Samples exhibiting yield prior to max load 2mm displacementutilised and 100 points collected; Samples exhibiting no yieldutilised 100 points prior to max force ).
High slope max values indicate to greater resistance to highstrains and therefore do not readily break apart e.g. greatercohesiveness
Rate of change

SECTION 6: Illustrated Parameters
Brookfield

Support Information Package Page 6-1
Brookfield
F
t
Hardness 1 Hardness 2
HARDNESS PARAMETERS
Modulus = calculated from withinlinear region of elasticity.
F
t
Down DownUp Up
Springiness
TRADITIONAL BOURNE (1978) SPRINGINESS
TRADITIONAL BOURNE (1978) ADHESIVENESS (TOTAL NEGATIVE AREA)
F
tAdhesiveness
TRADITIONAL BOURNE (1978) COHESIVENESS
F
t
Down DownUp Up
A1A2
Cohesiveness = A2/A1
ADHESIVE FORCE e.g. Peak Negative Value Indicative of Surface Tackiness
F
t
Down DownUp Up
A1A2
Cohesiveness = A2/A1
POSITIVE AREAS REPRESENTATIVE OF WORKREQUIRED TO ATTAIN DEFORMATION
F
t
Total Positive
Areas
Area 1 Area 2

Support Information Package Page 6-2
Brookfield
RESILIANCE Not included with Version 1 of Texture Pro, however easily within User Defined Functions Option
F
t
Down DownUp Up
HWD 1 RWD 1
Resiliance = RWD1/HWD1
STRINGINESS PARAMETERS
F
t
Stringiness
Length
Stringiness Work Done
PELEG (1976) CORRECTED COHESIVENESS Network Invested by Apparatus
F
t
Down DownUp Up
A1 ∆Α1
Corrected Cohesiveness = (A2-∆Α2)/(Α1-∆Α1)
∆Α2A2
FRACTURE CHARACTERISTICS
F
t1st Fracture Deformation
Fracture Force(First break incompression
cycle)
FRACTURE CHARACTERISTICS (Fracture Work Done, e.g. Work Necessary to Rupture Specimen)
F
t1st Fracture
Work Done
FRACTURE CHARACTERISTICS (FRACTURE LOAD DROP OFF)
F
t
1st Fracture
Load Drop
Off

Support Information Package Page 6-3
Brookfield
PELEG (1976) RECOVERABLE WORK PARAMETERS
F
t
Down DownUp Up
Recoverable
Work Done 1
Recoverable
Work Done 2
PELEG (1976) RECOVERABLE WORK PARAMETERS
F
t
Down DownUp Up
Recoverable
Deformation 1
Recoverable
Deformation 2
WORK INVESTED PARAMETERS (Work Invested by Machine During Compression Cycle)
F
t
Down DownUp Up
Hardness
Work Done 1
Hardness
Work Done 2
WORK INVESTED PARAMETERS (Work Invested by Machine During Compression Cycle)
F
t
Down DownUp Up
Hardness
Deformation 1
Hardness
Deformation 2
STRESS RELAXATION CHARACTERISTICS
Food exhibiting visco-elasticbehaviour, where initial forcedecreases as constantdeformation is maintained
F
Peak Load
(@ selected distance)
Initial relaxation rate
t0t1
Load at
Decompression
Load Relaxation
t
Tackiness
Adhesion
The load after 1 minute (t1 - t0) is expressed as a percentageof peak load, where it provides an indication of system elasticity
DEFORMATION = ORIGINAL SAMPLE HEIGHT - DISTANCE TRAVELLED BY PROBE
ORIGINAL
SAMPLE HEIGHT
COMPRESSED
OR
PENETRATED
SAMPLE
PROBE OR PLATEN
CHANGE IN
HEIGHT OR
PROBE
TRAVEL
DISTANCE
WITH FUNDAMENTALMEASURES ANACCURACY ISSUE ISRAISED WITH USE OFTRIGGER FORCES

Support Information Package Page 6-4
Brookfield
ADDITIONAL PARAMETERS CALCULATEDTHROUGH USER DEFINED OPTION
a bc
Force
Time
Waiting Time
Instantaneous Springiness = Sins = c/aRetarded Springiness = Sret = b/a
(Pons et al, 1996; 1998)
∆A1 ∆A2
A1
A2
Smax
Sinitial