support mechanisms for cofiring secondary fuels mechanisms... · nrel national renewable energy...
TRANSCRIPT

Support mechanisms forcofiring secondary fuels
Nigel S Dong
CCC/211 ISBN 978-92-9029-531-0
December 2012
copyright © IEA Clean Coal Centre
Abstract
This report discusses the enabling and supporting mechanisms for coal/biomass cofiring in selectedcountries that have either considerable operational experience or potential in this technology. Itinvestigates Europe, the USA, Australia and China as case studies and discusses the main supportingincentives adopted in consideration of the specific characteristics of renewable energy markets and thegovernment’s position in clean energy and climate change in each of these countries. As such, thisreport provides not only a policy overview but also a collation of the measures adopted by thepolicymakers in each country to promote cofiring biomass in coal-fired power stations.

Acronyms and abbreviations
2 IEA CLEAN COAL CENTRE
AEEG Authority for Electricity and Gasc Euro cent¢ US centCCL Climate Change LevyCRS Center for Resource Solutions (USA)CDM Clean Development MechanismCFB circulating fluidised bedCHP combined heat and powerDECC Department of Energy and Climate Change (UK)EU ETS European Union Emission Trading SystemEEG Erneuerbare Energien GesetzFYP Five-Year Plan (China)GHG greenhouse gasGSE Gestore Servizi EnergeticiIRR internal rate of returnITC investment tax creditLGC Large-scale Generation CertificateMSW municipal solid wasteMtoe million tonnes of oil equivalentMYPP Multi-Year Programme PlanNREL National Renewable Energy LaboratoryPCC pulverised coal combustionPCT production tax creditpf pulverised fuelPURPA Public Utility Regulatory Policies ActREC Renewable Energy CertificateR&D research and developmentRD&D research, development and demonstrationRPS Renewable Portfolio StandardRO Renewable ObligationROC Renewable Obligation CertificateSDE Stimulering Duurzame EnergieSTC Small-scale Technology CertificateUS DOE Department of Energy (USA)

Contents
3Support mechanisms for cofiring secondary fuels
Acronyms and abbreviations . . . . . . . . . . . . . . . . . . . . . . . . . . . . . . . . . . . . . . . . . . . . . . . . 2
Contents. . . . . . . . . . . . . . . . . . . . . . . . . . . . . . . . . . . . . . . . . . . . . . . . . . . . . . . . . . . . . . . . 3
1 Introduction . . . . . . . . . . . . . . . . . . . . . . . . . . . . . . . . . . . . . . . . . . . . . . . . . . . . . . . . . 5
2 European Union . . . . . . . . . . . . . . . . . . . . . . . . . . . . . . . . . . . . . . . . . . . . . . . . . . . . . . 72.1 EU’s position on biomass energy . . . . . . . . . . . . . . . . . . . . . . . . . . . . . . . . . . . . . 72.2 Biomass resources and utilisation in Europe . . . . . . . . . . . . . . . . . . . . . . . . . . . . 72.3 Biomass cofiring in Europe . . . . . . . . . . . . . . . . . . . . . . . . . . . . . . . . . . . . . . . . . 82.4 Support mechanisms for biomass cofiring in Europe . . . . . . . . . . . . . . . . . . . . . 8
2.4.1 Austria. . . . . . . . . . . . . . . . . . . . . . . . . . . . . . . . . . . . . . . . . . . . . . . . . . . . 92.4.2 Belgium. . . . . . . . . . . . . . . . . . . . . . . . . . . . . . . . . . . . . . . . . . . . . . . . . . . 92.4.3 Denmark . . . . . . . . . . . . . . . . . . . . . . . . . . . . . . . . . . . . . . . . . . . . . . . . . 102.4. 4 Finland . . . . . . . . . . . . . . . . . . . . . . . . . . . . . . . . . . . . . . . . . . . . . . . . . . 112.4.5 Germany . . . . . . . . . . . . . . . . . . . . . . . . . . . . . . . . . . . . . . . . . . . . . . . . . 112.4.6 Italy . . . . . . . . . . . . . . . . . . . . . . . . . . . . . . . . . . . . . . . . . . . . . . . . . . . . . 122.4.7 The Netherlands . . . . . . . . . . . . . . . . . . . . . . . . . . . . . . . . . . . . . . . . . . . 132.4.8 Sweden . . . . . . . . . . . . . . . . . . . . . . . . . . . . . . . . . . . . . . . . . . . . . . . . . . 132.4.9 United Kingdom . . . . . . . . . . . . . . . . . . . . . . . . . . . . . . . . . . . . . . . . . . . 14
2.5 Summary & comments . . . . . . . . . . . . . . . . . . . . . . . . . . . . . . . . . . . . . . . . . . . . 18
3 USA . . . . . . . . . . . . . . . . . . . . . . . . . . . . . . . . . . . . . . . . . . . . . . . . . . . . . . . . . . . . . . 203.1 US energy and climate policies . . . . . . . . . . . . . . . . . . . . . . . . . . . . . . . . . . . . . 203.2 Biopower and biomass cofiring . . . . . . . . . . . . . . . . . . . . . . . . . . . . . . . . . . . . . 213.3 US supporting mechanisms for biomass cofiring. . . . . . . . . . . . . . . . . . . . . . . . 21
3.3.1 PURPA . . . . . . . . . . . . . . . . . . . . . . . . . . . . . . . . . . . . . . . . . . . . . . . . . . 213.3.2 Renewable Portfolio Standard . . . . . . . . . . . . . . . . . . . . . . . . . . . . . . . . 223.3.3 Voluntary green pricing programme. . . . . . . . . . . . . . . . . . . . . . . . . . . . 223.3.4 Renewable Energy Credit . . . . . . . . . . . . . . . . . . . . . . . . . . . . . . . . . . . 243.3.5 GHG offsets . . . . . . . . . . . . . . . . . . . . . . . . . . . . . . . . . . . . . . . . . . . . . . 253.3.6 Biomass cofiring R&D initiative . . . . . . . . . . . . . . . . . . . . . . . . . . . . . . 25
3.4 Tax incentives ineligible for biomass cofiring with coal . . . . . . . . . . . . . . . . . . 263.5 Summary . . . . . . . . . . . . . . . . . . . . . . . . . . . . . . . . . . . . . . . . . . . . . . . . . . . . . . . 26
4 Australia . . . . . . . . . . . . . . . . . . . . . . . . . . . . . . . . . . . . . . . . . . . . . . . . . . . . . . . . . . . 284.1 Bioenergy in Australia . . . . . . . . . . . . . . . . . . . . . . . . . . . . . . . . . . . . . . . . . . . . 284.2 Biomass resources in Australia . . . . . . . . . . . . . . . . . . . . . . . . . . . . . . . . . . . . . . 294.3 Cofiring in Australia . . . . . . . . . . . . . . . . . . . . . . . . . . . . . . . . . . . . . . . . . . . . . . 314.4 Enabling policy incentives . . . . . . . . . . . . . . . . . . . . . . . . . . . . . . . . . . . . . . . . . 324.5 Barriers to cofiring biomass in Australian coal-fired power stations . . . . . . . . . 334.6 Summary . . . . . . . . . . . . . . . . . . . . . . . . . . . . . . . . . . . . . . . . . . . . . . . . . . . . . . . 35
5 China. . . . . . . . . . . . . . . . . . . . . . . . . . . . . . . . . . . . . . . . . . . . . . . . . . . . . . . . . . . . . . 365.1 Coal dominance in China . . . . . . . . . . . . . . . . . . . . . . . . . . . . . . . . . . . . . . . . . . 365.2 China’s position in biomass power . . . . . . . . . . . . . . . . . . . . . . . . . . . . . . . . . . . 37
5.2.1 Five-Year Plans . . . . . . . . . . . . . . . . . . . . . . . . . . . . . . . . . . . . . . . . . . . . 375.2.2 Renewable Energy Law . . . . . . . . . . . . . . . . . . . . . . . . . . . . . . . . . . . . . 385.2.3 Current status of biomass power . . . . . . . . . . . . . . . . . . . . . . . . . . . . . . 38

5.3 Biomass fuel resources . . . . . . . . . . . . . . . . . . . . . . . . . . . . . . . . . . . . . . . . . . . . 395.4 Coal-fired power generation in China . . . . . . . . . . . . . . . . . . . . . . . . . . . . . . . . 395.5 Market potential of biomass cofiring in China. . . . . . . . . . . . . . . . . . . . . . . . . . 415.6 Barriers to uptake of biomass cofiring . . . . . . . . . . . . . . . . . . . . . . . . . . . . . . . 425.7 Summary . . . . . . . . . . . . . . . . . . . . . . . . . . . . . . . . . . . . . . . . . . . . . . . . . . . . . . . 43
6 Conclusion . . . . . . . . . . . . . . . . . . . . . . . . . . . . . . . . . . . . . . . . . . . . . . . . . . . . . . . . . 45
7 Reference . . . . . . . . . . . . . . . . . . . . . . . . . . . . . . . . . . . . . . . . . . . . . . . . . . . . . . . . . . 47
4 IEA CLEAN COAL CENTRE
1 Introduction
5Support mechanisms for cofiring secondary fuels
Worldwide, biomass, including ‘degradable’ wastes, are currently the largest sources of renewableenergy. The world’s total primary consumption of biomass reached 1225 million tonnes of oilequivalent (Mtoe) in 2008, and is expected to increase to nearly 2000 Mtoe in 2035 (WEO, 2010). Thesignificant increase is mainly driven by the perception that biomass is a ‘CO2-neutral’ energy resourceand its use produces only a small amount of net CO2 emissions resulting mainly from its growing andharvesting. Currently, more than 60% of biomass is used for traditional domestic cooking and heating,whilst new applications in more efficient modern processes are being developed notably in OECDcountries. Among those new applications, the largest market is industry where biomass is used toproduce steam and heat. The second largest market is power generation, followed by utilisation inproduction of liquid transport fuels. Looking to the future, the bulk of the increase in biomass demandbetween 2008 and 2035 is expected to come from the electric power sector and the transportationsector. The electric power sector, in particular, is expected to surpass other industries as the largestsource of demand for biomass (WEO, 2010).
Power generation using biomass is undertaken widely in two types of power plants: dedicated biomasspower plants (biomass as the only fuel) and existing power plants that combust both coal and biomass.Dedicated biomass power plants are based either on grate firing or fluidised bed combustion, hence theplant capacity is generally not very large. Firing biomass alone gives rise to issues in relation to biomasssupply and power plant performance such as reduction in efficiency and availability. Some of these issuescan be solved effectively if the biomass is cofired with coal in a larger-sized power plant. Currently, thetypical conversion efficiency for a dedicated biomass-fired power plant is 25% (HHV) (van Loo andKoppejan, 2008). In contrast, conventional subcritical pulverised coal fired power plants have a thermalefficiency in the range 33–39% (HHV) in OECD countries, while new state-of-the-art power plants boastat least 43% (HHV) (Nalbandian, 2008). Moreover, numerous cofiring trials have shown that the coal-fired power plant efficiency is not compromised when the cofired biomass fuel represents a modest shareof total energy input. As such, biomass/coal cofiring represents a more efficient use of biomass for powergeneration. At modest cofiring levels, the combustion of biomass does not lead to significant problems ofalkali-related high-temperature corrosion, slagging and fouling, which could severely affect the operationof dedicated biomass power plants (Fernando, 2005). Furthermore, biomass cofiring with coal requiresrelatively simple modification to power plants, so the capital costs are lower than those needed toconstruct a new dedicated plant (about 123–1235 US$/kW compared to 1975–3085 US$/kW for biomass-only) (IEA, 2008). Cofiring also offers the flexibility to cope with a temporary loss of biomass supply orshort-term biomass price volatility by increasing the share of coal in the fuel mix. Furthermore, cofiringcan reduce the pollutant emissions from coal-fired power plants; research has shown that, with cofiring, acoal plant’s SO2 and CO2 emissions can be reduced and its NOx emissions could also be reduceddepending on the biomass fuel used (Fernando, 2005).
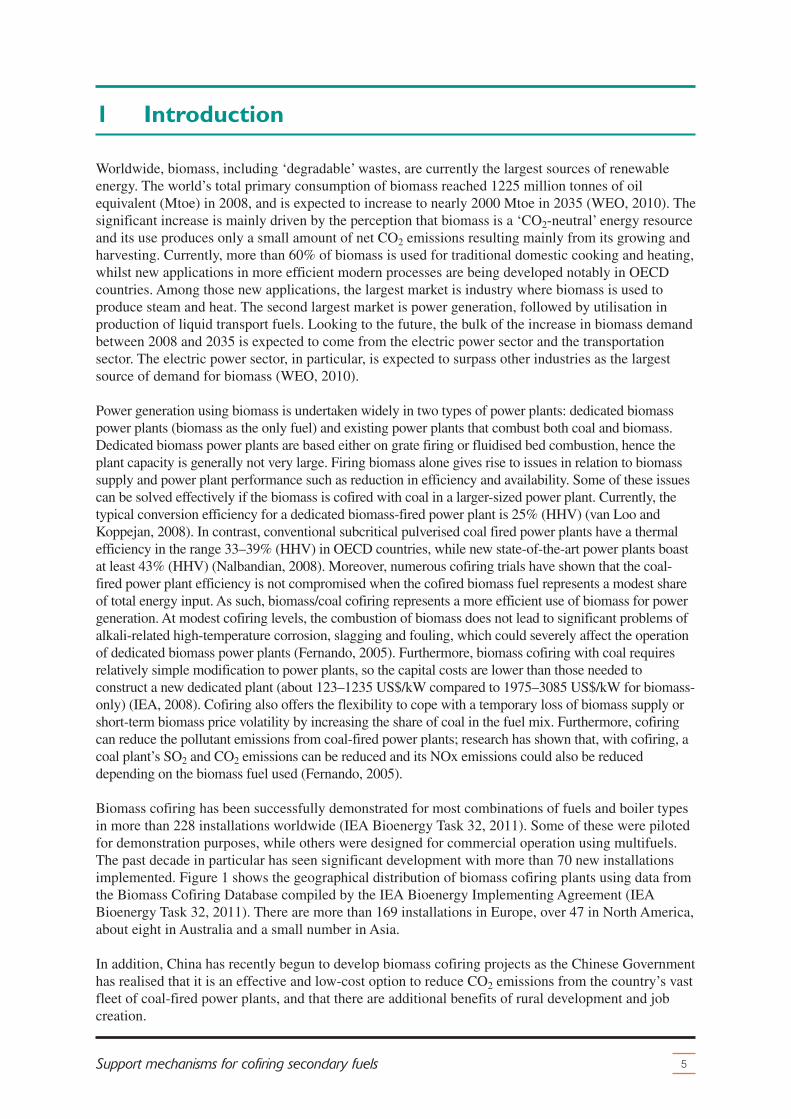
Biomass cofiring has been successfully demonstrated for most combinations of fuels and boiler typesin more than 228 installations worldwide (IEA Bioenergy Task 32, 2011). Some of these were pilotedfor demonstration purposes, while others were designed for commercial operation using multifuels.The past decade in particular has seen significant development with more than 70 new installationsimplemented. Figure 1 shows the geographical distribution of biomass cofiring plants using data fromthe Biomass Cofiring Database compiled by the IEA Bioenergy Implementing Agreement (IEABioenergy Task 32, 2011). There are more than 169 installations in Europe, over 47 in North America,about eight in Australia and a small number in Asia.
In addition, China has recently begun to develop biomass cofiring projects as the Chinese Governmenthas realised that it is an effective and low-cost option to reduce CO2 emissions from the country’s vastfleet of coal-fired power plants, and that there are additional benefits of rural development and jobcreation.

Typical power stations where cofiring isapplied are in the range from approximately50 MWe (a few units are between 5 MWe and50 MWe) to 700 MWe (IEA Bioenergy Task32, 2011). The majority are of pulverised coalcombustion (PCC) type with various firingmodes; bubbling and circulating fluidised bedboilers, cyclone boilers and stoker boilers arealso used. The proportion of biomass rangesfrom 1% to 20% on an energy input basis.Tests have been performed with everycommercially significant fuel type (lignite,subbituminous coal, bituminous coal, andopportunity fuels such as petroleum coke), andwith every major category of biomass(herbaceous and woody fuel types, residuesand energy crops). Experience with biomasscofiring in PCC boilers has demonstrated thatcofiring woody biomass resulted in a modestdecrease in boiler efficiency but no loss ofboiler capacity (Al-Mansour and Zuwala,2010). There are three basic cofiring concepts:direct cofiring (the majority of currentinstallations), indirect cofiring (limitedexperience) and parallel cofiring (littleexperience). All these concepts have alreadybeen implemented either on a demonstration ora fully commercial basis, and each with itsown particular merits and disadvantages.Technical details of these concepts can befound in previous IEA CCC reports (Davidson,1999; Fernando, 2002, 2005).
Differing from previous IEA CCC reports thatinvestigate the technological perspectives ofcofiring, this report focuses on the
supporting/enabling mechanisms for adopting biomass/coal cofiring as an initial, easy option forutilising biomass for power generation. It takes Europe, the USA, Australia and China as case-studyregions and investigates the main supporting incentives they have adopted in consideration of thespecific characteristics of renewable energy markets and the government’s position in clean energyand climate change in each of these regions.
6 IEA CLEAN COAL CENTRE
Introduction
Indonesia
Taiwan
Thailand
Australia
Austria
Belgium
Denmark
Finland
Germany
Italy
Netherlands
Norway
Spain
Sweden
UK
Canada
USA
211 85 1
9
78
27
67
12
15
18
7
40
Figure 1 The distribution of biomass cofiringinstallations worldwide (based on thedata extracted from the IEA BioenergyTask 32 – Biomass Cofiring Database)

2 European Union
7Support mechanisms for cofiring secondary fuels
This chapter first gives a brief review of the role of biomass in Europe’s energy strategy, biomassresources, biomass utilisation and technology status of biomass cofiring in Europe. A detaileddiscussion is then made on the incentives that main European countries adopt to support thedevelopment of biomass cofiring.
2.1 EU’s position on biomass energy
The European Union set a clear climate and energy agenda through its climate and energy legislativepackage adopted in 2009. This agenda mandates the EU to meet the following targets for 2020:greenhouse gas (GHG) emissions reduced by 20% below 1990 levels, or possibly by 30% if therewould be a clear global post-Kyoto commitment; 20% of the final energy consumption coming fromrenewable energy; primary energy consumption reduced by 20% below the ‘business-as-usual’projection for 2020. With a share in the range of 61–70% of EU-27 nations’ renewable energy mixsince 1990, biomass will be the most important renewable energy source to meet the EU’s 2020targets (AEBIOM, 2011). The concerns about climate change and dependency on fossil fuel importsare major drivers for promoting biomass energy in Europe; there are also expectations that promotionof biomass energy will stimulate rural development and create more jobs. The European BiomassAssociation projects that the gross inland consumption of biomass will more than double to 220 Mtoeby 2020 (AEBIOM, 2011).
2.2 Biomass resources and utilisation in Europe
In Europe, biomass comes mainly from three sources: agriculture, forestry and wastes. The forestryindustry is currently the largest source of biomass and will likely remain so at least over the nextdecade. Biomass wastes, such as degradable municipal solid waste (MSW) and sewage sludge/gas,have traditionally been the second most important supply. Energy recovery from wastes byincineration is practised intensively in Germany, France, Belgium, the Netherlands and NorthernEuropean countries such as Denmark and Sweden. Sweden has even gone as far as to set up wasteimport sectors. Agricultural byproducts may also become an important source of supply in the comingyears, but their production costs are higher. Energy crops have emerged and developed rapidly inrecent years in some regions. Energy crops are used primarily for production of liquid biofuels orbiogas; Germany is currently the largest producer of methanised biogas in Europe. Energy crops areexpected to supply a significant portion of the additional demand for bioenergy in 2020. In addition,biomass imports are expected to increase considerably, from 2 Mtoe in 2007 to around 20 Mtoe in2020, both in the form of transport biofuels (ethanol and biodiesel) and solid biomass (pellets andwood chips) (AEBIOM, 2011).
Currently, the majority (79%) of biomass is used for heat production with more than two thirdsproduced in combined heat and power (CHP) plants. Biomass-derived heat has a significant share ofthe heating markets in Denmark, Estonia, Finland, France, Germany, Italy, Latvia, Lithuania andSweden (EurObserv’ER, 2010a). Households are the biggest consumer of biomass-derived heat,followed by the industry and service sectors. The electric power sector is the second largest consumerof biomass. Biomass-based electricity accounted for 16–20% of total renewable electricity generatedin the EU during 2005-08. However, this represented only a small share of EU’s gross electricityproduction, in the range of 2–3% (AEBIOM, 2011; EurObserv’ER, 2010a).

2.3 Biomass cofiring in Europe
In Europe, there is great interest in cofiring biomass with coal in existing coal-fired boilers, andextensive experience has been gained. It is perceived by governments and industries as aneconomically sound short- and medium-term option for increasing renewable energy production whilereducing conventional pollutants and GHG emissions. A relatively modest capital investment,typically up to 50–300 US$/kW of biomass capacity, is needed to implement biomass cofiring as suchsystems can capitalise on the large investment and infrastructure associated with existing coal-basedpower systems. Power plant operating costs are, in most cases, higher for biomass than for coal, due
to the higher delivered cost of fuel,particularly if energy crops are used. Evenwhen the biomass is nominally free at thepoint of production, the costs associated withcollection, transportation, preparation, and on-site handling can increase the cost per unit ofenergy input to a point where it rivals, andoften exceeds, the cost of coal. Compared toalternative renewable energy sources, however,biomass cofiring is normally significantlycheaper, and cofiring has the advantage that itcan be implemented relatively quickly.
Europe is presently the world’s leader inbiomass cofiring implementation withexperience gained from more than169 installations (IEA Bioenergy Task 32,2011). As shown in Figure 2, theseinstallations, either as pilot tests or incommercial operation, are spread over elevencountries and are discussed briefly as follows.Most of the information is extracted from theIEA Bioenergy Task 32 – cofiring database,which was last updated in 2009.
2.4 Support mechanisms forbiomass cofiring inEurope
The current European policy and legislationenvironment is highly conducive to biomass
energy. The European Commission, through its overarching renewable energy policy – the EuropeanRenewable Energy Directive (2009/28/EC), demanded that each member state submit a nationalrenewable energy action plan in 2010. These plans, drawn up in view of Article 4 of the Directive,mandated the member states to present a renewable energy sector development programme to achievetheir respective contributions to EU targets: 20% of the final energy consumption coming fromrenewables and a mandatory 10% minimum target for the share of biofuel in transport fuelconsumption by 2020. The Directive also requires governments to design support mechanisms toachieve the targets cost-effectively and to establish the sustainability criteria.
Another EU-wide policy relating to biomass is the Combined Heat and Power Directive (2004/8/EC),which entered into force in February 2004. Combined Heat and Power (CHP) is an important avenuefor utilising biomass in Europe. This Directive requires member states to report the status of CHP
8 IEA CLEAN COAL CENTRE
European Union
Austria
Belgium
Denmark
Finland
Germany
Italy
Netherlands
Norway
Spain
Sweden
UK
5 1 9
78
27
7
612
15
18
Figure 2 The distribution of biomass cofiringplants in Europe (based on data fromthe IEA Bioenergy Task 32 – CofiringDatabase)

development, to remove barriers and create promotional measures, and to track the progress of highefficiency co-generation in energy markets.
The EU Emissions Trading System (EU ETS) also has a profound and widely-ranging impact on thedevelopment of renewable energy. A survey, participated in by 23 large European electric utilities,clearly illustrated the effect of ETS on decisions to implement biomass cofiring (New Energy Finance,2009). It was believed that a solid carbon price may promote the uptake of biomass cofiring anddedicated biomass generation. Nevertheless, respondents to the survey recognised that the carbonprice was only one factor amongst many when considering new investment in biomass cofiring.Renewable subsidies and fuel prices were often quoted as stronger determinants than carbon price inthe decision making.
In addition to the above EU-wide energy policies, each member state has designed its own incentivesand mechanisms to support uptake of biomass cofiring, which are discussed as follows.
2.4.1 Austria
Cofiring in Austria only takes place in industries where biomass fuels are available as residues, forexample in the pulp and paper industry (Cremers, 2009). The Austrian utility company VERBUNDcommercially cofired wood chips and bark (3% net calorific value) at its 284 MWth grate-firedSt Andrä power plant from 1995 to 2004, but the plant is now closed. VERBUND is still cofiring bark,wood chips and sawdust (accounting for 10 MW heat input) in the 330 MWth pulverised fuel (pf)Biococomb plant that burns polish hard coal. Biomass cofiring in circulating fluidised bed (CFB) andbubbling fluidised bed (BFB) combustion systems is applied commercially in several CHP plants inthe pulp and paper industry. A wide range of biomass fuels are used, including bark, wood residues,black liquor and sewage sludge.
Austria currently focuses on decentralised dedicated biomass application, while cofiring is not afavoured technology choice. The country’s main support mechanism is the renewable feed-in tariffs ,which are adjusted annually by law. The yearly budget is pre-allocated to different types of renewableenergy (30% to biomass, 30% to biogas, 30% to wind and 10% to photovoltaic and other renewableenergy sources). Within these categories, funds will be given on a ‘first come first served’ basis.However, the feed-in tariff is considered to be low for electricity from biomass cofiring plants, whichfor the use of untreated biomass (such as forest wood chips) amounts to 6.28 c/kWh of electricity. Thetariffs decrease by 25% in case of using saw mills byproducts and by 40% when demolition wood isused. Compared to the market price for base load electricity (around 4.80 c/kWh), it is clear that onlythe tariff for cofiring forest wood chips is usually higher than the market price of baseload electricityand that cofiring other biomass fuels would be hardly beneficial. Thus the support regime would haveto be changed appropriately if it was to attract interests in cofiring a variety of biomass fuels. There isalso an array of additional federal incentives for renewable heat, which consist mainly of investmentsubsidies.
2.4.2 Belgium
In Belgium, utilising biomass (including cofiring) to produce electricity took off after 2001 when thegovernment implemented the Green Certificate scheme (Cremers, 2009). At the end of 2007,Electrabel had renewable energy capacity of 402.7 MWe, of which biomass accounted for 78% (or314 MWe). Small-scale co-generation (CHP) units and biogas production from waste are responsiblefor a total of around 10 MWe. The remaining 300 MWe is produced by five power plants: the 100%wood pellets-fired Electrabel’s Les Awirs has an electricity output of 80 MWe with fuel demand of~1000 t/d; the four other power plants, including Ruien, Langrlo, Rodenhuize and Mol, cofire woodand olive residues.
9Support mechanisms for cofiring secondary fuels
European Union

Belgium has two sets of measures to support renewable electricity. The first measure is to setObligatory Targets for all electricity suppliers to supply a specific proportion of renewable electricity,for which the government guarantees minimum prices or ‘fall back prices’. Additionally, a greencertificate is attached to a unit of renewable electricity produced. In the country’s three regions(Wallonia, Flanders and Brussels-Capital), separate markets for green certificates have been created.In the Wallonia region, the Commission Wallonne pour l’Energie registered an average price of90 €/MWh per certificate during the first three months of 2006. In the Flanders, the average price wasaround 110 €/MWh per certificate during the first half of 2006. However, it is presently morebeneficial (financially) to pay penalties than to use the certificates due to the low penalty rates that areexpected to increase over time. Little trading of the green certificates has taken place so far. The otherset of measures is investment support for renewable energy projects. For example, renewable heatproduction is being supported by investment incentives in all three regions. The maximum level ofsupport is as high as 15% in the Wallonia region and 20% in the other two regions.
2.4.3 Denmark
Biomass has been used for electricity production in different sectors in Denmark since the 1980s(Cremers, 2009). The technologies used can be broadly divided into the following four categories:cofiring wood or straw in medium- to large-scale power plants, dedicated biomass-fired CHP plants(smaller boilers), dedicated biomass-fired boilers coupled to the steam cycle of a larger coal-firedpower plant, and pilot or demonstration plants for dedicated biomass utilisation at small scale (forexample, gasification and Stirling engines). Denmark has extensive experience in cofiring straw atvery high ratios in different combustion systems including grate-fired, one CFB drum type and fourpf-type units. Some plants, such as DONG Energy’s grate-fired Herningvœrket plant, Grenaa CFBco-generation plant, and Avedøre No 2 (pf boiler), operate in reverse cofiring mode, such that thebiomass accounts for 50–70% of total heat output. The secondary fuels may include coal, natural gasand fuel oil. Notably, the 365 MWe Avedøre No 2 unit features an ultra-supercritical boiler, whichfires wood pellets only up to 70% load and natural gas is used as supplementary fuel from 70% to100% load. An additional dedicated straw-fired boiler is installed, which accounts for 10% of thisunit’s total fuel consumption (or ~150 kt/y of straw). Another noteworthy cofiring plant is Vattenfall’sAmager No 1 (250 MWth), which can operate on either 100% pulverised coal or 100% wood pellets,using the same fuel feeding lines (not simultaneously, and only 90% capacity can be achieved instraw-only operation). Those cofiring plants have demonstrated great fuel flexibility. Extensive testsusing straw have clearly shown the limitations of the direct cofiring method.
The driving force behind biomass-based electricity development in Denmark has been a specificscheme set up by parliament (Folketinget) in the early 1990s. This scheme requires power plants touse a certain amount (1.4 Mt) of biomass annually. In 2008 the required proportion was increased byan additional 0.7 Mt/y as a result of a political agreement that lifted the legislative ban on increasedcoal use for power generation. More recently, a new supporting regime has been instigated, which setsan electricity price when using biomass for electricity generation at 150 DKK/MWh on top of thenormal spot electricity price (the hourly market price as set up by Nordpool) (Tørslev, 2012). AllDONG Energy plants have or will shortly convert to the new supporting regime.
Most power plants in Denmark are CHP plants. Biomass for heat production from central powerplants are exempted from energy tax. The normal energy tax for fossil fuels used for heat productionis approximately 60 DKK/GJ and regulated yearly with a price index (Tørslev, 2012). The realadvantage of using biomass in Denmark, is to use it in CHP plants; biomass used only for electricityproduction is seldom a viable option.
10 IEA CLEAN COAL CENTRE
European Union

2.4. 4 Finland
Finland has seen its bioenergy market develop from small-sized local utilisation of wood fuels tolarger-scale CHP production over the past several decades. It has significant experience in efficientuse of biomass for energy production in municipalities and at pulp and paper mills. Of the variousindustrial sectors, the paper and board making factories are the largest source of demand for heatgenerated by CHP and cofiring. Wood is the major biomass fuel, while peat, deemed as a biomass fuelin Finland, is an important indigenous fuel, covering ~10% of Finland’s energy consumption. The useof agricultural byproducts, waste and energy crops for energy production is limited in Finland. Inaddition to wood fuels, other cofired fuels include sludge, fuel oil, methanol, recovered fuel pellets,refuse-derived fuels, and, in some cases, biogas.
Finland has the largest number (>78) of biomass cofiring installations in the world, almost all ofwhich are in CHP plants and adopt direct cofiring. A noteworthy exception is the 514 MW Kymijärvipower plant in Lahti, owned by Lahti Energia Oy, which uses parallel cofiring (that is firing thebiomass in a separate combustor and routing the steam produced to the main steam where it isupgraded to higher conditions). Conventional stoker- or grate-fired boilers are still competitive whenthe boiler capacity is under 20 MWe and can cofire 20–95% of biomass, while larger-sized plants usethe fluidised bed combustion (FBC) technology with cofiring rates in the range of 20–90% (Fernando,2005). In Finland, approximately three-quarters of the cofiring installations adopt bubbling FBCboilers (Cremers, 2009). Alholmens Kraft in Pietarsaari is the world’s largest biomass cofired powerplant with a boiler steam capacity of 550 MWth. Started up in 2001, it uses 45% peat, 10% forestresidue, 35% industrial wood and bark residues and 10% heavy fuel oil or coal (Kärki, 2009). Theoverall thermal efficiency of large-scale CHP plants is in the range of 85–90%. Thus Finnish energyproduction has high overall efficiency due to widespread use of CHP production.
Finland has taken the following measures to encourage the use of biomass in electricity generation:� tax breaks: electricity from renewable energy sources has been made exempt from the energy tax
paid by end users;� discretionary investment subsidies: new investments are eligible for subsidies up to 30%;� guaranteed access to grid for all renewable electricity users pursuant to the Electricity Market
Act – 386/1995.
Taxes imposed on heat are calculated on the basis of the net carbon emissions of the input fuels andare zero for renewable energy sources. Further support to heat production from biomass takes theform of direct investment assistance.
In 2010, a feed-in tariff scheme was introduced to promote electricity generation using gas frombiogas reactors (the other beneficiary technology is wind energy, while solid biomass is excluded). Itwas anticipated that about 60 biogas plants with combined capacity of 19 MW would participate inthis scheme. The tariff is the difference between the target price (83.5 €/MWh for biogas-basedelectricity, and 133.5 €/MWh in CHP generation) and the spot market electricity price (Kiviluoma,2010). The tariff is paid for 12 years. With the proposed tariff level, using biowastes and manure couldbe affordable for power plants if they receive subsidies from waste utilisation; in contrast, farm-sizebiogas plants are not economic.
2.4.5 Germany
The IEA Bioenergy Task 32 cofiring database shows that Germany has at least 26 cofiringinstallations, while the European Biomass Industry Association (EUBIA) recorded 32 cofiringinstallations (EUBIA, 2011). The individual capacity of these cofiring installations ranges from75 MWe to 350 MWe. The majority of the installations are of PCC type, while fluidised bed boilersare used in a few other installations. Sewage sludge is the most common (in 17 installations) biomass
11Support mechanisms for cofiring secondary fuels
European Union

fuel to be cofired; other biomass fuels include recycled materials, wood chips, straw and variouswastes. Despite no data available on the percentage of biomass cofired with coal, the cofiring rate isexpected to be modest, at least, for sewage sludge-cofired plants.
In Germany, feed-in tariffs are the most important incentive for promoting electricity from renewableenergy sources, and are among the highest in Europe. In 2004, the German Government introducedthe first feed-in tariff scheme, under the Erneuerbare Energien Gesetz (EEG) law. The scheme appliesto solar, wind, hydro, biomass and landfill/sewage gas generated electricity. The principle behind thisscheme is a 20-year contract for a flat rate electricity price. The feed-in tariff for biomass-basedelectricity is in the range 0.08–0.12 €/kWh in Germany. The large subsidised loans available throughDeutsche Ausgleichesbank’s Environment and Energy Efficiency Programme are other key incentives.In addition, the Heat & Power Act (KWKG) regulates the financing of CHP plants and heat supplynetworks into which heat from CHP plants is fed. A Market Incentive Programme provides investmentsubsidies for heat production from small-scale CHP plants (up to 50 kW). An Energy Tax Actprovides tax exemption for products used in CHP production if the CHP plant has a monthly or annualefficiency of no less than 70%. Biomass material that is used in a CHP plant or combustedimmediately after production is also exempt from tax.
2.4.6 Italy
Italy has seven cofiring plants with four in its northern areas and three on the island of Sardinia.Except for ENEL’s Sulcis No 2 in Sardinia, which was retrofitted with an Alstom CFB boiler(790 MWth + 340 MWe) in 2006, the other six installations are all based on PCC technology withoutput capacity in the range 165–340 MWe. The cofiring rate has reached 16% (on a heat input basis)at the Sulcis No 2 CFB plant, whilst the other plants cofire biomass at lower rates. Wood chips are themain cofiring biomass fuel; for example, the Sulcis No 2 plant cofires wood chips from local sourcesfor which a separate handling and feeding system was added.
Italy has adopted the following measures to promote renewable electricity (EREC, 2009):� priority access to the electricity grid for electricity from renewable power and CHP plants;� an obligation for large electricity generators and importers (more than 100 GWh/y) to supply a
mandatory proportion of renewable electricity. Starting from 2007 at 3.05%, the prescribedproportion will increase annually by 0.75% to 2012 (for example, the 2011 share was 6.80%).The post-2012 increase rate will be determined by the Italian Government. The governmentimposes sanctions in case of non-compliance, but in reality enforcement of this obligation isconsidered difficult because of ambiguity in the legislation;
� tradeable green certificates – each green certificate represents the production of 1 MWh ofenergy from renewable sources, and is issued for 15 years to producers based both on the outputand the type of renewable sources used. Issuing and trading of green certificates are overseen byGestore Servizi Energetici (GSE), the state energy administration agency. The Budget Law 2008stipulated that the value of each green certificate was equal to the difference between €180 andthe annual average price of electricity defined each year by the Italian Authority for Electricityand Gas (AEEG). GSE, as the last resort buyer, can retire unsold green certificates at the meanprice of the previous three years;
� feed-in tariff – the Italian Government introduced a feed-in tariff scheme in 2007, initially only to>1 kW photovoltaic projects. When the Budget Law 2008 amended many parts of the greencertificate scheme, it also introduced a new tariff for small-sized renewable projects (<1 MW) thatwere revamped or commissioned after 1 January 2008. The capacity provision suggests thatbiomass cofiring projects might not be eligible for this tariff as most cofiring takes place inlarge-sized boilers.
An amendment to the Budget Law 2008, introduced by Legislative Decree 28 in March 2011, revisesthe Italian system of incentives for renewable electricity. This renewable Decree introduces a new
12 IEA CLEAN COAL CENTRE
European Union

incentive system to renewable plant that will begin operation after 31 December 2012. The systemwill be adopted in late 2011, and comprise feed-in tariffs for all types of renewable energy sources. Itis expressly provided that new tariffs will be revised two years after they come into force and everythree years thereafter in order to give greater stability and reliability to the Italian renewable energymarket. On the other hand, all plants operational before 31 December 2012 will still comply with thecurrent incentive schemes. Nevertheless, under the amendment, GSE will retire the unsold greencertificate at a lower price, 78% of the mean price of green certificate over the previous three years,until 2015. The green certificate incentive will be replaced by the new tariff scheme after 2015.
2.4.7 The Netherlands
The Netherlands has more than 16 years of experience in cofiring. The driver was been the need toreduce landfill of ~240,000 t of waste and demolition wood. The first cofiring operation was in 1995at the Gelderland power station in Nijmegen where ~60,000 t of demolition wood was cofired.Nowadays cofiring is a common practice in the country; its seven coal-fired units (capacity403–602 MWe) in five different power stations have experience in cofiring biomass. These unitscomprise tangentially-fired or opposed wall-fired pf boilers. Cofiring rates up to 15 th% are commonand higher rates have also been achieved, for example, in Unit 9 of Essent’s Amer Centrale plant(27 th% direct cofiring and 5 th% indirect cofiring). Cofired fuels have included wood pellets, wasteand demolition wood, paper sludge, compost residues, bio-oils, meat and bone meal, cocoa shells andfibres. Biomass feedstock is generally milled separately and then injected either in the coal lines or inseparate feed lines. There have also been trials of co-milling the biomass with coal at relatively lowpercentages (up to 5 th%). Ashes from cofired boilers are regularly utilised in building and civilengineering industries. The ashes are fully accepted by the market due to stringent quality criteria andgood public relations.
Widespread adoption of biomass cofiring had been attributed to the Dutch MEP (Milieukwaliteit vande Elektriciteitsproductie – environmental quality of power production) subsidy scheme 2003-07.MEP was a subsidy paid to domestic producers of grid-connected electricity from renewable sourcesand CHP plants. The subsidy took the form of a fixed premium paid on top of the wholesale price ofelectricity. The premium was paid to installations established after 1 January 1996 for a maximum often years, except for CHP. It was financed through a levy on all connections to the electricity grid,which was entirely compensated by means of a reduction in the ecotax on fossil energy consumption.MEP differentiated between various types of renewable energy technologies. It did not allow forcofiring bio-oil and significantly lowered the subsidies for cofiring certain types of contaminated solidbiomass fuels. As a result, the electricity output from cofiring biomass declined considerably in 2007,interrupting the upward trend during 2000-06.
MEP was suspended and subsequently succeeded by the SDE (stimulering duurzame energie – the aidscheme for renewable energy and CHP production) in 2008. The financing mechanism also changedfrom the levy to national budgeting. Despite being included in MEP, biomass/coal cofiring is noteligible for SDE. MEP, however, still holds for cofiring power stations covered by the pre-2009 MEPscheme, and therefore relates to the existing cofiring plants, except for the Hemweg 8 power station.The MEP subsidies were determined for the last time in 2007: 6.5 c/kWh for cofiring wood pellets,3.8 c/kWh for agro-residues, and 3.8 c/kWh for mixed biomass feedstock (Cremers, 2009).
2.4.8 Sweden
Although biomass/coal cofiring was extensively operated in the 1980s, the use of coal for heat andpower production is now very limited in Sweden. Of the total amount of coal used, only about onethird is used in CHP plants. This is mainly due to the carbon tax on heat production introduced in1991. Electricity generation with the bulk fuel being biomass is exempt from the carbon tax, which is
13Support mechanisms for cofiring secondary fuels
European Union

the dominant form of cofiring operation in 15 CHP plants at present. Two of these 15 plants employgrate-fired boilers, whereas ten plants at the paper and pulp mills use FBC boilers (seven CFB andthree BFB) with capacity less than 120 MWth. The other three plants cofire wood pellets, olive wasteand peat in PCC boilers of capacity in the range of 180–320 MWe. The cofiring rates at these plantsare not indicated in the cofiring Database (IEA Bioenergy Tasks 32, 2011).
Sweden has ambitious targets (49% by 2020) for electricity generation from renewable sources. Theprimary stimulating means of achieving this goal is the tradeable green certificate scheme introducedin 2003. The scheme mandates electricity suppliers to purchase green certificates to cover a certainproportion of their sales (renewable quota), which is set annually by the Swedish Parliament. Theinitial quota was set at 7.4% in 2003, increasing to 17.9% in 2012, and then decreasing to 4.2% in2030. In 2006, a new bill was proposed aiming to raise the renewable energy output to 17 TWh by2016 and to extend the green certificate scheme to 2030. The Norwegian and Swedish Governmentssigned an agreement in September 2009 to establish a common green certificate market which runsfrom 2012 until 2020. In this common market, more capital is expected to flow into biomass energyprojects in Sweden where the associated costs are lower, whilst Norway will attract more investmentin wind energy projects considering its climate and cost advantages. Norway is rich in hydro energyresources and has great potential for wind energy; however, cofiring with coal is rarely used becausethe country has little coal-fired capacity.
In Sweden, taxation on fossil fuels and carbon dioxide supports renewable energy in an indirect way.This is because most cofiring fuels, such as biomass, solid wastes and peat, are exempt from tax onenergy production. Main fuels used for electricity production, including coal, are also exempt fromenergy and CO2 taxes, though they are liable for NOx levy and sulphur tax.
2.4.9 United Kingdom
In the UK, 18 coal-fired power plants have had either trial or commercial operating experience incofiring biomass for various periods of time. All these power plants use large PCC boilers, except fortwo CFB boilers that belong to Caledonian Paper Plc in Scotland and Scottish and Southern Energy atSlough. Except for EDF Energy’s Cottam plant and the West Burton plant which adopt the indirectcofiring concept, all undertake direct cofiring. All but one have cofired with less than about 6 th% ofbiomass fuels; the exception is Drax power station located near Selby, Yorkshire. This 4000 MWepower station now has the capacity of generating 500 MWe from biomass, which corresponds to acofiring rate of 12.5 th%; a 50 th% cofiring rate was also successfully trialled in one unit. Theprincipal fuels are wood pellets and imported food processing residues, while biogenic liquids andenergy crops are also used. It is expected that in the long run the bulk of cofired biomass will beimported with indigenous biomass accounting for just 10% (ARUP, 2011).
The supporting mechanisms provided by the UK Government fall into two broad categories:1) those embedded in energy policies that promote production and use of biomass;2) those that have a bearing on the use of biomass energy systems.
The former category of mechanisms concerns how biomass can contribute to the power and heatneeds of the country, while the latter control how and where biomass derived fuels and conversiontechnologies can be used.
Cost effective collection and delivery of biomass are essential to the success of a cofiring project. Arange of schemes is now available in the UK for supporting production and supply of biomass fuels,see Table 1. These schemes may be available only in certain regions and to certain entities.
Introduced in 2001, the Climate Change Levy (CCL) is a tax imposed on the use of taxable energycommodities including lignite, coal, electricity, gas and LPG, but not oil. The levy is charged at a
14 IEA CLEAN COAL CENTRE
European Union

specific rate per nominal unit of energy; the rate varies across four categories of taxable commoditiesand is based on their energy content. All revenue raised through CCL is recycled back to businessthrough a 0.3% cut in employers’ national insurance contributions and support for energy efficiencyand low carbon initiatives (for example the Carbon Trust). The aim of the CCL is to encouragebusiness to become more energy efficient and reduce their greenhouse gas emissions. As an importantcomponent of CCL, exemption is given to electricity generated from new renewables or the fuel input
15Support mechanisms for cofiring secondary fuels
European Union
Table 1 Current schemes for supporting biomass fuels production and the supply chains(Biomass Energy Centre, 2011)
Scheme Notes
Availability
BusinessNon-for-profit
Publicsector
Privateindividuals
Energy CropsScheme
It offers grants to farmers in England forestablishing miscanthus and shortrotation coppice for their own energyuse or to supply power station; the rateof grant paid is 50% of all eligible costsincurred.
Yes Yes Yes Yes
ForestryCommissionGrants
A portfolio of grants managed by theForestry Commission. Aims to helppromote the stewardship of existingwoodlands, the creation of newwoodlands, and increase benefits to thepublic. The schemes vary in the fourregions across the UK.
Yes Yes Yes Yes
East MidlandsForestryMicro-enterpriseGrant
Grants of £2500–25,000 will beavailable towards buying new machineryor equipment, building handing orstorage facilities or installing woodfuelsystems.
Yes No No No
RuralDevelopmentProgramme
It is a significant sum of Europeanfunding for the development of ruralareas. Funding is available for a widerange of activities including thedevelopment and diversification ofland-based businesses and theinstallation of biomass boilers.
Yes Yes
Single PaymentScheme
A EU support scheme for agricultureFlat rate payments based on the totalfarm size rather than specific cropareas.
Yes Yes Yes
Woodfuel EastStrategicInvestmentSupportProgramme
A strategic investment supportprogramme from WoodFuel Estate tosupport woodchip production, dryingand storage for producing woodfuel;awarded through the European RuralDevelopment Programme and subjectedto the eligibility criteria of thatprogramme.
Yes Yes
Waste &ResourcesActionProgramme
Capital grants to small and mediumenterprises to help promote therecycling of a number of materialsincluding food waste processing.
Yes

to ‘good quality’ combined heat and power (the quality has to be verified by the CHP QualityAssurance Programme). Agriculture and forestry wastes, energy crops and landfill gas are eligible forthe exemption. Municipal and industrial wastes can be regarded as a renewable source eligible forCCL exemption provided that fossil fuel does not make up 90% or more of its energy content. Theexemption works on an ‘equivalent amount’ basis to take into account the practicalities of distribution.Auditing is required to ensure that exemption must be matched by purchases of electricity fromrenewable sources. As part of the auditing system, Renewable Levy Exemption Certificates(Renewable LECs) are issued to demonstrate that a quantity of electricity supplied to the finalconsumer ‘matches’ that generated from renewable sources. The Office of the Gas and ElectricityMarkets (Ofgem) and the Northern Ireland Authority for Utility Regulation (NIAUR) are responsiblefor administering, issuing, transferring and allocation of renewable LECs. NIAUR covers NorthernIreland and the Republic of Ireland, while Ofgem manages CCL exemption elsewhere.
Renewable Obligation (RO) is the UK Government’s main subsidy scheme for renewable electricity.RO requires all licensed electricity suppliers to source a proportion of their electricity from eligiblerenewable sources, including both dedicated biomass and biomass cofiring generation. It wasintroduced in England and Wales and in a different form in Scotland in April 2002, and then inNorthern Ireland in April 2005. The proportion of renewable electricity is required to increase year onyear, being 11.1% for 2010-11 and rising to 15.4% by 2015-16 (Ofgem, 2010). Since its introduction,RO has succeeded in more than tripling the level of renewable electricity generation in the UK from1.8% to 6.64%, and is currently worth around £1.4 billion per year in support to the renewableelectricity sector (DECC, 2010). As reflected in its Spending Review of 20 October 2010, the UKGovernment intends to continue the RO, extending its current end date of 2027 to 2037 for newprojects, in order to provide greater long-term certainty for investors. However, RO will be replaced in2017 by a system of contracts for electricity generation.
Since its introduction, the RO has been subject to various revisions and improvements. The mostimportant change, made in April 2009 established tiered support depending on technologies used,their costs and potential for large-scale deployment. Such banding provided a greater incentive toprojects that may hold a potential for large-scale generation, but are geographically farther fromsources of demand. The Department of Energy and Climate Change (DECC) is currently consultingon proposals for new levels of banded support during 2013-17. The new bands will come into effecton 1 April 2013 (1 April 2014 for offshore wind), subject to Parliamentary and State Aids approval.Similarly, the Scottish Government also published its consultation paper on changes to the RenewableObligation (Scotland) Order, while a separate consultation on banding changes to the Northern IrelandRO was published by its Department of Trade, Enterprise and Investment.
To demonstrate compliance with the RO, electricity suppliers are given Renewable ObligationCertificates (ROC) issued by Ofgem. Article 12(4) of the Renewable Obligation Order 2009 requiresthe Secretary of State to publish the number of ROC a designated electricity supplier is required toproduce in respect to each megawatt hour of electricity it supplies to customers in England and Walesduring an obligation period in order to discharge its renewable obligation for that period. For 2011-12,DECC sets the obligation level of 0.124 ROC/MWh, which will increase to 0.158 ROC/MWh nextyear. If an electricity supplier has not been able to cover its obligation, it may either buy more ROCsfrom others that have a surplus or pay a buy-out price (£36.99 per ROC in 2010-11) (Ofgem, 2010).Ofgem updates the buy-out price annually to reflect changes in the Retail Prices Index. Thus the ROCgives added value to producers of renewable electricity. Prior to the introduction of banding, one ROCwas issued to producers for each megawatt-hour of renewable electricity generated. Currently, newgenerators joining the RO receive different numbers of ROC, as shown in Table 2.
There is a provision of ‘mutualisation ceiling’ in the Renewable Obligation. It comes into effect whenan electricity supplier is unable to obtain sufficient funds to meet its renewable obligation. All othersuppliers, who have met their obligation, are then required to make additional payments to make upthe shortfall, up to the level of the’ mutualisation ceiling’, which is the maximum total amount they
16 IEA CLEAN COAL CENTRE
European Union

would have to pay. Mutualisation payment is in proportion to each suppliers’ obligation comparedwith the total obligation. For 2010-11, the ceiling is £222,805,333.33 in England and Wales, and£22,280,533.33 in Scotland. It is normally adjusted by Ofgem each year to reflect changes in theRetail Prices Index.
Cofiring is eligible for the RO, and its role in the RO has been reviewed on a number of occasions. Acap is placed on the extent to which cofiring ROCs can be used by a licensed electricity supplier.When the RO was introduced in 2002, the cap was set at 25% with requirement of at least 75% of thebiomass being energy crops. These rules were reviewed in 2004 in light of an increasingly apparentinsufficient supply of energy crops, and a number of changes were made as follows:� the date for cofiring to be phased out of the RO was postponed until 2016;� the energy crops share requirement was relaxed;� the overall cap was reduced to 10% from 2006 to 2010 and increased to 12.5% in April 2010
(Oxera, 2009).
The initial reduction in cap (25% down to 10%) was believed to be necessary in order to mitigate therisk that the potential volatility of cofiring volumes has on ROC prices. In a DECC-commissionedstudy, it was found that the level of cap, once beyond a certain level, has little effect on total cofiringdeployment and hence ROC prices. This is because technical constraints become more important infurther increase of cofiring capacity (Oxera, 2009). In the consultation paper on ROCs banding for2013-17, DECC is proposing to increase support for biomass cofiring. Coal-fired power stations thatburn more than 15% biomass will get 1 ROC/MWh support, double what they receive at present.DECC has also created a new ROC band to support converting coal-fired capacity to 100%biomass-fired capacity. In contrast, the Scottish Government does not increase its support for cofiringdue largely to concerns that the increasing demand from cofiring installations may constrain suppliesof biomass fuels for industrial heat production.
Despite these supports from the government, cofiring may be constrained by the extent to which theexisting coal-fired power generation continues to operate in the future. The Large Combustion PlantDirective (LCPD) has already forced seven UK coal-fired power stations to opt out of operation byend of 2015. Opt-in coal generation units fitted with FGD will need to comply with the IndustrialEmissions Directive (IED) from 2016. It is unlikely that all these plants will invest in expensive
17Support mechanisms for cofiring secondary fuels
European Union
Table 2 The current banding of ROCs for biomass firing and cofiring generation(DECC, 2009)
Generation type
Amount of electricity stated ineach ROC, MWh
Relevantproportion*
Remainder
Cofiring of biomass with CHP (burnt in separate boilers or engines) 1 2
Cofiring of energy crops with CHP (burnt in separate boilers or engines) 2/3 1
Dedicated biomass/energy crops with CHP 1/2 2/3
Cofiring of biomass 2
Cofiring of energy crops 2
Standard gasification 2
Dedicated biomass 2/3
Dedicated energy crops 1/2
* The relevant proportion, in relation to electricity generated by a qualifying combined heat and power (CHP) plant, is theproportion which the qualifying power output of that station bears to its total power output

selective catalytic reduction (SCR) to meet more stringent NOx emission standards. Instead, mostmay probably make use of either the delayed options for compliance by 2020 or the IED opt-outprovisions that allow continued but limited operation until 2023 before closure. Therefore, no morethan a few of the existing coal generation units or perhaps none will remain in service by 2030. Inaddition, the load factor of the remaining coal generation is also expected to reduce beyond 2015. Forthose units that do retrofit with SCR, biomass cofiring may also be constrained or ceased as thecombustion products associated with biomass may damage the SCR catalytic membranes.
Moreover, the role of coal in the UK future energy mix may be undermined considerably as a result ofgovernment’s recent Energy Market Reform. A Carbon Price Floor, announced in Budget 2011, willbe put in place as a key element of the reform package. Although this provides a stronger incentive toinvest in low-carbon generation, it makes coal-fired generation more expensive. The reform packagealso sets an Emission Performance Standard of 450 gCO2/kWh, which makes it actually impossible tobuild new coal-fired power stations without carbon capture and storage (CCS).
The Reform also introduces a new long-term feed-in tariff with contacts for difference. This providesstable financial incentives to invest in all forms of low carbon electricity generation. However, itsimplication for biomass cofiring is not clear at this stage as many details remain to be finalised by thegovernment.
2.5 Summary & comments
With more than 169 installations, Europe leads the world in deploying biomass cofiring technologieswith the main objective of promoting the use of renewable energy in line with EU’s energy andenvironmental targets. Cofiring is considered a cost-effective near- or medium-term option forreducing greenhouse gas emissions from existing coal-fired power or CHP plants.
Coal-fired power plants that cofire biomass are mainly located in Finland, Germany, the UK, Sweden,Denmark, Italy and the Netherlands (in descending order in terms of number of installations). Thetypical configuration applied in Finland is a fluidised bed combustion installation in the range of20–310 MW where different biomass wastes from the wood industry are directly cofired with a widerange of fuels. Fuel flexibility is a key requirement for the Finnish cofiring installations. One reasonfor this is the sparse population which makes specialised mass burning installations uneconomic. TheGerman cofiring installations are mainly of PCC type, while a few installations are on fluidised bedfurnaces. Sewage sludge is the most common biomass fuel for cofiring, whilst wood chips, straw andrecycled/refuse fuels are also cofired on some installations. In the UK, direct cofiring is undertaken in18 large coal-fired generation units. The principal fuels are wood pellets and imported food processingresidues, though some liquid biomass fuels and energy crops are also burned in some plants. InSweden, there are a large number of grate-fired boilers in the range of 1–20 MW operated for districtheating with frequent opportunities for cofiring different types of residues. In the paper and pulpindustries, there are both fluidised bed and grate furnaces that burn mixtures of bark, sludge, woodresidues, oil and some coal. Denmark has intensive experience in cofiring straw at very high ratios indifferent combustion configurations. There, the cofiring installations have demonstrated great fuelflexibility and extensive tests have also shown the limitation of the direct cofiring concept. In Italy,there are six cofiring installations on PCC boilers with capacities of 165–240 MWe and oneinstallation on a CFB boiler. Wood chips are the main biomass fuel for cofiring. Direct cofiring iscommon practice in the Netherlands with all its seven cofired units undertaking cofiring. Cofiringrates up to 15% (heat) are common and higher cofiring rates have been achieved. Wood pellets,demolition wood, paper sludge, meat and bone meal and other wastes are used as cofiring fuels.
The European countries have adopted a broad range of mechanisms to support biomass cofiring. Somemechanisms create disincentives for fossil fuels by taxing them or by making greenhouse gasesemissions expensive. Carbon tax and tax exemption for biomass fuels fall into this category.
18 IEA CLEAN COAL CENTRE
European Union

Alternatively, others aim to ensure viable markets for electricity or heat produced from biomass, suchas a feed-in tariff for renewable electricity or an obligation for electricity suppliers to include a certainlevel of renewable electricity into their supply portfolio. Still other policies and incentives focus oninvestment support and cost reduction of biomass-based power generation projects. Such diversifiedsupport mechanisms allow the governments to support biomass cofiring in a cost-effective manner.Nevertheless, a trend seems to emerge that most governments are increasingly in favour of feed-intariffs, which pass on the cost of support directly to end users of electricity.
19Support mechanisms for cofiring secondary fuels
European Union

3 USA
20 IEA CLEAN COAL CENTRE
Biomass has been used in many ways in the USA for energy production. This includes co-generationof steam and electricity in the industrial sector, power generation in the electricity sector, spaceheating in residential and commercial buildings, and transformation into liquid transport fuels.Biomass has played a relatively small role in terms of the overall US electricity generation. However,as the US political landscape for renewable energy and climate change has improved in recent years,biomass-based electricity generation (or biopower) is expected to increase significantly. This chapteranalyses the regulations, financial incentives and R&D initiatives that the USA has adopted forpromoting biopower and particularly biomass cofiring.
3.1 US energy and climate policies
The USA is heavily reliant on fossil fuels for energy supply. In 2009, petroleum, coal and natural gascomprised 83% of the nation’s total energy supply; the remaining portion came from nuclear (9%) andrenewables (8%) (EPA, 2011). Despite active promotion of energy efficiency and renewable energy,fossil fuels are still expected to provide 78% of US energy use in 2035 (EIA, 2011). Such a heavyreliance on fossil fuels has given rise to increasing concerns over energy security and environmentalimpact. Furthermore, the USA is currently the second largest emitter of GHG, accounting for almost20% of the world total. While climate change policy is unsettled in the USA (the nation has neitherratified nor withdrawn from the Kyoto Protocol), it has formally submitted its proposed GHGemissions target for 2020 to the UN under the Copenhagen Accord in 2010. It has pledged its goal toreduce GHG emissions by 17% by 2020 relative to 2005, although its target was dependent ondomestic climate legislation being passed (UNFCCC, 2012).
To meet these energy and climate challenges, the US Government has created an array of energypolicies that provide motives for a specific course of action regarding the use of energy. The EnergyPolicy Act of 2005, the Energy Independence and Security Act of 2007, and the Emergency EconomicStabilisation Act of 2008 each promote energy efficiency improvements and encourage developmentof renewable energy resources. The American Recovery and Reinvestment Act of 2009 includes morethan US$70 billion in direct spending and tax credits for clean energy and associated transportationprogrammes. In the 2011 State of the Union address, the Obama administration called for a cleanenergy standard that would set a goal of generating 80% of the country’s electricity from clean energysources by 2035. The Senate Energy and Natural Resources Committee has issued a white paper forcomment on this proposal.
The USA has also made progress in relation to policy and regulation development for climate change,particularly at the regional and the state level. A federal-level climate legislation has beenunsuccessful, though a small number of bills have been introduced in 2009-10. Nevertheless, theEnvironmental Protection Agency (EPA) now has the capacity to regulate GHG emissions fromstationary emitting sources, including power plants, refineries, and cement production facilities,following the Supreme Court’s rule in April 2007 that GHG is an pollutant under the Clean Air Act.EPA now requires permits under the New Source Prevention of Significant Deterioration (PSD) andthe Title V Operation for new industrial facilities that emit GHG in excess of 100,000 tCO2/y andexisting facilities where modification leads to an increase in emissions by at least 75,000 t/y. On23 December 2010, The EPA issued a proposed schedule for establishing GHG standards under theClean Air Act for fossil fuel fired power plants and petroleum refineries. This schedule provides ameasured and sensible path forward, which will allow the agency to address pollution from sourcesthat make up nearly 40% of the nation’s GHG emissions (EPA, 2011). These GHG standards areexpected to cover only new power plants. It is not clear when the more important guidelines forexisting plants will be issued.

At the regional level, nine Northeastern US states are involved in the Regional Greenhouse GasInitiative, a state level emissions cap-and-trade programme aiming for 10% reduction of CO2emissions from the power sector. Also, 1055 cities have joined the US Conference of Mayors’ ClimateProtection Agreement, vowing to reduce their CO2 emissions below 1990 levels, in line with theKyoto Protocol (CPC, 2011). At the state level, California began to implement its comprehensivestatewide climate programme, which combines targeted measures to achieve emission reductions inparticular sectors with a broad multi-sector GHG cap-and-trade programme. The regulationsgoverning the cap-and-trade programme were finalised in 2011, setting the stage for the system tocome into operation in 2013. As part of the Western Climate Initiative, California is looking to link itsprogramme with that in Québec also starting in 2013 and with programmes in Ontario and BritishColumbia once those are established (Kennedy, 2011).
3.2 Biopower and biomass cofiring
Electricity generation is the largest source of energy demand and consequently the largest sectorcontributor to GHG emissions. In 2009, coal and natural gas provided 44.6% and 23.3% of the total netelectricity generation, while conventional hydropower and non-hydro renewable sources accounted for9.6% and 3.6% respectively (EPA, 2011). The electricity consumption is projected to grow by 30%through 2035, though the rate of growth has slowed. The projected electricity generation gradually shiftsto low-carbon options; in particular, non-hydro renewable energy is projected to grow nearly three-fold.The increase in non-hydro renewable energy is due to considerable development of wind energy andbiopower, and to a less extent to other forms of renewables such as geothermal, solar and wastes.
As of 2009, there was 10.8 GW of biopower capacity in the country, representing 1.4% of total USelectricity generation capacity and 33.9% of total US non-hydro renewable power generation capacity(Levine, 2011). Woody biomass provided 0.9% of total US electric power generation, and 73% of thiswent to industrial CHP applications. The remaining biopower was mostly based on the use of biogenicmunicipal wastes, landfill gas and municipal sewage sludge. Dedicated biomass plants dominatedwoody biomass based power generation, generating 8.41 billion kWh of electricity in 2007, whilecofiring plants generated only 1.97 billion kWh (EIA, 2009). There have been over 40 commercialcofiring demonstrations, most of which are on old and small-sized (<200 MWth) power plants (IEABioenergy Task 32, 2011). A broad combination of fuels, such as residues, energy crops, herbaceousand woody biomass have been cofired in PCC, stoker and cyclone boilers. The proportion of biomasshas ranged from 1% to 20% by weight. Large-scale cofiring projects are under consideration byutilities as a means to comply with the Renewable Portfolio Standard (RPS). However, manyrepowering and cofiring projects are now put on hold as utilities are still concerned about technical,economic and regulatory risks. EIA projected that electricity generation from cofiring power plantswill increase by 17.4% annually to 78.17 billion kWh of electricity in 2030 (EIA, 2009). Such anincrease is the result of a variety of regulatory and financial incentives, which will be discussed brieflyin the following section.
3.3 US supporting mechanisms for biomass cofiring
There have been regulatory and tax incentives to promote the development of biomass and otherforms of renewable energy since the late 1970s.
3.3.1 PURPA
The Public Utility Regulatory Policies Act (PURPA), instigated in 1978, was to promote greater use ofindigenous renewable energy by forcing then regulated natural monopoly electric utilities to buypower from more environmentally friendly generation sources. This act became the basic legislation
21Support mechanisms for cofiring secondary fuels
USA

that enables renewable energy providers to gain a toehold in the market and exempts developers ofrenewable energy projects from numerous State and Federal regulatory regimes. However, PURPA’ssignificance is reducing because many of the contracts made under it during the 1980s are expiring.Electric deregulation and creation of a vast energy market easily accessible by utilities also promptedthe State regulatory agencies to stop forcing utilities to give contracts to developers of non-utilityprojects. In February 2005, an amendment was introduced to PURPA calling for an RPS.
3.3.2 Renewable Portfolio Standard
RPS requires end-use electricity providers to procure a proportion of their electricity supply fromqualifying renewable resources. As of July 2009, 29 states and the District of Columbia havemandatory RPS regimes, while five additional states and Guam have non-binding renewable portfoliogoals. Different states have different RPS targets; for example, in California, the RPS law requires33% of renewable by 2020, whereas New York has a 24% requirement by 2013. Whether biomasscofiring with fossil fuels qualifies under such a regime varies from state to state. A number of stateshave explicitly defined cofiring as a qualifying resource, while others have excluded it outright, likelybecause of its dependency on coal facilities. Also, in some states, the governing state commissionwould have to determine whether cofiring constitutes a renewable resource on a case-by-case basis.Although RPS rules might be specific to each state, it is true that these standards typically attach realfinancial value to electricity produced from renewable resources. RPS policies can incorporate amarket-based mechanism, the tradeable Renewable Energy Credits (see Section 2.3.4 for details), forRPS compliance so as to provide for contracting flexibility, to lower compliance costs and to simplifyverification.
The US Congress has considered a federal RPS (also known as renewable electricity standard or RES)since 1997-99: the Senate has passed legislation three times, and the Representative House once. Mostrecently, three congressmen have proposed new legislation calling for a national RPS in the lastcongress session, the main provisions of which are listed in Table 3. However, both houses have notacted in unison to pass any legislation so far. While many in Congress support a national RPS becauseof its perceived benefits for resource diversity, price stability, and environmental quality, others areconcerned that it could lead to higher consumer costs and differential regional impacts.
A study by the US National Renewable Energy Laboratory (NREL) analysed the possible impacts ofthe above three legislation proposals on the US electricity sector (Sullivan and others, 2009). TheMarkey scenario was the most straightforward because it had no efficiency component. Under thisscenario, renewables generation, including biomass cofiring with coal, largely displaced coal-firedpower, while natural gas capacity and generation remained constant from the reference scenario (thatis no legislation implemented). The study also showed that an efficiency allowance tended to reducethe overall electricity demand, so that with a less aggressive renewable standard, not only renewablebut also coal and gas generation are likely to decline compared to the reference case. Nevertheless, thebiomass cofiring generation increased in spite of a demand reduction, probably due to its costeffectiveness as a renewable generation source.
3.3.3 Voluntary green pricing programme
In 2009, state RPS policies collectively called for utilities to procure about 29.5 billion kWh of newrenewable power generation, compared to about 30 billion kWh sold to the voluntary green powermarkets. Voluntary consumer decisions to buy electricity from renewable energy sources thusrepresent another important support mechanism for renewable power development. Since the early1990s, US utilities have begun offering green power options to their customers. These programmes,termed ‘green pricing’, allow customers to purchase some portion of their power supply fromrenewable generation sources, generally at a higher price (with a premium), so as to contribute funds
22 IEA CLEAN COAL CENTRE
USA

for the utility to invest in renewable energy development. Customers can either purchase green powerfor a certain percentage of their electricity use or in discrete amounts or blocks at a fixed price. Mostutilities offer block products but may also allow customers to buy green power for their entire monthlyelectricity use. Utilities that offer percentage-of-use products generally allow residential customers toelect to purchase 25%, 50%, or 100% of their electricity use as renewable energy, while a few offerfractions as small as 10%. Large business users can often purchase green power for some fraction oftheir electricity use as well. The US DOE’s National Renewable Energy Laboratory (NREL)estimated that approximately 1.4 million US electricity customers nationwide purchased green powerproducts in 2009 through regulated utility companies from competitive green power markets, or in theform of RECs (NREL, 2009). RECs may come from nationwide renewable energy sources and besold nationally; alternatively, RECs may be subject to locality requirement – that is they are suppliedfrom renewable energy sources in a particularly region and marketed as such to local customers.
A detailed illustration of utilities’ green pricing programmes by state can be found on the website ofUS DOE’s Office of Energy Efficiency and Renewable Energy. In 2009, approximately 860 utilities in41 states are now offering green pricing programmes. The types of renewable power include wind, PV,landfill gas, hydro, geothermal, biomass and other various local renewable projects. However, biomasscofiring with coal is covered by just two utilities as shown in Table 4.
In 2009, the price of green power for residential customers ranged from –0.17 ¢/kWh to 10.00 ¢/kWhabove standard electricity rates with an average premium of 1.75 ¢/kWh (NREL, 2009). Thesepremiums have been adjusted to account for any fuel-cost exemptions granted to participants of thegreen pricing programme. Since 2000, the average premium has dropped to a compound annual rateof 7% (NREL, 2009). Some of this reduction can be attributed to lower market costs for renewableenergy suppliers or increased competitiveness over conventional generation sources. Thiscompetitiveness as well as regional demand for state RPSs will affect the price premium in comingyears.
23Support mechanisms for cofiring secondary fuels
USA
Table 3 The main provisions of three recent RES bills
Provisions Jeff Bingaman Edward Markey Henry Waxman
RPS target4% by 2011, 20% by2021 through 2039
6% by 2012, 25% by2025 through 2040
Same as Markey
Covered entitiesAll suppliers sellingmore than 4 millionMWh except in Hawaii
All suppliers sellingmore than 1 millionMWh
Same as Markey
‘Exisiting’ versus ‘New’renewables
RECs for existingrenewables (before1 January 2006) cannotbe traded
No differentiation No differentiation
Energy efficiencyallowed
Yes; can be used toaccount for up to 25% oftarget each year
No; Markey proposes anindependent scheme forenergy efficiency
Yes; states may petitionto reduce annualobligation by up to 20%if utilities comply withthe separate energyefficiency scheme
REC multiplier
2 federal RECs per kWhfor projects on triballands; 3 RECs per kWhfor distributed generationat customer sites with1 MW limit
3 federal RECs per kWhfrom distributedgeneration sources(non-combustionprojects at or nearcustomer sites, up to2 MW)
Same as Markey

3.3.4 Renewable Energy Credit
Renewable Energy Credit (REC), also known as green tags or tradeable renewable certificates, aretradeable, non-tangible energy commodities in the USA. One REC proves that 1 MWh of electricity isgenerated from an eligible renewable resource. In states that have a REC programme, a green energyprovider is credited with one REC for every 1 MWh of electricity it produces. A certifying agencygives each REC a unique identification number to make sure that it is not double-counted. It should benoted that the REC can be sold separately from the underlying renewable electricity and used byanother consumer. REC thus provides a subsidy to electricity generated from renewable sources.
There are two main markets for RECs in the USA: compliance markets and voluntary markets.Compliance markets are created by the RPS policies that exist in 29 states and the District ofColumbia. Electric utilities in these states can demonstrate their compliance with RPS rules bypurchasing RECs. Voluntary markets provide the opportunity for corporate and household customersto purchase renewable power out of a desire to contribute to climate change mitigation. Renewableenergy generators located in states that do not have a RPS regime can sell their RECs to voluntarybuyers, usually at a cheaper price than compliance market RECs. The value of RECs and theemergence of voluntary RECs markets depend on the compliance markets created through legislationin RPS-complying states. However, such a balkanised approach to establishing RECs markets andincentives state by state creates issues of equity, as some states could legitimately claim that theirneighbouring states and electricity consumers with voluntary RPS are operating as free riders ofpollution prevention, paid for by states with mandatory RPS.
In general, REC prices depend on a number of factors, including supply/demand balance, therenewable technology, the year the RECs were generated, the volume purchased, the location ofrenewable energy sources, whether they are eligible for certification, and whether the RECs arebought to meet compliance obligations or serve voluntary retail consumers. Natural gas prices canalso affect the cost competitiveness of a certain renewable energy sources, which is reflected in theREC price.
The USA currently does not have a national registry for issuing RECs. The Center for ResourceSolutions (CRS) administers a voluntary programme, called Green-e®, which attempts to ensureRECs are properly accounted for and no double counting occurs. Under the Green-e® programme,participants are required to submit an annual Verification Process Audit of all eligible transactions toensure the RECs meet the certification requirements. The certification process requires a third partyverification to be performed by an independent certified public account or a certified internal auditor.Increasingly, RECs are being assigned unique ID numbers and tracked through regional trackingsystems such as WREGIS, NEPOOL, GATS, ERCOT and M-RETS. Biomass, biofuels and landfillgas, and in some states, combined H&P systems qualify as producers of RECs. Eliminating doublecounting is important to the integrity of the green power market because consumers who pay apremium for green power want to support renewable energy that would not have been otherwisesupported through regulatory requirements.
24 IEA CLEAN COAL CENTRE
USA
Table 4 Utility Green Pricing Programme that include biomass cofiring in the USA
State Utility Name Program Name Type Start Date Premium
ALAlabama PowerCompany
Biomass-cofiring(wood)
RenewableEnergy Rate
2003/2000 4.5 ¢/kWh
FLTampa ElectricCompany
RenewableEnergy
Biomass cofiring(wood)
2001 2.5 ¢/kWh

3.3.5 GHG offsets
Green power markets are affected by other related markets, such as the emerging US market for GHGoffsets (also known as carbon offsets). A GHG offset is a tradeable commodity representing a unit ofGHG emissions reduction or avoidance, typically, one metric tonne of CO2. Energy consumers arebuying this type of commodity to offset their own emissions, such as those associated with heating,product manufacturing, automobile use and air travel. GHG offsets can be derived from a variety ofproject types including renewable electricity generation, energy efficiency measures, methane captureat landfill sites, soil carbon sequestration, and forestry projects. Biomass-based power generation is aneligible type of emission reduction project. However, whether biomass-cofiring with coal is eligible isnot clearly defined. Developers of these projects can sell GHG offsets to help finance their projects.Offsets must demonstrate additionality, that is the resulting emission reductions are additional to whatwould have occurred anyway. Several independent certifiers, for example Center for ResourceSolutions, Environmental Resource Trust and the Chicago Climate Exchange, have created standardsfor verifying GHG offsets to ensure that they are real, measurable and complying with regulatoryrequirements.
The fact that a renewable power project may generate both GHG offsets and RECs has raisedconcerns of double-counting if the same kilowatt-hour is sold as both an offset and a REC. Certifiersgenerally do not allow this type of double counting. For instance, The Center for Resource Solutionscertifies GHG offsets under its Green-e® Climate protocol. This protocol requires that the RECsassociated with a certain renewable power generation be retired as part of the substantiation for theGHG offset claim by that generation under Green-e® Climate. By retiring the RECs, it is assured thatthey are not sold in the voluntary green power markets or used for RPS compliance.
3.3.6 Biomass cofiring R&D initiative
The US Department of Energy (US DOE) has funded biomass cofiring R&D activities during1994-2003 at its national laboratories and in utility boilers with partners including the Electric PowerResearch Institute and the Tennessee Valley Authority. These studies indicated the technical feasibilityof biomass cofiring. Utility cofiring technologies had been largely evaluated and demonstrated by2001. The US DOE’s emphasis then shifted to biofuels.
In recently years, there has been huge interest in biopower technologies as a way to comply with theRPS. However, many utilities are still concerned with technical, economic and regulatory risks, whichsignificantly affect their investment decisions. To address some of these concerns, the US DOE hasproposed a new Biopower Initiative in the Biomass Program of its Office of Energy Efficiency andRenewable Energy to accelerate the development and deployment of advanced biopower technologies(Levine, 2011). The Initiative will consider improvements throughout the biopower supply chain andinvest in RD&D to accelerate biopower application at the utility scale. In the near-term, the BiopowerInitiative is establishing partnerships with industry to prioritise R&D needs with a focus ondemonstrating and documenting the potential for high-rate cofiring biomass with coal (up to 20%,HHV). The mid-term objective is to conduct R&D on pretreatment and conversion technologies sothat the processed biomass can be optimised at reduced production costs for integration with advancedpower systems. The Initiative envisages pilot-scale demonstration of up to 30 MW for improvingoperation efficiency and overall power plant performance.
Biopower activities have been included in the US DOE’s 2010 Multi-Year Programme Plan (MYPP)and the FY2012 Federal Budget released on 14 February 2011. The MYPP sets forth the goals andstructure of the biopower initiative for the next five years. It identifies the market and technicalbarriers on which the initiative will focus, and proposes a systematic approach to overcome thebarriers in five aspects: analysis, biopower interfaces, biopower R&D and demonstrations. TheFY2012 Budget (US$22.5 million for biopower) initiates a competitive solicitation for cofiring
25Support mechanisms for cofiring secondary fuels
USA

biomass with coal and biomass densification RD&D, including a feedstock supply assessment toultimately add 30 MW new generation by 2016 (Levine, 2011).
3.4 Tax incentives ineligible for biomass cofiring with coal
The USA has adopted important tax incentives for promoting electricity generation from renewablesources. However, biomass cofiring with coal is ineligible for them. Since these incentives often causeconfusion in understanding subsidy mechanisms for biomass cofiring, a brief introduction is given inthis section.
The production tax credit (PTC), as authorised by the 1992 Energy Policy Act and amended over time,was targeted to support electricity generated from certain types of renewable energy projects,including wind, both closed- and open-loop biomass, geothermal, landfill gas, municipal solid waste,qualified hydropower, and marine and hydrokinetic facilities. For wind, closed-loop biomass, andgeothermal power, the inflation-adjusted credit stood at 21 US$/MWh in 2008; the other eligibletechnologies receive half of the PTC’s value (10 US$/MWh in 2008). The global financial crisis of2008-09 created significant financing challenges for many renewable power projects, and thus resultedin diminished investor demand for tax credits. In response, the US Congress included severalprovisions in the American Recovery and Reinvestment Act of 2009 – ARRA, 2009 – designed tomake federal incentives for renewable power technologies more useful. Among these provisions is onethat allows projects eligible to receive the PTC to instead elect the investment tax credit (ITC). TheITC is equal to 30% of the cost of development, with no maximum credit limit, and is generated at thetime the qualifying facility is placed in service. Another provision, termed the Section 1603programme, enables qualifying renewable power projects that are eligible for either the Federal PTCor ITC to instead elect, for a limited time only, a cash grant of equivalent value from the US Treasury.These two provisions, among others, could have a significant impact on how renewable powerprojects are financed in coming years. However, biomass cofiring with coal is not eligible for thefederal PTC, ITC or the Section 1603 programme.
The Energy Tax Incentive Act of 2005 authorises state and local governments, co-operative electriccompanies, clean energy lenders and Indian tribal governments to issue clean renewable energy bonds(CREB) to finance certain renewable energy and clean coal facilities. CREB lenders receive a taxcredit quarterly from the Federal Government instead of an interest payment from the borrower.CREB therefore provide qualified renewable energy developers with the ability to borrow at zerointerest rate. On the other hand, the lenders receive greater federal tax benefits from CREB than fromtax-exempt municipal bonds because the tax credits derived from CREB can be used to offset, on adollar-for-dollar basis, a lender’s current year tax liability, as opposed to excluding interest from grossincome for tax-exempt bonds. The CREB volume authority is allocated by the Internal RevenueService on a project-by-project basis rather than assigning volume cap authority to each state. Anindependent licence engineer statement is required to certify that the candidate project is qualified.CREB funds must be spent within five years, and the maximum maturity for the CREB will be setmonthly by the US Treasury. Qualifying projects include both close-loop and open-loop biomassfacilities, but exclude biomass cofiring with fossil fuels, municipal solid wastes and theirbiodegradation gas (Oswald and Larsen, 2006).
3.5 Summary
This section discusses main supporting mechanisms for biopower in the USA and their eligibilities forbiomass cofiring with coal. It shows that state-level renewable portfolio standards and green pricingprogrammes are currently the most important driving force for development of biomass cofiringprojects. In most incentives, the languages around ‘qualified projects’ are not clear enough to definethe eligibility of biomass cofiring with coal. Some important tax credits, including PCT, ICT, the
26 IEA CLEAN COAL CENTRE
USA

1603 programme and CERB, explicitly exclude biomass cofiring with fossil fuels as qualifyingprojects. The primary reason is concerns around the notion that biomass cofiring may lead to retentionor even increase of coal-fired power generation, the most CO2-polluting generation source.
27Support mechanisms for cofiring secondary fuels
USA

4 Australia
28 IEA CLEAN COAL CENTRE
Australia is the world’s twentieth largest primary energy consumer and ranks fifteenth on a per capitabasis (ABARES, 2011). Australia’s energy consumption is primarily composed of fossil fuels, whichrepresent some 95% of total energy consumption. Of the total 5945 PJ of primary energy consumed inAustralia during 2009-10, some 37.5% came from coal with oil and natural gas supplying 34.6% and23.1%, respectively (Schultz and Petchey, 2011). There has been a steady fuel switch from coal tonatural gas over the past 30 years, resulting in an increase of the share of natural gas in Australianenergy mix; this trend is likely to continue in the longer term. Australia’s growth in energyconsumption has gradually slowed, increasingly lower than the GDP growth over the past two decades(Schultz and Petchey, 2011). Given the depressed recovery of world economy and high energy prices,it is unlikely that the country’s total energy consumption will increase considerably in the near andmedium future.
Australia’s heavy dependence on fossil fuels for its energy supply results in a very high carbonintensity, though the energy intensity has declined gradually over the past three decades. TheAustralian Government has given priority of development to renewable energy as a means of reducingthe country’s carbon footprint. Biomass, as the most important renewable energy resource inAustralia, has a particularly important role to play. The Australian Government has already instigateda number of policy initiatives to promote the use of biomass for electricity generation since 1997.These initiatives have driven the steady increase in the share of bioenergy in Australia’s total energyproduction.
Cofiring of biomass with coal has been trialled for technological feasibility in a handful of coal-firedgeneration units in Australia, but is yet to be widely applied in Australia. This chapter discusses issuesrelated to the development of cofiring in Australia.
4.1 Bioenergy in Australia
Australia has significant and widely distributed wind, solar, geothermal, hydropower, ocean energyand bioenergy resources. The share of renewables has remained largely constant over time; in2009-10, the country obtained some 4.8% of its primary energy requirements from renewableresources. At the end of September 2011, renewable energy’s contribution to total electricitygeneration rose to 9.6% (Clean Energy Council, 2011a). The average annual growth in renewableenergy production has been 1.1% over the past five years, compared to –0.5% for coal, 2.3% for oiland 5.6% for natural gas (ABARES, 2011). Except for hydroelectricity, where the availableresource is already mostly developed, and wind energy, which is growing strongly, renewableresources are largely undeveloped and could contribute significantly more to Australia’s futureenergy supply.
Australia has a large potential in bioenergy. Bioenergy currently generates 2.5 TWh/y, around 1%of total electricity generation in Australia (Clean Energy Council, 2011a). This is a very smallshare compared to 74.5% for coal, 15% for natural gas, 4.7% for hydro and 1.5% for wind(ABARES, 2011). With the abundant biomass resources and the right policy setting, electricitygeneration from biomass is expected to increase at an average rate of 2.3% to 3 TWh by 2029-30(ABARES, 2010).
The current installed bioenergy capacity amounts to 773 MW, or 6.2% of Australia’ total renewablegenerating capacity. A little under two thirds of the existing capacity is from the combustion of sugarcane waste, known as bagasse. The second largest contributor is landfill gas, followed by black liquorand sewage gas (see Figure 3). Bioenergy grew only marginally in recent years. The challenging

financial environment, the soft price ofrenewable energy certificates, and the issueswith connecting some types of bioenergy tothe grid continued to have an adverse impacton the development of new bioenergy projects.
Australia’s sugar cane industry is locatedmainly in coastal Queensland, with a few millsin northern New South Wales. According toClean Energy Council’s Renewable EnergyDatabase, there are 29 bagasse co-generationprojects, with a total installed capacity of474 MW. Most sugarcane mills utilise bagasseto co-generate steam and electricity for theirown needs, but recently some plants have beenexpanded and upgraded to allow any extraelectricity to be sold to the power grid. Inaddition, new and relatively largeco-generation plants (~35 MW) have beenestablished in recent years. Examples includethe Condong and Broadwater sugar mills inNew South Wales and the Rocky Point sugarmill in Queensland, where both bagasse andcane trash are utilised as the base fuel andother locally available biomass fuels, such assawmill residues, as supplemental fuels.
Biogas captured from landfill and sewage treatment plants is the second largest source of biomass forelectricity production. There are 72 landfill gas projects (total installed capacity of 165 MW) and43 sewage gas projects (43%MW in total), respectively (Clean Energy Council, 2011a). Most of thesebiogas facilities are located near the major urban centres and used locally.
Black liquor, the liquid residue arising in the paper and pulp industry, is the third most importantbiomass fuel used to generate electricity. It has a sufficiently high energy content for it to be used in adirect firing operation, sometimes in conjunction with other waste biomass streams to raise processsteam and generate electricity for on-site needs. There are 77 MW installed capacity in three projects(Clean Energy Council, 2011a).
There are two projects using wood waste as feedstock to generate electricity, which have a totalinstalled capacity of 6 MW (Clean Energy Council, 2011a).
4.2 Biomass resources in Australia
Australia has substantial biomass resources for energy production. Current biomass resources includeagricultural related wastes, wood related waste, forestry wastes, energy crops, industrial wastes, urbansolid waste, landfill gas and sewage gas. Native forests and old growth forests are excluded fromconsideration as biomass resources for energy production except for wood wastes that arise fromprocessing native forest products (such as timber) and are permitted to be used as a biomass fuel.
Various estimates have been made of the size of biomass resources available at national and regionallevel in Australia. These estimates can be found in an array of publications from the Department ofAgriculture, Fisheries and Forestry (http://www.daff.gov.au/abares/publications). An often quotedappraisal of bioenergy resources for stationary energy was undertaken by the Clean Energy Council in
29Support mechanisms for cofiring secondary fuels
Australia
black liquor
food and agricultural wet waste
landfill gas
wood waste
Sewage
bagasse cogeneration
10%
1%
21%
1%
6%61%
Figure 3 Installed capacity of bioenergy bydifferent biomass fuels (Clean EnergyCouncil, 2011a)

30 IEA CLEAN COAL CENTRE
Australia
Table 5 The potential for stationary bioenergy generation in Australia (Clean EnergyCouncil, 2008)
BiomassQuantity Conversation
technologies
Electricity generation, GWh/y
2005-06 2010 2020 2050
Agricultural related waste
Poultry 94,384,000 populationAD/RGE – 90 848
P – 207 207
Cattle (feedlots) 87,025 population AD/RGE; DC/ST – 112 442
Pigs 1,801,800 population AD/RGE 1 22 205
Dairy cows 1,394,000 population AD/RGE – 22 89
Abattoirs 1,285,000 t AD/RGE 337 1173
Nut shelles – DC/T 1 1
Stubble residues from grainand cotton crops
24,000,000 t DC/ST; G/GT; P 47,000
Bagases (sugar cane residue) 5,000,000 t DC/ST 1200 3000 4600
Sugar cane trash, tops andleaves
4,000,000 t DC/ST – 165 3200
Energy crops
Algae – AD/RGE; P – –
Oil mallee – DC/ST; G/GT; P 112 484
Woody weeds
Camphor laurel – DC/ST; G/GT; P 83 20
Forest residues
Native forest (public & private) 2,200,000 t AD/RGE; DC/STbriquetting andpelletising;G/GT; charcoalproduction;cofiring
79 2442 4554Plantation (public & private) 3,800,000 t
Sawmill and wood chipresidues
2,800,000 t
Pulp and paper mills wastes
Black liquor – DC/ST 285 365 365
Wood waste – DC/ST 60 85 85
Recycled paper/wet wastes – AD/RGE 2 8 8
Paper recycling wastes – DC/ST 12 48 48
Urban waste
Foot and other organics 2,890,000 tAD/RGE 13 126 565
DC/ST 16 141 189
Garden organics 2,250,000 tP – 37 186
AD/RGE 29 84 275
Paper and cardboard 2,310,000 tDC/ST – – 1584
P – 38 191
Wood/timber 1,630,000 t DC/ST 45 295 1366
Landfill gas 9,460,000 tspark ignitionengine; cofiring;flaring
772 1880 3420
Sewage gas 735,454 t AD/RGE; DC/ST 57 901 929
AD anaerobic digestion; RGE reciprocating gas engine; P pyrolysis; DC direct combustion; ST steam turbine; G gasification; GT gas turbine

2008 to estimate the potential by 2020 and in the longer term by 2050. The assessment is primarilybased on quantities of main waste streams available in 2005-06 (see Table 5). It showed 10,624 GWhof new bioenergy by 2020 and 72,629 GWh by 2050 as the long-term potential (Clean EnergyCouncil, 2008). It is apparent that this level of new production is not being achieved; even maturebioenergy technologies have not reached their resource potential due to a number of barriers. TheClean Energy Council has identified four classes of barrier that are inhibiting the bioenergy sector:institutional failure in the regulations and market structures, system rigidities, diseconomies of smallscale, and uncompetitiveness in cost and technology performance (Clean Energy Council, 2011b).
There is a wide range of biomass resources that could be used potentially for cofiring with coal inpulverised fuel boilers. The exact suitability and quantity of biomass resources for cofiringapplications are determined largely by two factors: fuel quality and cost. Only such biomass fuels witha quality that ensures acceptable performance of the cofiring boiler can be used. The suitable qualityis influenced by the cofiring rate and the type of cofiring technology. Well designed fuel handling andpreparation steps may be needed to accommodate the wide variations in the properties of theincoming fuel. Cost is the other important determinant of the viability of any biomass materials forcofiring operation. Most agricultural wastes and forestry residues have nearly zero cost at the point ofgeneration or an effective negative cost if significant landfill fees can be avoided. However, these fuels
may incur significant collection costs if theyare widely dispersed. The low bulk densityand low energy density of most biomass fuelsmake their transport expensive on an energybasis. Consequently, transport distances areprobably limited to around 80–100 km of thepower station that utilise these fuels. Table 6lists the indicative costs for some biomassfuels given in the Coal-Biomass CofiringHandbook published by the CooperativeResearch Centre for Coal in SustainableDevelopment (Moghtaderi and Ness, 2007).
Taking these considerations together, the biomass resources most suitable for cofiring include landfillgas and wood-related wastes, including forestry residues from forest management and woody wastesfrom timber production and sawmills. The use of landfill gas is, however, restricted by the proximityof the landfill site to the power station that intends to cofire the gas. In Australia, stationary energygeneration from wood-related wastes is significantly below that of other OECD countries, with only ahandful of plants generating a small amount of electricity using timber harvesting residues andsawmill wastes. This is mainly due to the nationwide resistance to combusting woody material forenergy production due to perceived environmental impacts (see Section 4.5). Australia has significantpotential in wood-related wastes. Such potential may increase in line with plantation expansion as thecountry meets its 2020 Vision target of three million hectares. If the growth in plantation continues atthe current level, there will be around five million hectares of plantation by 2050. With five millionhectares of new plantations by 2050, and all other factors remaining constant, this could mean thepotential generation of about 3500 GWh of electricity from plantation wood residues by 2050 and atotal of 5060 GWh from wood waste in general (Clean Energy Council, 2008).
4.3 Cofiring in Australia
In Australia, power generation companies have adopted the practice of coal/biomass cofiring since1999. The main driver behind this was the Renewable Energy (Electricity) Act 2000. In 2009,Macquarie Generation’s Liddell Power station in New South Wales became the first coal-fired powerstation in the country licensed to carry out cofiring for electricity generation. Macquarie Generationthen expanded the cofiring practice into its Bayswater power station after successful trials at Liddell
31Support mechanisms for cofiring secondary fuels
Australia
Table 6 The estimated cost range of typicalAustralian biomass fuels(Moghtaderi and Ness, 2007)
Biomass Estimated cost range, A$/GJ
Bagasse 0–0.8
Sawmill waste 0–2.4
Urban green waste 0–2.0

power station. Biomass fuels supplied to these two stations include sawdust and shavings fromsawmills, forest thinnings and laminate and medium-density fibreboard plant wastes. They account for2% of energy output or 5% of biomass fuel by mass because of the lower calorific value of thebiomass fuel compared to Australian black coal. At full capacity, the two stations consume about900 kt/y of biomass fuels (Moghtaderi and Ness, 2007). Seven other pulverised coal fired powerplants have also had experience in cofiring. Delta Electricity cofire sawmill residues, construction anddemolition wood waste as well as urban green waste in its three pulverised coal fired power stations inNew South Wales – Vales Point, Mt Piper and Wallerawang, which together avoid up to 20 kt of GHGeach year. In Queensland, Stanwell, Tarong and Swanbank B cofire wood wastes, while the Mujastation in West Australia cofires plantation forest waste and green waste. Despite some technicaldifficulties, the cofiring technology appears to be fully adopted as a full-scale operation by theelectricity generation sector. The average cofiring rate is lower than that used in European cofiringpower plants. Most plants cofire 5 wt% of biomass, though cofiring at 10 wt% has also been trialled(IEA Bioenergy Task 32, 2011) .
4.4 Enabling policy incentives
The Australian Government has a package of measures designed to address energy and climatechange, including those aimed at reducing the impact of the energy sector on the environment. TheClean Energy Legislative Package, now law, sets out the way that Australia will take action directedtowards meeting Australia’s long-term target of reducing its net GHG emissions to 80% below the2000 levels by 2050 in a flexible and cost-effective way (DCCEE, 2012). The Clean Energy Act 2011is the central Act of the Package, which sets up a carbon price mechanism and deals with assistancefor emissions-intensive trade-exposed industries and the coal-fired electricity generation sector.Entities that produce over 25,000 tCO2-e emissions each year, including power stations, natural gasretailers, and landfills, will be liable under such a mechanism. The liable entities must surrender onecarbon unit for each tCO2-e emissions for which they are liable. Three types of eligible carbon unitscan be surrendered, they are units issued by the Clean Energy Regulator, Australian Carbon CreditUnits (ACCU) issued under the Carbon Farming Initiative, and international units which areaccredited either under the Kyoto Protocol or any successor to it. The mechanism begins on 1 July2012, and operates on a financial year basis. The first three financial years are fixed charge years andcarbon units will be issued for a fixed charge, for instance the carbon price was fixed at A$23 for the2012 financial year. During this period, emissions will not be limited. Thereafter, the government willset up an annual cap based on the advice of the new Climate Change Authority and carbon units willbe issued through auction. Free carbon units will be issued under the Jobs and CompetitivenessProgramme, and coal-fired electricity generators will be entitled to receive free carbon units. The unitsissued each year will equal the scheme cap. If liable entities can not surrender an adequate number ofcarbon units for their emissions, they are liable to pay unit-short charge. In this way, the Clean EnergyAct 2011 encourages the development of clean energy in Australia.
Efforts to increase the utilisation of biomass in electricity generation started in a consolidated mannerin 1997, when the Australian Government started its first package of climate change mitigationmeasures in the Safeguarding the Future: Australia’s Response to Climate Change. From then on, awide range of initiatives were put forth by both the federal and state governments for reducing GHGemissions and utilising renewable energy on both the supply and demand sides. Among these the mostcentral initiative was the Mandatory Renewable Energy Target (MRET) scheme under the RenewableEnergy (Electricity) Act 2000. The MRET was initially designed to achieve an additional 9500 GWh(from a 1997 baseline) of renewable energy across Australia by 2010. In 2009, the RET was expandedby the Australian Government to 45,000 GWh with the intention of delivering 20% of the country’selectricity from renewable sources by 2020 (DCCEE, 2012). In 2010, the scheme was revised tominimise the impact from the high installation rate of small scale renewable energy technologies onindustrial-size renewable generators such as bioenergy plants and wind farms. The scheme was thussplit into two parts, the small scale renewable energy scheme (SRES) which supports small-scale
32 IEA CLEAN COAL CENTRE
Australia

technologies and the large renewable energy target (LRET) which supports large renewabletechnologies. Combined, the new LRET and SRES are expected to deliver more renewable energythan the 45,000 GWh target in 2020. Furthermore, eligible renewable energy sources are entitled tocreate certificates based on the amount of electricity they produce or displace. This process creates anincentive for growth in renewable energy production systems. From January 2011 Renewable EnergyCertificates (REC) were re-classified as large-scale generation certificates (LGC) and small-scaletechnology certificates (STC). One LGC is equivalent to 1 MWh of eligible renewable electricitygenerated above the power station’s baseline. The RET drives competition between renewable energysources to meet the target at the least cost. In principle, this should be sufficient for competitivebioenergy resources to be converted to electricity providing barriers are eliminated. However, thecontinued low price of REC has made it difficult for bioenergy projects to be taken forward. Under theRenewable Energy (Electricity) Act 2000, the renewable component of cofiring an eligible renewableenergy source with fossil fuels is eligible to receive renewable energy certificates (REC). The CleanEnergy Regulator set up a methodology to calculate electrical output from renewable fuels whencofired with coal (Clean Energy Regulator, 2000).
The government is also substantially enhancing its support for innovation and investment in renewableenergy. There are two major initiatives to complement the carbon price scheme and the RET scheme.A new A$10 billion Clean Energy Finance Corporation (CEFC) is to invest in the commercialisationand deployment of renewable energy, energy efficiency and low pollution energy technologies. TheCEFC will be independent from the government and will play a vital role in unlocking significantprivate investment into clean energy projects through a variety of funding tools including loans andequity investment. The other initiative is to establish a new independent Australian Renewable EnergyAgency (ARENA) in order to streamline and co-ordinate the administration of A$3.2 billion inexisting support for R&D, demonstration and commercialisation of renewable energy technologies.Together, the CEFC and ARENA will provide a robust support framework for renewable energy,energy efficiency and low-pollution energy project across Australia.
4.5 Barriers to cofiring biomass in Australian coal-fired powerstations
As shown in Section 4.3, cofiring biomass in coal-fired boilers has been successfully piloted inAustralia, but has not yet been widely adopted in the country. This is because a range of barriersremain to prevent this technology from taking off. The barriers, as identified in a recent study fundedby the Rural Industries Research and Development Corporation, relate to cofiring economics,environmental concerns, biomass market, and perception and attitude (McEvilly and others, 2011).These barriers lie primarily in the supply chain rather than in the conversion technology.
The economics of biomass cofiring are marginal under current policy settings. Consequently, themaximum price that power generators can afford to pay restricts potential biomass sources to very lowcost materials. Biomass affordability is sensitive to LGC and carbon price levels, in addition toavoided coal costs. An increase in LGC and carbon prices raises the price threshold for affordablebiomass fuels. For instance, when the carbon price moves from 10 A$/tCO2-e to 20 A$/tCO2-e and theLGC increases from 35 A$/MWh to 50 A$/MWh, a generator can afford biomass fuels up to 90 A$/tcompared to the previous upper limit of ~59 A$/t (McEvilly and others, 2011). The AustralianGovernment needs to explore state-based renewable energy policy measures that fully or partiallybridge the current economic viability gap. Moreover, it is also necessary to investigate the feasibilityof a biomass resource support programme, drawing on international precedents and reflecting thebiomass targets of each state.
Australia has seen resistance to combustion of woody fuels for energy production, becauseenvironmental groups see this as a threat to forest ecosystems and a stimulus to increase logging rates.This contrasts to the perceptions in many other countries, where utilisation of woody biomass does
33Support mechanisms for cofiring secondary fuels
Australia

not appear to be an issue and its use for energy production is implemented and accepted on a muchbroader scale. Consequently, LGCs from native forest wood waste are off-limits to most energyretailers. The Clean Energy Futures package proposes to completely exclude native forest biomassincluding waste as an eligible source under the RET. To overturn this situation, a science-basedanalysis of the pros and cons of managing regrowth in native forests is required. There existcertification systems to promote and certify good forest practices in Australia. It is also necessary toreview woody waste categories in context of cofiring feedstocks and provide input to the review of theRET legislation in 2012.
A fully-functional biomass market is yet to be established. First of all, there is a lack of integratedbiomass supply capability. The government should consider early stage support to generators thatexpress genuine commercial interest in biomass cofiring and use such projects as focal points todevelop a biomass supply chain industrial sector. Secondly, there is a lack of information on biomassresource availability. Known availability of low cost affordable biomass falls short of volumesrequired for continuous cofiring at even low level, that is 3 wt%. Without reliable knowledge of thefuture ‘inventory’ of biomass sources, it is difficult to convince generators to adopt cofiring and makeinvestment. Biomass from land clearing is considered as a key short-term biomass source for cofiring,subject to eligibility under the RET. Management of forest regrowth may provide an importantbiomass source in the medium term, while the process engineered fuel from paper and plastics alsoholds potential. In the longer term, the most likely sustainable biomass source is agroforestryplantation of short-rotation trees. Finally, Australia is yet to have an organised biomass market forenergy production purposes. It is thus difficult for biomass users/buyers to find matching suppliers.This can be resolved by establishing an online biomass information portal similar to the UK BiomassEnergy Centre. An industry association may be in the best position to deliver this with funding supportfrom the government.
The policymakers still do not have a correct understanding of the current status of the cofiringtechnology. It should be recognised that, even where cofiring overall has been commercialised, forinstance in Europe, there are aspects that are still very much in the ‘emerging’ phase, wheretechnological support may still be necessary to support commercial adoption. As such, it is clear thatin Australia cofiring is under-developed and is in reality at the demonstration/pre-commercialisationphase. Consequently, it needs government policy support to both bridge the cost gap and developindustry capacity. The generators should further advocate cofiring as an initial, low-cost option forrenewable energy production so that it can be given the right priority for government support.
Moreover, there appears to be insufficient interest in agroforestry plantation in some regions ofAustralia – for example in southeast Queensland. In these regions, there is little or no culture of treeplantion, and no substantial trials have been undertaken to demonstrate whether agroforestryplantation for energy production is a viable economic option for landholders. Nevertheless, thetheoretical potential for short-rotation bioenergy woody plantation is significant. Tree plantations areviewed differently traditional rural land uses, and there is evidence of community opposition toplantation for bionenergy purpose. It appears that there are multiple factors that contribute tocommunity opposition to plantation. These include concerns about depletion of water resources,inflation of land prices, other perceived environmental impacts associated with monocultureplantation, and difficulty in turning over agricultural land to produce non-food crops. There is alsoconcern about the relocation of families from the land as a result of large-scale plantation. A strongeconomic case for bioenergy woody plantations could well address these concerns. However, it isclear that biomass cofiring is unlikely to provide a compelling economic case in the short to mediumterm. Consequently, other initiatives will be needed. Any change to land use to bioenergy woodyplantation has to be firmly aligned with community interest.
34 IEA CLEAN COAL CENTRE
Australia

4.6 Summary
Coal/biomass cofiring has been piloted in a handful of power plants in Australia, but this technology isnot yet widely adopted, though it could play a significant role in meeting Australia’s renewable energytarget by 2020. The potentially suitable biomass for cofiring operation is landfill gas and wood wastesfrom sawmills and forestry management, which are considerably under-utilised at present. Cofiredbiomass is eligible for the renewable energy certificate LGC, which serves as the main incentive forencouraging the use of biomass in coal-fired power plants. A carbon price mechanism, which was setup very recently by the government, may further strengthen the business case for biomass/coalcofiring. In addition, any R&D and demonstration in relation to cofiring may be able to obtain supportfrom the CEFC and ARENA initiatives. The power generators need to work with the government andcommunities to remove barriers that prevent the widespread uptake of biomass cofiring as an initial,low-cost option for clean energy production in Australia.
35Support mechanisms for cofiring secondary fuels
Australia

5 China
36 IEA CLEAN COAL CENTRE
As currently the fastest growing and the second largest economy in the world, China is facing achallenging dilemma in striving to meet its ever-continuous surge in demand for energy whilstdiversifying away from a coal-dominated energy supply mix in order to mitigate environmentalpollution and climate change. Biomass, as an important renewable energy resource, is gainingimportance in the Chinese government’s energy agenda. Meanwhile, China has the world’s largestfleet of coal-fired power plants, some of which use the most advanced generation technologies.Consequently, it is natural for utilities to consider the biomass cofiring route for utilising biomass orbiogenic wastes for energy production. Nevertheless, biomass/coal cofiring has yet to be establishedin China. This chapter discusses the potential and barriers for introducing biomass cofiringapplications in China.
5.1 Coal dominance in China
China has built its recent economic boom on enormous consumption of fossil fuels. It is now theworld’s largest energy consumer accounting for 19% of the global energy demand in 2009, and thatshare is projected to increase further to 23% in 2035 (IEA, 2011a). Coal is the backbone of thenation’s energy mix and the dominant fuel for power generation – accounting for 79% of totalelectricity generation in 2009 (IEA, 2011a). Over the long term, the importance of coal in China isexpected to decline even though it will undoubtedly remain the cornerstone of the electricity mixthrough to 2035 (IEA, 2011b).
Such a heavy reliance on coal leads to severe environmental pollution that costs some US$100 billiona year and is also responsible for hundreds of thousands of deaths each year in China (MEP, 2008).Addressing environmental pollution has now become a key priority for the Chinese Government, asevidenced by the new Air Pollution Standard with significantly tightened emission limits. Increasedneeds for environmental pollution control requires the coal power sector to make furtherimprovements not only in terms of overall energy efficiency but also in the absolute reduction ofpollutant emissions. As such, the expectation is that coal consumption in the country’s coastal regionswill be capped, meaning that permissions for additional coal plants in such regions are unlikely to begranted. At the same time, emissions from existing generating plants need to be reduced. This requiresclosure of inefficient old and small plants, which China has already been doing over the past decade.Also, additional or more efficient control equipment for NOx, SO2, particulates and possibly formercury need to be installed, which will increase the capital and operating costs considerably. Inaddition, the economics of coal-fired power has been eroding over the past few years. In China, theelectricity price remains in the control of the government, whilst coal price has been largelyderegulated. Coal mining costs have been rising, now in the range of 55 US$/t to 77 US$/t for steamcoal at the mine mouth. If users and utilities are located far from producing mines, transport costs canadd substantially to the cost of delivered coal. As such, imported coal and even natural gas appear tobe competitive in some locations, for example in the southeast coastal regions. Higher coal prices andtighter environmental regulations could increasingly favour natural gas fired capacity over coal, thuslimiting the further growth of coal-fired power generation.
Another consequence of coal dominance in China’s energy production is that the economy is verycarbon intensive. Estimated energy-related emissions reached 7.5 Gt (of the world’s 30.4 Gt total) in2010, making China the largest emitter of GHG in the world (IEA, 2011c). As a Kyoto Protocolratified country, China is committed to driving down the carbon footprint of its economy. In January2010, under the Copenhagen Accord, China submitted its autonomous national mitigation targets: ‘tolower its CO2 emissions per unit of GDP by 40–45% by 2020 compared to the 2005 level, and toincrease the share of non-fossil fuels in primary energy consumption to around 15% by 2020’. To

achieve these targets and meet a surging energy demand, China will need to diversify its energysupply through the promotion of nuclear and renewable energy.
5.2 China’s position in biomass power
5.2.1 Five-Year Plans
The Chinese Government makes a nationwide centralised economic and social development planevery five years. These plans deal with all aspects of the country’s development by setting outguidelines, policy frameworks and targets. Although the emphasis has varied from plan to plan, energysecurity has featured consistently in most of the past Five-Year Plans. The Chinese Government beganpromoting the development of renewable energy during the 9th Five-Year Plan (FYP) from1996-2000. The ‘New and Renewable Energy Development Programme’ focused on using renewableenergy to bring electricity to remote areas of China which lack access to national electrical grids. In1997, the government issued guidelines with respect to the construction of renewable energy projects,establishing some basic principles that would be carried forward to subsequent government plans andmeasures (Howell and others, 2010). During the 10th FYP (2001-05), the government graduallyenhanced its support for renewable energy by providing more financial assistance and taxationincentives.
During 2006-10, the 11 FYP placed an unprecedented emphasis on renewable energy. Under such adirective, the National Development and Reform Commission (NDRC) released the Medium- andLong-Term Development Plan for Renewable Energy in China, also known as the Renewable EnergyDevelopment Plan. The Plan provided detailed guidelines, objectives and targets for renewable energydevelopment. In particular, it gave a significant weight to biomass energy and encourageddevelopment of power generation using biogenic wastes, land fill gas, straw and forest byproducts,ethanol and biodiesel production and other solid biomass combustion facilities. It directed that theinstalled biomass power capacity reach 5.5 GW by 2010 and 30 GW by 2020 (NDRC, 2007). Therewas also a provision for a mandated market share that required regions with access to large-scalepower grids to increase the share of non-hydro renewable electricity in the total power generation to1% by 2010 and over 3% by 2020. Moreover, power utilities that have installed generating capacity ofover 5 GWe were required to include at least 3% of non-hydro renewable into their total generationmix by 2010 and 8% by 2020 (NDRC, 2007). The Plan also called for self-sufficiency inmanufacturing renewable energy system equipment with a vision that ‘by 2020, a relatively completerenewable energy technology and industry system will have been established, so that a domesticmanufacturing capability based mainly on China’s own intellectual property rights will have beenestablished, meeting the need for deploying renewable energy on a large scale in China’ (NDRC,2007; Howell and others, 2010).
The latest 12th FYP is for the period 2011-15. For the first time, the FYP gives a high profile to climatechange and environmental issues in addition to securing energy supply. There are details regardingChina’s commitment to international co-operation and the UN-led climate negotiation process. The 12thFYP intends to accelerate the transformation of the country’s economic development pattern from thecurrent one underpinned by energy-intensive industrial sectors. It sets important energy efficiency andenvironmental targets for the period to 2015, including: (Minchener, 2011).� cut the economy’s energy intensity by 16% from the 2010 levels;� cut the economy’s CO2 intensity by 17% from the 2010 levels;� increase the share of non-fossil fuel in primary energy consumption to 11.4%
In accordance with these overall targets, the Chinese Government subsequently announced thedevelopment plan for each specific non-fossil energy source. For biomass, the plan is to increase totalinstalled power generation capacity to 13 GW by 2015 and 30 GW by 2020. China will have 8 GW
37Support mechanisms for cofiring secondary fuels
China

capacity fuelled by agricultural and forestry biomass, 2 GW landfill gas-fired capacity and 3 GWincinerator power generation capacity by 2015 (Zhang, 2011). Nevertheless, the implementationmeasures for achieving these targets are unclear at the time of writing this report.
5.2.2 Renewable Energy Law
The legal basis for promotion of renewable energy is the Renewable Energy Law enacted on 1 January2006 and its associated implementing measures. The Law was designed to accord priority torenewable energy sources for access to the electricity grid. It also contains provisions for renewableelectricity subsidies, for example a feed-in tariff and tax breaks.
China’s principal source of renewable energy is hydropower. However, it has been recognised that thegrowth potential for hydropower is increasingly limited by environmental constraints and socialproblems associated with the construction of large dams. As a result, the Chinese Government accordsdevelopment priority to so called ‘new renewables’ technologies – wind, solar and biomass power. Adedicated fund was set up under the Law to provide support to their development, for example, forconstructing pilot and demonstration facilities. Furthermore, the NDRC issued a ‘Guidance Catalogueon Renewable Energy Industrial Development’ that lists 88 types of renewable energy projects eligiblefor preferential tax treatment and/or designated funding. In June 2006, the NDRC announced a plan toraise the consumer electricity rate by 0.025 RMB/kWh, and a fractional 0.1% of that increase wouldbe used for renewable energy development. This move was in line with the Law, which required theextra costs of renewable energy development to be shared by all electricity end users.
On 1 April 2010, an amendment to the Law came into effect that guarantees all electricity generatedby biomass-fired power plants must be sold to the national grid. Those companies that refuse to do soare subject to fines up to double the amount of the economic loss to the renewable power generator(Howell and others, 2010). In addition, biomass power generators are entitled to several tax breakbenefits, including a 10% reduction in corporate income tax and exemption from value added tax andequipment import tax. Furthermore, the electricity generated from biomass plants is sold at a premiumof 0.25 RMB/kWh through a feed-in tariff scheme. The bench-mark is the selling price of electricitygenerated by coal-fired power plants with desulphurisation. A higher premium at 0.75 RMB/kWh isprovided for electricity generated using agricultural or forestry biomass (Zhang, 2011). However, theprice premium is only available to power plants in which the boiler heat input from biomass is no lessthan 80% of the total heat input (Michener, 2011). This, in effect, excludes cofiring projects fromreceiving the price premium as such projects normally use less than 25% of biomass in the total heatinput due to technical and economic reasons. The somewhat arbitrary 80% cutoff line shows that thegovernment realises the difficulty of establishing a transparent and reliable monitoring and auditingsystem to ensure that the amount of biomass consumption claimed by the power plants actually goesinto power generation.
5.2.3 Current status of biomass power
As a result of the restriction surrounding the feed-in tariff, power generation using biomass in China isalmost all in small-size biomass only plants, which have just a few years of operating experience.
In 2005, the National Bio Energy Co Ltd – a joint venture between the State Grid Corporation ofChina and Dragon Power Co Ltd – was established by the Chinese Government with the mandate ofR&D and capacity building in advanced biopower technologies. The company is in the process ofbuilding at least 40 biomass power plants in areas with abundant biomass resources available (Howelland others, 2010).
In contrast, biomass cofiring applications have yet to be established in China. Only two utilities have
38 IEA CLEAN COAL CENTRE
China

been reported to undertake biomass cofiring in their coal-fired boilers at their own discretion. HuadianPower International Corporation Ltd has a cofiring installation at its Shiliquan power plant inShandong province. The power plant is located in a region with approximately 1.4 Mt of strawavailable. The plant has been cofiring straw at 20 th% in its 140 MWe Unit 5 since December 2005.The cofiring technology is from BWE in Denmark with a modified design by a Chinese greentechnology company. Cofiring straw allows a substitution of nearly 76 kt/y of coal and results in a15 Mt reduction in SO2. The Shandong province granted a electricity price at 0.594 RMB/kWh forelectricity produced from this unit, which is higher than the standard electricity price of0.354 RMB/kWh (Qing, 2007). Golden Concord Holdings Ltd, a Hong Kong-based clean energycompany, is the other utility that has experience in biomass cofiring. It has turned its co-generationplant in Baoying, Jiangsu Province, from coal-fired to combustion of the coal/biomass mixture andthen to 100% biomass fired. The majority of the biomass used at the plant is straw collected fromlocal farms and the annual consumption has reached 400 kt. The power plant has an annual electricityoutput of 180 GWh and an annual steam output volume of 500 kt (GCL, 2012).
5.3 Biomass fuel resources
The main biomass materials available in China include straw (over 300 Mt), crop processing residues(over 130 Mt), forestry residues (~140 Mt), firewood (over 100 Mt), tree pruning and woody wastes(~70 Mt) and organic municipal solid wastes (50 Mt), according to an investigation undertaken byTsinghua University and the Energy Research Institute of Henan Province (Minchener, 2008). Allthese biomass energy resources total in excess of 790 Mt with a cumulative calorific value of over11720 PJ, which is equivalent to some 400 Mt of coal. The distribution of biomass resources has astrong regional feature, as shown in Figure 4. There is a very high straw resource density, in excess of200 t/km2, in Henan, Jiangsu, Shandong, Anhui and Hebei Provinces. Yunnan, Guangxi, Hunan,Jiangxi and Fujian Provinces produce more than 9 Mt/y of forestry residues. Forest coverage is high inremote regions such as Tibet, Sichuang, Yunnan and Heilongjiang provinces.
Despite the large amount of biomass resources, biomass supply chains are not yet established inChina. The large variety of crops and the differences in weather and geography between regions makeit harder to establish such systems compared to most OECD countries. But there exist early fledglingcollection systems for small-sized, dedicated biomass power plants, which allow individual farmers tosupply their straw to a central collection point where it is baled and then transported to the storagearea at the utilising plant. In general, the cost-effective transport range is restricted to a 50 km radiusaround a power plant due to the low energy and bulk intensity of biomass fuels. As such, theavailability of biomass resources within this range determines the cofiring potential at a given powerplant. Consequently, the cofiring potential may be low in a region with widely dispersed biomassresources. In addition, demand for biomass from competing utilisation, such as dedicated biopower,biogas digestion and animal fodder, need to be taken into consideration when assessing the availablebiomass resources for cofiring. For example, an ill-thought out local incentive scheme has promptedconstruction of too many small dedicated biomass plants in the Jiangsu province, resulting inexcessive competition for biomass supply. The resulting massive rise in biomass price has forcedmany of these biomass power plants out of operation (Minchener, 2008).
5.4 Coal-fired power generation in China
The last decade has seen massive development in the Chinese power generation sector. Strongincrease in demand for electricity, as a result of sustained strong economy, has stimulated the rapidgrowth in power generation capacity, at 12% on average since 2000. By the end of 2011, the installedcapacity of power generation has reached 1056 GW, among which thermal power (dominantly bycoal-fired power plant) 765 GW, hydropower 231 GW, nuclear power 13 GW, and renewables (mostlywind) 45 GW, respectively (Sun and others, 2012). Coal-fired power plants accounted for more than
39Support mechanisms for cofiring secondary fuels
China

60% of the increase in capacity between 2005and 2011. Growth in electricity demand hascome principally from the industrial sector.Also, massive urbanisation and a nationwideelectrification programme have boosted poweruse in the buildings sector. In IEA’s NewPolicies Scenario, Chinese electricity demandis projected to grow on average by 8% peryear between 2009 and 2015, and then slow toan average of 3% per year from 2016 through2035, as economic growth slows andelectricity use becomes more efficient (IEA,2011b). The Chinese Government’s policy forthe introduction of new coal-fired plants is thatthe mix will comprise a very great majority(~70%) of PCC units, with the balance beingCFBC systems that are used for utilisation oflow grade coals and waste material inminemouth applications (IEA, 2011b). China’sinstalled power generation capacity isprojected to reach 1934 GW in 2020 and 2380in 2030; coal-fired generation capacity isexpected to increase to 1190 GW in 2020 andfurther to 1270 in 2030 (Sun and others,2012).
China’s fleet of coal-fired power stations hasalso become more efficient. Until some tenyears ago, small, old and inefficient units withlimited emissions control equipmentdominated the power generation sector. Sinceabout 2004, the sector has gone through adrastic transformation that some of the world’slargest and most efficient coal-fired units werebuilt with supercritical/ultra-supercriticalsteam conditions and modern SO2/NOx anddust control systems. This change has beendriven by Chinese Government’s policy thatno subcritical units or pulverised coal powerplants with a capacity lower than 600 MWe,except those for CHP operation, can be built.As a result, SC/USC PCC power generationhas rolled out quickly in China. As of the endof 2011, China has commissioned39 x 1000 MW class USC units and19 x 600 MW class USC units (Liu, 2012).This new-build directive has beencomplemented by the government’s ‘LargeSubstitute for Small’ (LSS) programme, whichforces the inefficient small units to shut downand be substituted with efficient large units,and the Energy Conservation Power
Generation Scheduling (ECPGS) programme, which changes current even grid load dispatching toone that dispatches grid load in accordance with units’ energy efficiency merit order (Minchener,
40 IEA CLEAN COAL CENTRE
China
a) Straw
Xinjiang
Tibet
Qinghai
GansuInner Mongolia
Ningxia
Heilongjiang
Jilin
Liaoning
TaiwanYunnan
Guizhou
HunanJiangxi
Fujian
Guangdong
Hainan
Guangxi
Sichuan Hubei
Shanxi
ShanxiHebei
Shandong
Jiangsu
Anhui
Henan
Zhejiang
t/km2
200–376
100–200
60–100
<60
Shanghai
BeijingTianjin
Hong KongMacau
Guangzhou
b) Forestry residues Mt
9-13
6-9
3-6
<3
Xinjiang
Tibet
Qinghai
GansuInner Mongolia
Ningxia
Heilongjiang
Jilin
Liaoning
TaiwanYunnan
Guizhou
HunanJiangxi
Fujian
Guangdong
Hainan
Guangxi
Sichuan Hubei
Shanxi
ShanxiHebei
Shandong
Jiangsu
Anhui
Henan
ZhejiangShanghai
BeijingTianjin
Hong KongMacau
Guangzhou
Gt
2-3
0.5-2
<0.5
Xinjiang
Tibet
Qinghai
GansuInner Mongolia
Ningxia
Heilongjiang
Jilin
Liaoning
TaiwanYunnan
Guizhou
HunanJiangxi
Fujian
Guangdong
Hainan
Guangxi
Sichuan Hubei
Shanxi
ShanxiHebei
Shandong
Jiangsu
Anhui
Henan
ZhejiangShanghai
BeijingTianjin
Hong KongMacau
Guangzhou
c) Forest
Figure 4 Distribution of a) straw, b) forestryresidues, c) forest in China (modifiedfrom Minchener, 2008)

2010). As a result, some 56 GW of small units have been closed down during 2006-10, approximatelyhalf of which were coal fired (Minchener 2010). LSS will continue during the 12th FYP period (2011-15) with a focus on closing down old inefficient units of 100–200 MWe class. Under the ECPGS, it isexpected that there will be very limited opportunity for units of 110–135 MWe to operate except atpeak load, though the detailed implementation plan is still under consideration (Minchener, 2010).Consequently, the proportion of smaller inefficient units is starting to decrease although they will stillcontinue to represent a significant part of the country’s coal-fired generating capacity for the near- tomedium-term future.
Another important fact is that China has a strong manufacturing base for power generation systems.With intensive Chinese Government-initiated technology transfer from OECD power sectorequipment suppliers and requirements for localisation, the big Chinese suppliers of power generationsystems and associated environmental control systems now have the capacity to manufacture themajor parts of a large USC unit. This suggests that it should be relatively easy for Chinese utilities tomodify their coal-fired power plants to accommodate biomass cofiring.
5.5 Market potential of biomass cofiring in China
In principle, there are no insuperable reasons why China cannot introduce biomass as a fuel forcofiring applications, considering both its biomass resources and the development status of itscoal-fired generation capacity. Experience in OECD countries has shown that cofiring offers distincttechnical and economic advantages over small purpose-built biomass-only direct-fired units whichChina has recently started to build. Introducing biomass could also improve the environmentalperformance of coal-fired power plants by decreasing the emissions of particulates SO2, CO2, andpossibly NOx.
Although large modern coal-fired power plants are the best candidates for introducing biomasscofiring, utilities may perceive that there may be too high technological and economic risks to applycofiring to those large plants, and therefore might prefer starting from small-size subcritical units.Consequently, one of the first opportunities for biomass cofiring in China may be in small sizecoal-fired power plants that have a capacity of some 100 MWe or less if it is a CHP application. Suchsmall power generation units comprise a reasonable share of the country’s total generation capacity.
Case studies have shown that biomass cofiring at the small scale for both CFBC and PC boilers can betechnically and economically feasible in China. In 2006-08, a consortium comprising key Europeanand Chinese stakeholders undertook a project to investigate the market prospects for introducing EUbiomass technology into China for small-scale power generation applications (Minchener, 2008). Aspart of its tasks, the project, acronym CHEUBIO selected three small-size operating power plants fora techno-economic analysis of cofiring feasibility. The three plants are: � a 200 MWe PC boiler cofiring 10% of straw on a heat input basis in Henan province;� a 50 MWe CHP CFBC boiler firing 20% of straw/80% of coal/coal refuse in Shandong province;� retrofit of a small 25 MWe CFBC boiler cofiring rice straw in Anhui province.
The conclusions are as follows:� investment in cofiring projects will be attractive for biomass costs as high as 400 RMB/t when
the sale of fly ash to the cement industry is included and bioelectricity is assumed to receive asubsidy of 0.214 RMB/kWh;
� the investment will be viable but not necessarily attractive without the bioelectricity subsidy onlyif the biomass cost is below 200–245 RMB/t, including or excluding fly ash revenue;
� the coal price has the greatest sensitivity with regard to the investment’s internal rate of return(IRR), followed by the biomass cost, while the bioelectricity subsidy and the capital costs arethe least sensitive to IRR;
� cofiring is equally applicable in Europe and China and by implication cofiring will also be
41Support mechanisms for cofiring secondary fuels
China

feasible both for large plant retrofit and new plant applications, providing that the bioelectricitysubsidy is guaranteed and the biomass costs remain at reasonable levels.
All three cases of cofiring application appear economically attractive if the cofiring projects receivethe bioelectricity subsidy (the price premium) for which only plants with more than 80% share ofbiomass in the heat input are presently eligible. In the absence of any subsidy, the analysis showedthat all three cases have negative returns and become viable only if the biomass cost is much lowerthan 200 RMB/t throughout the lifetime of the investment. Other forms of financial incentives arenecessary for an investment to proceed. A possible incentive is the Clean Development Mechanism(CDM) under Kyoto Protocol. The CDM allows emission reduction projects in developing countriesto earn Certified Emission Reduction (CER) credits, each equivalent to 1 tCO2. These CERs can besold, traded and used by industrialised countries to meet a part of their emission reduction targets.However, only co-generation projects using 100% biomass have been accepted so far by the CDMExecutive Board for registration. The three CDM methodologies, ACM006, ACM0036, and AM0042,used for project design are not applicable to biomass cofiring applications, as they require thatbiomass is the main fuel of a project applying for registration for CDM. It was reported thatEcoSecurities has developed a new methodology for cofiring of biomass in utility-scale power plants,which successfully received approval from the CDM Executive Board in 2010 (Carbonoffsets Daily,2010). This new methodology thus allows biomass cofiring projects to receive CERs, which isexpected to stimulate the development of cofiring applications in China.
Another argument in favour of first introducing cofiring to small-size coal-fired power plants is thatthey may be exempt from the government’s policy to shut down small-scale inefficient thermal powerplants. If such units can be retrofitted for biomass cofiring they can remain in operation and obviatethe investment that would otherwise be needed to build a new unit. Since the local power plantprovides important employment, this would provide a strong driver for the provincial authorities tosupport and provide incentives for developing cofiring applications.
The accumulated capacity of <300 MWe subcritical coal-fired units was 220 GWe, or 32% of totalcoal-fired capacity at the end of 2010 (Mao, 2011). Not all of these existing small size plants can beconverted to cofiring with biomass, which is dependent upon their proximity to available biomassresources.
Agricultural straws appear to be the most widely available biomass type around power plants andtherefore potential feedstock for cofiring, particularly favourable in Henan, Hebei, Shandong, Jilin,Jiangsu and Anhui Provinces. In the near term, Shandong, Jiangsu, Henan and Hebei provinces havebetter prospects for introducing biomass cofiring applications, considering the highest distribution ofsmall-scale coal-fired power plants and CHP plants and abundant straw resources in these regions.These regions are also well positioned for the subsequent roll-out of cofiring applications to largermodern coal-fired units and new builds.
The more promising locations for cofiring of forestry residues could be in Heilongjiang, Yunnan,Jiangxi, Fujian and Guangxi provinces. These regions are, however, relatively far from China’s threeeconomic zones: the Bohai Economic Rim, Yangtze River Delta, and Pearl River Delta, where thedemand for electricity is highest and the density of coal-fired power plants largest. In light of this,Guangdong province appears to be a compromise choice as it has both a high distribution of smallpower plants and adequate wood supplies.
5.6 Barriers to uptake of biomass cofiring
To enable the uptake of biomass cofiring in China, an array of barriers needs to be overcome. Thesebarriers include management of the biomass supply chain, technological risks, and lack of supportingincentives.
42 IEA CLEAN COAL CENTRE
China

As discussed in Section 5.3, the biomass fuel supply chain has yet to be established in China. A soundmanagement system needs to address the following key issues:� Collection: Unlike the agricultural industry in OECD countries which features large and
mechanised farming, agricultural production in small farms of typical 1300–2700 m2 perhousehold still prevails in many regions in China. Collection of adequate quantity of biomassfrom such a large number of small farms is difficult and costly for power plants that intend tocofire biomass. Equipment for mechanised harvesting and processing may add to collection costsconsiderably.
� Transport: Finding a low-cost way to deliver the collected biomass fuel to the destined powerplant is important. Straw, for example, can be delivered as bales or as loose material followed bycrushing at the plant. The utilising power plant needs to examine all possible options and pick theoptimal choice.
� Storage: Straw is the most available biomass fuel in China, but the harvest period of straw isshort, only about six weeks. Therefore, storage at an industrial scale is key to stable supplythroughout a year. In addition, production of straw varies year on year by up to ±30%, increasingthe need for storage.
� Availability: The amount of biomass fuel available to power plants is affected by demand fromcompeting utilisation, such as pulp and paper plants. Compared to power plants, these plants mayaccommodate more biomass price volatility. Within the power generation utilisation route, there isalso competition between biomass-only power plants and cofiring power plants.
It is the nature of the biomass fuel to vary in characteristics both geographically and seasonally. Suchvariation in quality may result in technical problems in the boiler furnace. Handling, blending andtorrefaction may help to reduce this problem. For straw, its high alkali and chlorine content couldresult in increased slagging and fouling in the furnace, and render the fly ash unsaleable. Therefore,intensive test burns are needed and careful modification of the plant operation may be necessary.Moreover, since the majority of cofiring experience has been with woody biomass, the Chinese plantoperators may find few reference plants (such as those in Denmark) to help with the design andoperation of their own cofiring applications.
The major obstacle to development of cofiring application with 10–25% biomass heat input is thatthey are not recognised as biomass power projects and therefore cannot benefit from any pricepremium incentives under the current Renewable Energy Law. Consequently, this exclusion needs tobe eliminated in order to realise the potential for cofiring application on coal-fired power plants inChina. As mentioned in Section 5.2.2, one of the reasons that cofiring biomass with coal is excludedfrom the feed-in tariff incentive is that the Chinese Government is concerned with accountability andaccuracy associated with the share of biomass cofired in coal-firing plants. There is a need to establisha reliable monitoring and verification methodology to address such a concern. This will increase thegovernment’s confidence in granting credibility to cofiring power plants. In addition, the governmentalso needs to establish other appropriate policies and financial incentive schemes to support thedeployment of cofiring. All these are deemed critical to establishing a framework where cofiring cancompete within the power generation sector as a viable and sustainable carbon mitigation technology.
5.7 Summary
China has a large market potential for cofiring biomass in coal-fired power plants. There are sufficientagricultural residues and wood wastes available in China to support a significant level of cofiringpower generation, with various types of straw being the main biomass fuel available. It is important todetermine where cofiring might be best suited to avoid adverse competition between cofiring andbiomass-only applications. As such, there is an imperative need for Chinese authorities to determinethe best development strategy for utilising biomass fuels for power generation. Given the sheer size ofits fleet of coal-fired power plants, cofiring as an incremental retrofit or a new build application offersseveral significant advantages over directly firing 100% biomass in a dedicated plant, and provides an
43Support mechanisms for cofiring secondary fuels
China

attractive near-term means to mitigate GHG emissions in the coal-fired power sector. Biomasscofiring can also provide societal benefits as it offers additional employment and income generationfor the rural population.
Biomass cofiring is yet to be established in China due to lack of supporting financial incentives. Withno direct carbon obligation in place in China, cofiring is a more expensive way of generatingelectricity than coal alone, but cheaper than the 100% biomass option. The possible financial supportmay come from a feed-in tariff for renewable electricity, tax breaks and CDM. Biomass cofiring is noteligible for the current feed-in tariff for renewable electricity partly because the government has littleconfidence in the cofiring rate claimed being actually implemented at cofiring power plants. Chinaneeds to put in place some new policies and financial incentives to provide firm direction such that thebiomass cofiring can be widely introduced to Chinese power plants on a commercially viable basis. Tothis end, it is necessary to develop a transparent methodology to monitor and verify the proportion ofbiomass fired with coal so that the level of financial support can be accurately and reliablydetermined.
44 IEA CLEAN COAL CENTRE
China

6 Conclusion
45Support mechanisms for cofiring secondary fuels
This report discusses the enabling and supporting mechanisms for coal/biomass cofiring in selectedcountries that have either considerable operating experience or potential in this technology. Europe,the USA, Australia and China represent various degrees of cofiring uptake and different policysettings for bioenergy development. As such, the report provides not only a policy overview but also acollation of the measures adopted by the policymakers in each country to promote cofiring of biomassin coal-fired power stations.
With more than 169 installations, Europe is the world’s forerunner in cofiring biomass with coal forheat and electricity generation. There is considerable operating experience in Finland, Germany, theUK, Sweden, Denmark, Italy and the Netherlands (in descending order in terms of number ofinstallations). Finland has substantial forest resources, and cofiring features small-sized fluidised bedboilers burning multiple fuels including coal, peat, woody wastes and other refuse fuels. Fuelflexibility is a key requirement for the Finnish cofiring installations. In Germany, most cofiringoperations burn sewage sludge in pulverised coal boilers with just a few fluidised bed based cofiringinstallations. The UK cofiring applications are on large coal-fired power plants with imported woodpellets and food precessing residues as the main cofiring fuels. Sweden has considerable experience incofiring a mixture of bark, sludge, woody residues, oil and coal in small-sized grate-fired or fluidisedboilers for district heating or raising process steam for the paper and pulp facilities. Denmark hasextensive experience in cofiring straw at very high ratios in different combustion configurations. InItaly, there are six cofiring installations on PCC boilers and one installation on a CFB boiler. Woodchips are the main biomass fuel for cofiring. Direct cofiring is common practice in the Netherlandswith each of its seven cofired units burning up to 15 th% of wood pellets, demolition wood, papersludge, meat and bone meal and other wastes.
The prominent position of these European countries in biomass/coal cofiring development isunderpinned by three broad categories of supporting mechanisms. The first includes carbon tax andtax exemption for biomass fuels, which discourage the use of fossil fuels. The second category ofincentives is designed to create a commercially viable market for the electricity and heat producedfrom cofiring power plants. The feed-in tariff and renewable energy obligation fall into this category.The feed-in tariff appears to be favoured by most European Governments, as it passes on the cost ofsupport directly to end users. The third category of mechanisms focuses on investment support andcost reduction of bioenergy projects. With such diversified supports, the governments in thesecountries are able to promote cofiring in a cost-effective manner.
The USA has the second largest number (>40) of cofiring installations in the world. Most of these areon old and small-sized (<200 MWth) power plants with pulverised coal, stoker and cyclone boilers.Those power plants in total generated some 2 GWh in 2007, cofiring woody wastes, herbaceousbiomass residues and energy crops with the cofiring rate ranging from 1 wt% to 20 wt%. The EIAprojected a strong increase (17.4% per annum) in electricity generation from cofiring operations overthe next twenty years, considering existing regulatory and financial supporting incentives from boththe federal and state governments. Among these incentives renewable portfolio standards and greenpricing programmes are currently the most important state-level incentives for development ofbiomass cofiring projects, though their applicability and the levels of support vary from state to state.However, most incentives do not explicitly include biomass/coal cofiring as an eligible technology,which needs clarification from the regulators. Moreover, some important tax benefits, such as PCT,ICT, the 1603 programme and CERB, explicitly exclude biomass cofiring with fossil fuels asqualifying projects due to concerns over the perceived increased use of coal for power generation.Consequently, the overall policy settings in the USA is not favourable towards biomass/coal cofiring.
Compared to Europe and the USA, Australia has only limited experience in cofiring biomass in

pulverised coal fired power stations. However, both the government and the power generation sectorare positive in promoting this low-carbon technology. Landfill gas and wood wastes, currentlyunder-utilised, are considered the most suitable biomass fuels for cofiring applications. The AustralianGovernment allows cofiring power plants to receive the LGC renewable energy credits, which givesimportant financial incentives to generators to adopt cofiring on their plants. In addition, the recentlyenacted carbon price is expected to provide another incentive that will strengthen the business case forbiomass/coal cofiring. With widespread uptake of biomass cofiring, the technology could play asignificant role in meeting Australia’s renewable energy target by 2020.
China has negligible experience in biomass cofiring in coal-fired boilers, with only two stationsreported to have applied this technology. However, there is huge potential for this technology to berolled out in China, given the sheer size of the fleet of large coal-fired power stations and abundantagricultural residues and wood wastes available. The near-term opportunities for biomass cofiring inChina may be in small-size coal-fired power plants with a capacity of some 100 MWe or less inregions where there is abundant straw available. However, the current financial incentive, a pricepremium for bioelectricity, excludes cofiring applications as eligible projects. The reason may be thatthe government finds it difficult to verify the cofiring rates claimed by generators. A transparentmonitoring and verification methodology needs to be put in place by the government. Other financialincentives, such as tax breaks and potentially the CDM, are also needed to make cofiring acommercially attractive technology. The government needs to set out an optimal development strategyfor utilising biomass fuels for power generation. This strategy needs to address competition betweencofiring and dedicated biomass power generation, and help generators determine the most suitablelocations to adopt this technology.
46 IEA CLEAN COAL CENTRE
Conclusions

7 Reference
47Support mechanisms for cofiring secondary fuels
ABARES (2010) Australian Energy Resource Assessment. Chapter 12: Bioenergy. Available at:http://adl.brs.gov.au/data/warehouse/pe_aera_d9aae_002/aeraCh_12.pdf Canberra, Australia, theAustralian Bureau of Agricultural and Resource Economics and Sciences (2010) ABARES (2011) Energy in Australia 2011. Available at:http://adl.brs.gov.au/data/warehouse/pe_abares99001789/Energy_in_Aust_2011_13f.pdf Canberra,Australia, the Australian Bureau of Agricultural and Resource Economics and Sciences (2011) AEBIOM (2010) Annual report 2009. Available at http://www.aebiom.org/wp/wp-content/uploads/AEBIOM%20Annual%20Report%202009.pdf Brussels, Belgium, The EuropeanBiomass Association (AEBIOM), 26 pp (2010)AEBIOM (2011) Statistics. Available at: http://www.aebiom.org Brussels, Belgium, The EuropeanBiomass Association (AEBIOM) (2011)Al-Mansour F, Zuwala J (2010) An evaluation of biomass cofiring in Europe. Biomass andBioenergy; 34;620-629 (Feb 2010)ARUP (2011) Review of the generation costs and deployment potential of renewable electricitytechnologies in the UK - Study report for Department of Energy and Climate Change. REP 001,London, UK, ARUP, 295 pp (Oct 2011)Biomass Energy Centre (2011) Grants and support. Available at:http://www.biomassenergycentre.org.uk/portal/page?_pageid=77,15133&_dad=portal&_schema=PORTA L#SUPP Surrey, UK, Biomass Energy Centre (2011)Carbonoffsets Daily (2010) Press release: UN approves the first CDM methodology for biomasscofiring in utility-scale fossil fuel power stations. Available at:http://www.carbonoffsetsdaily.com/press-release/press-release-un-approves-the-first-cdm-methodology-for-biomass-co-firing-in-utility-scale-fossil-fuel-power-stations-2-36130.htm (Feb, 2010)Clean Energy Council (2008) Biomass Resource Appraisal. Available at:http://www.cleanenergycouncil.org.au/cec/resourcecentre/reports/bioenergyroadmap Victoria,Australia, Clean Energy Council, 28 pp (2008)Clean Energy Council (2011a) Clean energy Australia 2011. Available at:http://www.cleanenergycouncil.org.au/resourcecentre/reports.html Victoria, Australia, Clean EnergyCouncil, 76 pp (2011)Clean Energy Council (2011b) Barriers facing bioenergy in Australia. Available at:http://www.cleanenergycouncil.org.au/dms/cec/policy/Barriers_facing_bioenergy_in_Australia_2011-1-/Barriers_facing_bioenergy_in_Australia_2011%5B1%5D.pdf Victoria, Australia, Clean EnergyCouncil, 47 pp (Feb 2011)Clean Energy Regulator (2000) Cofring of biomass with coal. Available at:http://ret.cleanenergyregulator.gov.au/For-Industry/Renewable-Energy-Power-Stations/LGC-Eligibility-Formula/lgc-eligibility-formula Canberra, Australia, Clean Energy Regulator (2000)CPC (2011) Mayors leading the way on climate protection. Available from:http://www.usmayors.org/climateprotection/revised/ The US conference of mayors climate protectioncentre, Washington, USA (2011)Cremers M F G (2009) IEA Bioenergy Task 32 - Deliverable 4 - Technical status of biomasscofiring. 50831165-Consulting 09-1654, Arnhem, the Netherlands, IEA Bioenergy Task 32, 43 pp(2009)Davidson R (1999) Experience of cofiring waste with coal. CCC/15, London, UK, IEA Clean CoalCentre, 63 pp (Feb 1999)DCCEE (2012) Clean Energy legislation: the way ahead. Available at:http://www.climatechange.gov.au/government/clean-energy-future.aspx Canberra, Australia,Department of Climate Change and Energy Efficiency (2012)DECC (2009) The Renewables Obligation Order 2009 - Electricity, England and Wales. Available at:http://www.decc.gov.uk/assets/decc/Consultations/Renewables%20Obligation/1251-roo-2009-amended-2 011.pdf London, UK, Department of Energy and Climate Change, 72 pp (Mar 2009)

DECC (2010) Renewable Obligation. Available at:http://www.decc.gov.uk/en/content/cms/what_we_do/uk_supply/energy_mix/renewable/policy/renew_obs/renew_obs.aspx London, UK, Department of Energy and Climate Change (2010)DECC (2011) Electricity market reform white paper 2011. Available at:http://www.decc.gov.uk/en/content/cms/legislation/white_papers/emr_wp_2011/emr_wp_2011.aspxLondon, UK, Department of Energy and Climate Change (2011)EREC (2009) Renewable energy policy review - Italy. Availableat:http://www.erec.org/fileadmin/erec_docs/Projcet_Documents/RES2020/ITALY_RES_Policy_Review_09_Final.pdf Brussels, Belgium, European Renewable Energy Council, 16 pp (2009)EUBIA (2011) Experiences in Europe and list of biomass co-firing plants. Available at:www.eubia.org/338.0.html Brussels, Belgium, European Biomass Industry Association (Oct 2011)EurObserv-ER (2010a) Solid biomass barometer. Available at: http://www.eurobserv-er.org/pdf/baro200c.pdf France, EurObserv’ER, 18 pp (Nov 2010)EurObserv-ER (2010b) Biogas barometer. Available at: http://www.eurobserv-er.org/pdf/baro200b.pdf France, EurObserv’ER, 16 pp (Nov 2010)EurObserv-ER (2010c) Renewable municipal waste barometer. Available at: http://www.eurobserv-er.org/pdf/baro200a.pdf France, EurObserv’ER, 14 pp (Nov 2010) European Commission (2005) National Biomass Action Plan COM (2005) 628 final. Brussel,Belgium, European Commission (Dec 2005)EERE (2010) Green Power Network: Green pricing - utility programmes by States. Available at:http://apps3.eere.energy.gov/greenpower/markets/pricing.shtml?page=1 Washington DC, USA, DOEEnergy Efficiency & Renewable Energy (Dec 2011)EIA (2009) Annual energy outlook - Table A16 Renewable energy generating capacity andgeneration. Washington D C, USA, Energy Information Administration (EIA) (2009)EIA (2010) Electric Power Monthly, August 2010http://www.eia.gov/ftproot/electricity/epm/02261008.pdf Washington, USA (2010)EIA (2011) Annual Energy Outlook 2011– Summary Presentation. Available at:http://www.eia.gov/oiaf/aeo/gas.html Washington DC, USA, Energy Information Administration,40 pp (2011)EREC (2009) Renewable energy policy review - Finland. Available at:http://www.erec.org/fileadmin/erec_docs/Projcet_Documents/RES2020/FINLAND_RES_Policy_Review__09_Final.pdf Brussels, Belgium, European Renewable Energy Council (EREC), 7pp (Mar 2009)EPA (2011) Regulatory initiatives. Available at: http://epa.gov/climatechange/initiatives/index.htmlWashington D C, USA, Environmental Protection Agency – Climate Change Division (Sept 2011)Fernando R (2002) Experience of indirect cofiring of biomass and coal. CCC/64, London, UK, IEAClean Coal Centre, 40 pp (Oct 2002)Fernando R (2005) Fuels for biomass cofiring. CCC/102, London, UK, IEA Clean Coal Centre,37 pp (Oct 2005)Howell T R, Noellert W A, Hume G, Wolff A W (2010) China’s promotion of the renewableelectric power equipment industry. Available at:http://www.nftc.org/default/Press%20Release/2010/China%20Renewable%20Energy.pdf WashingtonDC, USA, Dewey & LeBoeuf LLP, 105 pp (2010)IEA (2008) Biomass and bioenergy. In: Energy Technology Perspectives 2008 - Scenarios &strategies to 2050. Paris, France, the International Energy Agency, pp 307-338 (2008)IEA (2011a) Energy projections to 2035. In: World Energy Outlook 2011. Paris, France, InternationalEnergy Agency, pp 80-81 (2011)IEA (2011b) Part C: Outlook for coal markets - Coal demand prospects - Regional analysis - China.In: World Energy Outlook 2011. Paris, France, International Energy Agency, pp 382-387 (2011)IEA (2011c) Part A: Climate change and the 450 Scenario - Recent development. In: World EnergyOutlook 2011. Paris, France, International Energy Agency, pp 205-209 (2011)IEA (2011d) Part A: Power and renewable outlook – Renewables. In: World Energy Outlook 2011.Paris, France, International Energy Agency, pp 184-194 (2011)IEA Bioenergy Task 32 (2011) Biomass combustion and cofiring, database of biomass cofiring.Available at: http://www.ieabcc.nl/ Utrecht, the Netherlands, IEA Bioenergy Task32 (2011)
48 IEA CLEAN COAL CENTRE
References

Kärki J (2009) Biomass utilisation in large scale heat & power production. In: Chinese-FinnishSeminar ‘Sino-Finnish Seminar presentation’, Beijing China, 7-8 Sep 2009. Available from:http://www.aka.fi/Tiedostot/Tiedostot/ENERGIA/Sino-Finnish%20seminar/Janne_Finland.pdf, 18 pp(Sept 2009) Kennedy K (2011) Top US climate policy stories of 2011. Available at:http://cleantechnica.com/2011/12/31/top-u-s-climate-policy-stories-of-2011/CleanTechnica (Dec 2011)Kiviluoma J (2010) The feed-in tariff system for wind power and biogas in Finland. Available from:http://earthaction.typepad.com/files/kiviluoma_feedintariff_finland.pdf Finland, VTT TechnicalResearch Centre, 11pp (Jan 2010)Levine E (2011) Utility-scale biomass: cofiring and densification. Available at:http://www.usbiomassboard.gov/pdfs/levine_btac_3-3-11.pdf Washington, USA, US Department ofEnergy - Energy Efficiency & Renewable Energy, 34 pp (March 2011)Liu Z (2012) Clean Coal Power Generation in China. In: 2012 APEC Clean Fossil EnergyTechnology and Policy Seminar. Available at:http://www.egcfe.ewg.apec.org/publications/proceedings/CFE/Austrailia_2012/2C-1_Zhan.pdfAustralia (Feb 2012)Mao J (2011) Ultra-supercritical technology - the best practical and economic way to reduce CO2emissions from coal-fired power plants. Presented at the 7th International Symposium on CoalCombustion, Harbin, China (18-20 July 2011)McEvilly G, Abeysuriya S, Dix S (2011) Facilitating the adoption of biomass cofiring for powergeneration. RIRDC publication No. 11/068, Barton, Australia, Rural Industries Research andDevelopment Corporation, 119 pp (Aug 2011)MEP (2008) The 2007 report on the state of the environment in China. Ministry of EnvironmentalProtection of the People’s Republic of China, Beijing, China (2008)Minchener A (2008) Final report of CHEUBIO - Development of cofiring power generation marketopportunities to enhance the EU biomass sector through international cooperation with China.Contract number: 19668/ TREN/05/FP6EN/S07.60657/019668 CH-EU-BIO. Available at:http://www.aebiom.org/IMG/pdf/CHEUBIO_finalreport_20081208.pdf Brussels, Belgium, theEuropean Biomass Association, 37 pp (2008)Minchener A (2010) Developments in China’s coal-fired power sector. CCC/163, London, UK, IEAClean Coal Centre, 55 pp (January 2011)Minchener A (2011) CCS challenges and opportunities for China. CCC/190, London, UK, IEAClean Coal Centre, 95 pp (Dec 2011)Moghtaderi B, Ness J (2007) Coal-biomass cofiring handbook. Moghtaderi B, Ness J (ed) Australia,Australian Black Coal Utilisation Research Ltd, p: b-60 (2007)Nalbandian H (2008) Performance and risks of advanced pulverised coal plant. CCC/135, London,UK, IEA Clean Coal Centre, 70 ppNDRC (2007) Medium and Long Term Development Plan for Renewable Energy in China. Availableat: http://www.sdpc.gov.cn/zcfb/zcfbtz/2007tongzhi/W020070904607346044110.pdf Beijing, China,National Development and Reform Commission, 32 pp (Aug 2007)New Energy Finance (2009) Carbon markets - EU ETS Research note: Impact of the EU ETS onpower sector investments - a survey of European utilities. Available at:http://bnef.com/Download/pressreleases/77/pdffile2/ London, UK, Bloomberg New Energy Finance,7 pp (Dec 2009)NREL (2009) State of the Sates 2009: renewable energy development and the role of policy.NREL/TP-6A2-46667, Washington, D C, USA, National Renewable Energy Laboratory, 212 pp(Oct 2009)Ofgem (2010) The Renewables Obligation buy-out prices and mutualisation ceiling 2010-11 -information note. Available at: http://www.ofgem.gov.uk/Media/PressRel/Documents1/RO%20Buy-Out%20price%202010%2011%20FINAL%20FINAL.pdf London, UK, Office of Gas and ElectricityMarkets, 2 pp (Feb 2010)Oswald E, Larsen M (2006) An explanation of clean renewable energy bonds. Available at:http://www.orrick.com/fileupload/636.PDF Washington, D.C, USA, Orrick, Herrington & SutcliffeLLP, 14 pp (2006)
49Support mechanisms for cofiring secondary fuels
References

Oxera (2009) What is the impact of changes to the cofiring cap?- Prepared for DECC. Available at:http://www.decc.gov.uk/assets/decc/Consultations/Renewable%20Electricity%20Financial%20Incentives/1_20090921145439_e_@@_Implicationsofchangestothecofiringcap2.pdf URN 09D/752,London, UK, Department of Energy and Climate Change, 92 pp (Sept 2009)Qing S (2007) Analysis of the prospect of cofiring of biomass with coal in China. Available at:http://www.cesd-sass.org/energy/UploadFiles_2582/200803/20080319092112998.pdf Shanghai,China, Shanghai Academy of Social Science (2007)Schultz A, Petchey R (2011) Energy update 2011. Available at:http://adl.brs.gov.au/data/warehouse/pe_abares99010610/EnergyUpdate_2011_REPORT.pdfCanberra, Australia, Australian Bureau of Agricultural and Resource Economics and Sciences(June 2011)Sullivan P, Logan J, Bird L, Short W (2009) Comparative analysis of three proposed federalrenewable electricity standards. NREL/TP-6A2-45877, Colorado, USA, National Renewable EnergyLaboratory, 30 pp (May 2009)Sun R, Cui Z, Ye T (2012) Development of 700°C USC coal-fired power generation technology inChina. In: IEA CCC workshop on advanced USC coal-fired power plants, Vienna, Austria, 19-20 Sep2012. London, UK, International Energy Agency Clean Coal Centre (2012)Tøslev P (2012) Fredericia, Denmark, DONG Energy, personal communication (Oct 2012)UNFCCC (2012) Copenhagen Accord: appendix I - quantified economy-wide emissions targets for2020. Available at: http://unfccc.int/meetings/copenhagen_dec_2009/items/5264.php Bonn, Germany,the Secretariat of the United Nations Framework Convention on Climate Change (2012)van Loo S, Koppejan J (2008) The handbook of biomass combustion & co-firing. van Loo S,Koppejan (ed) London, UK, Earthscan, 464 pp (Dec 2008)WEO (2010) World Energy Outlook 2010. Paris, France, the International Energy Agency (2010)Zhang S (2011) The 4th quarter report on biomass energy sector – comments on the 12th Five YearPlan on biomass energy. Shanghai, China, Sinolink Securities, 4pp (Nov 2011)
50 IEA CLEAN COAL CENTRE
References