support to sme development in armenia (smeda) project is co … · 2018-11-13 · 1 "support...
TRANSCRIPT
1
"Support to SME Development in Armenia" (SMEDA) project is co-funded by the European
Union and the German Federal Ministry for Economic Cooperation and Development (BMZ) and
implemented by GIZ Private Sector Development in South Caucasus Programme. SMEDA is part of the EU4Business and EU4Innovation initiatives of the European Union.
2
CONTENTS
ABBREVIATIONS ...................................................................................................................... 5
EXECUTIVE SUMMARY ........................................................................................................... 6
INTRODUCTION ......................................................................................................................10
Data sources and methodology .............................................................................................12
Structure of the report ............................................................................................................13
1. THE ANALYSIS OF GOVERNMENT STRATEGY ON PE .................................................14
2. SECTOR DEFINITION AND ESTIMATES ON NUMBER OF COMPANIES IN THE PE
SECTOR ...................................................................................................................................21
2.1 Sector definition ...............................................................................................................21
2.2 Number of economic units (companies, individual entrepreneurs) in Precision Engineering
sectors ...................................................................................................................................23
2.3 The characteristics of the companies in the survey ..........................................................25
3. OVERVIEW OF ECONOMIC ACTIVITY IN THE SECTOR ................................................28
3.1 Production volumes by subsector and company size .......................................................28
3.2 Sales by destination: domestic market vs external market ...............................................34
3.3 Employment in the sector ................................................................................................37
3.4 Assessment of the factors influencing business activity (according to survey) .................39
3.5 Expectations for PE sector development in 2017-2019 (according to survey) ..................42
4. EXTERNAL ECONOMIC ACTIVITY ...................................................................................44
5. ACCESS TO HUMAN CAPITAL AND HR MANAGEMENT PRACTICE .............................57
6. INVESTMENT, INNOVATION AND R&D ACTIVITY IN THE SECTOR ..............................66
7. ACCESS TO FINANCE ......................................................................................................69
8. CHALLENGES AND NEEDS OF THE SECTOR ................................................................74
9. MAIN FINDINGS AND CONCLUSIONS.............................................................................80
10. RECOMMENDATIONS ..................................................................................................85
ANNEX 1. The list of conducted in-depth interviews .................................................................87
ANNEX 2. Information on education programs, students and staff ............................................91
1. Number of Students per Specialization/Majors and Educational Programs (according to
information provided by Ministry of Education) ......................................................................91
2. Educational programs, number of current full-time and part-time students and current
educational fees (according to information provided by institutions in addition to in-depth
interviews) .............................................................................................................................96
3. The number of graduates over the previous three academic years (according to
information provided by institutions in addition to in-depth interviews) ................................. 101
4. Faculties and appropriate numbers of staff, including instructors/lecturers (according to
information provided by institutions in addition to in-depth interviews). ................................ 104

3
TABLES
Table 1. Number of companies by PE subsectors 2010-2013 (NSS publication) .......................23
Table 2. Number of companies by PE subsectors (based on Tax service database, retrieved on
10 February 2017) ....................................................................................................................24
Table 3. The distribution of surveyed companies by marzes (regions) ......................................25
Table 4. Production volumes by PE sub-sectors 2012-2016 (mln AMD) ...................................28
Table 5. PE subsectors real growth (decline) to previous year ..................................................30
Table 6. Estimates of sales volumes by size of surveyed companies ........................................33
Table 7. Distribution of PE subsector 2016 sales by purchasers in domestic market and direct
exports ......................................................................................................................................36
Table 8. The assessment of factors by their influence on business activity (by size of
companies)-average indicators of assessment* ........................................................................39
Table 9. The assessment of factors by their influence on business activity (by main type of
activity of companies) – average indicators of assessment* ......................................................40
Table 10. Export of PE sectors production, ths USD .................................................................46
Table 11. Top export products from Armenia (2013-2016) - Cumulative volumes by HS 4 digit
product lines .............................................................................................................................47
Table 12. Export volume by HS 4 digit product lines (2016) – Top products ..............................48
Table 13. The structure of exported PE products according to survey companies (by number of
mentioned units) .......................................................................................................................50
Table 14. The structure of exported PE products by countries (survey company estimates) .....52
Table 15. Need for specialists mentioned in the survey by main type of activity (according to the
companies) ...............................................................................................................................59
Table 16. Share of companies with specific HR operation in 2016 (by size of the companies) ..60
Table 17. Share of companies with specific HR operation in 2016 (by main type of activity of the
companies) ...............................................................................................................................61
Table 18. Level of interest in professional HR outsourcing services (according to the companies)
.................................................................................................................................................61
Table 19. Share of companies with specific type of innovation activity (% to all companies in
specific type of activity) .............................................................................................................66
Table 20. Share of companies with any investment and average size of investment in 2014-
2016 ..........................................................................................................................................67
Table 21. The structure of investments in PE companies in 2016, by main type of activity ........68
Table 22. The structure of financing sources for investment in the companies, by size of the
company ...................................................................................................................................70
Table 23. The structure of financing sources for investment in the companies, by main type of
activity .......................................................................................................................................70
Table 24. Expectations on new projects and development plans in 2017-2019, by main type of
economic activity (according to the companies) ........................................................................72
Table 25. The structure of most effective types of assistance to the companies in next 3 years
by main types of activity (based on 3 most effective tools mentioned by each company) ..........79
4
FIGURES
Figure 1. Number of companies according to the types of activities (mentioned by respondents)
.................................................................................................................................................26
Figure 2. Distribution of PE companies by main shareholder ....................................................27
Figure 3. Real average annual growth (decline) of PE subsectors for 2013-2016 and 2016/2015
.................................................................................................................................................29
Figure 4. Real annual growth in PE sector production 2010-2016 (% to previous year) ............29
Figure 5. Structure of subsectors* by size of companies (based on number of companies), % in
each subsector (2016 data).......................................................................................................31
Figure 6. Structure of subsectors* by size of companies (based on volume of production), % for
each subsector (2016 data).......................................................................................................31
Figure 7. Distribution of PE companies by number of employees according to the survey ........32
Figure 8. Distribution of PE subsector 2016 sales by “pure” types of economic activities ..........33
Figure 9. Share of direct exports in sales of companies in PE sectors 2010-2013, %................34
Figure 10. Share of direct exports in sales ................................................................................35
Figure 11. Share of CIS in total exports ....................................................................................35
Figure 12. Distribution of PE subsector 2016 sales by domestic market and direct exports ......35
Figure 13. Number of employees* by subsectors of PE and size of companies, 2016...............37
Figure 14. Overall size of employment by main activity and size of companies .........................38
Figure 15. Expectations on subsector developments in 2017-2019 ...........................................42
Figure 16. Expectations on subsector developments in 2017-2019 by company size and main
economic activity .......................................................................................................................43
Figure 17. Volume of exports and growth (decline) in 1995-2016 ..............................................44
Figure 18. Dynamics of Export of PE sectors production in 2009-2016 .....................................46
Figure 19. Structure of Export by PE products for 2013-2015 ...................................................47
Figure 20. Share of companies with export activities in 2016 by size of surveyed companies ...49
Figure 21. The structure of exported PE products according to survey companies (by estimated
trade volume indicators) ............................................................................................................51
Figure 22. Export logistics structure of PE survey companies by size and main type of activity
(weighted by export volume indicators) .....................................................................................53
Figure 23. Share of companies which imported fixed assets in 2016 by size and main type of
activity .......................................................................................................................................54
Figure 24. Share of companies which imported raw materials in 2016 by size and main type of
activity .......................................................................................................................................54
Figure 25. The main prerequisites for export growth according to the companies in precision
engineering ...............................................................................................................................55
Figure 26. Share of companies which suffered with finding needed specialists .........................57
Figure 27. The structure of specializations that was difficult to find (according to the companies)
.................................................................................................................................................58
Figure 28. Perception on availability of professionals by fields (according to the companies) ....62
Figure 29. The structure of financing sources for investment in the companies .........................69
Figure 30. Share of companies which applied for a loan to a financial company in 2016 ...........71
Figure 31. Expectations on new projects and development plans in 2017-2019 (according to the
companies) ...............................................................................................................................72
Figure 32. The structure of financing sources for investment in the companies .........................73
Figure 33. The structure of most effective types of assistance to the companies in next 3 years
(based on 3 most effective tools mentioned by each company) ................................................78

5
ABBREVIATIONS
AMD Armenian dram
ANEL Armenian National Engineering Laboratory
ASPE American Society for Precision Engineering
CBA Central bank of Armenia
CIS Commonwealth of Independent States
DFA Development Foundation of Armenia
DSPE Dutch Society for Precision Engineering
EAEU Eurasian Economic Union
EIF Enterprise Incubator Foundation
EU European Union
EUR Euro
EUSPEN European Society for Precision Engineering and Nanotechnology
FEZ Free economic zone
GDP Gross domestic product
GIZ German Federal Enterprise for International Cooperation
GoA the Government of Armenia
HR Human Resources
HS Harmonized system
IDF Industrial Development Foundation
ISIC, Rev. 4 International Standard Industrial Classification of All Economic Activities,
Revision 4
IT Information technology
JSPE The Japan Society for Precision Engineering
M&S Machinery and Systems
NACE Rev.
2
Statistical classification of economic activities in the European Community,
Revision 2
NSS RA National Statistical Service of the Republic of Armenia
PE Precision Engineering
PMC Precision Modules Components
PPD Private-Public dialogue
R&D Research and Development
RA Republic of Armenia
SEUA State Engineering University of Armenia
SME Small and Medium Enterprises
SMEDA EU-GIZ Support for the Small and Medium Enterprises Development in Armenia
UAE United Arab Emirates
UITE Union of information technology enterprises
UN comtrade United Nations Commodity trade database
US, USA United States
USD United States dollar

6
EXECUTIVE SUMMARY
Precision engineering (PE) has been declared as one of the 11 priority sectors for Armenian
economy, which has a high development and export potential. Moreover, Precision engineering
is one of three priority industries which have strategic papers on development and support
adopted by the Government in 2013. During these years, a number of initiatives were undertaken
by Government as well as international and industry support organizations to support the
development of precision engineering sector in Armenia. Particularly, a number of laboratories,
technological centers were established with cooperation of internationally recognized
organizations and institutions, many initiatives in education and research institutions were
launched.
Anyway, there are still a number of challenges for the companies in the sector. This report
summarizes the results of a study on precision engineering sector and tries to understand
challenges, weaknesses and ways to support further development of the sector. The study aimed
to survey all the companies in precision engineering sector, included in-depth interviews with the
government bodies, industry support organizations, established technological centers and free
economic zone (FEZ), educational and scientific research institutions in the field of precision
engineering.
The discussions with government bodies and industry support organizations revealed that there
is a need for revisions in the strategy and action plan for precision engineering sector, taking into
account recent development in the economy, such as membership of Armenia in the Eurasian
Economic Union, slowdown of economic growth due to decrease of commodity prices and
recession in the Russian economy. These changes slowed development of precision engineering
sector also. It was acknowledged that recent initiatives of establishment of laboratories and
technological centers in Gyumri and Vanadzor are expected to have positive influence on the
development of the sector. Even with these developments it is still clear that the government
should improve investment climate for the sector and continue support on establishing sufficient
infrastructure for the further development of the sector. There is a need to raise an awareness of
the sector representatives on strategies and action plans as many beneficiaries of the sector are
not aware of specific action and plans for the development of the sector.
The companies in the sector as well as industry support organizations, scientific research and
education institutions state the importance of the role of the government for the further
development of the sector. The role of international organizations is also emphasized in
assistance to bring international best practice, technical support and expertise to support the
development of the sector.
SME development issues are very important for the ensuring growth of PE sector in Armenia.
More than 50% of all companies in PE manufacturing industries are micro-sized units (companies
and individual entrepreneurs with less than 10 employees), other companies are small or medium

7
sized and there are only few companies with over 250 employees. SMEs have larger difficulties
in attracting investments, implementing new technologies and equipment, but also related to
management and HR issues, sales and marketing, especially in external markets. The latter is
very important for any company in PE sector as the small size of Armenian economy and demand
for precision engineering products cannot create opportunities for development of a company.
“Manufacturing of computer, electronic and optical products” is the most promising PE subsector
in terms of potential and development. Economic performance of this subsector is much better
than in two other subsectors: Manufacture of electrical equipment and Manufacture of machinery
and equipment. The latter (mechanical and machinery engineering) is well behind of other two
subsectors. One of the advantages of electronic and optical engineering subsector is its strong
links to and inter-dependence with IT sector, which has already observed high development pace
in Armenia. Particularly, the IT sector may support the development of related industries by
providing highly skilled professionals. Hence, it is expected that production of electrical equipment
may exhibit growth in medium term period.
Economic activity in the sector showed large increase in 2016 compared to 2015, which is a
positive trend after a slowdown and even decline in PE subsectors during 2013-2015. Majority of
PE companies expects moderate growth of the subsector in Armenia during the next 3 year
period.
Availability of export opportunities are very important for the development of the companies in the
sector. The share of direct export in total sales of PE manufacturing companies is declining during
recent years (from 42% in 2013 to 22% in 2016), which has its impact on the development trends
of the sector. Moreover, export concentration by countries is high, around 60-70% of direct export
sales from companies goes to CIS market (Russia), another destination with significant share is
Switzerland, where clock and watches parts are exported. The companies (especially micro and
small sized) have large difficulties with organizing sales and marketing, which is one of the
reasons of low exports and current export concentration. Another, but not least important factors
of low exports is perhaps in the types of products, most of which cannot be competitive and need
investments in new technologies and equipment. It is interesting, that the companies think that
the availability of foreign partners, improvements in sales and marketing are more important, than
improvement of product quality and investments in technology. At the same time the prevailing
majority of companies (87%) organize their exports through own resources without using any
domestic or foreign distributor, trying to reduce their costs. On the contrary having a distributor
may be one of the tools for successful accession to external markets, especially for SME type
companies.
Availability of sufficient quantity of professionals in PE sector is another issue mentioned by the
players in the field. It is interesting that most of the participants state that one of the comparative
advantages of PE sector in Armenia is the availability of experienced and qualified professionals
(engineers), due to traditional strong PE sector and education in Soviet times. At the same time

8
the lack of professionals in the field is mentioned as one of the obstacles for the development of
PE sector. This could partially be explained by not sufficient involvement of young professionals.
Hence, there is a need to attract young generation to the sector, which may need changes in
education programs, vocational education trainings, cooperation of businesses with
education/research institutes. The lack of young qualified professionals is more noticeable in
mechanical and machinery related workers, such as locksmith, turner, miller, wrappers. These
issues can be solved by strengthening vocational education institutions and attracting people
through the cooperation between businesses and these institutions.
Most of the companies in PE sector lack HR management skills. Only 29% of companies in the
sector have special HR related personnel in their staff, which can be also explained by small size
of the companies. Moreover the companies are not mainly interested (or perhaps cannot afford)
in professional HR outsource services, like payroll services, staff recruitment and other.
Along with perception on lack of professionals in the field, low competitiveness of the sector in
Armenia is also frequently mentioned by the experts in precision engineering. Innovations and
investments by the companies may increase competitiveness of these companies in the
international markets which will increase competitiveness of the sector itself. Majority of
companies in the survey (72%) reported about innovation activity in their company, mainly related
to the development of new products or improvement of existing products. At the same time
average level of investments in 2016 is lower than in previous 2 years. Average investments in
manufacturing of electronic and optical products is times higher than in other PE subsectors,
which explains development trend of the subsectors. Most of the investments (90%) go to
acquisition of technology and equipment but taking into account the small size of investments
they cannot increase significantly the competitiveness of PE sector companies.
One of the main reasons for low level of investments is low access to finance. Most of the
companies in the sector try to finance their investments from profits or owner’s resources, which
explains small size of current investments (taking into account also that most of the companies
are SMEs). Only 4% of investments is financed by bank loan/leasing. The analysis show that
issues to access to finance are not rely only on usual reasons, such as small size of company,
absence of collateral, high interest rates, but also in business plans of the companies,
development of quality products and available sales markets. So access to finance issues can be
significantly improved with the development of technologies and product quality. Anyway some
measures should be taken to facilitate access of start-ups to finance. Among ways to increase
access to finance could be establishment of venture funds in precision engineering projects,
establishment of credit guarantee fund for PE.
Main challenges of the sector are summarized below:
§ Small internal market and unfavorable geopolitical location of the country.

9
§ Low level of exporting activities, difficulties to access external markets. Transportation
issues especially for large size products.
§ Shortage of general infrastructure for further development of the sector.
§ Access to finance. Not sufficient investments in new technologies and equipment in the
sector companies.
§ Need for young professionals in the sector. Taking into account strong traditional
development of precision engineering related fields in Armenia (especially in Soviet era)
there are qualified specialists, but not sufficient for the development of the sector (as their
number is decreasing) and there is a need for qualified young specialists for further
development of the sector.
§ Educational programs and methods currently utilized by leading educational institutions in
Armenia need substantial revision in order to become adequate to the current trends and
requirements of the sector.
§ Lack or absence of cooperation between the companies in the sector as well as between
companies and science/research/educational institutions.
§ Need for strong industry union for PE sector companies.
The assistance of international organizations can be crucial for the development of the sector.
Particularly the following assistance can be productive.
§ Strengthening cooperation of Armenian PE companies with foreign partners
§ Raising awareness on current trends, new technologies in PE subsectors, international
best practice
§ Business trainings on product development, international certification,
§ Trainings to assist sales and marketing in PE, international best practice
§ Support to SMEs and start-us
§ Cooperation with educational institutions to support changes of educational and training
programs based on needs of the sector

10
INTRODUCTION
Since early 2000’s SME development has been declared as one of the priorities of Armenian
economy. All this time, the Government with support of international development agencies
initiated different development programs to improve situation. There are many obstacles in this
context, in particular, the lack of cohesion and coordination of different SME support programmes,
inefficient steering mechanisms for the SME development process, a fragmented landscape of
stakeholders, an inefficient public private dialogue, an inefficient decision-making process, as well
as not government-driven donor coordination process in different intervention areas. Because of
such obstacles, the SME sector still faces challenges regarding insufficiency of supporting
services, access to finance, as well as knowledge transformation and R&D activities.
With this situation in the private sector of Armenia, EU-co-financed and GIZ-implemented project
“Support to SME Development in Armenia” (SMEDA) was initiated in 2016. The objective of this
project is to improve the national business and investment climate and support the creation and
development of SMEs to enable broad based growth. In general, the project is focusing on the
following result areas:
I. Improved policy making process and coordination of supports to SME development for a
conducive business development framework,
II. Strengthened private sector organisations to implement SME policies,
III. Improved process of commercialization of ideas linking research institutions and
businesses via cooperation networks,
IV. Improved design and management of economic clusters (business incubators,
technological parks, and Free Economic Zones),
V. Diversified access to finance for innovative start-ups and small businesses.
To this end, there are several activities planned under SMEDA project, from which worth to
mention followings from the perspective of this assignment:
§ Provide technical assistance to private sector organisations to improve and expand
services and to increase their network with European businesses,
§ Strengthening the capacities of private sector organisations to participate in PPD platforms
and to utilize the opportunities of technology transfer as well as to promote entrepreneurial
skills, clusters and value chain development,
§ Support to linking research institutions and the private sector to foster innovation,
§ Support to improving cluster management, linking clusters to European networks as well
as developing and promoting new areas for business incubation,
§ Supporting the provision of grants to assist technology start-ups and SMEs promoting new
services/products etc.
11
Being declared as a sector with significant export potential, the Precision Engineering sector
appeared in the focus of the SMEDA-Project. In order to understand current situation in the sector
and draw ways of further intervention, on 19th of July the SMEDA-Project organized a roundtable
discussion with the purpose to bring companies, service providers and institutions active in the
Precision Engineering sector in Armenia. The main results of this discussion are followings:
§ Lack of modern technologies, laboratories and critical mass of expertise;
§ Weak cooperation with science;
§ Market actors are not aware of the market trends / opportunities;
§ Lack of connection and experience exchange within the Armenian community;
§ Difficulties in terms of applying for big projects;
§ Difficulties with customs clearance.
In addition to the above mentioned, other issues in the Strategy of Precision Engineering Sector
2011-2020 were also identified, such as:
§ Minor resource allocation for R&D by local companies;
§ Poor marketing and managerial skills of local companies;
§ Shortage of graduates with knowledge and practical skills, meeting the requirements of
the companies.
A sector study of Precision Engineering sector was conducted by Ameria CJSC (the Contractor)
during December 2016-February 2017, in order to understand the details of all these challenges
and to find out the potential development directions of the sector, it is intended to conduct.
The general objectives of this study were:
I. Mapping of all relevant stakeholders in the field - including business support
infrastructure (technological centres, free economic zones etc.), existing companies and
start-ups, research institution etc.
II. Sector analysis – including:
- challenges and barriers of economic activities by subsectors,
- existing support approaches in the field and the Government Strategy
- business activities with high export potential,
- approaches of companies toward Human Capital, Finance and R&D.
III. Outlining directions of possible intervention.
This report presents the results of analysis undertaken during the study of Precision engineering
sector in Armenia. In addition to this report the Contractor prepared and presented to the Client
the database (mapping) of 193 companies engaged in activities in Precision engineering sector
as well as the database of 24 educational and research institutes, industry support and other
organizations performing activities related to Precision engineering sector in Armenia.
12
Data sources and methodology
The analysis presented in the report is based on the following main data sources:
1. Desk research and Secondary data sources: In order to clearly define the composition
of sectors under the study and to analyze current situation with existing statistical data,
desk research of available information, reports and statistics was conducted. Particularly,
the following was done:
ü reviewing of international and national classifications applied to define the sector of
Precision Engineering
ü reviewing Sector development strategies and other related policy papers in Armenia
ü reviewing and analyzing available statistical information to describe the development of
the Precision Engineering sector in Armenia
2. Primary data sources: In order to provide information needed for analysis of the sector
in the study and to meet the main objectives of the study, qualitative and quantitative data
collection surveys were initiated within the framework of the project. Particularly:
ü In-depth interviews with the key stakeholders (25 in-depth interviews)
25 in-depth interviews with the key stakeholders of the PE sector and subsectors were conducted.
The representatives of in-depth interviews can be divided into 4 main groups: public authorities
and industry support organizations, technology centers and free economic zone, educational
institutions and research institutions. Details on in-depth interviews are presented in the Annex 1.
Three different variants of in-depth interview tools (questions for discussions) were developed to
capture relevant information from different participants. Additionally, the organizations
participated in in-depth interviews were asked to provide detailed information on their laboratories
and equipment to share this information on the special website, which can be used for all the
participants in the PE sector. Most of the respondents have agreed to provide this information
(summary details are presented in Annex 2).
ü Survey of companies in Precision Engineering sector (aiming to capture all the
companies active in the sector)
With the aim to capture all the active companies engaged in activities related to precision
engineering sector, all available data sources on the list of companies were analyzed and
database with contact information is developed. Then all the companies with available contact
information (address, phone number) were initially screened to understand their relation to
Precision engineering sector. As result 211 companies in Precision Engineering related sector
were identified. 193 companies agreed to participate in the survey and were interviewed with the

13
pre-designed questionnaire. The questionnaire consisted of 2 main parts. First part of the
questionnaire aimed to collect quantitative and qualitative information on economic activity,
external economic activity, investments and innovations, HR related issues and challenges in the
sectors, while the second part of the questionnaire aimed to collect detailed information on types
of products produced, available technologies and equipment as well as available professionals in
the company. The companies were informed that the information in the second part of the
questionnaire will be made available publicly for all the interested participants through posting this
information on the website. The companies were distributed by corresponding sub-sector in order
to obtain quantitative and qualitative information on all subsectors.
As a result of survey phase: 193 companies provided information on the second part of the
questionnaire and 186 of them provided information on both parts of the questionnaire.
Structure of the report
The report has the following structure.
Introduction includes the objectives of the study as well as the description of data sources and
tools used during the study. Then the report consists of 9 separate chapters:
1. The analysis of Government strategy on Precision engineering
2. Sector definition and estimates on number of companies in the sector.
3. Overview of economic activity in the sector
4. External economic activity
5. Access to human capital and HR management practice
6. Investment, Innovation and R&D activity in the sector
7. Access to finance
8. Challenges of the sector and the ways to solve these issues
9. Main Findings and Conclusions
10. Recommendations
Each chapter includes analysis based on relevant information from desk research, survey of
companies and in-depth interviews with key representatives of the sector.

14
1. THE ANALYSIS OF GOVERNMENT STRATEGY ON PE
Since the beginning of 1990s the Armenian precision engineering industry, inherited from the
Soviet times, one of the key drivers of the economic development contributing around 30% of
GDP, has started to observe gradual shrinking of the output. This trend continues until 2000s
when, in order to ensure continuous economic growth and increase overall competitiveness of
the economy, the Government of Armenia (GoA) started to pursue the policy of supporting the
development of the knowledge-based economy and accordingly designing and gradually
implementing export-based industrial policy. Among other sectors precision engineering was
selected as one having high development potential, considering also the availability of highly
skilled specialists on the market.
The most important document related to the development of precision engineering sector is the
GoA decree N49 “On the RA export oriented Industry Policy Strategy”, adopted in December
2011. The Strategy covers the period of 2011-2020 and has overall objective of supporting
development of already existing or emerging export-oriented sectors. The eleven sectors chosen
as priority ones were Diamond industry, Gemstone industry, Watch manufacturing, Cognac
production, Pharmaceuticals and Biotechnology, Cannery, Winery, Mineral water and Juice
production, Textile production industry and Precision Engineering. The launch of the activities
under the approved strategy started with only three sectors, among which were also precision
engineering. For each of those sectors the respective strategies for 2011-2020 and action plans
for 2012-2015 were developed and approved on 6 December 2013. Adopted sectorial strategies
envisage following directions for providing state support:
§ Attraction of transnational corporations,
§ Innovation support,
§ Financial support for investment and export promotion,
§ Capacity building,
§ Sales promotion,
§ Improving the legal framework of foreign economic activity.
Overall awareness on declaring precision engineering as a priority industry for the Armenian
economy by the government is high among the key representatives of educational, research
institutions, technology centers, government bodies and industrial support organizations engaged
in Precision engineering sector. Anyway the awareness on the details of strategy and action plan
is not so high.
15
The Industrial Development Foundation (IDF), established in 2009 by GoA decree, was selected
as implementation authority to undertake the actions envisaged in the sectorial strategies
approved within the framework of the export oriented industrial policy strategy. According to the
GoA decree N1523-N dated 18 December 2014, the IDF was reorganized and merged with the
National Competitiveness Foundation. As a result, the Development Foundation of Armenia
(DFA) was established to which the responsibility for the implementation of the adopted strategies
was transferred.
In-depth interviews with the representatives of governmental bodies and industry support
organizations revealed the need to improve dissemination of relevant information about the strategy
and adopted action plan since some of those organizations were not fully aware that the sector is
considered a priority one by Government decree; hence not able to utilize the existing opportunities.
Technology centers and FEZ representatives are aware about the declaration of the RA government in
which Precision Engineering is considered as priority industry for the Government. But they don’t have
precise information about the strategy and its accomplishment.
Research institutions are mostly aware of the fact, that precision engineering has recognized one of
the priority sectors of RA economy. Indeed most of them were familiar with its strategy and action
plan. Yet, albeit, most of them preferred not to go into details, and share the opinion that despite
some works are done, much still need to be done furtherly. One of the respondents mentioned that
the approach to PE is very superficial, putting main attention mostly on information technologies, in
particular on chemical technologies and added that an action plan need to classify the problems and
the actions needed to meet them; this can rather be considered a strategy than an action plan.
Nine out of ten educational institutions representatives in in-depth interviews mentioned that they
are aware of declared precision engineering as a priority industry of Armenian economy. However,
overall they do not have detailed information about Governments program and its strategy. Several
respondents had a negative opinion about program’s essence and realization. As was mentioned by
one of them it is “unrealistic and one sided”. However, two respondents consider the declaration and
the program a very important step for the future of the industry.
16
An important support to RA Precision Engineering industry was the establishment of Free
Economic Zone (FEZ) - “Alliance” - in the territory of “RAO Mars” industrial complex (by RA
Government decree N785-A, 18 July, 2013). “Alliance” is oriented to the production and exports
of high and innovative technologies in the field of electronics, precision engineering,
pharmaceutics and biotechnologies, alternative energy, industrial design and
telecommunications. It can be said, that, this development was an important step in the launch of
favorable infrastructure for companies acting in Precision Engineering industry. The goal of FEZ
is attracting foreign direct investments, boost exports, create new jobs and provide for sustainable
economic development. The priorities of the zone are the following: no foreign exchange
restrictions, free transfer of capital, profits and dividends, which will help to reduce the cost-price
and increase the competitiveness of manufactured goods. As of today there are already 9
companies operating in the FEZ. Overall number of employees in the FEZ is above 150.
Additionally, within the adopted industrial development strategies the Government by its decree
N1083-A dated 3 October, 2013 approved state participation in the capital of the newly
established venture fund – Granatus Ventures in the amount not exceeding Armenian dram
equivalent of 3,300,000 USD. Purpose of the fund is to provide early stage product development
and company formation funding for the high-growth enterprises targeting global markets in sectors
that leverage the latest developments in social, mobile, analytics and cloud technologies. The
Fund is supposed to provide funding for the companies operating in the precision engineering
sector as well, however until now eight, mainly IT projects received support from the Fund.
Upon accession of Armenia to the Eurasian Economic Union in 2015, the economic development
policies and strategies, implemented by the GoA, should be coordinated with Eurasian Economic
Commission and government of other member states. Hence, the decision N9 of the Eurasian
Intergovernmental Council (consisting of the Prime Ministers of member states) dated 8
September 2015 on Main directions of industrial cooperation within the Eurasian Economic Union
is also impacting the industrial policy of Armenia. Some subsectors of the precision engineering
industry – production of electrical machines, electronic and optical equipment - is considered as
a priority for the development. Additionally, the adopted document assumes establishment of the
Considering the above presented changes in the institutional arrangements, as well as the fact
that the industry actual performance indicators are already behind those expected to be achieved
by the approved strategies, there is need for substantial revision and adoption of new sector
development strategies and action plans to reflect the changes occurred and new realities. This
need was mentioned by respondents during in-depth interviews with representatives of
governmental bodies and industry support organizations. Additionally, they highlighted the need
to adopt cluster approach for the development of the sector strategies, considering that precision
engineering has many different sub-sectors, i.e. machine-building, optics, laser technology,
machine tools, etc., which could have specific development needs.
17
Eurasian Engineering Center (location yet to be determined) and competence centers for the
implementation of joint research projects and development of innovation infrastructure.
Enterprise Incubator Foundation and US Agency for International Development signed an
Agreement on establishment of Armenian National Engineering Laboratory (ANEL) at the State
Engineering University of Armenia (SEUA), jointly with the National Instruments Armenian
Branch. The main goal of the Project is to meet the demand of the engineering industry in quality
specialists and graduates educated on up-to-date technological base to confront the employee
shortage and to increase value-added and innovativeness of Armenian high tech businesses,
thus increasing their international competitiveness. The objectives of the Project are to strengthen
the educational capabilities and enhance the research potential of the Armenian engineering
sector by upgrading and expanding the SEUA educational and research facilities to the world
standard through the establishment of ANEL. Creation of such a Center for excellence in
engineering addresses the following key challenges:
§ Outdated laboratory equipment and the need to modernize engineering curriculum in
Armenia;
§ Increasing demand for Armenian engineering talent by the engineering and engineering
design companies worldwide;
§ Turning Armenia into an exporter of engineering technologies, products and services to
the global market;
§ Establishing strategic research directions and shaping Armenia as a vital engineering hub.
The ANEL key advantages are:
§ State-of-the-art laboratory equipment;
§ Coverage of most of the priority engineering areas of SEUA;
§ Cost effective: one laboratory is used by different disciplines;
§ Combination of learning process and research activities;
§ Modern curricula and teaching materials;
§ Incubation environment;
§ Open use: being accessible for interested parties for other universities.
The ANEL cooperates with industry and research institutions in the country. In particular,
Research Laboratories offers services to Armenia’s industry and research institutes to quickly and
inexpensively solve their technical and scientific challenges. Educational Laboratories
compliment these efforts by providing facilities to train future personnel for the research
institutions, Armenian industry and engineering groups.
The ANEL is located on four floors of the SEUA Yerevan campus building #10. The total area is
1,600 sq m. It is comprised of about 30 specialized and universal Educational and Research
laboratories covering 6 major specializations of SEUA: Cybernetics, Radio Engineering and
18
Communication Systems, Power Energy, Electrical Engineering, Transport and Mechanical and
Machine Building engineering. There are 18 different laboratories currently (13 educational and 5
research). Combination of Educational and Research labs ensure the students involvement in
scientific projects and developments which help them to quickly integrate into the scientific and
engineering projects, based on their experience in ANEL. Laboratories are equipped with the
latest equipment and software in all engineering fields.
Precision Engineering Sector development prospects in Armenia (according to industry support
and education, research institutes)
In-depth interviews with the representatives of governmental bodies and industry support
organizations revealed that the majority of them consider knowledge-based industries, including
the precision engineering sector, as those having high potential to become important drivers for
the economic growth. Development of those sectors is an excellent opportunity to put Armenia on
front line of ongoing and future technological trends. Strong precision engineering sector will also
allow attracting international corporations to Armenia, which in its turn could bring new changes
in the sector.
The respondents highlighted the opportunities created by the existing initiatives in the educational
system, e.g. establishment of specialized laboratories like ANEL, which ensures continued supply
of highly skilled professionals to the market. According to them, there is a need to drastically
increase the number of such engineering laboratories, equipped with modern technology and
machinery, since it is not possible to develop precision engineering industry without such
infrastructure. While indicating high quality of technical education, the respondents stressed the
importance of developing entrepreneurial skills among the engineers.
According to technology centers and FEZ the development of PE in Armenia will have positive
effect on the economy of RA and may become one of the most beneficial fields of economy, like
in Israel and Singapore. New workplaces will be opened and more educated specialists will be
integrated in works, if new innovational technological programs are actualized. But there are some
barriers, like lack of cooperation. Most of the PE companies in RA operate within their small
market and don’t cooperate with each other.
The representatives of educational and research institutions unanimously mentioned that PE
sector development in Armenia has real perspectives. Most of them, emphasized, that countries
like Armenia, with quite limited natural resources and, in contrast, rich intellectual potential, need
to stress a production, based on intellectual capital not on material. Yet, the sector needs further
educational support to ensure the unlimited supply of raw material, i.e. intellectual power. In other
words, the government, the educational institutions and the sector representatives need to work
together to ensure the proper conditions for the sector, that is one of the most promising industries
for the country, which will support the sector’s further flourishing, hence country’s economic

19
development. One of the respondents’ mentioned that PE is a supporting industry for production,
the development of which can push the production and country’s economic development as well.
The supporting role of the Government and international organizations (perceptions of industry
support and education, research institutes)
The importance of the role of government in development of Precision engineering sector in
Armenia is recognized by all the participant organizations in the sector, including state agencies,
industry support organizations, educational and research institutes. The role of international
organizations in providing assistance on international best practice and expertise is also very
important.
According to governmental bodies and industry support organizations representatives, state plays
very important role and stays ready to make all possible efforts to develop the sector. Particularly
state is involved in ongoing projects to develop the required infrastructure, strengthening the
educational institutions capacity, soliciting funding from international donor organizations.
Additionally, the industry support organizations would like to see the involvement of state in
bringing the expertise from countries with developed precision engineering sector to the Armenian
educational system. Particularly they see state involvement in convincing companies from those
countries to establish their research laboratories in Armenia and creating favorable environment
for those investments. Additionally state should create stimulating environment for local
companies to sponsor students, who upon graduation will work for them, as well as for
establishing small engineering laboratories at secondary schools. Finally, they noticed that state
should develop specific strategies and action plans not for the whole precision engineering sector,
but separately for its sub-sector – machine-tools, instruments, laser technologies, etc.
According to the representatives of Technology centers and FEZ, the role that the government
can play in supporting the development of PE, is by investing in this sector. Investments are
needed for instance in education sector to prepare high quality professionals and in infrastructure,
the state can also provide grants to newly established companies to support them in the first
stages of their growths. Additionally, the state can play an important role in securing demand for
PE organizations especially in defense sector and in all other sectors where it has influence. On
the other hand international organizations could support the PE sector in Armenia by sharing best
international practice and provide advisory support to representatives of local PE sector. They
can do this in partnership with the state where the state would create innovations centers and
cluster zones and international organizations can provide the expertise.
The representatives from research institutions see that the government is taking steps, however,
40% of respondents mentioned that the results are not seen yet - despite the strategy is developed
no serious steps are taken so far, the government is trying to solve the large problems with small
steps. According to them additional ongoing monitoring is needed, more investment, attention
and privileges would be preferable. The opinions of research institutions’ representatives towards

20
what the state/international organizations should do to further boost the sector development, were
again quite dissenting. Only 1/3rd of the respondents shared the opinion about the necessity for
state/international organizations cooperation and need for investment. Separate participants
outlined, that the state should create new companies, use the international best practice, often
organize employee trainings, create corresponding infrastructure, ensure the product has
reached to the market, met the social issues (tangible impact on the field), etc. Nevertheless, the
participants were unanimous that some steps are already taken.
Half of the representatives of educational institutions assessed the government’s efforts as
positive. As was mentioned by one of them “Governments policy is on the right track”. On contrary,
the other half is either unsatisfied or has a negative opinion. Seventy percent of respondents think
that one of the ways in which either Government or international organizations can help to develop
PE industry in Armenia is by providing financial incentives. As was mentioned by two respondents
the Government can provide tax incentives to start ups and other PE market participants. The
other method by which Government or international organizations can support is related to
improvements in educational process. In particular, respondents valued the connections with
international organizations which can be used for organizing exchange programs.
21
2. SECTOR DEFINITION AND ESTIMATES ON NUMBER OF
COMPANIES IN THE PE SECTOR
2.1 Sector definition
Precision Engineering (PE) forms the backbone of manufacturing activity and includes the
activities of manufacturing work pieces, which have low tolerance. The industry supports the ever-
growing manufacturing sector, with a value chain that covers Machinery and Systems (M&S) and
Precision Modules Components (PMC). It is also instrumental in providing specialist engineering
services for the maintenance and overhaul of plant and machinery used in a multitude of
production processes. PE forms the integral part of electrical, electronic, mechanical and optical
engineering. From semiconductor chips, to the most advanced medical devices and the most
sophisticated drill bits used in oil exploration, precision engineered products play a vital role in the
development of the overall economy of every country.
Precision engineering sector definition in the report
The international classifications of economic activities (ISIC rev 4 and NACE rev 2) do not define
Precision Engineering as a separate sector of economy. Overall definitions of precision
engineering provided by international technical societies on precision engineering (ASPE1,
EUSPEN2, JSPE3, DSPE4) are limited to description of products and processes treated as
Precision engineering.
Broadly speaking, the classic definition of Precision Engineering is an accuracy of 1*10-6 which
is one part in one million or 1 micron in 1 meter. This is increased the fold to 1*10-7 to determine
that the level of accuracy falls under the realm of Ultra Precision Engineering.
The PE is a sub-discipline of electrical engineering, software engineering, electronics engineering,
mechanical engineering, and optical engineering that includes the manufacture of instruments
and appliances for measuring, testing and navigation, irradiation, electro-medical and electro-
therapeutic equipment, optical instruments and photographic equipment, power-driven hand
tools, metal-forming machinery, other machine tools, other special - purpose machinery, air and
spacecraft and related machinery and medical and dental equipment and supplies. It is concerned
with the design, development, manufacture and measurement of components and systems as
wide ranging as aerospace components, micro-electronic devices or grinding machines. It also
deals with techniques such as scanning tunneling microscopy, diamond turning, computer-aided
design, and dynamic modelling, as well as, involves design methodology, error budgeting,
1 American Society for Precision Engineering 2 European Society for Precision Engineering and Nanotechnology 3 The Japan Society for Precision Engineering 4 Dutch Society for Precision Engineering
22
uncertainty analysis, metrology, calibration/error compensation, precision controls, and actuators
and sensors.
The difficulties of definition of Precision engineering sector are the reason of absence of
measurement by official statistics on international and national levels. Overall definitions of
Precision engineering indicate that this sector is mainly included in the Manufacturing sector
activities unless it is closely linked to Engineering services.
According to the “Strategy of Export oriented industrial policy” (adopted by the RA Government
on 15.12.2011, N49 protocol decision), Precision engineering in Armenia is defined as
“Manufacture of machinery and equipment n.e.c. (285), Manufacture of computer, electronic and
optical products (26), Manufacture of electrical equipment (27), Manufacture of games and toys
(32.4), Manufacture of medical and dental instruments and supplies (32.5), Other manufacturing
n.e.c. (32.9)”.
All the activities defined by the Strategy represent Manufacturing activities and mainly correspond
to internationally accepted definition of Precision engineering. Anyway internationally defined
Precision Engineering does not include all the manufacturing activities of above mentioned
subsectors, but only the production of products lying under the requirements of precision
engineering products.
Another, slightly different definition was presented in the document approved by the Industrial
Council on 6 December 2013 – “Precision Engineering/Engineering Sector: Activity plan for 2012-
2015”. This document defines overall Engineering sector not only Precision Engineering.
Particularly, the document states that “Engineering sector includes companies producing (or
having potential to produce) internationally competitive products in the following sectors:
§ Manufacture of computer, electronic and optical products (26),
§ Manufacture of electrical equipment (27),
§ Manufacture of machinery and equipment n.e.c. (28) as well as
§ Engineering activities and related technical consultancy (71.12).
This study in Precision Engineering is focused manufacturing types of economic activities
mentioned above. Additionally, taking into account the definitions approved by the Industrial
Council as well as close linkage of engineering services to precision engineering sector, the
companies with the economic activities in the following service sectors are also included in the
sphere of interest of the report
§ Engineering activities and related technical consultancy (71.12),
§ Research and experimental development on natural sciences and engineering (72.1).
5 Here and afterwards the codes presented in brackets indicate corresponding coding of type of activity according
the classification of economic activities of the Republic of Armenia (which was developed on the base of European
NACE rev.2).

23
2.2 Number of economic units (companies, individual entrepreneurs) in
Precision Engineering sectors
There are 2 main sources to estimate the number of companies with activities in defined PE
sectors in Armenia. These are:
1. The publications of National Statistical Service of RA (NSS RA) on industrial statistics
(published on armstat.am website)
2. The database of Tax Service of RA on companies (published on taxservice.am website)
The information and coverage of these sources are different regarding to the main purpose of
use. Here is the short summary of information for these 2 sources.
1. NSS publications
In the framework dissemination Industrial statistics for Armenia (official statistics), NSS RA
conducts a survey of industrial companies on a monthly periodicity and publishes the data by
types of activities (according to NACE rev.2). The coverage of companies by statistics depends
on the number and size of companies in each type of activity. Particularly, monthly statistics does
not cover small size companies and individual entrepreneurs, while quarterly and annual statistics
has larger coverage. Anyway, the aim of official statistics is to provide statistically significant
estimates on production level (output) in the country, and usually this can be reached without
entire coverage of all companies in the country. So, statistical publications provide the numbers
of companies engaged in statistical surveys and not necessarily provide entire coverage of all
companies.
Table 1 shows number of companies by their main type of activity decided by NSS based on total
output volume of company.
Table 1. Number of companies by PE subsectors 2010-2013 (NSS publication)
NACE
r.2
Economic activity 2012 2013 2014 2015 2016
26 Manufacture of computer,
electronic and optical products
40 43 37 39 45
27 Manufacture of electrical
equipment
43 47 49 53 61
28 Manufacture of machinery and
equipment n.e.c.
51 50 50 47 47
32.5+32.9 Manufacture of medical and dental
instruments and supplies
34 37 39 41 41
Total, Precision Engineering
sector
168 177 175 180 194
Source: NSS RA data
24
It should be noted that these numbers refer to all companies performing activities in manufacturing
subsectors which may have precision engineering component, but not necessarily they all are
involved in PE activities, so the number of companies with PE subsector should be smaller.
Moreover NSS does not publish number of companies in engineering service activities, part of
which is also in PE subsector according to accepted definition of Precision engineering in
Armenia.
2. Tax service database
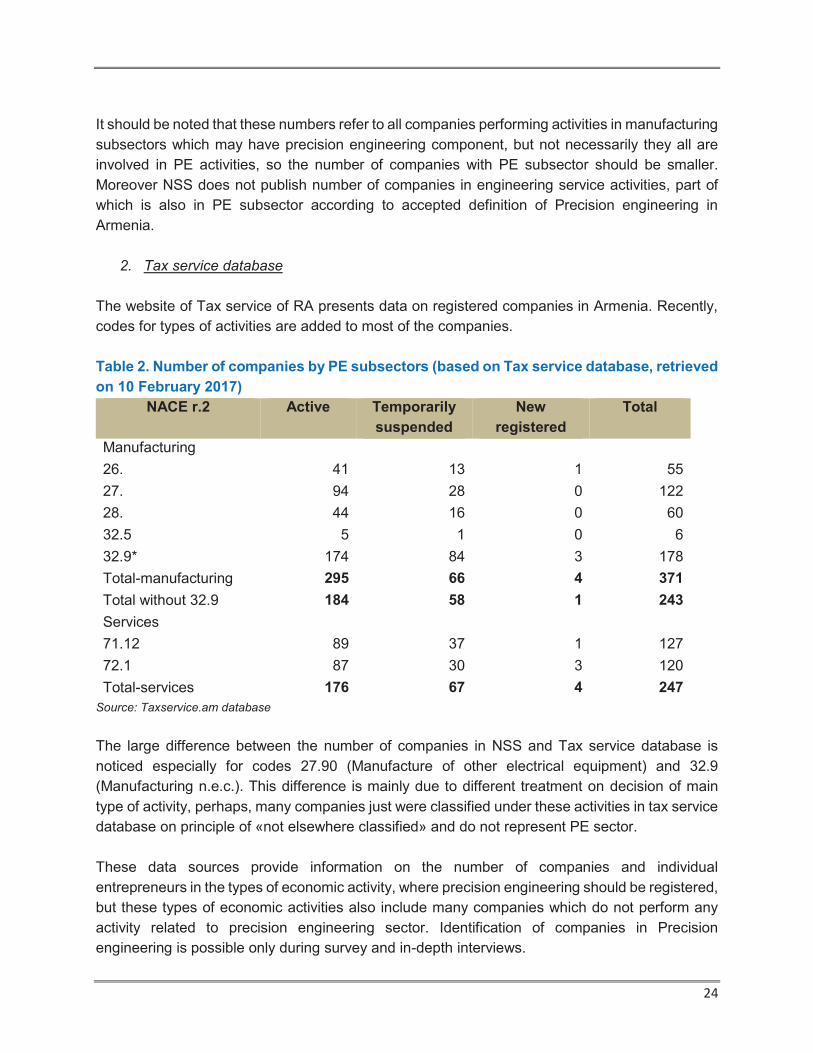
The website of Tax service of RA presents data on registered companies in Armenia. Recently,
codes for types of activities are added to most of the companies.
Table 2. Number of companies by PE subsectors (based on Tax service database, retrieved
on 10 February 2017)
NACE r.2 Active Temporarily
suspended
New
registered
Total
Manufacturing
26. 41 13 1 55
27. 94 28 0 122
28. 44 16 0 60
32.5 5 1 0 6
32.9* 174 84 3 178
Total-manufacturing 295 66 4 371
Total without 32.9 184 58 1 243
Services
71.12 89 37 1 127
72.1 87 30 3 120
Total-services 176 67 4 247
Source: Taxservice.am database
The large difference between the number of companies in NSS and Tax service database is
noticed especially for codes 27.90 (Manufacture of other electrical equipment) and 32.9
(Manufacturing n.e.c.). This difference is mainly due to different treatment on decision of main
type of activity, perhaps, many companies just were classified under these activities in tax service
database on principle of «not elsewhere classified» and do not represent PE sector.
These data sources provide information on the number of companies and individual
entrepreneurs in the types of economic activity, where precision engineering should be registered,
but these types of economic activities also include many companies which do not perform any
activity related to precision engineering sector. Identification of companies in Precision
engineering is possible only during survey and in-depth interviews.
25
2.3 The characteristics of the companies in the survey
Field work to collect data on Precision engineering sector businesses was conducted during
December 2016-February 2017, with the aim to cover all the companies (legal and physical
entities) with activities defined as Precision engineering in Armenia. Overall 186 were identified
during screening phase of the survey. These companies have provided data on their activity
according to survey questionnaire. Unfortunately there were companies which refused to
participate in the survey as well as those which were not reachable during the period of survey.
Anyway it is estimated that the survey covers over 90% of the active companies with activities
related to precision engineering in Armenia.
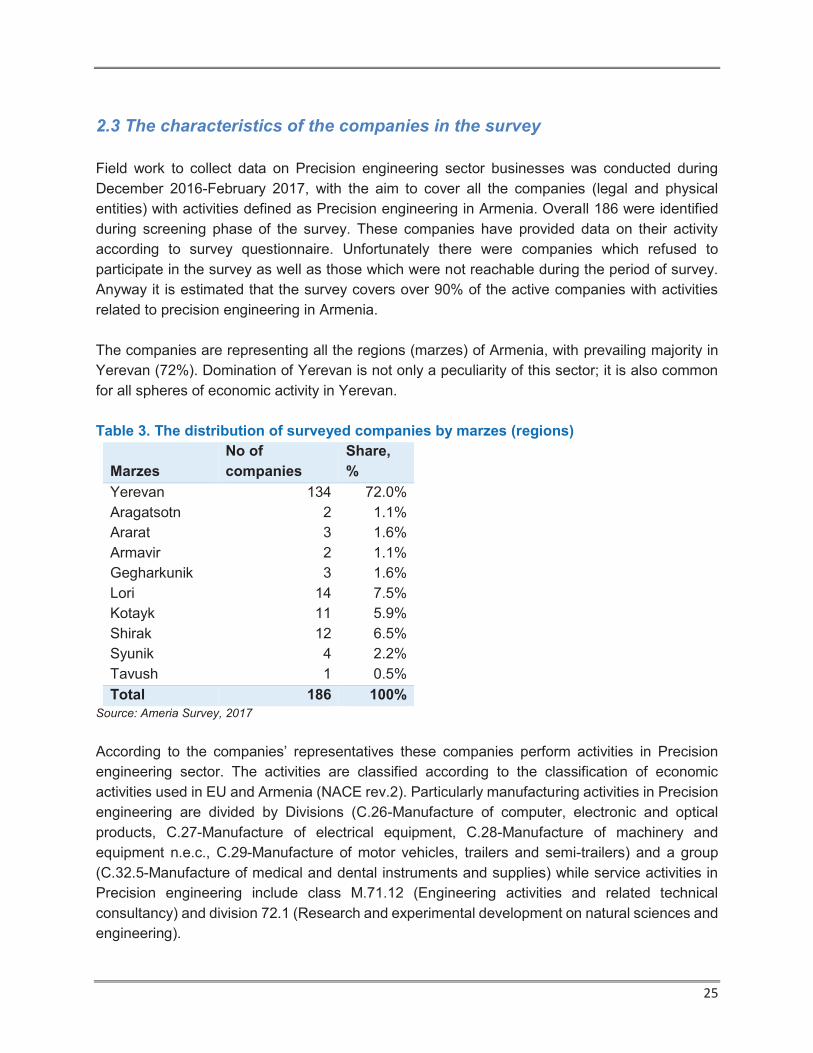
The companies are representing all the regions (marzes) of Armenia, with prevailing majority in
Yerevan (72%). Domination of Yerevan is not only a peculiarity of this sector; it is also common
for all spheres of economic activity in Yerevan.
Table 3. The distribution of surveyed companies by marzes (regions)
Marzes
No of
companies
Share,
%
Yerevan 134 72.0%
Aragatsotn 2 1.1%
Ararat 3 1.6%
Armavir 2 1.1%
Gegharkunik 3 1.6%
Lori 14 7.5%
Kotayk 11 5.9%
Shirak 12 6.5%
Syunik 4 2.2%
Tavush 1 0.5%
Total 186 100%
Source: Ameria Survey, 2017
According to the companies’ representatives these companies perform activities in Precision
engineering sector. The activities are classified according to the classification of economic
activities used in EU and Armenia (NACE rev.2). Particularly manufacturing activities in Precision
engineering are divided by Divisions (C.26-Manufacture of computer, electronic and optical
products, C.27-Manufacture of electrical equipment, C.28-Manufacture of machinery and
equipment n.e.c., C.29-Manufacture of motor vehicles, trailers and semi-trailers) and a group
(C.32.5-Manufacture of medical and dental instruments and supplies) while service activities in
Precision engineering include class M.71.12 (Engineering activities and related technical
consultancy) and division 72.1 (Research and experimental development on natural sciences and
engineering).

26
127 companies out of surveyed 186 (68.3%) perform activities in one of the activities of PE sector
only, 49 companies mentioned 2 activities and 10 companies- 3 activities. It should be mentioned
that activities were mentioned by companies and not necessarily they correspond to the activities
which are mentioned in the tax database for that companies.
Figure 1. Number of companies according to the types of activities (mentioned by
respondents)
Source: Ameria Survey, 2017
Around 3/4th of companies have individuals from Armenia as main shareholder, additionally 8.6%
are owned by private entrepreneurs. Only 6.4% of companies have foreign individuals or
companies as main shareholder.
0
10
20
30
40
50
60
70
80
90
100
C.26 C.27 C.28 C.29 C.32.5 M.71.12 M.72.1
Nu
mb
er
of
com
pa
nie
s
Activity 1 Activity 2 Activity 3

27
Figure 2. Distribution of PE companies by main shareholder
Source: Ameria Survey, 2017
Around 3/4th of CEOs are also the main shareholders of their companies. This is an evidence of
large presence of SMEs in the sector.
8.6%
74.7%
4.8%
4.3%
1.6% 4.8%1.1%
Private entrepreneur
Individual from Armenia
Foreign individual
Other Armenian company
Foreign company
RA government
Other

28
3. OVERVIEW OF ECONOMIC ACTIVITY IN THE SECTOR
3.1 Production volumes by subsector and company size
Official statistics estimates
The overall production volume of companies classified in types of activities which is defined to
describe manufacturing subsector of Precision Engineering in Armenia comprised 18.76 bln AMD
(or 35.1 mln EUR) in 2016. The volume of production in nominal terms increased significantly
compared to 2015 level: by 22.9% in AMD and by 22.6% in EUR equivalent. The growth in 2016
somehow compensates decline noticed in last 2-3 years in the sector: 2016 level compared to
2012 registered increase by 9.3% in AMD and 6.1% in EUR equivalent.
Table 4. Production volumes by PE sub-sectors 2012-2016 (mln AMD)
Source: NSS RA data
Average annual real growth of production of total PE sector for the period of 2013-2016 comprised
0.9%. 2 out of 4 sub-sectors of PE have recorded increase in average annual growth terms within
last 4 years, while the sub-sector “28. Manufacture of machinery and equipment n.e.c. (not
elsewhere classified)” is the only subsector to record decline in last 4 years. In other words,
Electronic and optical engineering is growing, Electrical equipment is stable, while mechanical
engineering has declined over the last 4 years.
6 This is the overall production volume of companies with economic activities under the defined types of activities,
which includes also types of products which could not necessarily be products of precision engineering. It is
impossible to distinguish pure precision engineering products on this level.
NACE r.2 Economic activity 2012 2013 2014 2015 2016
26 Manufacture of computer,
electronic and optical products 5 223 5 948 5 315 5 259 6 707
27 Manufacture of electrical
equipment 5 803 5 615 5 244 4 779 6 710
28 Manufacture of machinery and
equipment n.e.c. 4 780 4 015 3 348 3 547 3 719
32.5+32.9 Manufacture of medical and dental
instruments and supplies 1 265 1 407 1 385 1 590 1 516
Total, Precision Engineering
sector
17 071 16 985 15 292 15 175 18 651

29
Figure 3. Real average annual growth (decline) of PE subsectors for 2013-2016 and
2016/2015
Source: NSS RA data
Anyway, real volume of total production in PE sector increased by 28.3% in 2016 compared to
2015. This significant increase comes to compensate slow growth/decrease in previous 3 year
period, conditioned by uncertain macroeconomic developments in the country and the region.
Real growth in 2016 to 2015 comprised 28.3%, which is much higher than overall real growth in
the country.
Figure 4. Real annual growth in PE sector production 2010-2016 (% to previous year)
Source: NSS RA data
The growth/decline composition analysis of PE sector performance in last 6 years by subsectors
shows 3 different periods: 2010-2012 – 11.8% average growth, 2013-2015- decline by 6.9%
annually and 2016 – a year with unprecedented growth.
6.1%
-0.1%-7.3%
3.5% 0.9%
27.5%
56.0%
6.7%
-4.7%
28.3%
-20%
-10%
0%
10%
20%
30%
40%
50%
60%
26.. 27.. 28.. 32`.. PE, total
Av
era
ge
an
nu
al
gro
wth
Subsectors (NACE 2 digit codes)
2013-2016 average 2016/2015
10.815.2
9.4
-6.3-4.8
-9.5
28.3
-15.0
-10.0
-5.0
0.0
5.0
10.0
15.0
20.0
25.0
30.0
35.0
2010 2011 2012 2013 2014 2015 2016
An
nu
al
rea
l g
row
th t
o p
rev
iou
s
ye
ar,
%
30
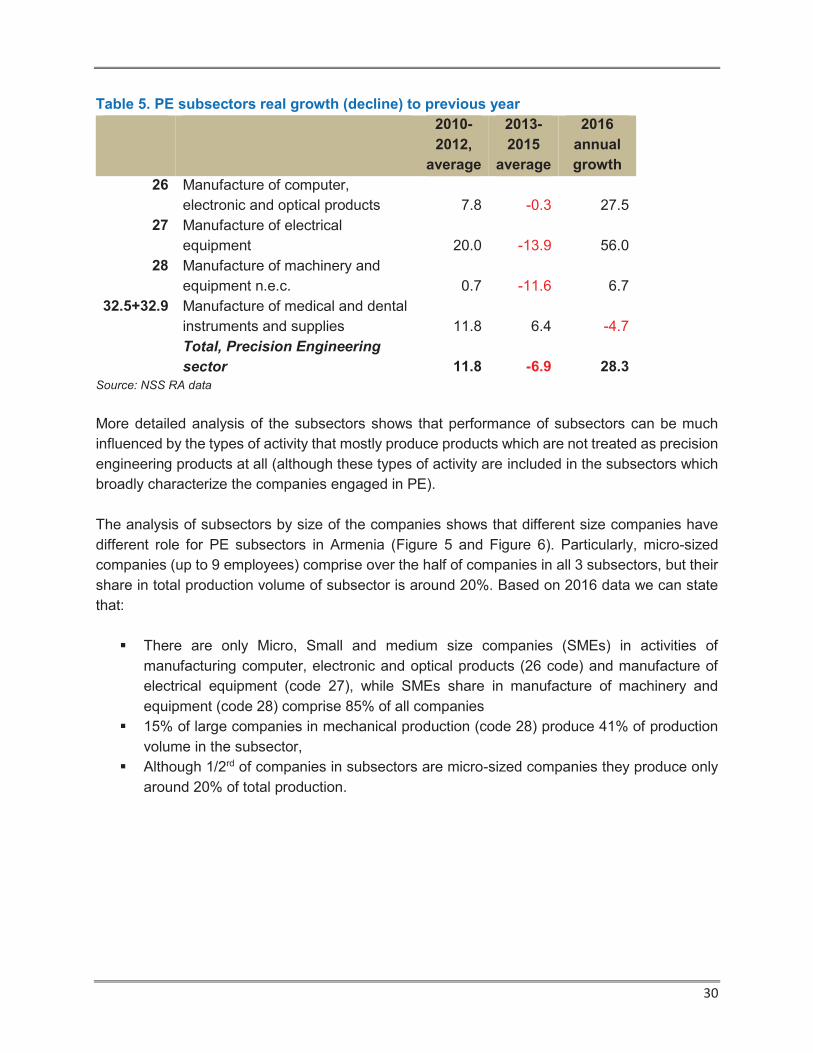
Table 5. PE subsectors real growth (decline) to previous year
2010-
2012,
average
2013-
2015
average
2016
annual
growth
26 Manufacture of computer,
electronic and optical products 7.8 -0.3 27.5
27 Manufacture of electrical
equipment 20.0 -13.9 56.0
28 Manufacture of machinery and
equipment n.e.c. 0.7 -11.6 6.7
32.5+32.9 Manufacture of medical and dental
instruments and supplies 11.8 6.4 -4.7
Total, Precision Engineering
sector 11.8 -6.9 28.3
Source: NSS RA data
More detailed analysis of the subsectors shows that performance of subsectors can be much
influenced by the types of activity that mostly produce products which are not treated as precision
engineering products at all (although these types of activity are included in the subsectors which
broadly characterize the companies engaged in PE).
The analysis of subsectors by size of the companies shows that different size companies have
different role for PE subsectors in Armenia (Figure 5 and Figure 6). Particularly, micro-sized
companies (up to 9 employees) comprise over the half of companies in all 3 subsectors, but their
share in total production volume of subsector is around 20%. Based on 2016 data we can state
that:
§ There are only Micro, Small and medium size companies (SMEs) in activities of
manufacturing computer, electronic and optical products (26 code) and manufacture of
electrical equipment (code 27), while SMEs share in manufacture of machinery and
equipment (code 28) comprise 85% of all companies
§ 15% of large companies in mechanical production (code 28) produce 41% of production
volume in the subsector,
§ Although 1/2rd of companies in subsectors are micro-sized companies they produce only
around 20% of total production.
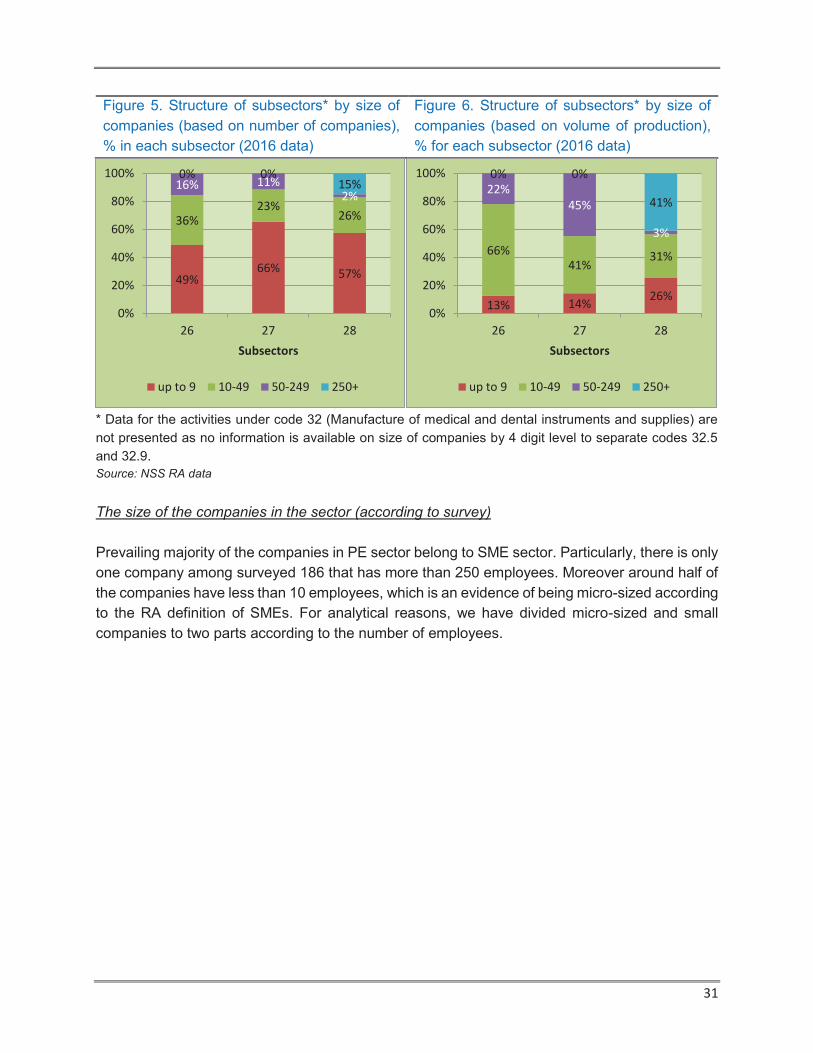
31
Figure 5. Structure of subsectors* by size of
companies (based on number of companies),
% in each subsector (2016 data)
Figure 6. Structure of subsectors* by size of
companies (based on volume of production),
% for each subsector (2016 data)
* Data for the activities under code 32 (Manufacture of medical and dental instruments and supplies) are
not presented as no information is available on size of companies by 4 digit level to separate codes 32.5
and 32.9.
Source: NSS RA data
The size of the companies in the sector (according to survey)
Prevailing majority of the companies in PE sector belong to SME sector. Particularly, there is only
one company among surveyed 186 that has more than 250 employees. Moreover around half of
the companies have less than 10 employees, which is an evidence of being micro-sized according
to the RA definition of SMEs. For analytical reasons, we have divided micro-sized and small
companies to two parts according to the number of employees.
49%66% 57%
36%23%
26%
16% 11%2%
0% 0%15%
0%
20%
40%
60%
80%
100%
26 27 28
Subsectors
up to 9 10-49 50-249 250+
13% 14%26%
66%41%
31%
22%
45%
3%
0% 0%
41%
0%
20%
40%
60%
80%
100%
26 27 28
Subsectors
up to 9 10-49 50-249 250+
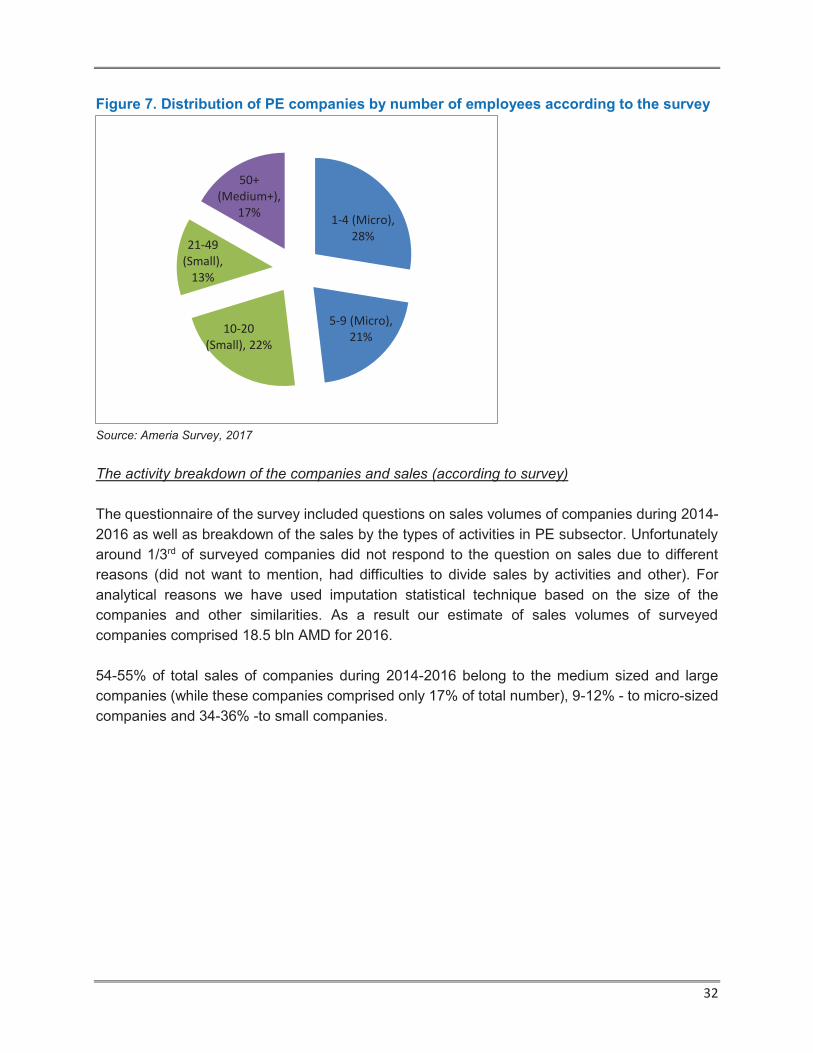
32
Figure 7. Distribution of PE companies by number of employees according to the survey
Source: Ameria Survey, 2017
The activity breakdown of the companies and sales (according to survey)
The questionnaire of the survey included questions on sales volumes of companies during 2014-
2016 as well as breakdown of the sales by the types of activities in PE subsector. Unfortunately
around 1/3rd of surveyed companies did not respond to the question on sales due to different
reasons (did not want to mention, had difficulties to divide sales by activities and other). For
analytical reasons we have used imputation statistical technique based on the size of the
companies and other similarities. As a result our estimate of sales volumes of surveyed
companies comprised 18.5 bln AMD for 2016.
54-55% of total sales of companies during 2014-2016 belong to the medium sized and large
companies (while these companies comprised only 17% of total number), 9-12% - to micro-sized
companies and 34-36% -to small companies.
1-4 (Micro),
28%
5-9 (Micro),
21%10-20
(Small), 22%
21-49
(Small),
13%
50+
(Medium+),
17%
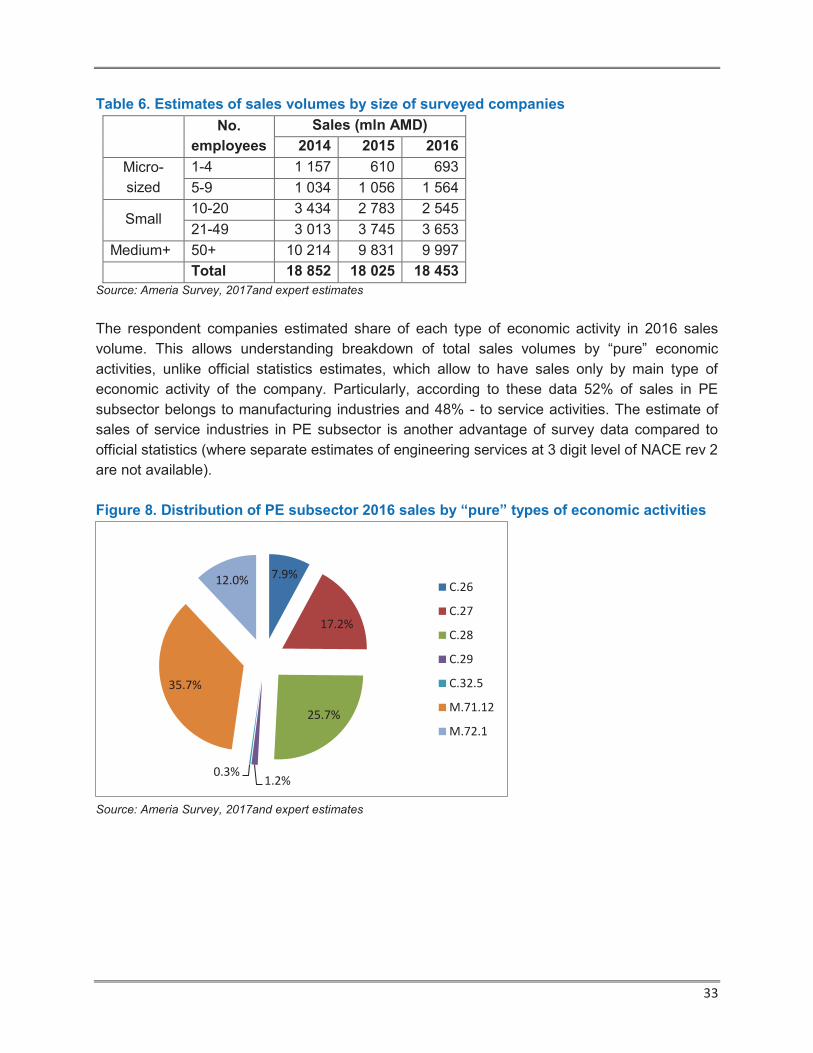
33
Table 6. Estimates of sales volumes by size of surveyed companies
No.
employees
Sales (mln AMD)
2014 2015 2016
Micro-
sized
1-4 1 157 610 693
5-9 1 034 1 056 1 564
Small 10-20 3 434 2 783 2 545
21-49 3 013 3 745 3 653
Medium+ 50+ 10 214 9 831 9 997
Total 18 852 18 025 18 453
Source: Ameria Survey, 2017and expert estimates
The respondent companies estimated share of each type of economic activity in 2016 sales
volume. This allows understanding breakdown of total sales volumes by “pure” economic
activities, unlike official statistics estimates, which allow to have sales only by main type of
economic activity of the company. Particularly, according to these data 52% of sales in PE
subsector belongs to manufacturing industries and 48% - to service activities. The estimate of
sales of service industries in PE subsector is another advantage of survey data compared to
official statistics (where separate estimates of engineering services at 3 digit level of NACE rev 2
are not available).
Figure 8. Distribution of PE subsector 2016 sales by “pure” types of economic activities
Source: Ameria Survey, 2017and expert estimates
7.9%
17.2%
25.7%
1.2%0.3%
35.7%
12.0%C.26
C.27
C.28
C.29
C.32.5
M.71.12
M.72.1

34
3.2 Sales by destination: domestic market vs external market
Official statistics estimates
The official statistics on the companies with activities under PE sector allows monitoring the
dynamics of direct sales to abroad (direct export of production by the companies). Particularly the
share of exports in total sales of PE sector comprised 21.8% in 2016. The share of exports in total
sales of the companies under the defined activities is declining during last 4 year period, which
may be an influence of uncertain macroeconomic environment in the region, but also speaks
about decreasing competitiveness of Armenian sector. Additionally, the share of exports into CIS
countries is almost stable (60-70% of total exports), which may mean that decrease of exports is
conditioned by decreasing competitiveness in both CIS and non-CIS countries.
Figure 9. Share of direct exports in sales of companies in PE sectors 2010-2013, %
Source: NSS RA
Data on share of exports by subsectors indicate that electrical, electronic and optical engineering
production is comparably more oriented on exports, but the share of exports in sales is decreasing
for all subsectors: «26. Manufacture of computer, electronic and optical products» - 38% of sales
is direct export and, while «27. Manufacture of electrical equipment» - only 14% and «28.
Manufacture of machinery and equipment n.e.c» only 16% goes to direct exports.
Overall trend over the 4 subsectors also shows that the share of CIS countries as export
destination is more or less stable (Figure 11), with the higher and growing importance of CIS
market for «27. Manufacture of electrical equipment» subsector exports.
34.0%
40.7% 39.8% 41.7%
35.0%
29.2%
21.8%
30%
40%
50%
60%
70%
80%
0%
10%
20%
30%
40%
50%
2010 2011 2012 2013 2014 2015 2016
Exports in sales, % CIS share is Exports, % (right axis)

35
Figure 10. Share of direct exports in sales
of PE subsectors 2010-2016, %
Figure 11. Share of CIS in total exports
by PE subsectors 2010-2016, %
Source: NSS RA
The structure of sales by markets and clients (according to the survey)
According to survey companies 2/3rd of sales in 2016 were realized in domestic market, with 1/3rd
of sales – directly exported. The share of direct exports in sales is comparably higher in medium
and large size companies – 42%. It is also interesting that share of export is higher (40%) in the
sales of the companies which indicated manufacture of machinery and equipment as their main
activity.
Figure 12. Distribution of PE subsector 2016 sales by domestic market and direct exports
Source: Ameria Survey, 2017
35%
56%52%
58%54%
46%
38%
47% 47% 48%42%
37%
22%
14%
23%
16%
24%29%
14%
22%
16%
0% 1% 2% 3% 5%9% 8%
2010 2011 2012 2013 2014 2015 2016
26 27 28 32.5+32.9
0%
20%
40%
60%
80%
100%
2010 2011 2012 2013 2014 2015 2016
26 27 28 32.5+32.9
72%
71%
77%
83%
58%
90%
64%
60%
82%
69%
70%
28%
29%
23%
17%
42%
10%
36%
40%
18%
31%
30%
0% 20% 40% 60% 80% 100%
1-4
5-9
10-20
21-49
50+
C.26
C.27
C.28
C.29+C.32.5
M.71.12
M.72.1
Siz
e b
y e
mp
loy
me
nt
Ma
in a
ctiv
ity
Sales in Domestic market Direct exports

36
The main buyers of products and services in domestic market are other companies, which may
use the products as for their internal needs but also may export it. So, the real share of export is
estimated to be higher than the indicator of direct export by producing companies.
The structure of buyers is quite similar for the industries: with other companies prevailing in
domestic market and external one.
Table 7. Distribution of PE subsector 2016 sales by purchasers in domestic market and
direct exports
Domestic market External market
Total
Individuals
Companie
s Gov RA Other Individuals
Companie
s
Manufacturing
industries 1.6% 59.5% 4.4% 0.0% 1.9% 32.6% 100%
Service
industries 2.3% 59.7% 6.5% 0.6% 0.2% 30.7% 100%
Total PE 1.9% 59.6% 5.4% 0.3% 1.1% 31.7% 100%
Source: Ameria Survey, 2017

37
3.3 Employment in the sector
Official statistics estimates
Overall employment in the 3 subsectors of precision engineering manufacturing sectors is
estimated at around 29507, with 1140 in electronic and optical engineering, 996- in electrical
engineering and 814 in mechanical engineering subsector (Figure 13). More than half (53%) of
employment in mechanical engineering subsector is provided by large size companies.
Figure 13. Number of employees* by subsectors of PE and size of companies, 2016
Source: NSS RA data
* The number of employees engaged in production activities only
No official statistics estimates on the number of employment in engineering service activities are
disseminated.
Employment estimates according to survey
Total employment of 185 surveyed companies8 as of December 2016 is estimated at 5,070
people, which is by 2.9% lower compared to the estimate as of end of December of 2015.
Manufacturing subsectors (C26-32.5) employment in 2016 comprised 2298 (45% of total PE
sector), while Service subsectors – 2772 (55%). It should be mentioned that larger size of
employment in service subsector can be explained by existence of large research institutes (also
financed by government).
7 Statistical data cover the number of employees engaged in production activities only, the overall employment in
companies can be higher 8 One company refused to mention number of employees.
72 135 100
465 268230
602
593
55
429
0
200
400
600
800
1000
1200
26 27 28
up to 9 10-49 50-249 250+

38
The following trends are noticeable when comparing the employment in 2016 to the employment
in 2015:
§ Decline in employment of micro-sized and small companies, increase in employment of
medium size companies,
§ Large decline in employment of the companies which have indicated Manufacture of
machinery and equipment as their main activity, while in most of other PE subsectors slow
growth of employment is visible.
Trends in employment during 2015-2016 show that small companies struggle more with the
development than comparably larger ones and Mechanical/Machinery precision engineering
subsector is declining in Armenia.
Figure 14. Overall size of employment by main activity and size of companies
Source: Ameria Survey, 2017
Share of women in the employment of the companies of PE sectors comprised 30% (both in 2015
and 2016). Women are more engaged in PE service industries (35% of employees are women)
than in PE manufacturing industries (25%).
-30%
-27%
-10%
-12%
+5%
+46%
-4%
-20%
0
0
+2%
+9%
0 500 1000 1500 2000 2500 3000 3500
1-4
5-9
10-20
21-49
50+
C.26
C.27
C.28
C.29
C.32.5
M.71.12
M.72.1
Siz
e b
y e
mp
loy
me
nt
Ma
in a
ctiv
ity
Number of employees2016.Dec 2015.Dec
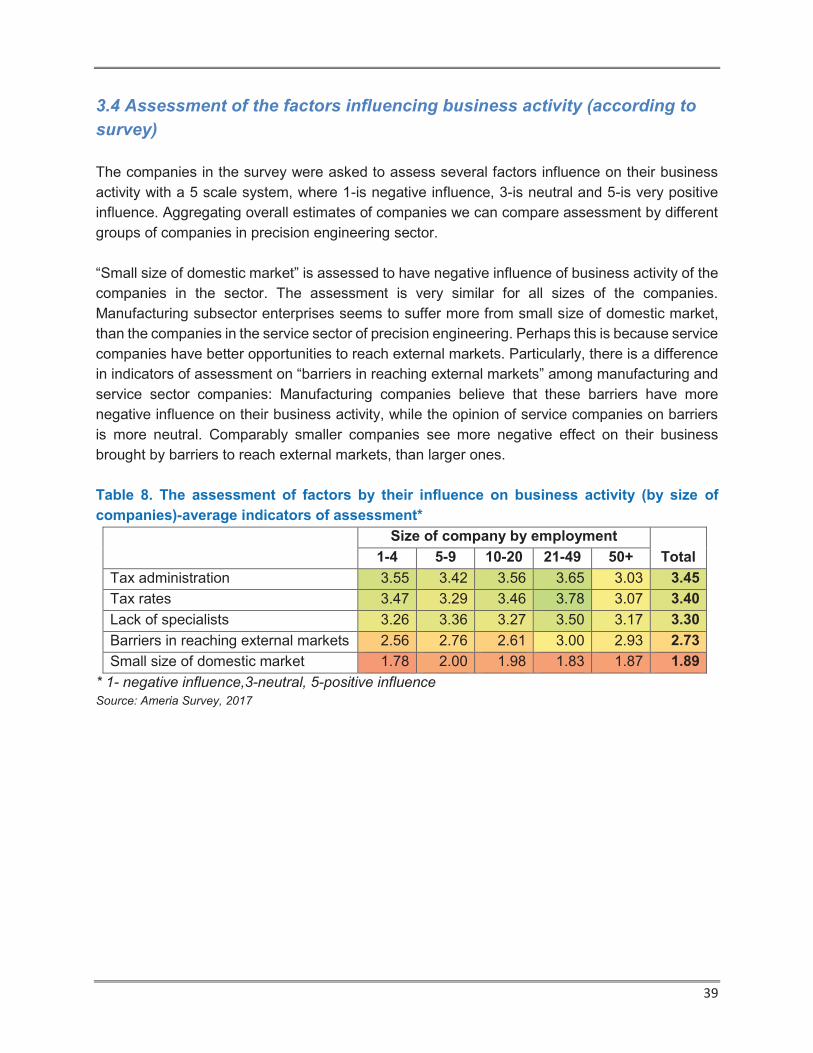
39
3.4 Assessment of the factors influencing business activity (according to
survey)
The companies in the survey were asked to assess several factors influence on their business
activity with a 5 scale system, where 1-is negative influence, 3-is neutral and 5-is very positive
influence. Aggregating overall estimates of companies we can compare assessment by different
groups of companies in precision engineering sector.
“Small size of domestic market” is assessed to have negative influence of business activity of the
companies in the sector. The assessment is very similar for all sizes of the companies.
Manufacturing subsector enterprises seems to suffer more from small size of domestic market,
than the companies in the service sector of precision engineering. Perhaps this is because service
companies have better opportunities to reach external markets. Particularly, there is a difference
in indicators of assessment on “barriers in reaching external markets” among manufacturing and
service sector companies: Manufacturing companies believe that these barriers have more
negative influence on their business activity, while the opinion of service companies on barriers
is more neutral. Comparably smaller companies see more negative effect on their business
brought by barriers to reach external markets, than larger ones.
Table 8. The assessment of factors by their influence on business activity (by size of
companies)-average indicators of assessment*
Size of company by employment
Total 1-4 5-9 10-20 21-49 50+
Tax administration 3.55 3.42 3.56 3.65 3.03 3.45
Tax rates 3.47 3.29 3.46 3.78 3.07 3.40
Lack of specialists 3.26 3.36 3.27 3.50 3.17 3.30
Barriers in reaching external markets 2.56 2.76 2.61 3.00 2.93 2.73
Small size of domestic market 1.78 2.00 1.98 1.83 1.87 1.89
* 1- negative influence,3-neutral, 5-positive influence
Source: Ameria Survey, 2017
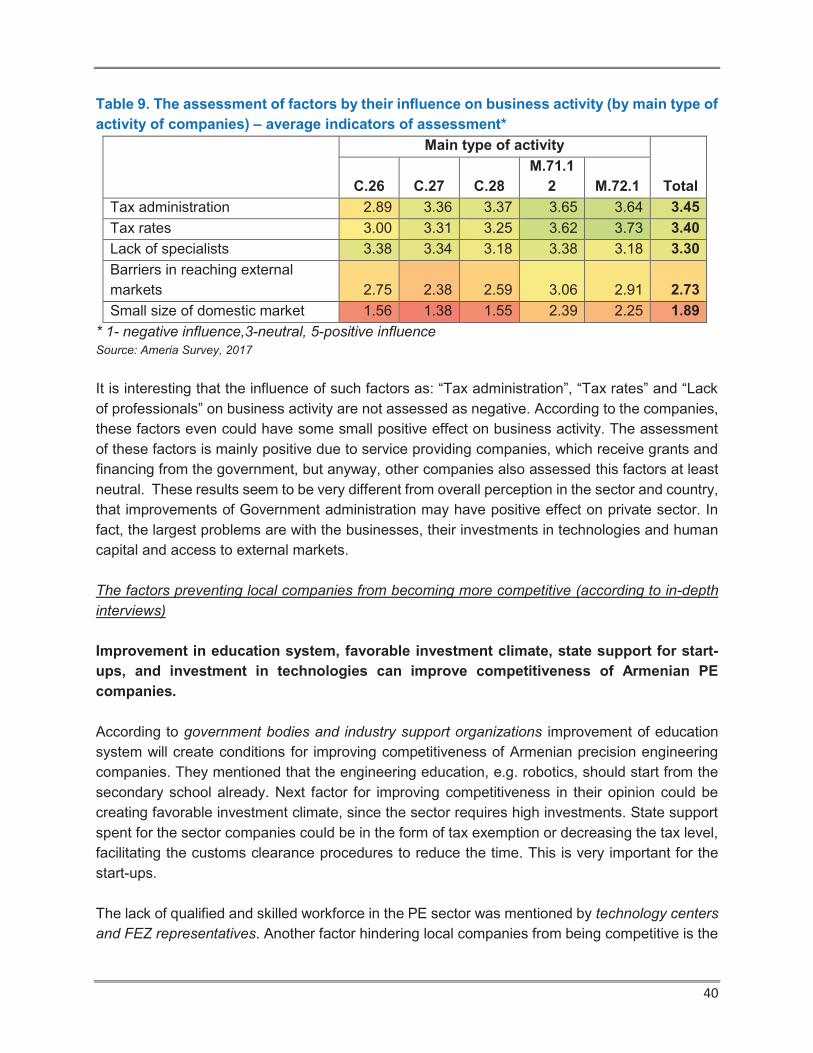
40
Table 9. The assessment of factors by their influence on business activity (by main type of
activity of companies) – average indicators of assessment*
Main type of activity
Total C.26 C.27 C.28
M.71.1
2 M.72.1
Tax administration 2.89 3.36 3.37 3.65 3.64 3.45
Tax rates 3.00 3.31 3.25 3.62 3.73 3.40
Lack of specialists 3.38 3.34 3.18 3.38 3.18 3.30
Barriers in reaching external
markets 2.75 2.38 2.59 3.06 2.91 2.73
Small size of domestic market 1.56 1.38 1.55 2.39 2.25 1.89
* 1- negative influence,3-neutral, 5-positive influence
Source: Ameria Survey, 2017
It is interesting that the influence of such factors as: “Tax administration”, “Tax rates” and “Lack
of professionals” on business activity are not assessed as negative. According to the companies,
these factors even could have some small positive effect on business activity. The assessment
of these factors is mainly positive due to service providing companies, which receive grants and
financing from the government, but anyway, other companies also assessed this factors at least
neutral. These results seem to be very different from overall perception in the sector and country,
that improvements of Government administration may have positive effect on private sector. In
fact, the largest problems are with the businesses, their investments in technologies and human
capital and access to external markets.
The factors preventing local companies from becoming more competitive (according to in-depth
interviews)
Improvement in education system, favorable investment climate, state support for start-
ups, and investment in technologies can improve competitiveness of Armenian PE
companies.
According to government bodies and industry support organizations improvement of education
system will create conditions for improving competitiveness of Armenian precision engineering
companies. They mentioned that the engineering education, e.g. robotics, should start from the
secondary school already. Next factor for improving competitiveness in their opinion could be
creating favorable investment climate, since the sector requires high investments. State support
spent for the sector companies could be in the form of tax exemption or decreasing the tax level,
facilitating the customs clearance procedures to reduce the time. This is very important for the
start-ups.
The lack of qualified and skilled workforce in the PE sector was mentioned by technology centers
and FEZ representatives. Another factor hindering local companies from being competitive is the

41
lack of resources both financial and in terms of modern equipment and technology. The
equipment that is being used by Armenian companies are mostly from Soviet times and cannot
provide the speed and quality that is needed to be competitive. Other factors include the lack of
good transportation links with other countries. It takes months while an equipment that is being
delivered from abroad to arrive to Armenia which hinders the speed of production. The need for
international investment is also highlighted as a necessity for local companies to develop
resources and become competitive. International investors see Armenia as a risky country
because of the geopolitical situation in the region. The state has a big part to play in this regards
as it can create platforms for international investors, so they can visit the country and see the
potential for investment in PE sector in Armenia.
As the main factors preventing the local producers from becoming more competitive, more than
40% of research institutions’ representatives pointed out the technological base; about 30%
stressed the limited market/unfavorable geographical location as well as high custom duties.
Separate respondents also stated the transportation problem, financial means’ shortage, tax
policy, expertise, etc. Some respondents also mentioned steps that will help the sector to become
more competitive, i.e. circa 30% pointed out the importance of local brand establishment in
engineering, cooperation between companies and engineering centers / universities (the
Germany’s expertise), etc.
According to respondents from research institutions there are two main obstacles for local
companies to become more competitive. Those are lack of investments and low quality of
education which later on develops into lack of specialists. Other obstacles which received
attention are no centralized policy for PE industry development, brain drain, lack of modern
technologies, production of middle stage products and lack of high quality information.

42
3.5 Expectations for PE sector development in 2017-2019 (according to
survey)
Majority of the PE subsector companies is expecting moderate growth of the subsector in Armenia
during the next 3 year period -2017-2019. Only 6% of the company representatives are expecting
decline in the subsector for the next 3 year period.
Figure 15. Expectations on subsector developments in 2017-2019
Source: Ameria Survey, 2017
To compare expectations of the companies by size of company and by main type of activity we
have recalculated the answers on expectations using 1-5 scale where 1 is significant decline and
5 –significant growth expectations. According to the results the companies with main type of
activity of manufacturing electrical equipment have highest expectation for growth, while the
companies in manufacture of machinery and equipment (C.28) and in Research and experimental
development on natural sciences and engineering (M.72.1) have the lowest expectations for
growth of the sector. Another conclusion is that expectations of medium and large companies in
the subsector are higher than those of micro and small companies.
Significant
decline, 1%
Moderate
decline, 5%
No change,
24%
Moderate
growth, 53%
Significant
growth, 17%

43
Figure 16. Expectations on subsector developments in 2017-2019 by company size and
main economic activity
Source: Ameria Survey, 2017
3.00 3.20 3.40 3.60 3.80 4.00 4.20
1-4
5-9
10-20
21-49
50+
C.26
C.27
C.28
M.71.12
M.72.1
Siz
e b
y e
mp
loy
me
nt
Ma
in a
ctiv
ity

44
4. EXTERNAL ECONOMIC ACTIVITY
Official statistics estimates: Exports on product level
According defined 4 manufacturing subsectors for PE, corresponding9 HS code (4-digit level) 175
product lines were examined to understand dynamics of exports on a product level.
These are:
§ 81 lines (5 lines are excluded10) from 84.XX,
§ 46 lines (all) from 85.XX,
§ 32 lines (all) from 90.XX,
§ 14 lines (all) from 91.XX and,
§ lines 8805 and 9402.
Overall export volume of defined product lines from Armenia comprised 54 mln USD in 2016,
while the peak of export in post-crisis period was in 2012 – 60.8 mln USD.
Figure 17. Volume of exports and growth (decline) in 1995-2016
Source: NSS RA, foreign trade statistics
9 Correspondence between the types of activities (defined by NACE rev.2) and HS classification is established to
define groups of products manufactured under the activities defined as PE. Correspondence is based on
correlation tables between two classifications provided on UNSTAT website. 10 HS codes 8402, 8403, 8404, 8409, 8480 refer to production of other types of activities – not included in PE
sectors according our definition.
42
.0
36
.4
36
.1 44
.0
18
.8
32
.7 36
.3 39
.9
50
.8
28
.1 32
.0
42
.9
70
.1
57
.3
28
.3
37
.3
48
.1
60
.8
41
.9 48
.4
41
.2
54
.0
-13%
22%
-57%
74%
10%
27%
-45%
14%34%
64%
-18%-51%
32% 29% 26%
-31%
16%-15%
31%
-400%
-300%
-200%
-100%
0%
100%
0
20
40
60
80
100
19
95
19
96
19
97
19
98
19
99
20
00
20
01
20
02
20
03
20
04
20
05
20
06
20
07
20
08
20
09
20
10
20
11
20
12
20
13
20
14
20
15
20
16
Gro
wth
(d
ecl
ine
) to
pre
vio
us
ye
ar,
%
Vo
lum
e o
f e
xpo
rt,
mln
$
Export volume, mln USD Export growth (decline), to previous year, % (right axis)

45
Foreign trade statistics data show the export volume from Armenia is much higher than the level
of production (especially for Y2012), which can be explained by the following:
§ According to International recommendations for Industrial statistics, the data on the total
volume of industrial output (work, services) produced by organizations do not include
internal turnover, the value-added tax and excise tax,
§ Foreign trade statistics captures all the products crossing the border, regardless of their
production origin and period of production,
§ Possible coverage issue of production by statistical monitoring
§ Re-export issues, etc.
The largest group of products by export volume in 2013 was «91. Clock and Watches», while in
previous 3 years the leading group in export volume was the main production of mechanical
engineering – «84». So overall trend noticed in post crisis period (2010-2016) is:
§ Export of clock and watches is growing with high rate,
§ Export of optical, controlling and measuring instruments group is growing moderately,
§ Export of product of mechanical production (84 code) was growing with high rate until
sharp decline in 2013 and moderate decrease thereafter,
§ Export of electrical production (85 code) was growing moderately until sharp decline in
2013-2015, while 2016 again showed growth.
Sharp decline in the volumes of export in the production of mechanical and electrical engineering
in 2013-2015 by small size of Armenian economy, the absence of permanent markets for exports,
macroeconomic uncertainty and decreasing competitiveness. Particularly in 2012 the growth over
2011 was registered due to one-off export of some products to Singapore, and absence of this
export to Singapore brought to visible decline in export volumes of 2013 and next years.
Evidenced growth in 2016, perhaps is also conditioned by Armenia’s membership in EAEU market
from 2015 and slow recovery of the Russian economy.
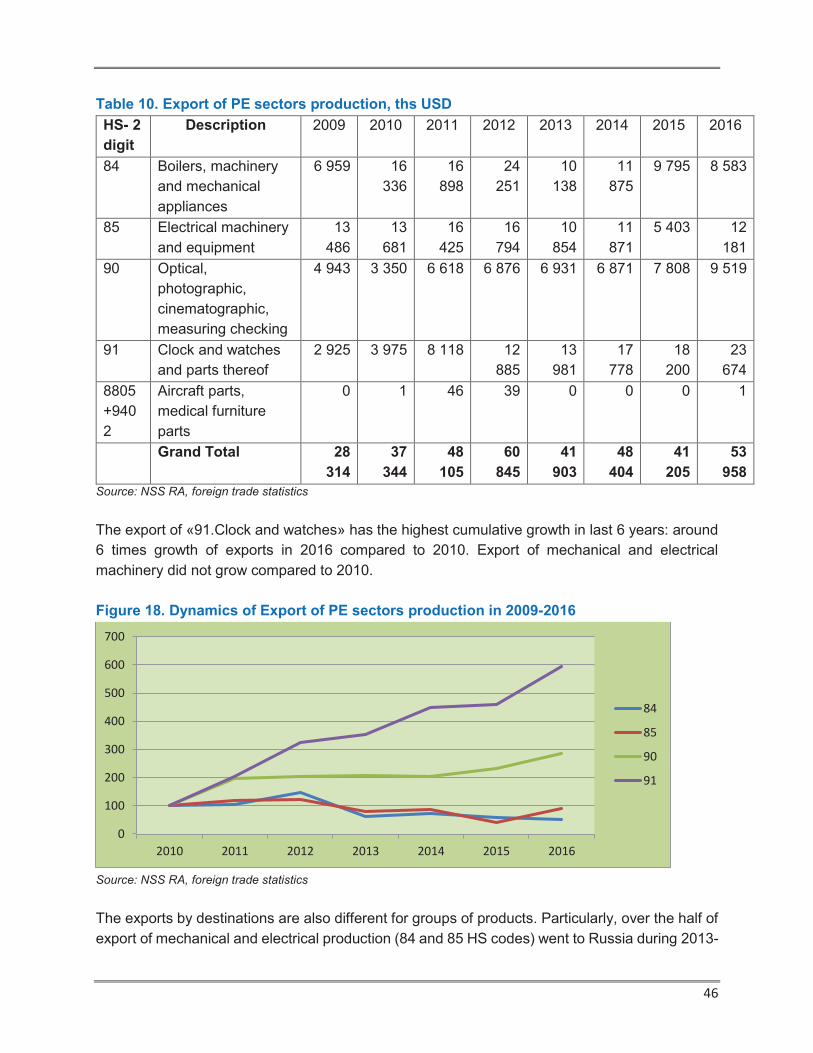
46
Table 10. Export of PE sectors production, ths USD
HS- 2
digit
Description 2009 2010 2011 2012 2013 2014 2015 2016
84 Boilers, machinery
and mechanical
appliances
6 959 16
336
16
898
24
251
10
138
11
875
9 795 8 583
85 Electrical machinery
and equipment
13
486
13
681
16
425
16
794
10
854
11
871
5 403 12
181
90 Optical,
photographic,
cinematographic,
measuring checking
4 943 3 350 6 618 6 876 6 931 6 871 7 808 9 519
91 Clock and watches
and parts thereof
2 925 3 975 8 118 12
885
13
981
17
778
18
200
23
674
8805
+940
2
Aircraft parts,
medical furniture
parts
0 1 46 39 0 0 0 1
Grand Total 28
314
37
344
48
105
60
845
41
903
48
404
41
205
53
958
Source: NSS RA, foreign trade statistics
The export of «91.Clock and watches» has the highest cumulative growth in last 6 years: around
6 times growth of exports in 2016 compared to 2010. Export of mechanical and electrical
machinery did not grow compared to 2010.
Figure 18. Dynamics of Export of PE sectors production in 2009-2016
Source: NSS RA, foreign trade statistics
The exports by destinations are also different for groups of products. Particularly, over the half of
export of mechanical and electrical production (84 and 85 HS codes) went to Russia during 2013-
0
100
200
300
400
500
600
700
2010 2011 2012 2013 2014 2015 2016
84
85
90
91

47
201511. Clock and watches products predominantly are exported to Switzerland, while optical and
measuring products (90 HS code) have comparably less concentrated by countries (Figure 19).
Figure 19. Structure of Export by PE products for 2013-2015
Source: NSS RA, foreign trade statistics
The largest cumulative export volume during last 4 years is registered for the product lines «9111.
Watch cases and parts thereof» - 44.4 mln USD.
Table 11. Top export products from Armenia (2013-2016) - Cumulative volumes by HS 4
digit product lines
Cumulative exports in last 4 years (2013-2016)
HS-
4 Description
ths
USD
9111 Watch cases and parts thereof 44 404
8414 Air, vacuum pumps, compressors, ventilating fans, etc 11 266
9102 Watches with case of, or clad with, of base metal 11 042
8536 Electrical switches, connectors, etc, for <1kV 8 119
9101 Watches with case of, or clad with, precious metal 7 446
9114 Other clock or watch parts 6 644
8517 Electric apparatus for line telephony, telegraphy 6 488
8468 Equipment for soldering, brazing or welding 5 276
9032 Automatic regulating or controlling equipment 5 239
9113 Watch straps, bands, bracelets, and parts thereof 4 064
9018 Instruments etc for medical, surgical, dental, etc use 3 574
Source: NSS RA, foreign trade statistics
11 Data on export for 2016 by country destinations is not yet available.
54%
52%
30%
70%
6%
7%
11%
9%
4%
11%
4%
10%
7%
6%
5% 13%
23%
16%
36%
12%
0% 20% 40% 60% 80% 100%
HS 84
HS 85
HS 90
HS 91 Russia
Switzerland
USA
Georgia
Singapore
Iran
Netherlands
Germany
Others
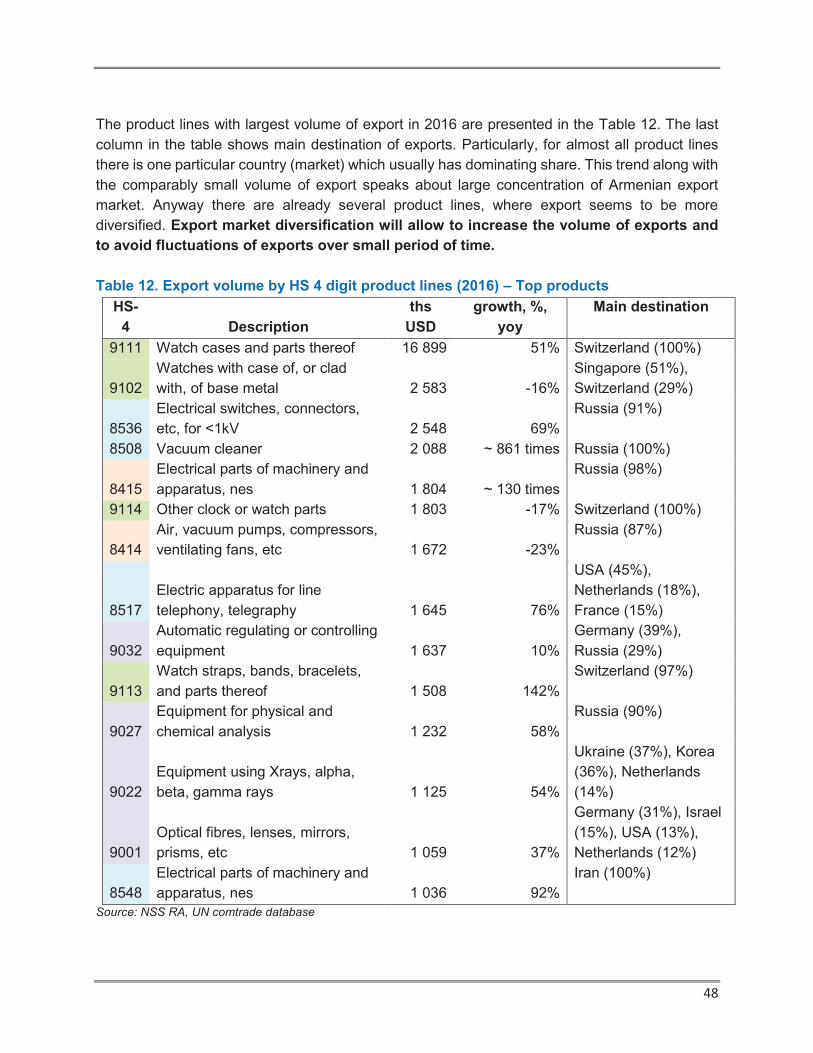
48
The product lines with largest volume of export in 2016 are presented in the Table 12. The last
column in the table shows main destination of exports. Particularly, for almost all product lines
there is one particular country (market) which usually has dominating share. This trend along with
the comparably small volume of export speaks about large concentration of Armenian export
market. Anyway there are already several product lines, where export seems to be more
diversified. Export market diversification will allow to increase the volume of exports and
to avoid fluctuations of exports over small period of time.
Table 12. Export volume by HS 4 digit product lines (2016) – Top products
HS-
4 Description
ths
USD
growth, %,
yoy
Main destination
9111 Watch cases and parts thereof 16 899 51% Switzerland (100%)
9102
Watches with case of, or clad
with, of base metal 2 583 -16%
Singapore (51%),
Switzerland (29%)
8536
Electrical switches, connectors,
etc, for <1kV 2 548 69%
Russia (91%)
8508 Vacuum cleaner 2 088 ~ 861 times Russia (100%)
8415
Electrical parts of machinery and
apparatus, nes 1 804 ~ 130 times
Russia (98%)
9114 Other clock or watch parts 1 803 -17% Switzerland (100%)
8414
Air, vacuum pumps, compressors,
ventilating fans, etc 1 672 -23%
Russia (87%)
8517
Electric apparatus for line
telephony, telegraphy 1 645 76%
USA (45%),
Netherlands (18%),
France (15%)
9032
Automatic regulating or controlling
equipment 1 637 10%
Germany (39%),
Russia (29%)
9113
Watch straps, bands, bracelets,
and parts thereof 1 508 142%
Switzerland (97%)
9027
Equipment for physical and
chemical analysis 1 232 58%
Russia (90%)
9022
Equipment using Xrays, alpha,
beta, gamma rays 1 125 54%
Ukraine (37%), Korea
(36%), Netherlands
(14%)
9001
Optical fibres, lenses, mirrors,
prisms, etc 1 059 37%
Germany (31%), Israel
(15%), USA (13%),
Netherlands (12%)
8548
Electrical parts of machinery and
apparatus, nes 1 036 92%
Iran (100%)
Source: NSS RA, UN comtrade database
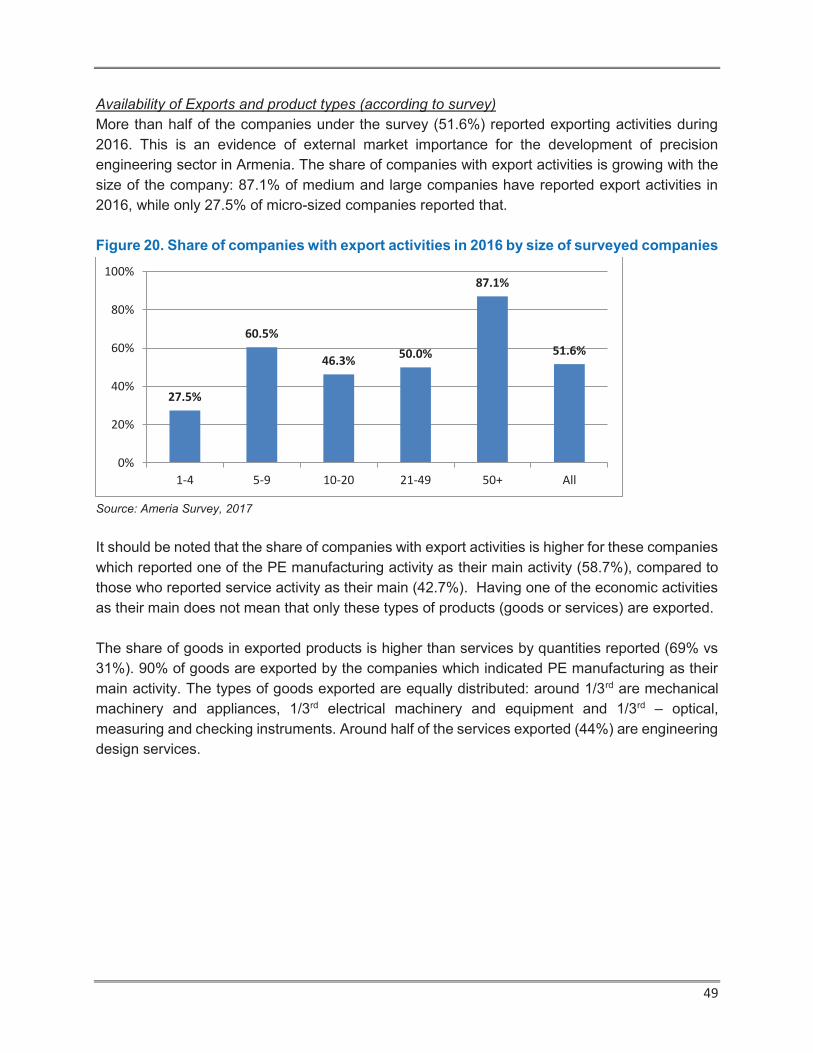
49
Availability of Exports and product types (according to survey)
More than half of the companies under the survey (51.6%) reported exporting activities during
2016. This is an evidence of external market importance for the development of precision
engineering sector in Armenia. The share of companies with export activities is growing with the
size of the company: 87.1% of medium and large companies have reported export activities in
2016, while only 27.5% of micro-sized companies reported that.
Figure 20. Share of companies with export activities in 2016 by size of surveyed companies
Source: Ameria Survey, 2017
It should be noted that the share of companies with export activities is higher for these companies
which reported one of the PE manufacturing activity as their main activity (58.7%), compared to
those who reported service activity as their main (42.7%). Having one of the economic activities
as their main does not mean that only these types of products (goods or services) are exported.
The share of goods in exported products is higher than services by quantities reported (69% vs
31%). 90% of goods are exported by the companies which indicated PE manufacturing as their
main activity. The types of goods exported are equally distributed: around 1/3rd are mechanical
machinery and appliances, 1/3rd electrical machinery and equipment and 1/3rd – optical,
measuring and checking instruments. Around half of the services exported (44%) are engineering
design services.
27.5%
60.5%
46.3%50.0%
87.1%
51.6%
0%
20%
40%
60%
80%
100%
1-4 5-9 10-20 21-49 50+ All

50
Table 13. The structure of exported PE products according to survey companies (by
number of mentioned units)
Companies with
PE
manufacturing
as main activity
Companies with
PE services as
main activity
Total
Goods-total 90% 24% 69%
Machinery and mechanical
appliances 32% 0% 22%
Electrical machinery and equipment 28% 8% 22%
Optical, measuring, checking
products 25% 14% 21%
Other goods 5% 3% 4%
Services-total 10% 76% 31%
engineering design 2% 38% 14%
software, hardware related 4% 11% 6%
testing, measuring 1% 14% 5%
scientific related 0% 8% 3%
other services 2% 5% 3%
Total 100% 100% 100%
Source: Ameria Survey, 2017
The share of goods in exported products is much higher than services by trade volume estimates
(83% vs 17%).

51
Figure 21. The structure of exported PE products according to survey companies (by
estimated trade volume indicators)
Source: Ameria Survey, 2017
30%
21%
29%
3%
8%
3%
3%
2% 1%
Machinery and mechanical appliances
Electrical machinery and equipment
Optical, measuring, checking products
Other goods
Services-engineering design
Services-software, hardware related
Services-testing, measuring
Services-scientific related
Services- other

52
Exports by country (according to survey)
According to the survey results, taking into account reported sales volumes of surveyed
companies and the share of sales in external markets by countries, Russia has predominant share
in exports (over 37%). Switzerland has comparably less share in survey due to unreported sales
volumes of clock, watch production.
Table 14. The structure of exported PE products by countries (survey company estimates)
Share in
exports, %
1 Russia 37%
2 USA 22%
3 Georgia 8%
4 Kazakhstan 6%
5 Iran 5%
6 EU countries 5%
7 UAE 4%
8 Israel 3%
9 Kyrgyzstan 2%
10 Other CIS countries 4%
Other 4%
* Switzerland is missing from the table due to unreported sales data on watches, clocks (there
are differences in customs reports and company reports – perhaps company reports indicated
final destination, while customs reports shows actual destination of export from Armenia, without
going into details of further movement of goods)
Source: Ameria Survey, 2017
Export logistics (according to survey)
Prevailing majority of companies organize their export through own resources without using any
domestic or foreign distributor – 87% of total export of companies in the survey was done by own
resources.
It is interesting that using own resources is higher for micro-sized companies (1-4 employees) –
91% of total export, and for comparably larger companies (21+ employees). This may mean that
micro companies relay on their own resources due to lower export volumes, then with growing
volumes the companies (5-20 employees) use services of distributors, while larger companies
(21+) have the opportunity to hire sales personnel and decide to organize sales again by their
own resources.

53
Figure 22. Export logistics structure of PE survey companies by size and main type of
activity (weighted by export volume indicators)
Source: Ameria Survey, 2017
Anyway, low rate of use of distributing services for the PE companies may be one of the reasons
of low export volumes as companies do not use professional sales services due to different
reasons.
Use of Imported products in 2016 (according to survey)
According to the survey results, 56% of companies imported products for their internal use, such
as fixed assets and/or raw materials. Around 1/3rd of companies in precision engineering
subsector imported fixed assets during 2016 and about 42% imported raw materials.
The companies which indicated manufacturing activities are more active in importing fixed assets
and raw materials that those which are engaged in service activities of precision engineering
subsector. Among companies which are engaged in manufacturing “Manufacture of computer,
electronic and optical products” (C.26) subsector is more active, which may speak about higher
potential of this subsector compared to “Machinery and equipment” (C.28) and “Electrical
equipment” (C.27) subsectors. It is also logical that larger companies are more engaged in import
activities than smaller ones.
91%
78%
83%
94%
88%
98%
71%
85%
95%
100%
3%
6%
8%
7%
6%
22%
15%
6%
6%
2%
20%
8%
5%
0%
0% 20% 40% 60% 80% 100%
1-4
5-9
10-20
21-49
50+
C.26
C.27
C.28
M.71.12
M.72.1
Siz
e b
y e
mp
loy
me
nt
Ma
in a
ctiv
ity
Own resources through domestic distributor through foreign distributor other means

54
Figure 23. Share of companies which imported fixed assets in 2016 by size and main type
of activity
Source: Ameria Survey, 2017
Regarding to the import of raw materials, the need for raw materials is much higher in
manufacturing compared to services, so data show this trend. Again larger companies have more
opportunities for import of raw materials than smaller ones.
Figure 24. Share of companies which imported raw materials in 2016 by size and main type
of activity
Source: Ameria Survey, 2017
0% 10% 20% 30% 40% 50% 60%
1-4
5-9
10-20
21-49
50+
C.26
C.27
C.28
M.71.12
M.72.1
Siz
e b
y e
mp
loy
me
nt
Ma
in a
ctiv
ity
0% 10% 20% 30% 40% 50% 60% 70% 80%
1-4
5-9
10-20
21-49
50+
C.26
C.27
C.28
M.71.12
M.72.1
Siz
e b
y e
mp
loy
me
nt
Ma
in a
ctiv
ity

55
Main prerequisites for export and its growth
According to the companies, availability of foreign partners is the most important prerequisite for
export growth. Other two most important prerequisites are participation in international exhibitions
and product compliance with international standards.
Figure 25. The main prerequisites for export growth according to the companies in
precision engineering
Source: Ameria Survey, 2017
The importance of export opportunities for sector development
According to governmental bodies and industry support organizations representatives, creating
export opportunities have vital importance for the precision engineering sector development in
the country. Local market is very small and purchasing capacity of the population is limited; hence,
all companies of the sector put efforts to identify export markets for their products. The
respondents mentioned some export promotion instruments currently available for sector
companies: assistance in product registration on foreign markets, co-financing for laboratory
testing, interest rate subsidies, 50% co-financing for participation at exhibition on key markets,
etc. At the same time, creating simplified tax and customs procedures for the companies operating
in the sector is very important to allow them to concentrate more on the research of new products
and production. Assistance in establishing necessary relations with companies in foreign markets
is also important. Additionally, improvements in all aspects of FEZ operations (procedures,
management, restrictions on the size of area per company, etc.) could be another export
promotion instrument, which will allow easing the Eurasian Economic Union imposed customs
procedures.
29%
19%
13%
10%
10%
8%
7%
3% 1% Availability of foreign partners
Participation in international exhibitions
Product compliance with international standards
State assistance for export
Membership in international professional unions
Marketing, advertisement
Closer cooperation withing engineering society
Operation of FEZs
Other

56
According to Technology centers and FEZ operator representatives, the export of PE products is
considered as a vital factor for the growth of this sector in Armenia as the local market is very
small. Hence the main focus of companies operating in this sector must be the export of
specialized equipment to other countries. In order to support the export Technoparks and FEZ
stated certain factors which must be considered by state. Namely, as it does for IT sector, the
state can introduce special tax policies for exporting companies, which it actually does to certain
extent; provide financial support to companies that are exporting their production. In addition,
having representatives or production sites in foreign markets can be useful as the cost of
transportation from Armenia to other countries and markets ultimately have negative impact on
the unit cost hence the competitiveness of local products in foreign markets in terms of price.
Almost all the representatives of research institutions were unanimous on export importance,
pointing out that the export is a priority for the sector development in RA, for most reasoning the
limited local market. Yet, they were quite dissenting on the prerequisites / privileges necessary to
boost it: one of the respondents spoke about tax privileges, customs’ simplification, another one
mentioned the need for lower transportation cost, border opening, there is also an opinion that
giving privileges is a primitive step, mentioning that the foreign market representatives will find
the means to export our product if it is of their interest. Albeit, more than 50% of respondents
agreed on what we should export to get the interest of foreign market - an unprecedented product,
interesting, attractive and original; some at the same time also stressed the importance of low
cost.
Regarding the means for increasing Armenian exports respondents from educational institutions
had different viewpoints. Availability of high quality products for export is a need; moreover such
products should be easy for transportation to resolve transportation costs issue. Other means
mentioned by respondents include producing of non-energy sector products, advertising domestic
products and organizing expos.

57
5. ACCESS TO HUMAN CAPITAL AND HR MANAGEMENT
PRACTICE
When speaking with the representatives of precision engineering sector, availability of relevant
specialists in the sector is mentioned as one of the main issues in the sector. This part of the
report summarizes survey data related to HR resources and management issues.
Issues with finding a specialist
According to the survey results, around 32% of companies in precision engineering subsector
have practice, when they could not find a specific specialist as needed. It is interesting that this
issue is common for all size companies: micro, small and medium, which may mean that really
these specialists are very few. Moreover the issues with finding a specialist are very similar also
for Yerevan and marz situated companies, which show that it is not a regional peculiarity.
Figure 26. Share of companies which suffered with finding needed specialists
Source: Ameria Survey, 2017
It is also interesting, that companies with activity of “Manufacture of computer, electronic and
optical products” have fewer problems with finding a specialist than those engaged in electrical
or mechanical machinery and equipment production activities. This peculiarity can be explained
by higher development of IT sector in Armenia in recent years which brings to increase of
professionals in this subsector. Another reason could be the difference of wages or potential
wages, in IT and mechanical production subsectors in Armenia.
0% 10% 20% 30% 40% 50% 60%
1-4
5-9
10-20
21-49
50+
C.26
C.27
C.28
M.71.12
M.72.1
Siz
e b
y e
mp
loy
me
nt
Ma
in a
ctiv
ity
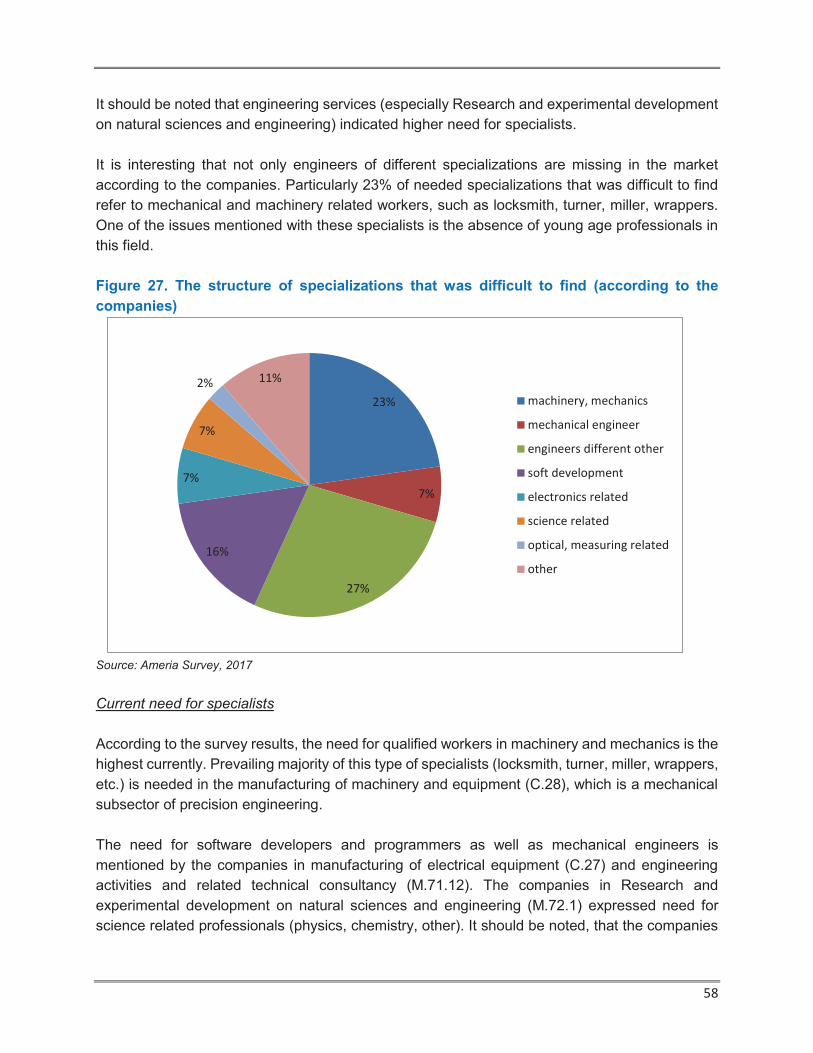
58
It should be noted that engineering services (especially Research and experimental development
on natural sciences and engineering) indicated higher need for specialists.
It is interesting that not only engineers of different specializations are missing in the market
according to the companies. Particularly 23% of needed specializations that was difficult to find
refer to mechanical and machinery related workers, such as locksmith, turner, miller, wrappers.
One of the issues mentioned with these specialists is the absence of young age professionals in
this field.
Figure 27. The structure of specializations that was difficult to find (according to the
companies)
Source: Ameria Survey, 2017
Current need for specialists
According to the survey results, the need for qualified workers in machinery and mechanics is the
highest currently. Prevailing majority of this type of specialists (locksmith, turner, miller, wrappers,
etc.) is needed in the manufacturing of machinery and equipment (C.28), which is a mechanical
subsector of precision engineering.
The need for software developers and programmers as well as mechanical engineers is
mentioned by the companies in manufacturing of electrical equipment (C.27) and engineering
activities and related technical consultancy (M.71.12). The companies in Research and
experimental development on natural sciences and engineering (M.72.1) expressed need for
science related professionals (physics, chemistry, other). It should be noted, that the companies
23%
7%
27%
16%
7%
7%
2% 11%
machinery, mechanics
mechanical engineer
engineers different other
soft development
electronics related
science related
optical, measuring related
other

59
in manufacturing of computer, electronic and optical production did not issues with finding staff,
which is perhaps an influence of well-developed IT sector in Armenia.
Table 15. Need for specialists mentioned in the survey by main type of activity (according
to the companies)
Main type of activity of company
Manufacturing Services
Professionals/specialists C.26 C.27 C.28
C.32.5,
other
M.71.1
2 M.72.1
Tota
l
machinery, mechanics
(locksmith, turner, miller,
wrappers, etc) - 4 19 1 3 - 27
soft development,
programmers - 12 - 1 7 1 21
mechanical engineers - 9 2 1 5 - 17
engineers different other
(energy sector, water sector,
constructor, etc.) - 1 4 - 7 2 14
science related (physics,
chemistry, other) - 1 1 - 3 5 10
electronics related 1 4 1 - 2 - 8
optical related 1 - - - - - 1
others - 1 2 - - 1 4
Source: Ameria Survey, 2017
HR operations in last year
The companies were asked about staff trainings and staff recruitment related HR operations in
2016. Particularly, 53% of the companies in the survey had used services of professional
centers/persons for staff training in Armenia, 20% - use trainings organized by foreign
professional centers/persons. There is a clear trend: the larger the size of the company, the higher
the opportunity for staff trainings.
Regarding staff recruitment issues, only 11% of all companies have used announcements on
specialized staff recruitment websites (such as careercenter.am, jobfinder.am, hr.am and others)
and only 9% of all companies have applied to labor agencies to recruit staff.

60
Table 16. Share of companies with specific HR operation in 2016 (by size of the companies)
Total
Size of company (employees)
1-4 5-9 10-20 21-49 50+
staff training in Armenia with
professional centers/persons 53% 42% 53% 41% 74% 73%
staff training abroad with
professional centers/persons 20% 4% 29% 8% 43% 38%
applied to labor agencies for staff
recruitment issues 9% 2% 15% 10% 9% 12%
placed paid announcements on
specialized staff recruiting
websites
11% 4% 18% 10% 4% 23%
have special HR employees in
company 29% 6% 21% 23% 48% 81%
Source: Ameria Survey, 2017
It is also interesting to discuss staff trainings by main types of the activities of the companies.
Particularly, the companies in research and experimental development on natural sciences and
engineering (M.72.1) are more active in staff trainings (both in Armenia and abroad), while
companies in manufacturing of computers, electronic and optical products (C.26) are active only
in trainings in Armenia. The latter can be explained by availability of professionals in IT related
field in Armenia, so there is no much need to have trainings abroad.
For all HR operations, the companies in manufacturing of machinery and equipment (C.28) are
most passive among PE subsectors. This may speak about lower development of this subsector
and the needs to have investments in staff related activities.

61
Table 17. Share of companies with specific HR operation in 2016 (by main type of activity
of the companies)
Total
Main type of activity
C.26 C.27 C.28 M.71.12 M.72.1
staff training in Armenia with
professional centers/persons 53% 78% 45% 40% 61% 82%
staff training abroad with
professional centers/persons 20% 22% 18% 9% 23% 55%
applied to labor agencies for staff
recruitment issues 9% 11% 5% 6% 13% 9%
placed paid announcements on
specialized staff recruiting
websites
11% 11% 8% 6% 16% 9%
have special HR employees in
company 29% 56% 34% 19% 25% 73%
Source: Ameria Survey, 2017
Only 29% of companies have special HR employees in their staff, mainly in comparably larger
companies. For those companies which do not have special HR managers in the company, the
responsibilities of HR related works are taken mainly by top managers (predominantly by
directors, occasionally by deputy director or other employee).
Interest in HR services
Interest to use professional services for HR is low according to the companies. The main reason,
perhaps, is the need to pay for these services and most companies in Armenia (especially small
ones) do not expect to receive true value for the payment and decide to do this activities with own
resources (even if the quality is low).
Table 18. Level of interest in professional HR outsourcing services (according to the
companies)
Level of interest (1-not interested, 5-
very interested)
Total 1 2 3 4 5
Payroll services 65% 20% 7% 4% 4% 100%
Organizing
trainings 40% 13% 27% 14% 6% 100%
Staff recruitment 65% 21% 10% 3% 1% 100%
Preparation of
vacation, hiring
and termination
orders 68% 21% 7% 3% 1% 100%
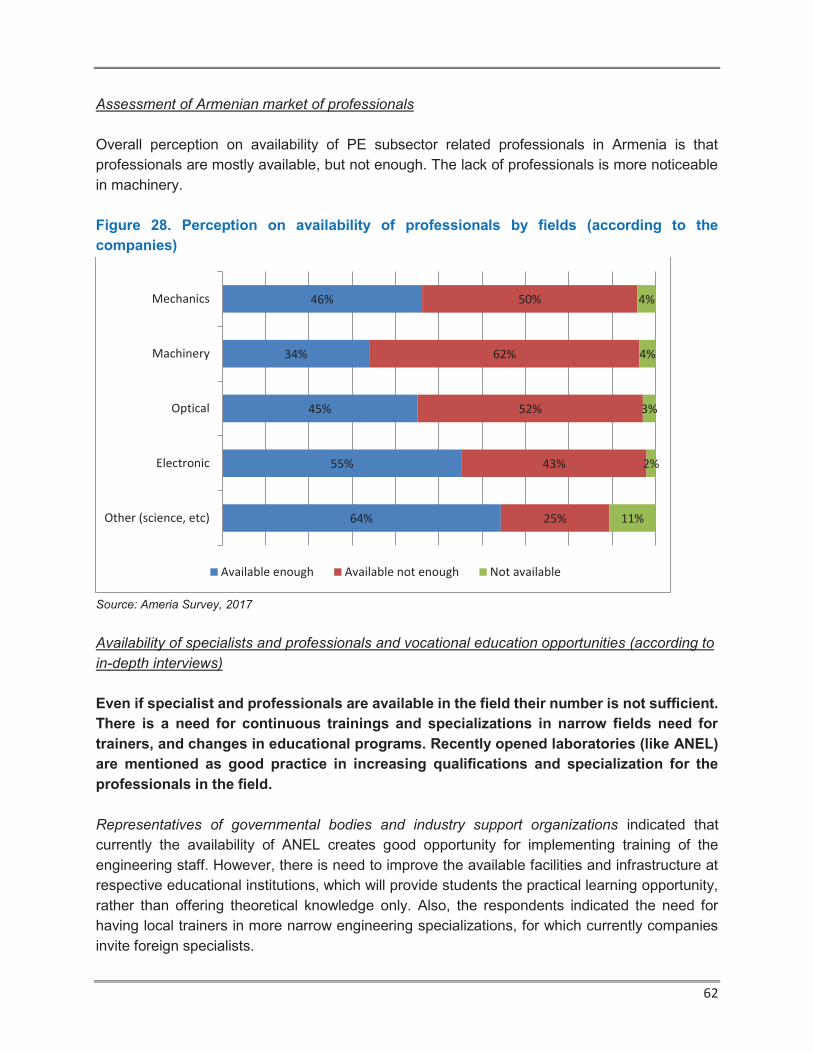
62
Assessment of Armenian market of professionals
Overall perception on availability of PE subsector related professionals in Armenia is that
professionals are mostly available, but not enough. The lack of professionals is more noticeable
in machinery.
Figure 28. Perception on availability of professionals by fields (according to the
companies)
Source: Ameria Survey, 2017
Availability of specialists and professionals and vocational education opportunities (according to
in-depth interviews)
Even if specialist and professionals are available in the field their number is not sufficient.
There is a need for continuous trainings and specializations in narrow fields need for
trainers, and changes in educational programs. Recently opened laboratories (like ANEL)
are mentioned as good practice in increasing qualifications and specialization for the
professionals in the field.
Representatives of governmental bodies and industry support organizations indicated that
currently the availability of ANEL creates good opportunity for implementing training of the
engineering staff. However, there is need to improve the available facilities and infrastructure at
respective educational institutions, which will provide students the practical learning opportunity,
rather than offering theoretical knowledge only. Also, the respondents indicated the need for
having local trainers in more narrow engineering specializations, for which currently companies
invite foreign specialists.
46%
34%
45%
55%
64%
50%
62%
52%
43%
25%
4%
4%
3%
2%
11%
Mechanics
Machinery
Optical
Electronic
Other (science, etc)
Available enough Available not enough Not available
63
Research institutions’ representatives have expressed different opinions on the necessity and
possibility of the sector specialists’ qualification improvement in Armenia. In particular, circa 40%
of respondents clearly stressed the necessity and importance of qualification improvement, one
of the respondents mentioned that the specialists’ qualification level is sufficiently high; there was
also an opinion that the need for qualification improvement should be a market cue. About 30%
of respondents mentioned that the educational/training processes should be changed: specialists
should master wider knowledge (project preparation, be familiar with business plan components,
master foreign languages, etc.), students’ knowledge evaluation methods should to be changed
– students need to get knowledge and not the diploma. As means of qualification improvement,
separate respondents stressed the importance of external training, others - internal and in place
trainings (more efficient, requires the same financial resources yet involves more trainees).
Educational institute representatives indicated a need for increasing qualifications. Two
qualification centers acting now were mentioned as good practice: Microsoft Innovation Center
and National Armenian Polytechnic University. “Luys foundation” was also mentioned, but, as an
unsuccessful program (according to them) because of brain drain issue. Respondents also
mentioned that opportunities for increasing qualification include organizing exchange programs
for students and experienced workers, by constructing new laboratories and by increasing
employment opportunities.
Changes in sector students’ characteristics noticed over recent years
Increase in female students in the sector and mostly growth of interest of some part of
students is noticed overall according to education and research institutions
representatives. The interest will grow with the development of the sector in Armenia.
Research institutions’ representatives were for most positive about the recent changes in sector
students’ quantity, quality and interest towards PE. In particular, circa 40% of respondents stated
that the number of students is quite acceptable; indeed one also mentioned that the number is
increasing. About the same portion of respondents stated that the quality of students is average
and high, and only one mentioned that only 30% of respondents are competent; regarding the
interest, again circa 40% of respondents stressed the students’ high interest towards the sector.
Respondents’ answers were more dissenting on gender: circa 30% mentioned that number of
female students exceeds that of male student, another 30% - the opposite. There is also an
opinion that the students’ interest and quality towards the sector will not increase until PE is
considered a trending specialization.
Majority of respondents from educational institutions mentioned that they have noticed increasing
tendency of female students in entering PE industry. However, the total number of interested
students remained constant, according to them. In addition, the majority of respondents consider
the level of quality of students to be either unchanged or satisfactory. Only one of them thinks that
64
the quality level has increased, which the respondent backed up by the fact that more graduates
of faculties related to PE work in according industries.
Improvement of professional education in the field
Changes in educational programs, integration of use of laboratories during educational
process as well as cooperation between educational and research institutes with
businesses are the ways to improve professional education in the PE sector.
Representatives of governmental bodies and industry support organizations indicated that they
are ready to provide support for sector companies, in the form of developing new curricula for
educational institutions, implementing training programs, providing financial and consulting
support in cooperation with EU and GIZ for new product development and establishment of start-
ups.
Representatives of Technoparks and FEZ emphasized that the link between the industry and
universities is very loose in Armenia. Students learn theory but they don’t have the opportunity to
practice this knowledge in “real-life” environment. Universities do not have well-equipped
laboratories without which engineering cannot develop as a profession. Universities should
establish strong links with leading organizations in the industry and, for instance, organize
internships for students in these organizations or involve senior managers from these
organizations in the committees that check the final paper (theses) of students. This can add more
objectivity in terms of the marking procedures and also can give high achieving students to get
noticed by industry leaders. In addition, the topics of students’ dissertations must come from the
industry, from real challenges that companies face rather than being based on the preferences of
universities or the resources that they have.
More than half of the research institutions’ representatives, believe that the university –
companies cooperation is the most efficient way to make the education process more effective,
mentioning that cooperation will be mutually beneficial both for the educational institutions and
the companies – the unity will help the universities to offer better and higher quality education and
the companies to nurture the specialists they are in need of; indeed, this will also increase the
students’ motivation and interest towards the sector. At the same time one of the respondents,
stressed the migration problem among youth resulting from social issues, pointing out that the
cooperation today is actively developing yet it won’t solve the youth problem. Other suggestions
also include to revise the education programs, to create a science – based educational system,
to integrate the science and technology in education, insure the existence of proper equipped
laboratories in universities (i.e. similar to National Polytechnic University of Armenia), create a
modern educational infrastructure, implement exchange programs with foreign universities, etc.
Seventy percent of respondents from educational institutions agree that tightening collaboration
between educational institutions and businesses will have a positive impact on developing better

65
specialists. That gives students an opportunity to gain practical experience, which increases their
readiness to enter job market. Attracting higher qualified professors and creating research centers
are other methods mentioned by respondents.
Willingness to initiate cooperation in the field, possible facilities for the companies in the sector
Research and educational institutions mainly are ready to cooperate with companies in
the field by providing expert knowledge, as well as working space, and some of them even
special grants for start- up businesses. Technology centers and FEZ are ready to provide
working space and laboratories with special equipment as well as trainings.
To support the development of PE organizations, around 40% of the research institutions are
ready to cooperate by providing the knowledge and expertise of their specialists. Separate
respondents also suggested better pricing strategies. Some of the respondents mentioned that
they are already cooperating with the sector companies, by providing the knowledge of their
experienced staff, or by providing certain devices and equipment and professional advice.
Meanwhile, one of the participants stated that they cannot grant any privileges as they are private
enterprise.
In terms of the support, majority of interviewed educational institutions are ready to provide
educational platform for developing specialists. In addition, there are ready to help in different
stages of startup development: providing working space, consultancy for developing final products
and also providing grants. Surprisingly, one of the respondents did not express any interest in
cooperation due to lack of trust.
The support provided by Technology centers and FEZ to organizations in PE sector are mainly
provision of space (including office space), laboratories with specialized equipment, advisory
support both in engineering and in business development such as how to secure financing and
various practical trainings. In addition some of them provide opportunities for prototype
development and testing.

66
6. INVESTMENT, INNOVATION AND R&D ACTIVITY IN THE
SECTOR
Along with perception on lack of professionals in the field, low competitiveness of the sector in
Armenia is also frequently mentioned by the experts in precision engineering. Innovations by the
companies may increase competitiveness of these companies in the international markets which
will increase competitiveness of the sector itself.
The perception of innovations is usually very different and subjective. Anyway one of the
questions in the survey was aimed to understand level of new innovations developed by the
companies, even with their understanding.
Availability of innovation related activity in company
Around 72% of the companies in the survey reported about innovation activity in their company.
The companies were also asked to provide some details on the type of innovations they produce.
So, 65% of all companies in the sector reported about development of new products and services,
61% - improvement of existing goods and services and 38% - Improvement of used
technologies/equipment. The level of innovation is comparably higher at medium and large size
companies, which seems logical.
Comparing types of activities of the companies in precision engineering sector with the share of
innovative companies, it is obvious that Manufacturing of machinery and equipment lacks
innovation activities, which can also explain their development and potential compared to other
manufacturing subsectors.
Table 19. Share of companies with specific type of innovation activity (% to all companies
in specific type of activity)
C.26 C.27 C.28 M.71.12 M.72.1 Total
New goods/services 89% 79% 55% 63% 73% 65%
Improvement of existing goods and
services 56% 87% 53% 52% 82% 61%
Improvement of used
technologies/equipment 44% 53% 38% 28% 36% 38%
Source: Ameria Survey, 2017
According to the companies in the survey, 29% of PE companies have employees dedicated for
innovation activities. Again, the least share among subsectors is in Manufacturing of machinery
and equipment, where only 23% of companies have such employees.
It was difficult to understand the size of the budget of the companies dedicated for innovation
activities. Particularly around 70% of companies could not provide any data, due to different
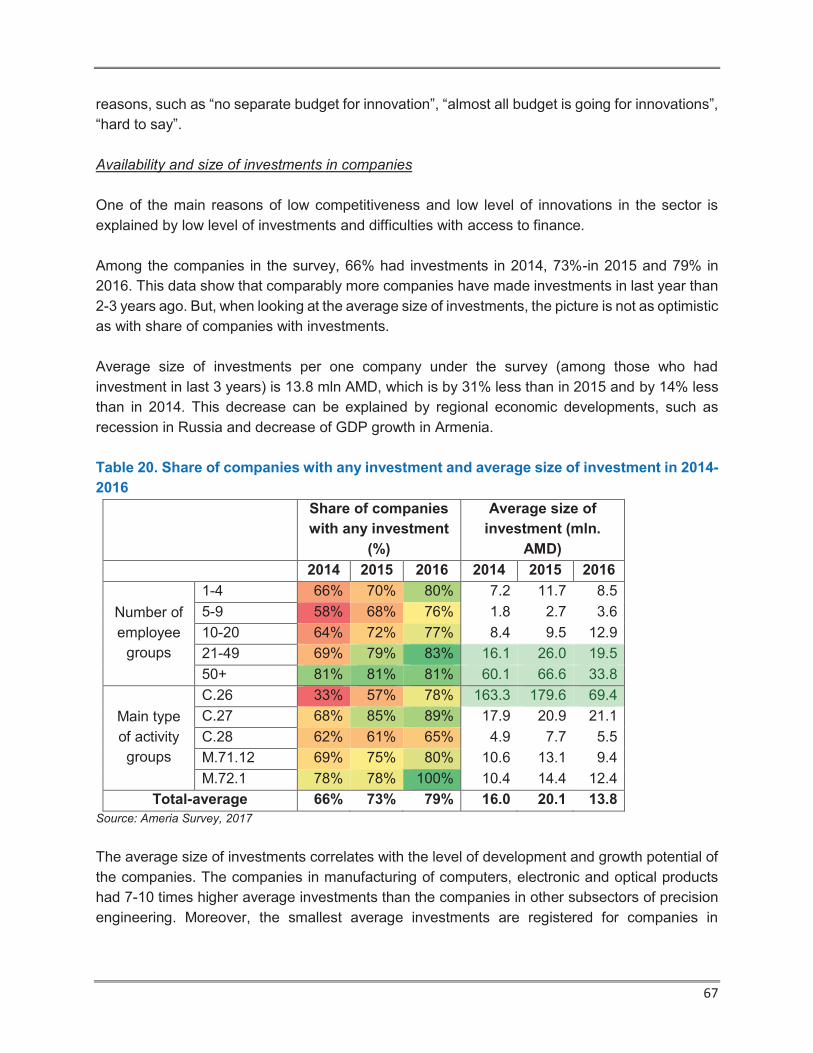
67
reasons, such as “no separate budget for innovation”, “almost all budget is going for innovations”,
“hard to say”.
Availability and size of investments in companies
One of the main reasons of low competitiveness and low level of innovations in the sector is
explained by low level of investments and difficulties with access to finance.
Among the companies in the survey, 66% had investments in 2014, 73%-in 2015 and 79% in
2016. This data show that comparably more companies have made investments in last year than
2-3 years ago. But, when looking at the average size of investments, the picture is not as optimistic
as with share of companies with investments.
Average size of investments per one company under the survey (among those who had
investment in last 3 years) is 13.8 mln AMD, which is by 31% less than in 2015 and by 14% less
than in 2014. This decrease can be explained by regional economic developments, such as
recession in Russia and decrease of GDP growth in Armenia.
Table 20. Share of companies with any investment and average size of investment in 2014-
2016
Share of companies
with any investment
(%)
Average size of
investment (mln.
AMD)
2014 2015 2016 2014 2015 2016
Number of
employee
groups
1-4 66% 70% 80% 7.2 11.7 8.5
5-9 58% 68% 76% 1.8 2.7 3.6
10-20 64% 72% 77% 8.4 9.5 12.9
21-49 69% 79% 83% 16.1 26.0 19.5
50+ 81% 81% 81% 60.1 66.6 33.8
Main type
of activity
groups
C.26 33% 57% 78% 163.3 179.6 69.4
C.27 68% 85% 89% 17.9 20.9 21.1
C.28 62% 61% 65% 4.9 7.7 5.5
M.71.12 69% 75% 80% 10.6 13.1 9.4
M.72.1 78% 78% 100% 10.4 14.4 12.4
Total-average 66% 73% 79% 16.0 20.1 13.8
Source: Ameria Survey, 2017
The average size of investments correlates with the level of development and growth potential of
the companies. The companies in manufacturing of computers, electronic and optical products
had 7-10 times higher average investments than the companies in other subsectors of precision
engineering. Moreover, the smallest average investments are registered for companies in
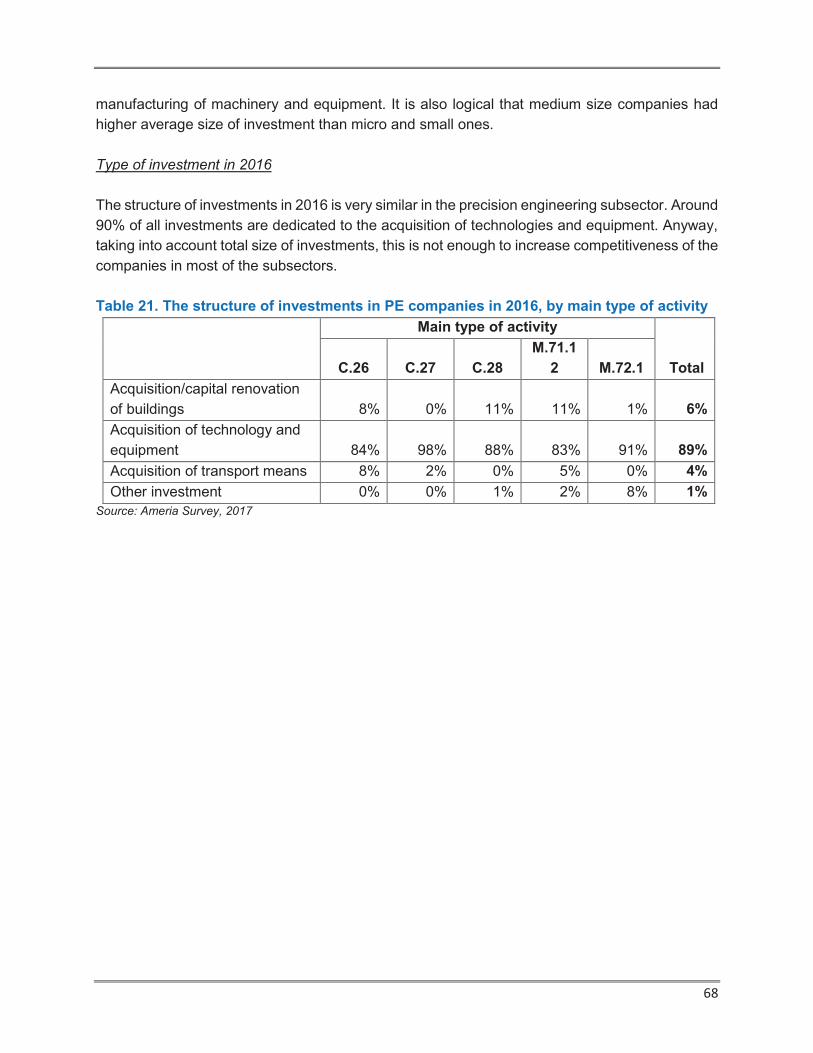
68
manufacturing of machinery and equipment. It is also logical that medium size companies had
higher average size of investment than micro and small ones.
Type of investment in 2016
The structure of investments in 2016 is very similar in the precision engineering subsector. Around
90% of all investments are dedicated to the acquisition of technologies and equipment. Anyway,
taking into account total size of investments, this is not enough to increase competitiveness of the
companies in most of the subsectors.
Table 21. The structure of investments in PE companies in 2016, by main type of activity
Main type of activity
Total C.26 C.27 C.28
M.71.1
2 M.72.1
Acquisition/capital renovation
of buildings 8% 0% 11% 11% 1% 6%
Acquisition of technology and
equipment 84% 98% 88% 83% 91% 89%
Acquisition of transport means 8% 2% 0% 5% 0% 4%
Other investment 0% 0% 1% 2% 8% 1%
Source: Ameria Survey, 2017
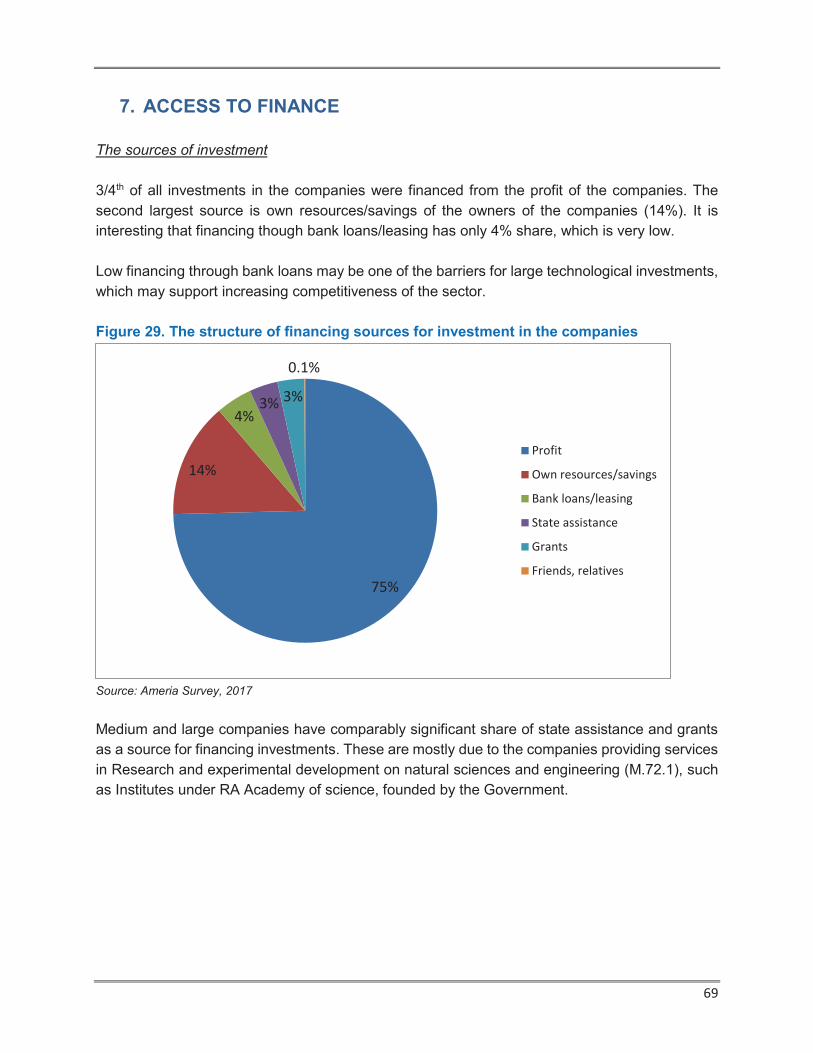
69
7. ACCESS TO FINANCE
The sources of investment
3/4th of all investments in the companies were financed from the profit of the companies. The
second largest source is own resources/savings of the owners of the companies (14%). It is
interesting that financing though bank loans/leasing has only 4% share, which is very low.
Low financing through bank loans may be one of the barriers for large technological investments,
which may support increasing competitiveness of the sector.
Figure 29. The structure of financing sources for investment in the companies
Source: Ameria Survey, 2017
Medium and large companies have comparably significant share of state assistance and grants
as a source for financing investments. These are mostly due to the companies providing services
in Research and experimental development on natural sciences and engineering (M.72.1), such
as Institutes under RA Academy of science, founded by the Government.
75%
14%
4%3% 3%
0.1%
Profit
Own resources/savings
Bank loans/leasing
State assistance
Grants
Friends, relatives
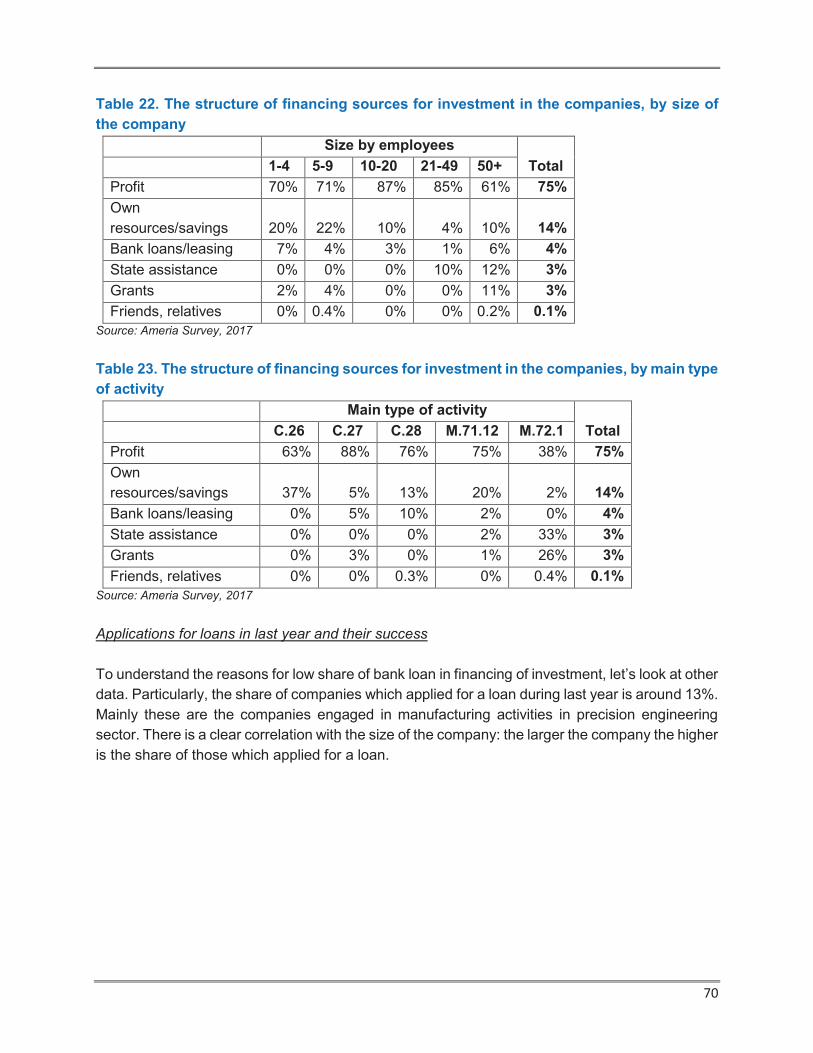
70
Table 22. The structure of financing sources for investment in the companies, by size of
the company
Size by employees
Total 1-4 5-9 10-20 21-49 50+
Profit 70% 71% 87% 85% 61% 75%
Own
resources/savings 20% 22% 10% 4% 10% 14%
Bank loans/leasing 7% 4% 3% 1% 6% 4%
State assistance 0% 0% 0% 10% 12% 3%
Grants 2% 4% 0% 0% 11% 3%
Friends, relatives 0% 0.4% 0% 0% 0.2% 0.1%
Source: Ameria Survey, 2017
Table 23. The structure of financing sources for investment in the companies, by main type
of activity
Main type of activity
Total C.26 C.27 C.28 M.71.12 M.72.1
Profit 63% 88% 76% 75% 38% 75%
Own
resources/savings 37% 5% 13% 20% 2% 14%
Bank loans/leasing 0% 5% 10% 2% 0% 4%
State assistance 0% 0% 0% 2% 33% 3%
Grants 0% 3% 0% 1% 26% 3%
Friends, relatives 0% 0% 0.3% 0% 0.4% 0.1%
Source: Ameria Survey, 2017
Applications for loans in last year and their success
To understand the reasons for low share of bank loan in financing of investment, let’s look at other
data. Particularly, the share of companies which applied for a loan during last year is around 13%.
Mainly these are the companies engaged in manufacturing activities in precision engineering
sector. There is a clear correlation with the size of the company: the larger the company the higher
is the share of those which applied for a loan.

71
Figure 30. Share of companies which applied for a loan to a financial company in 2016
Source: Ameria Survey, 2017
Comparably fewer companies with activities in PE services apply for a loan which may have
several reasons. First one is usually the companies providing services (especially if these services
are exported) have less opportunity to get a loan from a bank than those which are engaged in
manufacturing due to different reasons, such as need for collateral, proves on continuous profits
and etc. Another reason could be that these companies work through grants and tenders and do
not need any additional financing from the banks.
There were only 2 companies out of 25 which applied for a loan during 2016 and did not succeed
to get a loan. So the issue is more related to the companies’ plans, than to refusals of banks to
provide loans.
According to the data from the Central bank of Armenia, overall level of loans provided by
commercial banks to Manufacturing of computers, electronic and optical products (C.26) and
Manufacturing of electrical equipment (C.27) comprised only 3,308 thousand USD as of January
2017. There were no loans to companies in manufacturing of machinery and equipment according
to the CBA data. The level of loans to engineering related services in precision engineering is
difficult to separate from whole sector of Architecture and engineering activities and scientific
research, but it is estimated under 3 mln USD.
6%
13%
17%
21%
16%
22%
15%
18%
9%
0%
0% 20% 40% 60% 80% 100%
1-4
5-9
10-20
21-49
50+
C.26
C.27
C.28
M.71.12
M.72.1S
ize
by
em
plo
ym
en
tM
ain
act
ivit
y

72
Plans for new projects in 2017-2019 and financing sources
The majority of the companies in the survey have plans for new and expanding projects in 2017-
2019: 72% will have projects and another 24% - “maybe”.
Figure 31. Expectations on new projects and development plans in 2017-2019 (according
to the companies)
Source: Ameria Survey, 2017
Only 2% of companies informed that they do not have any plans for new or expanding projects in
2017-2019. Mainly these are the companies in service activities, such as state-financed
institutions. Interesting also, that several companies engaged in activities of electric equipment
production (C.27) and machinery and equipment production (C.28) have plans for development
in other spheres, which may speak about difficulties in these types of activities in Armenia.
Table 24. Expectations on new projects and development plans in 2017-2019, by main type
of economic activity (according to the companies)
Main type of activity
C.26 C.27 C.28 M.71.12 M.72.1
Yes 44% 70% 73% 77% 67%
Maybe 56% 25% 24% 20% 17%
Yes, but in other sphere 0% 3% 4% 0% 0%
No new projects planed 0% 3% 0% 1% 17%
Plans for business exit 0% 0% 0% 1% 0%
100% 100% 100% 100% 100%
Source: Ameria Survey, 2017
The structure of financing new and expanding project in 2017-2019 is very similar to the structure
of financing investments in the companies. The only noticeable difference is that the share of own
2%
24%
72%
2% 1%
No new projects plans
Maybe
Yes
Yes, but in other sphere
Plans to exit the business

73
resources/ savings is lower here (8% vs 14%), instead 10% of new project financing is planned
by grants, client advance payments and other cooperation initiatives.
Figure 32. The structure of financing sources for investment in the companies
Source: Ameria Survey, 2017
75%
8%
4%
3% 10%
0.3%
Profit
Own resources/savings
Bank loans/leasing
State assistance
Grants, advance payments,
other
Friends, relatives
74
8. CHALLENGES AND NEEDS OF THE SECTOR
Challenges and barriers for sector development and prerequisites for PE sector growth in
Armenia
Representatives of government bodies and industry support organizations indicated several main
problems for the development of the sector during the in-depth interviews. Among them one of
the most important ones is absence of general infrastructure to be provided by the state to private
companies. In this regard, they mentioned that the initiative to establish engineering city in Jrvezh
could be the first, and hopefully not the last example of providing such support. Another key
problem is educational programs and methods currently utilized by the leading universities in
Armenia, which need substantial revision in order to become adequate to the current trends and
requirements of the sector.
At the same time, along with the curricula, the technical infrastructure at the universities should
be upgraded, since it is not possible to learn basics of precision engineering without having the
opportunity to conduct extensive research and practical work. However, this requires substantial
investments, which private companies and educational institutions cannot bear. Hence, state
support is required in this field as well, since the created infrastructure requires continuous
modernization due to specifics of the sector.
Next obstacle is not sufficient state support provided at free economic zone, which, according to
the respondents, is main reason for companies, registered in FEZ, not succeeding in their
operations. Particularly, the customs procedures currently in force at FEZ does not stimulate
effective exporting of semi-finished or final products, as well as creating problems during import
of vitally needed prototypes and raw materials. Those procedures create unnecessary delays in
supply of materials, for which even hours could be decisive. As a result, the competitiveness of
the Armenian produce becomes less.
Additionally, among the barriers for the development of the sector, mentioned by the in-depth
interview participants, are:
§ not sufficient funding for technological research resulted in shortage of new technologies,
§ relative shortage of information about the global trends,
§ limited number of international companies on the local market,
§ gradual shortage of professional workforce,
§ not adequate system of state support and incentives, including tax and customs,
§ logistical restrictions during exporting.
As challenges for the development of the sector, government bodies and industry support
organizations mentioned high level of investments required for the implementation of Greenfield
projects or expanding the operations of the existing companies in the sector. Another field
75
requiring attention, in their opinion, is not strong PR implemented to attract and motivate youths
to be more engaged in the sector. In this regard, they propose to include engineering education
in the curricula of secondary schools, since it will allow familiarizing new generations with the
opportunities, provided by the sector, and creating additional motivation for them to choose the
sector for their future professional development.
Representatives of technology centers and FEZ pointed the following key problems in the sector:
small domestic market, absence of legislation in this sphere, lack of new specialists and
information and innovational equipment. Most of the companies in the subsector begin their
activity in Armenia with small market sales, further they begin operating in international markets
to increase sales. The lack of modern specialists and machinery and equipment impacts their
competitiveness in the international markets. The EAEU legislation also makes barriers for
exports. There are problems with VAT and interstate relations which decrease the FEZ activity.
Free Economic Zone is new to Armenia and isn’t formed completely, but there can be several
prerequisites for reclamation in this sphere. Integration of new investors is one of the main
objectives.
According to in-depth interviews with representatives of research institutions, the main obstacle
for PE sector’s development in Armenia is the limited number of professionals and the migration
among especially young professionals (resulted from social issues existing in the country). Around
30-40% of respondents stressed the barriers related with the educational environment – not
sufficiently enough developed (traditional education, the shortage of new technologies’ usage in
educational sector, etc.); the limited financial resources - needed to finance’ the sector specialists’
international trainings, to create multifunctional laboratories, etc.; tax legislation (need for tax
privileges). Other factors include infrastructure, outdated technologies, insufficient level of
confidence towards the sector, prior to the government’s decision to recognize it as a priority
sector, the regional blockage, isolation in terms of transport, disproportionate distribution of
resources among IT and PE sectors (IT requires less resources, yet PE insures more valuable
results for economy), mentality and organizational factors.
According to in-depth interviews with representatives of educational institutions, PE industry
development barriers include lack of financial resources, no sophisticated demand from Armenian
economy in PE market and no well-managed governmental policy. One of the respondents
recalled the collapse of Soviet Union, after which a number of factories were destroyed causing
considerable damages to PE industry. However, the most significant obstacle, as was mentioned
by sixty percent of respondents and is partly caused by other barriers, is brain drain of PE industry
specialists.
76
Prerequisites of PE sector development
It is interesting that availability of skilled and comparably low cost of professionals is
mentioned as an advantage for Armenian PE sector (which is mainly based on traditions
of engineering sector in Soviet times and availability of specialists with engineering
education). Anyway, there is a need for raising interest of students in precision
engineering; otherwise this advantage will be lost soon.
Representatives of government bodies and industry support organizations indicated several
factors for the development of the precision engineering sector –mainly as opportunity to have
skilled and low cost professionals. Particularly, there are people, who are able to quickly and
easily learn new professions, and become highly skilled professionals, able to solve difficult
technical problems, applicable for multi-sectors. Second is competitive labor cost, which is less
than in other countries possessing comparably skilled workforce. Another advantage of the sector,
according to respondents, is availability of skilled engineers and trainers, inherited from soviet
times, who are still available in the market.
Representatives of technology centers and FEZ also mentioned the availability of specialists
possessing high specific skills and knowledge as prerequisite for development of PE. There are
experienced specialists who can carry the tasks. But most of the specialists in RA have old
knowledge which isn’t competitive in modern world. As responder from EPIC underlines “Most of
the students are interested in business education and skip engineering. There is modern
equipment in AUA but no much interest among students to use that”. He thinks social changes
should be carried on to increase the interest of Precision Engineering among the sociality. New
operations should be done for forming high skilled and educated specialists such as cooperation
with international famous universities in PE sphere.
The research institutions representatives have quite dissenting opinions on the main factors
currently promoting the PE sector development in Armenia. Some 30% believe that the high
scientific potential and high quality professionals are the main factors promoting the sector; one
of them also mentioned the international well known companies’ representatives acting in RA.
Nevertheless, the respondents for most stressed not the existing, but the desired factors the
existence of which, they believe, will boost the PE sector development in the country: some 20%
stressed the importance of quality educational institutions and sector-specialists; separate
respondents also underlined the importance of introducing Armenia to the world as a PE country
(actively conducting investment activities in the sector, boosting start–up (easier and faster start-
up establishment processes)), government support, the construction of new neighborhoods, new
momentum in Country’s construction industry, development of IT, high quality marketing, research
specialists, etc.
77
Infrastructure availability
Lack of enough infrastructures is still hindering development of PE sector in Armenia,
while establishment of technology centers and laboratories is a positive development.
According to government bodies and industry support organizations, the infrastructure available
in the country is not sufficient for the development of precision engineering sector. While the
Gyumri and Vanadzor technology centers, ANEL, EPIC and EIF are creating highly demanded
infrastructure, however there is still need for more facilities, providing equipment and working
areas. In this regard, establishment of Jrvezh engineering city is step in the right direction, which
should be supplemented by new technoparks and technocities.
The representatives of technology centers and FEZ also indicated lack of infrastructure in the
sector. While several institutions are in place such as Gyumri and Vanadzor technology centers,
where equipment is available for specialists, but because of lack of awareness and social interest
they don’t work productively yet. Technologic centers such as ANEL laboratory develop the PE
sphere. EPIC center representative appreciated the UITE project activity related to forming small
laboratories for pupils in schools to increase the interest towards PE.
Speaking about the infrastructure, the research institutions’ representatives mostly (more than
50%) believe that there is not sufficiently enough developed infrastructure in Armenia for PE, even
if some infrastructure is developed, yet with different reasons (incomplete and outdated, not
satisfactory for all areas, only the first steps are taken) still needs improvement. At, the same time,
one of the respondents believe, that, the infrastructure is never sufficiently developed, at the same
time pointing out, that as of now we have quite well developed infrastructure composites, yet all
of them work separately for their own and there is need for cooperation rather than further
development. Nevertheless, important to mention, that the respondents have dissenting opinions
on infrastructure composites, in other words, one of the respondents considers that infrastructure
is first of all the legislative framework, another one - the knowledge.
Forty percent of respondents form educational institutions in consider that Armenian economy
possess enough infrastructure for development of PE industry. On contrast, thirty percent has an
opposing opinion. Also, it is worth mentioning that another thirty percent of respondents had no
opinion regarding the level of infrastructure. However, what connects all respondents is that they
all think that there is a need of more investments in the infrastructure.

78
Most productive assistance according to the companies
According to the companies, the most effective ways of assistance are mainly related to sales,
marketing, cooperation development and export related assistance. It is interesting that 57% of
mentioned assistance is related to access to external markets.
The companies give less importance to access to finance and international certification of
production, which primarily can help them to access external markets. It is a bit strange that
companies care more about the quality of their production and implementation of new
technologies, than sales.
Figure 33. The structure of most effective types of assistance to the companies in next 3
years (based on 3 most effective tools mentioned by each company)
Source: Ameria Survey, 2017
The understanding of most effective assistance is different by subsectors also. Particularly, the
companies in manufacturing of computers electronic and optical products give more importance
to assistance for export, while other subsectors of manufacturing value more assistance for sales
and marketing. Taking into account other information on the level of development of these sectors,
we can state that most companies which value sales and marketing related assistance, perhaps,
have issues with the quality of production and use of new technology, which is the main problem
of low sales. It is strange that certification of products, access to finance, technical assistance
have much lower importance for most of the companies in the field.
The companies in manufacturing of computers, electronic and optical products also value
assistance in development of cooperation with educational and research assistance.
24%
18%
15%
14%
13%
6%
5%
3% 1% Sales, Marketing assistance
Cooperation development (participation in
exibitions, conferences)
Export related assistance
Access to finance
International certification of production
HR development
Development of cooperation with
educational and research institutes
Technical, professional assistance
Other
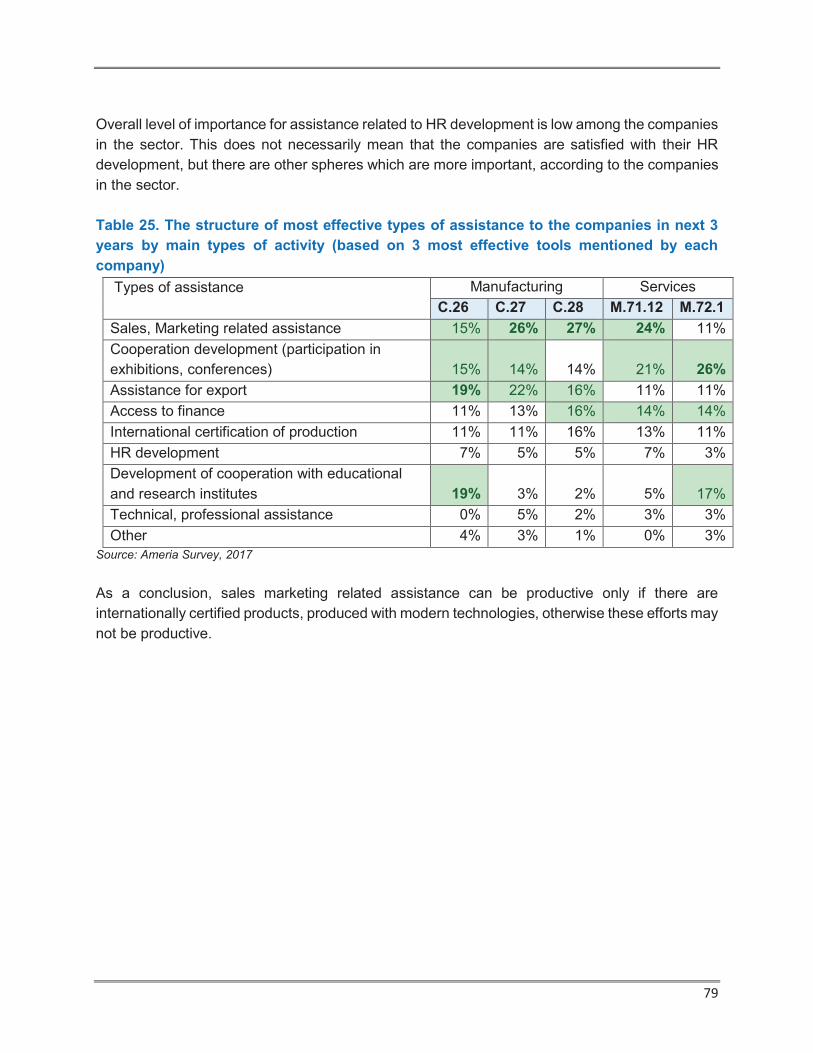
79
Overall level of importance for assistance related to HR development is low among the companies
in the sector. This does not necessarily mean that the companies are satisfied with their HR
development, but there are other spheres which are more important, according to the companies
in the sector.
Table 25. The structure of most effective types of assistance to the companies in next 3
years by main types of activity (based on 3 most effective tools mentioned by each
company)
Types of assistance
Manufacturing Services
C.26 C.27 C.28 M.71.12 M.72.1
Sales, Marketing related assistance 15% 26% 27% 24% 11%
Cooperation development (participation in
exhibitions, conferences) 15% 14% 14% 21% 26%
Assistance for export 19% 22% 16% 11% 11%
Access to finance 11% 13% 16% 14% 14%
International certification of production 11% 11% 16% 13% 11%
HR development 7% 5% 5% 7% 3%
Development of cooperation with educational
and research institutes 19% 3% 2% 5% 17%
Technical, professional assistance 0% 5% 2% 3% 3%
Other 4% 3% 1% 0% 3%
Source: Ameria Survey, 2017
As a conclusion, sales marketing related assistance can be productive only if there are
internationally certified products, produced with modern technologies, otherwise these efforts may
not be productive.

80
9. MAIN FINDINGS AND CONCLUSIONS
Government policy, strategy
§ Industry support organizations (including government, research and education
institutions) have positive expectations on PE development in Armenia.
§ Overall awareness on Government’s declaration of precision engineering as a priority
industry for the Armenian economy is high among the key representatives of different
support organizations in Precision engineering sector. Anyway the awareness on the
details of strategy and action plan is not so high.
§ There is need for substantial revision and adoption of new sector development strategies
and action plans, considering recent changes in economic policy and slowdown of
economic growth in, as well as the fact that the industry actual performance indicators are
already behind those expected to be achieved by the approved strategies.
§ Several subsectors of the precision engineering industry – production of electrical
machines, electronic and optical equipment - are considered as a priority for the
development in EAEU.
§ “Main directions of industrial cooperation within the Eurasian Economic Union” (adopted
on 8 September 2015 by the decision N9 of the Eurasian Intergovernmental Council)
assumes establishment of the Eurasian Engineering Center (location yet to be
determined) and competence centers for the implementation of joint research projects and
development of innovation infrastructure.
§ The role of government in development of PE sector is very important according to all
participants in the sector.
§ The role of international organizations in providing technical assistance on international
best practice and expertise is also very important.
Identification of sector and companies
§ Definition of Precision engineering sector is complicated task. The sector is not fully and
precisely defined in any international or national classifications. Economic activity
classification (NACE) gives just some understanding in which types of activities PE
companies may be engaged, but there is a need to identify companies in activity
subsectors based on more detailed information on their production.
§ It is noticed that IT industry is frequently mixed and included in Precision engineering in
Armenia. Even if these sectors may be very close, they should not be mixed. Perhaps,
this comes from inclusion of service activities related to engineering to Precision
engineering sector defined in strategic paper in Armenia, which is not a case in
international definition of PE. Service activities should be treated as supporting to PE,
which is a manufacturing activity predominantly.
81
Sector economic activity
§ Real volume of total production in PE manufacturing sector increased by 28.3% in 2016
compared to 2015, after slow growth or even decrease in previous 3 years.
§ In medium term period: electronic and optical engineering subsector is growing; Electrical
equipment’s subsector is stable, while mechanical engineering subsector has declined
over the last 4 years.
§ Majority of PE companies expects moderate growth of the subsector in Armenia during
the next 3 year period.
§ Prevailing majority of companies engaged in PE manufacturing subsectors are SMEs, with
over the half of companies are micro-sized.
§ Although 1/2rd of companies in subsectors are micro-sized companies they produce only
around 20% of total production.
§ The largest subsector in PE manufacturing according to the number of companies is
manufacturing of electrical equipment. The volume of production in manufacturing of
computer, electronic and optical products is close to manufacturing of electrical
equipment. The subsector of manufacturing of machinery and equipment (mechanical PE)
is behind by all indicators: number of companies, production volumes and development
trends and employment. The largest employment is registered in manufacturing of
computer, electronic and optical products.
§ Total employment in PE manufacturing subsectors is above 3 thousand according to
official statistics.
§ The following trends are noticeable when comparing the employment in 2016 to 2015: (i)
decline in employment of micro-sized and small companies, increase in employment of
medium size companies, (ii) large decline in employment of the companies which have
indicated Manufacture of machinery and equipment as their main activity, while in most of
other PE subsectors slow growth of employment is visible.
§ Trends in employment during 2015-2016 show that small companies struggle more with
the development than comparably larger ones and Mechanical/Machinery precision
engineering subsector is declining in Armenia.
§ Share of women in the employment of PE sectors comprised 30% (both in 2015 and 2016).
Women are more engaged in PE service industries (35% of employees are women) than
in PE manufacturing industries (25%).
§ According to survey companies 2/3rd of sales in 2016 were realized in domestic market,
with 1/3rd of sales – directly exported.
§ The influence of such factors as: “Tax administration”, “Tax rates” and “Lack of
professionals” on business activity are not assessed as negative by the PE companies in
the survey. “Small size of domestic market” is assessed to have the highest negative
influence of business activity of the companies in the sector.
§ Improvements in education system, favorable investment climate, state support for start-
ups, and investment in technologies can improve competitiveness of Armenian PE
companies.
82
External activity
§ The share of direct exports in total sales of PE manufacturing companies is around 22%
(official statistics estimate). Large decrease is noticed compared to previous years (42%
in 2013). Total export of production (including those exported by trade companies or
distributors) is much higher- at 30-40% according to estimates.
§ The share of companies with export activities is growing with the size of the company.
§ The share of direct exports is much higher in electronic and optical products (~38% in
2016), compared to other PE subsectors (14-16% in 2016).
§ 60-70% of total direct exports goes to CIS market (mainly Russia).
§ Overall export volume of defined product lines from Armenia (according to customs
statistics) comprised 54 mln USD in 2016, while the peak of export in post-crisis period
was in 2012 – 60.8 mln USD.
§ Overall trends noticed in 2010-2016 are: (i) export of clock and watches is growing with
high rate, (ii) export of optical, controlling and measuring instruments group is growing
moderately, (iii) export of product of mechanical production was growing with high rate
until sharp decline in 2013 and moderate decrease thereafter, (iv) export of electrical
production was growing moderately until sharp decline in 2013-2015, while 2016 again
showed growth.
§ Export is very concentrated to countries: over the half of export of mechanical and
electrical production went to Russia during recent years. Clock and watches products
predominantly are exported to Switzerland, while optical and measuring products have
comparably less concentrated by countries.
§ Export market diversification will allow to increase the volume of exports and to avoid
fluctuations of exports over short period of time.
§ Prevailing majority of companies organize their export through own resources without
using any domestic or foreign distributor – 87% of total export of companies in the survey
was done by own resources.
§ Availability of foreign partners is considered as the most important prerequisite for export
growth. Other two most important prerequisites are: participation in international
exhibitions and product compliance with international standards.
Human capital
§ According to the survey results, around 32% of companies in precision engineering
subsector have practice, when they could not find a specific specialist as needed.
§ 23% of needed specializations that was difficult to find refer to mechanical and machinery
related workers, such as locksmith, turner, miller, wrappers.
§ 53% of the companies in the survey had used services of professional centers/persons
for staff training in Armenia, 20% - use trainings organized by foreign professional
83
centers/persons. The larger the size of the company, the higher the opportunity for staff
trainings.
§ Only 29% of companies have special HR employees in their staff, mainly in comparably
larger companies. Interest to use professional services for HR is low according to the
companies in the survey. These may somehow explain difficulties in finding specialists.
§ Overall perception on availability of PE subsector related professionals in Armenia is that
professionals are mostly available, but not enough. The lack of professionals is more
noticeable in machinery.
§ There is a need for continuous trainings and specializations in narrow fields of PE, need
for trainers, and changes in educational programs. Recently opened laboratories (like
ANEL) are mentioned as good practice in increasing qualifications and specialization for
the professionals in the field.
§ Changes in educational programs, integration of use of laboratories during educational
process as well as cooperation between educational and research institutes with
businesses are the ways to improve professional education in the PE sector.
Investment, innovations
§ Around 72% of the companies in the survey report about innovation activity in their
company. 29% of PE companies have employees dedicated for innovation activities.
§ 65% of all companies in the sector reported about development of new products and
services, 61% - improvement of existing goods and services and 38% - Improvement of
used technologies/equipment. The level of innovation is comparably higher at medium
and large size companies.
§ 66% of companies had investments in 2014, 73%-in 2015 and 79% in 2016. While the
share of companies with investment grew during recent years, the average size of
investments declined.
§ The average size of investments correlates with the level of development and growth
potential of the companies. The companies in manufacturing of computers, electronic and
optical products had 7-10 times higher average investments than the companies in other
subsectors of precision engineering.
§ Around 90% of all investments are dedicated to the acquisition of technologies and
equipment.
Access to Finance
§ 3/4th of all investments in the companies were financed from the profit of the companies
and 14%- from own resources/savings of the owners. Financing though bank
loans/leasing has only 4% share.
§ The share of companies which applied for a loan during last year is around 13%. Mainly
these are the companies engaged in manufacturing activities in precision engineering
sector.

84
§ Only 8% of companies which applied for a loan during 2016 and did not succeed to get a
loan.
§ The majority of the companies in the survey have plans for new and expanding projects
in 2017-2019: 72% will have projects and another 24% - “maybe”. Only 4% of new and
expanding projects is planned to be financed by bank loan.
Main challenges of the sector
1. Small internal market and unfavorable geopolitical location of the country.
2. Low level of exporting activities, difficulties to access external markets. Transportation issues
especially for large size products.
3. Shortage of general infrastructure for further development of the sector.
4. Access to finance. Not sufficient investments in new technologies and equipment in the sector
companies.
5. Need for young professionals in the sector. Taking into account strong traditional development
of precision engineering related fields in Armenia (especially in Soviet era) there are qualified
specialists, but not sufficient for the development of the sector (as their number is decreasing)
and there is a need for qualified young specialists for further development of the sector.
6. Educational programs and methods currently utilized by leading educational institutions in
Armenia need substantial revision in order to become adequate to the current trends and
requirements of the sector.
7. Lack or absence of cooperation between the companies in the sector as well as between
companies and science/research/educational institutions.
8. Need for strong industry union for PE sector companies.
85
10. RECOMMENDATIONS
1. PE definition - Exact identification of precision engineering sector is needed. Currently
precision engineering is frequently mixed with IT sector. Definition of the sector should be
linked to product types rather than to types of activities. Awareness on precision engineering
activity should be raised among all participants in the sector. The sector should not be mixed
with IT and other support service activities.
2. Strategy and Action plan for Precision engineering should be updated taking into account
economic development changes (EAEU) and current developments in the sector. The
strategy should have concrete and understandable goals and should focus on particular types
of precision engineering aiming to ensure development of the sector in Armenia in line with
global technological and innovative developments. Particularly, the strategy should clearly
present the direction of the development of Armenian Precision engineering: for instance,
support to current international value chains or development of new innovative niche for
Armenia. The documents should be discussed with representatives of main companies in the
sector, industry support organizations, and education and research institutions in order to be
aware of opportunities and goals declared in the document.
3. There is a need to establish strong sector union (currently there are several unions in IT,
ICT, but usually they are more focused on IT issues) dedicated to representing interests of
the sector and uniting efforts to solve existing issues in precision engineering, which SMEs
can hardly take care of on their own. Particularly the union could:
a. Initiate cooperation of the sector with educational and scientific-research institutions,
b. Initiate cooperation with international PE sector unions and large companies,
c. Coordinate efforts of the government in PE sector and discuss current needs of the
sector,
d. Undertake export market research for products developed and manufactured in
Armenia,
e. Support organizations in exhibiting at professionals exhibitions in key target markets,
f. Organize and/or support trainings for the professionals in the sector.
4. Export related assistance - assistance in product registration on foreign markets, co-
financing for laboratory testing, interest rate subsidies, co-financing for participation at
exhibition on key markets. Assistance in establishing necessary relations with companies in
foreign markets is also important. Low rate of use of distributing services for the PE companies
may be one of the reasons of low export volumes as companies do not use professional sales
services due to different reasons. Need to have an unprecedented product, interesting,
attractive and original; quality of products with low transportation costs.

86
5. HR related assistance (and improvement of education/trainings)- establish strong links
between scientific and educational institutions with leading organizations in the industry;
organize internships for students in these organizations or involve senior managers from
these organizations in the committees that check the final paper (theses) of students. More
internal training programs are needed; there is a need for trainers in Armenia.
6. Investment climate support through development of favorable investment climate in the
country, which will take into account specifics of the PE sector.
7. Access to finance issues can be significantly improved only with the development of
technologies and product quality in the companies. Anyway, some measures should be taken
to facilitate access of start-ups to finance. Among ways to increase access to finance could
be establishment of venture funds in precision engineering projects, establishment of credit
guarantee fund for PE.
8. Based on the results of the research the subsector with highest development potential in
PE sector is the manufacturing of computer, electronic and optical products: This is justified
particularly by:
a. Higher development trends in the subsector compared to other subsectors in the
precision engineering
b. Tight relations to IT sector, which is quite developed already in Armenia and is having
positive influence on manufacturing of electronic and optical products
c. Comparably higher existence of professions, interest in young generation
d. The products are comparably small and valuable, which is advantage in exporting
compared to larger products which have issues with export logistics
The assistance of international organizations can be crucial for the development of the sector.
Particularly the following assistance can be productive:
§ Strengthening cooperation of Armenian PE companies with foreign partners
§ Raising awareness on current trends, new technologies in PE subsectors, international
best practice
§ Support to establishment of industry union,
§ Business trainings on product development, international certification,
§ Trainings to assist sales and marketing in PE, international best practice
§ Support to SMEs and start-us
Cooperation with educational institutions to support changes of educational and training programs
based on needs of the sector.

87
ANNEX 1. The list of conducted in-depth interviews
Institution Name Address Respondent Position Date of
interview
1
ANEL- Armenian
National
Engineering
Laboratories
105 Teryan St.,
Yerevan
Amalya
Mkhitaryan ANEL Manager 17/12/16
2
Institute for
Informatics and
Automation
Problems
Paruyr Sevak 1,
Yerevan
Sahakyan
Vladimir
Director of IDI
Institute of
Informatics and
Automation
Problems
17/12/16
3 Institute of
Mechanics
24B M.
Baghramyan Ave.,
0019, Yerevan
Ara Avetisyan
Head of deformable
system dynamics
and related
elements
department of
Mechanics Institute
19/12/16
4 Vanadzor
Technology Center
12 Shinararneri str,
Vanadzor 2019
Patvakan
Hakhinyan
Business
development
responsible of VTC
19/12/16
5
Yerevan state
vocational school
№4 SNCO
20 Gyulikekhvyan
St., 0076, Yerevan
Rashem
Durgaryan
Master of production
education 20/12/16
6 European Regional
Academy
D. Anhaght St.
Yerevan Anush Melikyan
Educational process
manager of
Microelectronic
circuits and systems
21/12/16
7
National Polytechnic
University of
Armenia
Yerevan, 105
Teryan St. Areg Grigoryan
Prorector of Science
and Scientific
technological
cooperation,
professor
22/12/16
8
UEICT-Union of
Employers of
Information and
Communication
Technologies
3 P.Buzand St.
0010, Yerevan Armen Baldryan Chairman 22/12/16

88
9 Enterprise Incubator
Foundation (EIF)
123 Hovsep Emin
St., 0051, Yerevan Mariam Davtyan
Director of
Enterprise Incubator
Foundation
programs
23/12/16
10
Armenian-Indian
Center for
Excellence in ICT
Alek Manukyan 1,
Yerevan: YSU,
Faculty of
Mathematics and
Mechanics
Yevgeni
Mamasakhlisov R&D Manager 27/12/16
11 American University
of Armenia
40 M. Baghramyan
Ave., 0019,
Yerevan
1.Rubina
Danielova
2.Sargis
Zeitunyan
1. Operations
manager/engineer
2. Head of Industrial
Engineering and
Equipment
Management
department
10/01/17
12
DFA-Development
Foundation of
Armenia
5 M. Mkrtchyan St.
Yerevan Hayk Mirzoyan Export Director 10/01/17
13 Russian-Armenian
(slavonic) University
123 Hovsep Emin
St., 0051, Yerevan
Vladimir
Gevorgyan
Director of
Mathematics and
high technologies
institutions
12/01/17
14
Alliance Free
Economic Zone
Sitronics Armenia
(CJSC)
111 Raffi St.,
Yerevan
Armen M.
Khachatryan, General Director 12/01/17
15
Yerevan State
University of
Architecture and
Construction
Yerevan, 105
Teryan St.
Artavazd
Arzumanyan
Head of Productive
materials and
equipment
production
technology
department
13/01/17
16 Yerevan State
University
Alek Manukyan St.,
0025, Yerevan
1.Samvel
Sargsyan
2.R. Allahverdyan
1. Head of
department of
Mechanics
2. Head of optics
department
17/01/17
17
Yerevan state
college of
informatics
52 Mamikonyants
St., Yerevan Qadjik Avetisyan
Head of Mechatronic
department 17/01/17
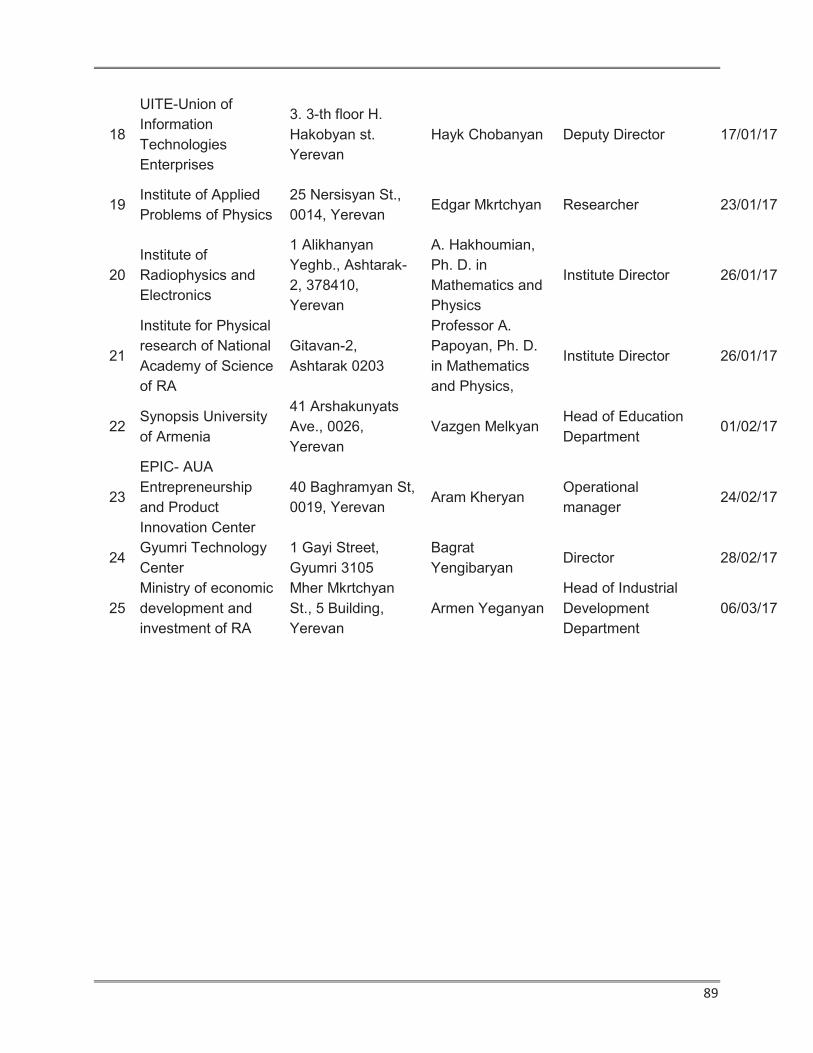
89
18
UITE-Union of
Information
Technologies
Enterprises
3. 3-th floor H.
Hakobyan st.
Yerevan
Hayk Chobanyan Deputy Director 17/01/17
19 Institute of Applied
Problems of Physics
25 Nersisyan St.,
0014, Yerevan Edgar Mkrtchyan Researcher 23/01/17
20
Institute of
Radiophysics and
Electronics
1 Alikhanyan
Yeghb., Ashtarak-
2, 378410,
Yerevan
A. Hakhoumian,
Ph. D. in
Mathematics and
Physics
Institute Director 26/01/17
21
Institute for Physical
research of National
Academy of Science
of RA
Gitavan-2,
Ashtarak 0203
Professor A.
Papoyan, Ph. D.
in Mathematics
and Physics,
Institute Director 26/01/17
22 Synopsis University
of Armenia
41 Arshakunyats
Ave., 0026,
Yerevan
Vazgen Melkyan Head of Education
Department 01/02/17
23
EPIC- AUA
Entrepreneurship
and Product
Innovation Center
40 Baghramyan St,
0019, Yerevan Aram Kheryan
Operational
manager 24/02/17
24 Gyumri Technology
Center
1 Gayi Street,
Gyumri 3105
Bagrat
Yengibaryan Director 28/02/17
25
Ministry of economic
development and
investment of RA
Mher Mkrtchyan
St., 5 Building,
Yerevan
Armen Yeganyan
Head of Industrial
Development
Department
06/03/17

90
Groups of institutions for analytical purposes
Groups
Educational & Research Institutions
Education
1. National Polytechnic University of Armenia
2. Yerevan State University
3. American University of Armenia
4. European Regional Academy
5. Russian-Armenian (Slavonic) University
6. Yerevan State University of Architecture and
Construction
7. Yerevan state college of informatics
8. IDI Yerevan state vocational school №4
Research
1. ANEL
2. Synopsis University of Armenia
3. Institute of Mechanics
4. Institute for Informatics and Automation Problems
5. Institute of Applied Problems of Physics
6. Institute of Radiophysics and Electronics
7. Institute for Physical research
Infrastructural companies (technoparks, FEZ)
1. Vanadzor Technology Center
2. Alliance Free Economic Zone
3. Gyumri Technology Center
4. EPIC
Governmental bodies & industrial organizations
1. DFA-
2. UITE-
3. UEICT -
4. EIF -
5. Armenian-Indian Center for Excellence in ICT-
6. Ministry of economic development

91
ANNEX 2. Information on education programs, students and staff
1. Number of Students per Specialization/Majors and Educational
Programs (according to information provided by Ministry of
Education)
National Polytechnic University of Armenia (Yerevan) -Students
Elementary vocational educational program as of
February 1, 2017
Specializations specified in the letter University program covering the same or
similar specialization
Number of
students
Mechanical metalworking via
machines and trains
Mechanical metalworking via machines and
trains 4
Intermediate vocational educational programs
Specializations specified in the letter University program covering the same or
similar specialization
Number of
students
Electronic devices and equipment Maintenance and repair of Communications
Electronics devices 86
Communication networks and
systems Communication networks and systems 123
Biotechnology and medical devices
and systems
Installation, maintenance and repair of
medical devices 6
Bachelor's program
Specializations/majors specified in
the letter
University program covering the same or
similar specialization/major
Number of
students
In-
person
learning
Distance
learning
Electronics Electronics 184 53
Semiconductor physics and
microelectronics
Semiconductor physics and
microelectronics 57 -
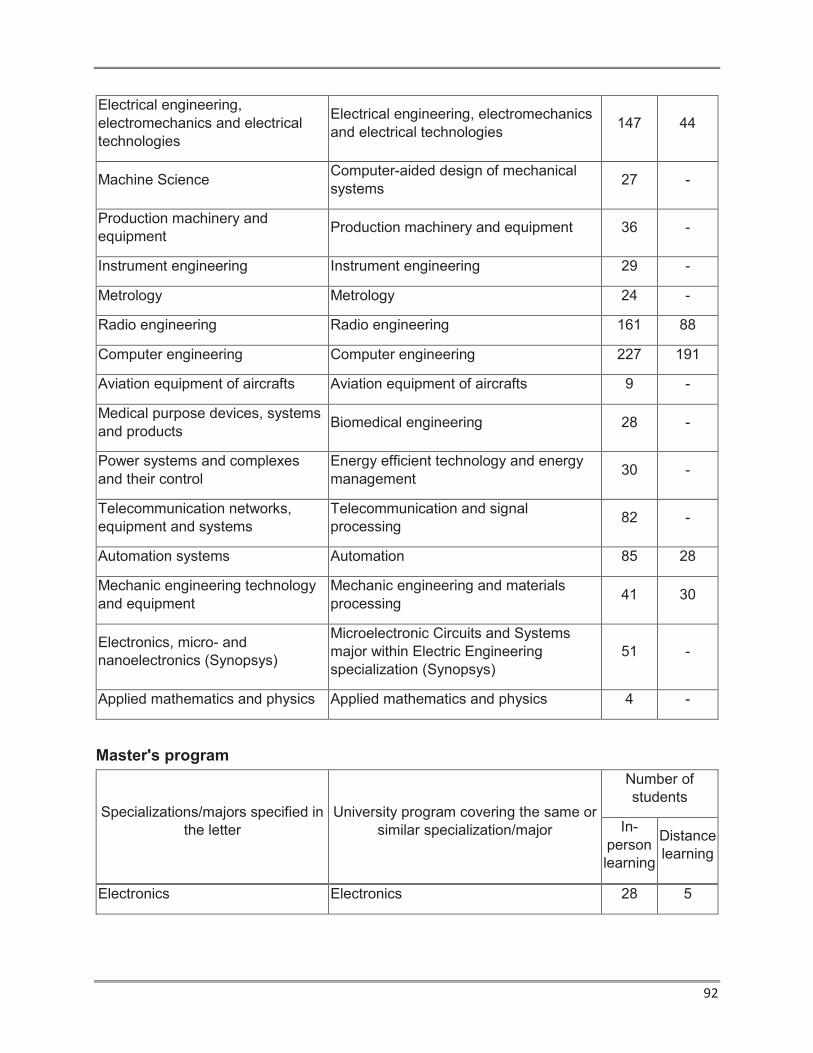
92
Electrical engineering,
electromechanics and electrical
technologies
Electrical engineering, electromechanics
and electrical technologies 147 44
Machine Science Computer-aided design of mechanical
systems 27 -
Production machinery and
equipment Production machinery and equipment 36 -
Instrument engineering Instrument engineering 29 -
Metrology Metrology 24 -
Radio engineering Radio engineering 161 88
Computer engineering Computer engineering 227 191
Aviation equipment of aircrafts Aviation equipment of aircrafts 9 -
Medical purpose devices, systems
and products Biomedical engineering 28 -
Power systems and complexes
and their control
Energy efficient technology and energy
management 30 -
Telecommunication networks,
equipment and systems
Telecommunication and signal
processing 82 -
Automation systems Automation 85 28
Mechanic engineering technology
and equipment
Mechanic engineering and materials
processing 41 30
Electronics, micro- and
nanoelectronics (Synopsys)
Microelectronic Circuits and Systems
major within Electric Engineering
specialization (Synopsys)
51 -
Applied mathematics and physics Applied mathematics and physics 4 -
Master's program
Specializations/majors specified in
the letter
University program covering the same or
similar specialization/major
Number of
students
In-
person
learning
Distance
learning
Electronics Electronics 28 5

93
Semiconductor physics and
microelectronics
Semiconductor physics and
microelectronics 10 -
Computer engineering of
integrated circuits
Computer engineering of integrated
circuits (Synopsys) 40 -
Instrument engineering Instrument engineering 8 1
Metrology Metrology 3 -
Radio engineering Radio engineering 19 1
Automation Automation 19 6
Computer engineering Computer engineering 49 9
Microwave radiophysics and
electronics
Telecommunication and signal
processing 14 7
National Polytechnic University of Armenia (Yerevan) –Graduates (recent 3
years)
Elementary vocational educational program
Specializations/majors
specified in the letter
University program covering
the same or similar
specialization/major
Graduation year
20132014 2014/2015 2015/2016
Mechanical metalworking
via machines and trains
Mechanical metalworking via
machines and trains 8 - -
Intermediate vocational educational programs
Specializations/majors
specified in the letter
University program covering
the same or similar
specialization/major
Graduation year
2013/2014 2014/2015 2015/2016
Electronic devices and
equipment
Maintenance and repair of
Communications Electronics
devices
20 32 39
Communication networks
and systems
Communication networks and
systems 18 22 40
Biotechnology and medical
devices and systems
Installation, maintenance and
repair of medical devices 12 5 9
Bachelor's program

94
Specializations/majors specified in the letter
University program covering the same or similar specialization/major
Graduation year
2013/2014 2014/2015 2015/2016
In-perso
n learni
ng
Distance
learning
In-perso
n learni
ng
Distance
learning
In-perso
n learni
ng
Distance
learning
Electronics Electric engineering 34 27 16 16 78 15
Semiconductor physics and microelectronics
Semiconductor physics and microelectronics
3 - 7 - 14 -
Electrical engineering, electromechanics and electrical technologies
Electrical engineering, electromechanics and electrical technologies
58 17 18 17 58 13
Machine Science Applied mechanics 18 - 7 - 6 -
Production machinery and equipment
Production machinery and equipment
13 - 1 - 10 -
Instrument engineering
Instrument engineering 9 - - - 6 -
Metrology Metrology, standardization and certification
10 - - - 5 -
Radio engineering Radio engineering and communication
71 23 20 32 86 20
Aviation equipment of aircrafts
"Technical operation of aircrafts and their engines" major within "Construction, control and operation of vehicles and engines" specialization
8 - - - 10 -
Medical purpose devices, systems and products
Biomedical engineering 12 - 8 - 20 -
Power systems and complexes and their control
Energy efficient technology and energy management
15 - 9 - 16 -
Computing machines, complexes, systems and networks, their
"Computing machines, complexes, systems and networks" major within "Computer science and
28 44 22 60 60 49

95
elements and devices
computing devices" specialization
Automation systems Automation and control 16 11 4 9 21 12
Mechanic engineering technology and equipment
Mechanic engineering and materials processing
21 16 8 17 12 12
Electronics, micro- and nanoelectronics (Synopsys)
Microelectronic Circuits and Systems major within Electric Engineering specialization (Synopsys)
14 - 13 - 21 -
Master's program
Specializations/major
s specified in the
letter
University program covering
the same or similar
specialization/major
Graduation year
2013/2014 2014/2015 2015/2016
In-
perso
n
learni
ng
Distan
ce
learni
ng
In-
perso
n
learni
ng
Distan
ce
learni
ng
In-
perso
n
learni
ng
Distan
ce
learni
ng
Electronics Electronic devices 12 5 14 4 15 3
Semiconductor
physics and
microelectronics
Semiconductor physics and
microelectronics - - 3 - 3 -
Computer
engineering of
integrated circuits
"Very-large-scale integrated
circuit design" major within
Electric Engineering
specialization (Synopsys)
28 - 24 - 19 -
Instrument
engineering Instrument engineering 5 - 6 - 6 1
Metrology Metrology, standardization
and certification 5 - 6 - 5 -
Radio engineering Radio engineering and
communication 19 8 16 12 18 8
Automation Automation and control 12 3 12 4 10 1
Computer
engineering "Appliance hardware" major
within "Computer science 14 5 14 5 12 7

96
and computing devices"
specialization
Yerevan State University - students and 2016 graduates
Number of students
Number of
graduates
Bachelor's degree
Semiconductor physics and microelectronics 56 15
Mechanics 66 24
Applied mathematics and physics 9 17
Radiophysics and electronics 235 61
Master's degree
Semiconductor physics and microelectronics 6 5
Optics 8 0
Radiophysics (Microwave radiophysics and electronics)
26 11
Elementary and Intermediate Vocational Education Institutions
as of February 1, 2017
Number of students
Total number of graduates
Syunik Regional State College
Communication networks and systems 37 88
Ejmiatsin Vocational State College
Welding technology 12 49
Ararat Regional State College
Welding technology 49 250
2. Educational programs, number of current full-time and part-time
students and current educational fees (according to information
provided by institutions in addition to in-depth interviews)
Name of educational
program
The number of current full-
time and part-time students
Current educational fee
(AMD)
Baccalaureate - -
Masters degree - -

97
Yerevan State University
American University of Armenia
European Regional Academy
Yerevan State University of Architecture and Construction
Doctor of philosophy - -
Name of educational
program
The number of current full-
time and part-time students
Current educational fee
(AMD)
Computer Science 360 -
Computer and Information
technologies
40 -
Industrial engineering 40 -
Name of educational
program
The number of current full-
time and part-time students
Current educational fee
(AMD)
Information Technologies - 570,000
N0
Specialization Number of current full-time
students
Current educational
fee (AMD)
Baccalaure
ate
Masters Total
Full-time Full-time Baccala
ureate
Masters
1 Production of construction materials,
structures and other constructional
products
13 6 19 590.000 700.000
2 Design of buildings 79 11 90 590.000 700.000
3 Geodesy and cadastre 39 7 46 590.000 700.000
4 Construction and operation of water
systems
21 10 31 590.000 700.000
5 Construction, control and operation of
transportation means
36 6 42 590.000 700.000
6 Industrial and civilian construction 75 25 100 590.000 700.000
7 Urban economy and supply of thermo-
gas
36 6 42 590.000 700.000

98
N0
Specialization The number of current part-
time students
Current education
fee (AMD)
Baccalaur
eate
Masters Total
number
of
students
Part-time Part-time Baccalau
reate
Masters
1 Production of construction materials,
structures and other constructional
products
4 2 6 472.000 560.000
2 Geodesy and cadastre 61 0 61 472.000 560.000
3 Construction and operation of water
systems
25 0 25 472.000 560.000
4 Construction, control and operation of
transportation means
45 0 45 472.000 560.000
5 Investigation of real estate and
management
15 0 15 472.000 560.000
6 Urban economy and supply of thermo-
gas
101 130 231 472.000 560.000
7 Informatics and computing technics 100 0 100 384.000 0
8 Management information systems 28 0 28 400.000 0
Total 379 132 511
Yerevan state college of informatics
Yerevan state vocational school №4
8 Informatics and computing technics 141 3 144 480.000 620.000
9 Management information systems 66 8 74 500.000 620.000
Total 506 82 588
Name of educational
program
The number of current full-
time and part-time students
Current educational fee
(AMD)
Mechatronics 90-100 210,000
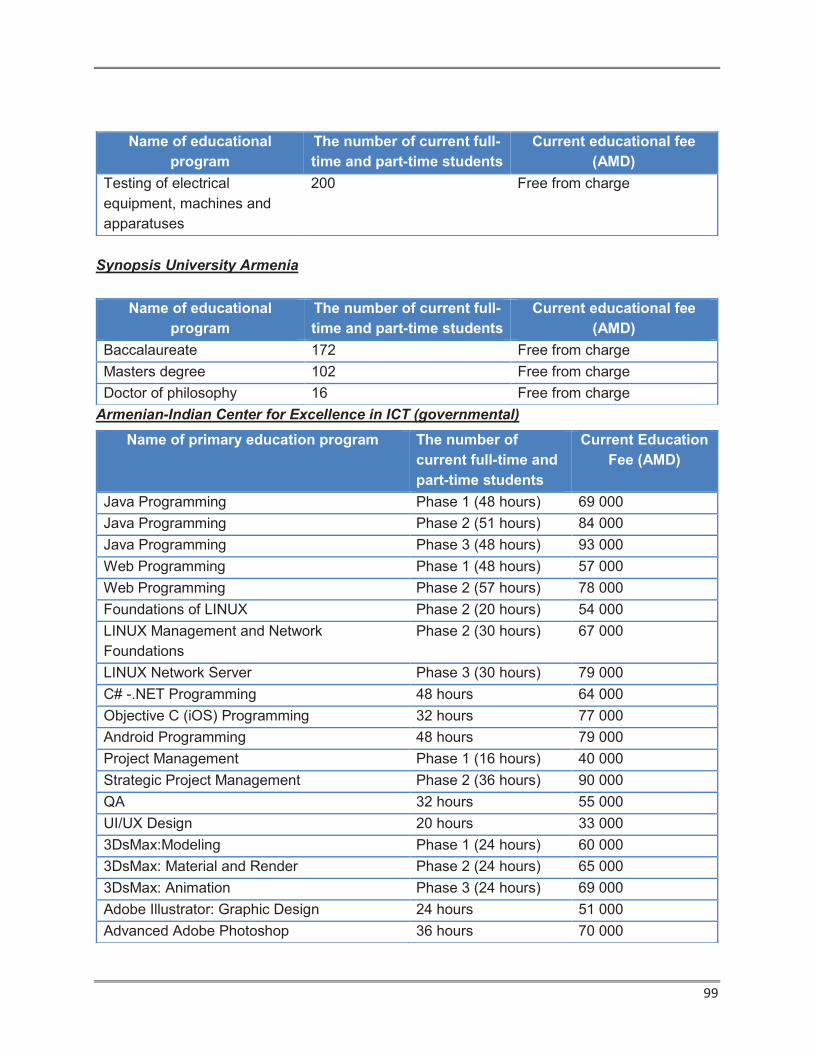
99
Synopsis University Armenia
Armenian-Indian Center for Excellence in ICT (governmental)
Name of educational
program
The number of current full-
time and part-time students
Current educational fee
(AMD)
Testing of electrical
equipment, machines and
apparatuses
200 Free from charge
Name of educational
program
The number of current full-
time and part-time students
Current educational fee
(AMD)
Baccalaureate 172 Free from charge
Masters degree 102 Free from charge
Doctor of philosophy 16 Free from charge
Name of primary education program The number of
current full-time and
part-time students
Current Education
Fee (AMD)
Java Programming Phase 1 (48 hours) 69 000
Java Programming Phase 2 (51 hours) 84 000
Java Programming Phase 3 (48 hours) 93 000
Web Programming Phase 1 (48 hours) 57 000
Web Programming Phase 2 (57 hours) 78 000
Foundations of LINUX Phase 2 (20 hours) 54 000
LINUX Management and Network
Foundations
Phase 2 (30 hours) 67 000
LINUX Network Server Phase 3 (30 hours) 79 000
C# -.NET Programming 48 hours 64 000
Objective C (iOS) Programming 32 hours 77 000
Android Programming 48 hours 79 000
Project Management Phase 1 (16 hours) 40 000
Strategic Project Management Phase 2 (36 hours) 90 000
QA 32 hours 55 000
UI/UX Design 20 hours 33 000
3DsMax:Modeling Phase 1 (24 hours) 60 000
3DsMax: Material and Render Phase 2 (24 hours) 65 000
3DsMax: Animation Phase 3 (24 hours) 69 000
Adobe Illustrator: Graphic Design 24 hours 51 000
Advanced Adobe Photoshop 36 hours 70 000
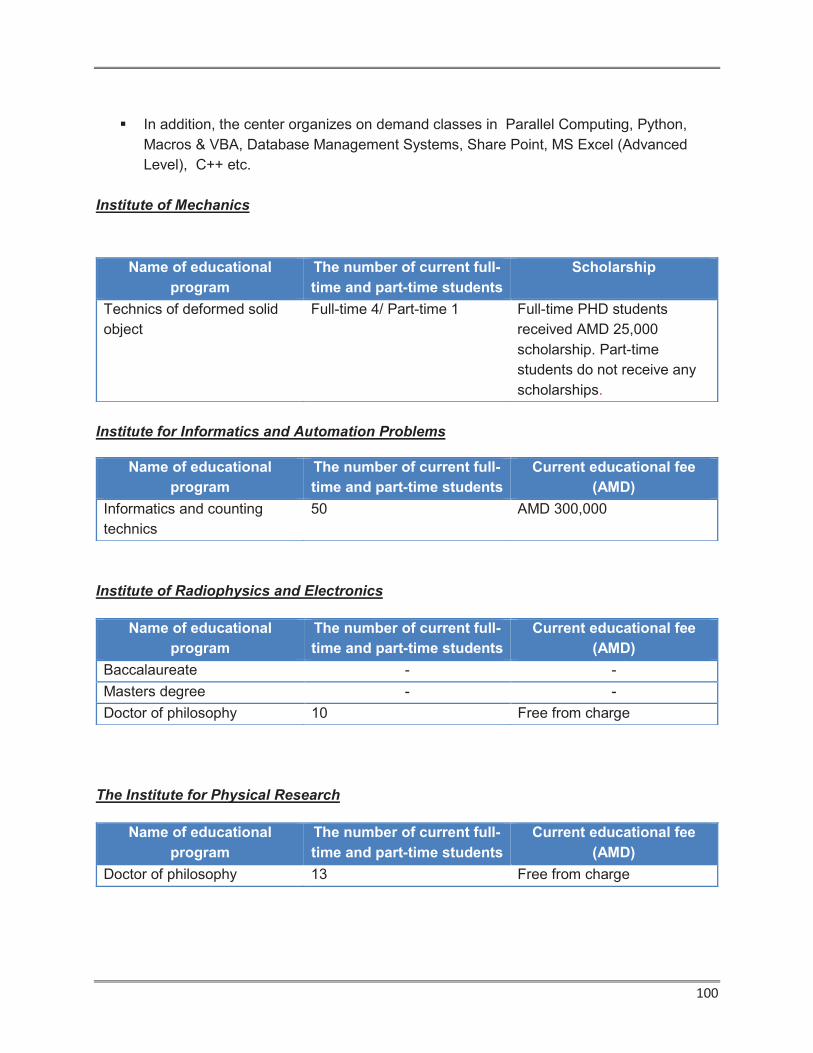
100
§ In addition, the center organizes on demand classes in Parallel Computing, Python,
Macros & VBA, Database Management Systems, Share Point, MS Excel (Advanced
Level), C++ etc.
Institute of Mechanics
Institute for Informatics and Automation Problems
Institute of Radiophysics and Electronics
The Institute for Physical Research
Name of educational
program
The number of current full-
time and part-time students
Scholarship
Technics of deformed solid
object
Full-time 4/ Part-time 1 Full-time PHD students
received AMD 25,000
scholarship. Part-time
students do not receive any
scholarships.
Name of educational
program
The number of current full-
time and part-time students
Current educational fee
(AMD)
Informatics and counting
technics
50 AMD 300,000
Name of educational
program
The number of current full-
time and part-time students
Current educational fee
(AMD)
Baccalaureate - -
Masters degree - -
Doctor of philosophy 10 Free from charge
Name of educational
program
The number of current full-
time and part-time students
Current educational fee
(AMD)
Doctor of philosophy 13 Free from charge
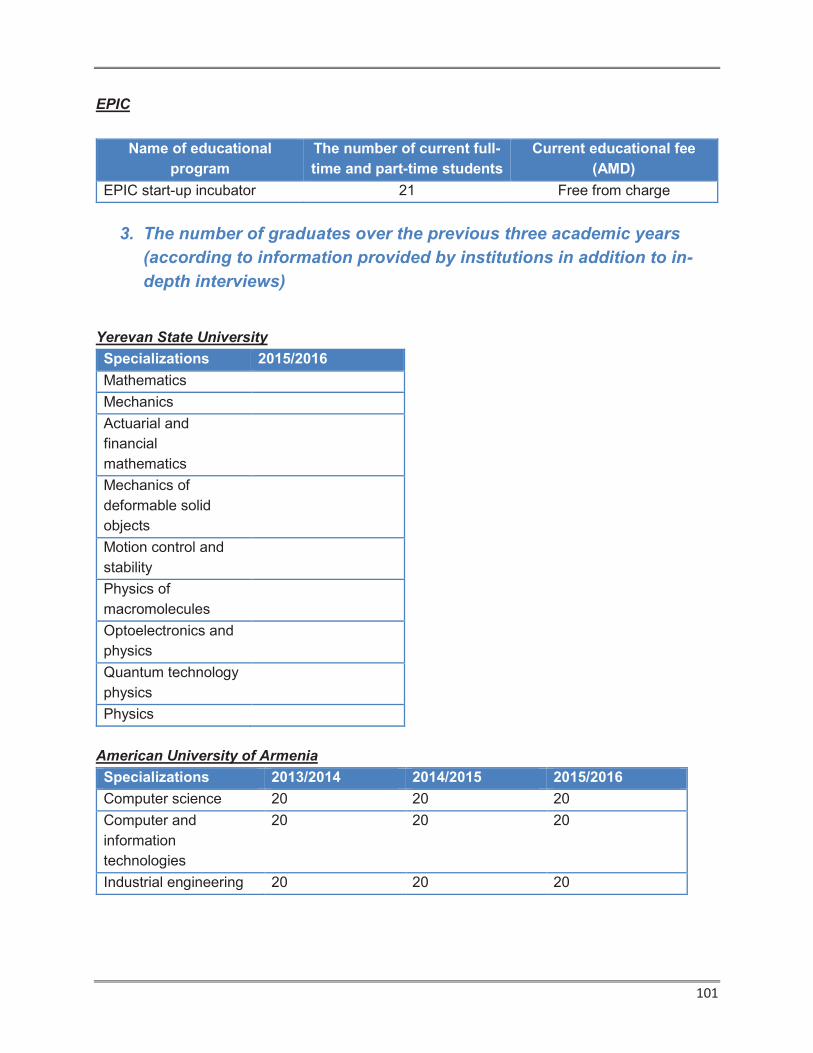
101
EPIC
3. The number of graduates over the previous three academic years
(according to information provided by institutions in addition to in-
depth interviews)
Yerevan State University
Specializations 2015/2016
Mathematics
Mechanics
Actuarial and
financial
mathematics
Mechanics of
deformable solid
objects
Motion control and
stability
Physics of
macromolecules
Optoelectronics and
physics
Quantum technology
physics
Physics
American University of Armenia
Specializations 2013/2014 2014/2015 2015/2016
Computer science 20 20 20
Computer and
information
technologies
20 20 20
Industrial engineering 20 20 20
Name of educational
program
The number of current full-
time and part-time students
Current educational fee
(AMD)
EPIC start-up incubator 21 Free from charge
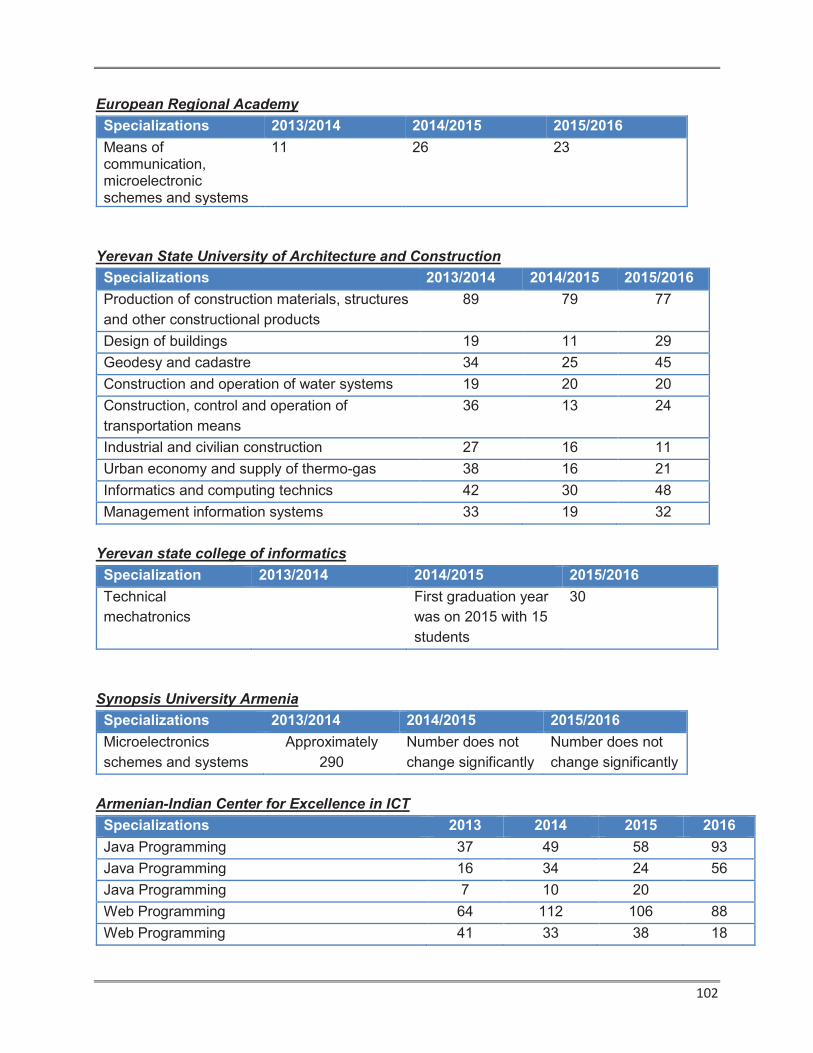
102
European Regional Academy
Specializations 2013/2014 2014/2015 2015/2016
Means of communication, microelectronic schemes and systems
11 26 23
Yerevan State University of Architecture and Construction
Specializations 2013/2014 2014/2015 2015/2016
Production of construction materials, structures
and other constructional products
89 79 77
Design of buildings 19 11 29
Geodesy and cadastre 34 25 45
Construction and operation of water systems 19 20 20
Construction, control and operation of
transportation means
36 13 24
Industrial and civilian construction 27 16 11
Urban economy and supply of thermo-gas 38 16 21
Informatics and computing technics 42 30 48
Management information systems 33 19 32
Yerevan state college of informatics
Specialization 2013/2014 2014/2015 2015/2016
Technical
mechatronics
First graduation year
was on 2015 with 15
students
30
Synopsis University Armenia
Specializations 2013/2014 2014/2015 2015/2016
Microelectronics
schemes and systems
Approximately
290
Number does not
change significantly
Number does not
change significantly
Armenian-Indian Center for Excellence in ICT
Specializations 2013 2014 2015 2016
Java Programming 37 49 58 93
Java Programming 16 34 24 56
Java Programming 7 10 20
Web Programming 64 112 106 88
Web Programming 41 33 38 18
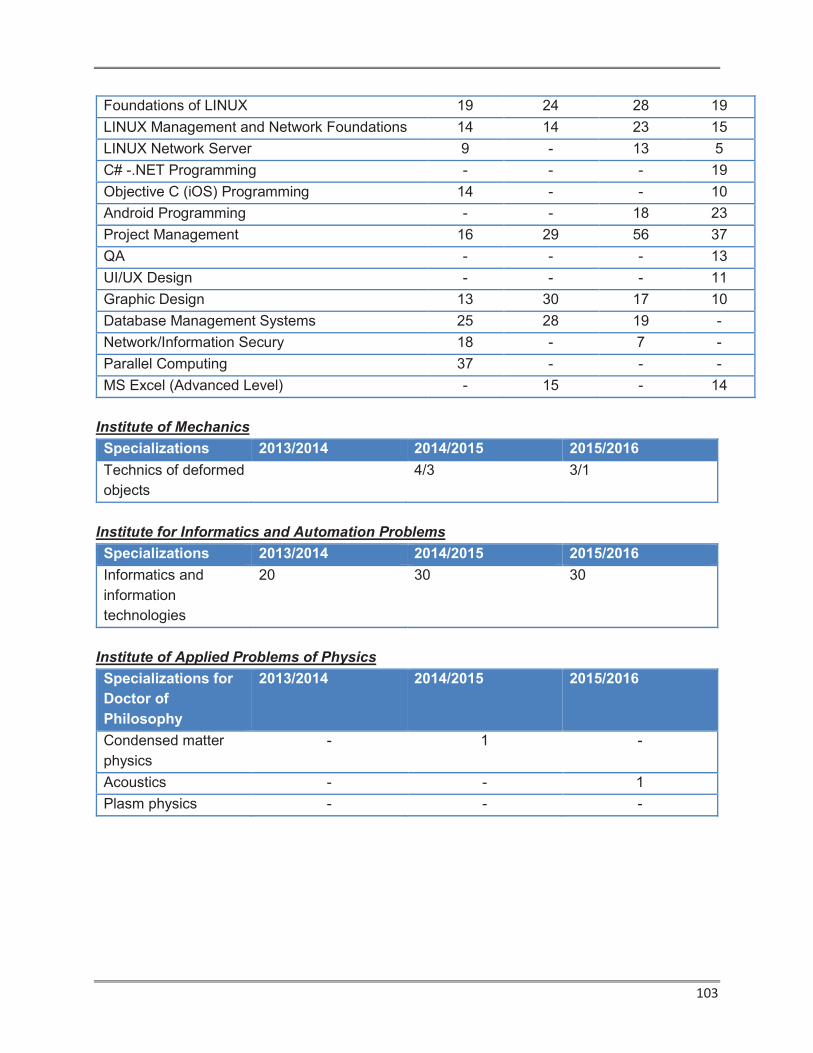
103
Foundations of LINUX 19 24 28 19
LINUX Management and Network Foundations 14 14 23 15
LINUX Network Server 9 - 13 5
C# -.NET Programming - - - 19
Objective C (iOS) Programming 14 - - 10
Android Programming - - 18 23
Project Management 16 29 56 37
QA - - - 13
UI/UX Design - - - 11
Graphic Design 13 30 17 10
Database Management Systems 25 28 19 -
Network/Information Secury 18 - 7 -
Parallel Computing 37 - - -
MS Excel (Advanced Level) - 15 - 14
Institute of Mechanics
Specializations 2013/2014 2014/2015 2015/2016
Technics of deformed
objects
4/3 3/1
Institute for Informatics and Automation Problems
Specializations 2013/2014 2014/2015 2015/2016
Informatics and
information
technologies
20 30 30
Institute of Applied Problems of Physics
Specializations for
Doctor of
Philosophy
2013/2014 2014/2015 2015/2016
Condensed matter
physics
- 1 -
Acoustics - - 1
Plasm physics - - -
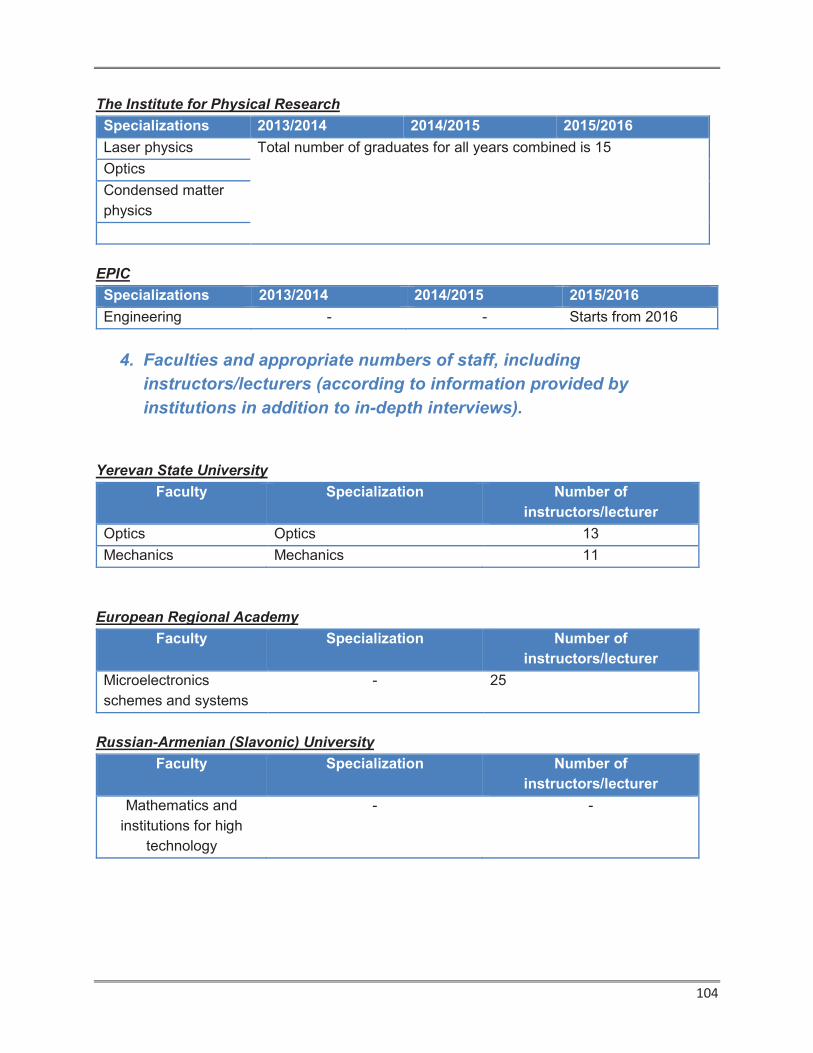
104
The Institute for Physical Research
Specializations 2013/2014 2014/2015 2015/2016
Laser physics Total number of graduates for all years combined is 15
Optics
Condensed matter
physics
EPIC
Specializations 2013/2014 2014/2015 2015/2016
Engineering - - Starts from 2016
4. Faculties and appropriate numbers of staff, including
instructors/lecturers (according to information provided by
institutions in addition to in-depth interviews).
Yerevan State University
Faculty Specialization Number of
instructors/lecturer
Optics Optics 13
Mechanics Mechanics 11
European Regional Academy
Faculty Specialization Number of
instructors/lecturer
Microelectronics
schemes and systems
- 25
Russian-Armenian (Slavonic) University
Faculty Specialization Number of
instructors/lecturer
Mathematics and
institutions for high
technology
- -

105
Yerevan state college of informatics
Faculty Specialization Number of
instructors/lecturer
Mechatronics Technician-mechatronic 10
Synopsis University Armenia
Faculty Specialization Number of
instructors/lecturer
Microelectronics
schemes and systems
Microelectronics schemes and
systems
60
Institute for Informatics and Automation Problems
Faculty Specialization Number of
instructors/lecturer
Informatics and
counting technics
Informatics and counting
technics
20
Institute of Applied Problems of Physics
Faculty Specialization Number of
instructors/lecturer
Laboratory of X-ray
optics in collaboration
with Polytechnic
University of Tomsk
- 17
Laboratory named after
Alpik Rafayelovich in
Artsakh State University
Condensed matter physics,
acoustics, physics of acoustics
5
Laboratory of photons
and basic particles in
collaboration with
Belgorod University
Nuclear physics, Condensed
matter physics, chemistry and
applied physics
15
The Institute for Physical Research
Faculty Specialization Number of
instructors/lecturer
Quantum and optical
electronics
Laser physics, optics,
Condensed matter physics
6