supporting information · 3 s27 cv response of receptor r4 with cn-ion 31 s28 optimized structure...
TRANSCRIPT

1
Benzoquinone-imidazole hybrids as selective colorimetric sensors for cyanide
in aqueous, solid and gas phases
Ramalingam Manivannana, Samuele Ciattini
b, Laura Chelazzi
b, and Kuppanagounder P. Elango
a*
aDepartment of Chemistry, Gandhigram Rural Institute- Deemed University, Gandhigram-
624302, India.
bCentro di Cristallografia Strutturale, Università degli studi di Firenze, 50019, Sesto Fiorentino
(Fi), Italy
Supporting Information
Figure
No.
Content
Page No.
S1 The packing diagram of (A) R5 and (B) R5-CN-
complex 4
S2 Color change of R1-R4 with various anions
5
S3 Color changes observed for R5 at different pH
values 6
S4 UV-Vis spectra of R1
7
S5 UV-Vis spectra of R2
8
S5 UV-Vis spectra of R3
9
S7 UV-Vis spectra of R4
10
S8 UV-Vis absorption changes of R5 with cyanide
ion in presence of other anions 11
S9 UV-Vis absorption changes of R5 with various
cations 12
S10 Job’s plots for the receptor-cyanide complexes
13
S11 Fluorescence emission spectra of R1
14
Electronic Supplementary Material (ESI) for RSC Advances.This journal is © The Royal Society of Chemistry 2015

2
S12 Fluorescence emission spectra of R2
15
S13 Fluorescence emission spectra of R3 16
S14 Fluorescence emission spectra of R4
17
Table S1
1H NMR spectral data for the interaction of the
receptors with CN−
18
S15 1H NMR spectrum of R1 with addition of 0.5 eqv.
of CN- ion in DMSO-d6
19
S16 1H NMR spectrum of R1 with addition of 2.0 eqv.
of CN- ion in DMSO-d6
20
S17 1H NMR spectrum of R2 with addition of 0.5 eqv.
of CN- ion in DMSO-d6
21
S18 1H NMR spectrum of R2 with addition of 2.0 eqv.
of CN- ion in DMSO-d6
22
S19 1H NMR spectrum of R3 with addition of 0.5 eqv.
of CN- ion in DMSO-d6
23
S20 1H NMR spectrum of R3 with addition of 2.0 eqv.
of CN- ion in DMSO-d6
24
S21 1H NMR spectrum of R4 with addition of 0.5 eqv.
of CN- ion in DMSO-d6
25
S22 1H NMR spectrum of R4 with addition of 2.0 eqv.
of CN- ion in DMSO-d6
26
S23 Correlation between association constant (KA) and
chemical shift (δH)
27
S24 CV response of receptor R1 with CN- ion
28
S25 CV response of receptor R2 with CN- ion
29
S26 CV response of receptor R3 with CN- ion 30

3
S27 CV response of receptor R4 with CN- ion 31
S28 Optimized structure for receptors R1-R5 and its
Cyanide complexes
32
S29 Molecular orbitals (HOMO–LUMO) of receptors
R1-R5
33
S30 Molecular orbitals (HOMO –LUMO) of
receptors–CN- complexes
34
Table S2 Energies (in eV) of the MOs in free receptors and
in receptor-CN- complexes
35
S31 1H NMR spectrum of 1
36
S32 13
C NMR spectrum of 1
37
S33 LCMS spectrum of 1
38
S34 1H NMR spectrum of R1
39
S35 LCMS spectrum of R1
40
S36 1H NMR spectrum of R2
41
S37 LCMS spectrum of R2
42
S38 1H NMR spectrum of R3
43
S39 LCMS spectrum of R3
44
S40 1H NMR spectrum of R4
45
S41 LCMS spectrum of R4
46
S42 1H NMR spectrum of R5
47
S43 LCMS spectrum of R5
48

4
Figure S1. The packing diagram of (A) R5 and (B) R5-CN-.
A
B

5
Figure S2. Color changes observed in DMF solution of R1-R4 (6.25x10⁻⁴
M) upon addition of
various anions.

6
Figure S3. Color changes observed for R5 at different pH values: A) free R5 and B) after the
addition of cyanide ion.

7
Figure S4. UV-Vis spectra of R1 (6.25x10⁻⁴
M) with the incremental addition of TBACN (0 -
6.25x10⁻⁷
M) in aq. HEPES buffer-DMF (9:1 v/v) medium (pH = 7.26).

8
Figure S5. UV-Vis spectra of R2 (6.25x10⁻⁴
M) with the incremental addition of TBACN (0 -
6.25x10⁻⁶
M) in aq. HEPES buffer-DMF (9:1 v/v) medium (pH = 7.26).

9
Figure S6. UV-Vis spectra of R3 (6.25x10⁻⁴
M) with the incremental addition of TBACN (0 -
6.25x10⁻⁶
M) in aq. HEPES buffer-DMF (9:1 v/v) medium (pH = 7.26).

10
Figure S7. UV-Vis spectra of R4 (6.25x10⁻⁴
M) with the incremental addition of TBACN (0 -
6.25x10⁻⁶
M) in aq. HEPES buffer-DMF (9:1 v/v) medium (pH = 7.26).

11
Figure S8. UV-Vis absorption changes of R5 with cyanide ion in presence of other anions.

12
Figure S9. UV-Vis absorption changes of R5 (6.25x10⁻⁴
M) upon addition of 1 eqv. of Ag+,
Ca2+
, Cu2+
, Fe3+
, Mg2+
, Co2+
, Zn2+
and Ni2+
.

13
Figure 10. Job’s plots for the receptor-cyanide complexes.

14
Figure S11. Fluorescence emission spectra of R1 (6.25x10⁻⁴
M) with incremental addition of
TBACN (0 - 6.25x10⁻⁶
M) in aq. HEPES buffer-DMF (9:1 v/v) medium (pH = 7.26).
15
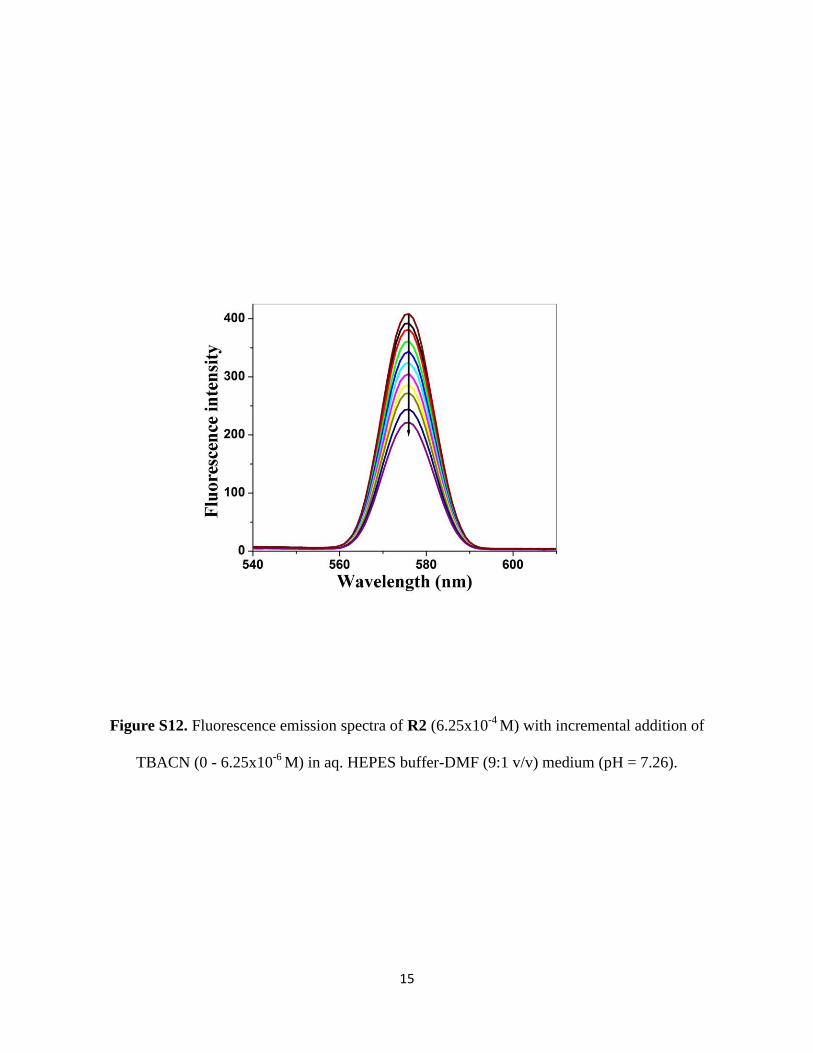
Figure S12. Fluorescence emission spectra of R2 (6.25x10⁻⁴
M) with incremental addition of
TBACN (0 - 6.25x10⁻⁶
M) in aq. HEPES buffer-DMF (9:1 v/v) medium (pH = 7.26).

16
Figure S13. Fluorescence emission spectra of R3 (6.25x10⁻⁴
M) with incremental addition of
TBACN (0 - 6.25x10⁻⁶
M) in aq. HEPES buffer-DMF (9:1 v/v) medium (pH = 7.26).

17
Figure S14. Fluorescence emission spectra of R4 (6.25x10⁻⁴
M) with incremental addition of
TBACN (0 - 6.25x10⁻⁶
M) in aq. HEPES buffer-DMF (9:1 v/v) medium (pH = 7.26).

18
Table S1. 1H NMR spectral data for the interaction of the receptors with CN
−
* After the addition of 0.5 equivalents of CN- ion.
Receptor δN-H in free
receptor
δN-H in
complex*
∆δ (ppm)
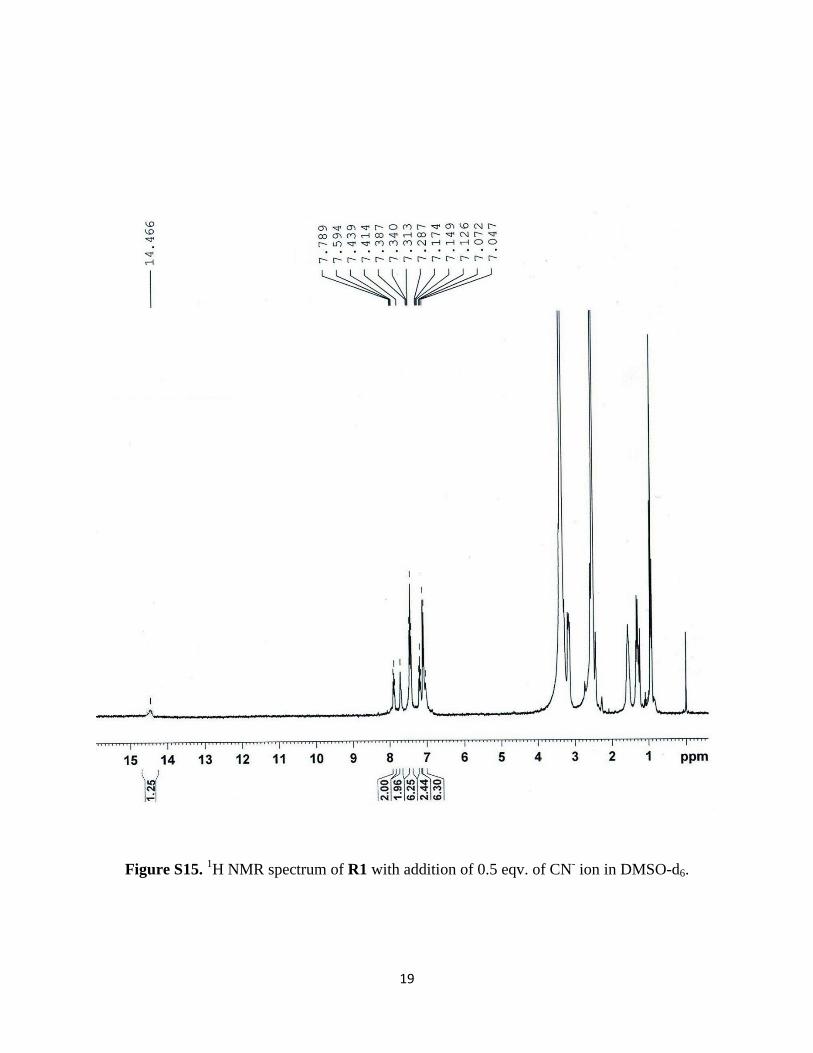
R1 14.324 14.466 0.142
R2 14.276 14.379 0.103
R3 14.213 14.316 0.103
R4 14.132 14.245 0.113
R5 13.400 13.534 0.134
19
Figure S15. 1H NMR spectrum of R1 with addition of 0.5 eqv. of CN
- ion in DMSO-d6.

20
Figure S16. 1H NMR spectrum of R1 with addition of 2.0 eqv. of CN
- ion in DMSO-d6.

21
Figure S17. 1H NMR spectrum of R2 with addition of 0.5 eqv. of CN
- ion in DMSO-d6.

22
Figure S18. 1H NMR spectrum of R2 with addition of 2.0 eqv. of CN
- ion in DMSO-d6.

23
Figure S19. 1H NMR spectrum of R3 with addition of 0.5 eqv. of CN
- ion in DMSO-d6.

24
Figure S20. 1H NMR spectrum of R3 with addition of 2.0 eqv. of CN
- ion in DMSO-d6.

25
Figure S21. 1H NMR spectrum of R4 with addition of 0.5 eqv. of CN
- ion in DMSO-d6.

26
Figure S22. 1H NMR spectrum of R4 with addition of 2.0 eqv. of CN
- ion in DMSO-d6.

27
Figure S23. Correlation between association constant (KA) and chemical shift (δH).

28
Figure S24. CV response of receptor R1 with CN- ion.

29
Figure S25. CV response of receptor R2 with CN- ion.

30
Figure S26. CV response of receptor R3 with CN- ion.

31
Figure S27. CV response of receptor R4 with CN- ion.

32
Figure S28. Optimized structure for receptors R1-R5 and its Cyanide complexes.
R5 R5-CN-

33
Figure S29. Molecular orbitals (HOMO–LUMO) of receptors R1-R5.

34
Figure S30. Molecular orbitals (HOMO –LUMO) of receptors–CN- complexes.

35
Table S2. Energies (in eV) of the MOs in free receptors and in receptor-CN- complexes
Receptor Free receptor Receptor-CN- complex
EHOMO ELUMO ΔE EHOMO ELUMO ΔE
R1 -6.3305 -3.3908 2.9397 -6.720 -5.6951 1.0569
R2 -6.2472 -3.3932 2.8540 -6.8257 -5.7136 1.1121
R3 -6.0975 -3.3818 2.7157 -6.3136 -5.3343 0.9793
R4 -6.3990 -3.3897 3.0093 -6.9245 -5.7152 1.2093
R5 -6.8004 -3.2738 3.5266 -7.9955 -6.4872 1.5083

36
Figure S31. 1H NMR spectrum of 1

37
Figure S32. 13
C NMR spectrum of 1

38
Figure S33. LCMS spectrum of 1

39
Figure S34. 1H NMR spectrum of R1.

40
Figure S35. LCMS spectrum of R1.

41
Figure S36. 1H NMR spectrum of R2.

42
Figure S37. LCMS spectrum of R2.

43
Figure S38. 1H NMR spectrum of R3.
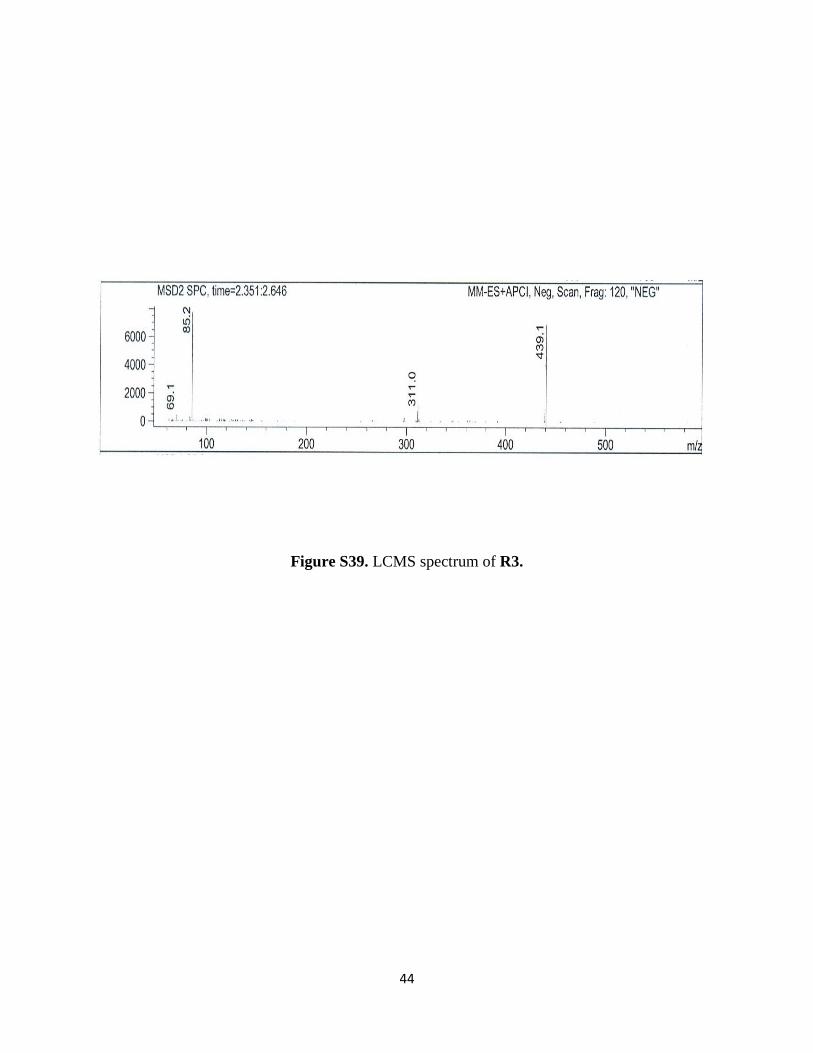
44
Figure S39. LCMS spectrum of R3.

45
Figure S40. 1H NMR spectrum of R4.
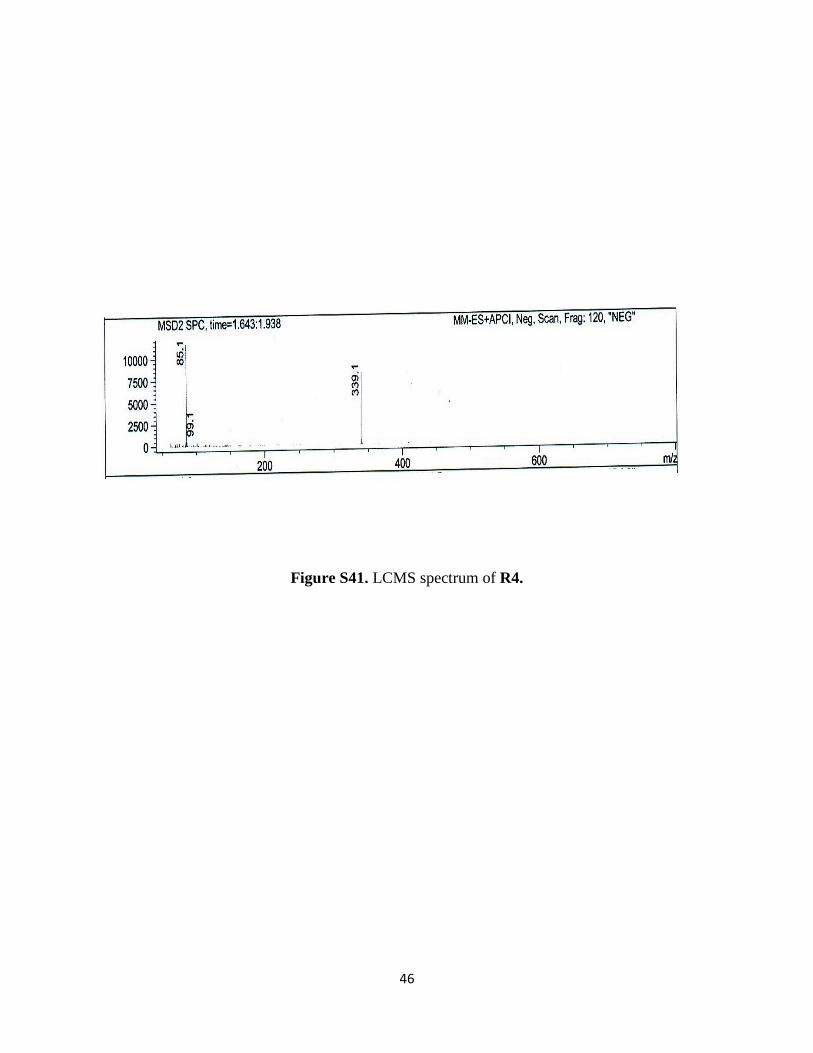
46
Figure S41. LCMS spectrum of R4.

47
Figure S42. 1H NMR spectrum of R5.
48
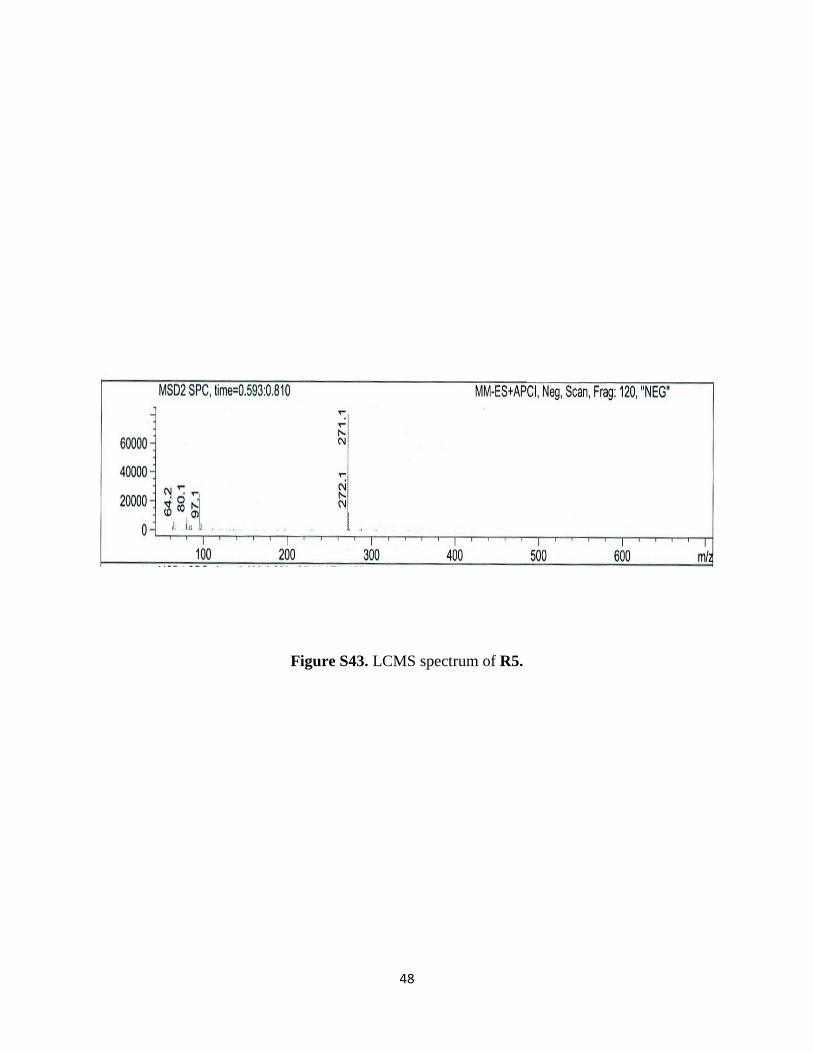
Figure S43. LCMS spectrum of R5.