supporting college and career readiness: moving to the common core standards in nyc district 25 cec...
TRANSCRIPT

Supporting College and CareerReadiness:
Moving to the Common Core Standards in NYC
District 25 CEC Public MeetingOctober 2011
2
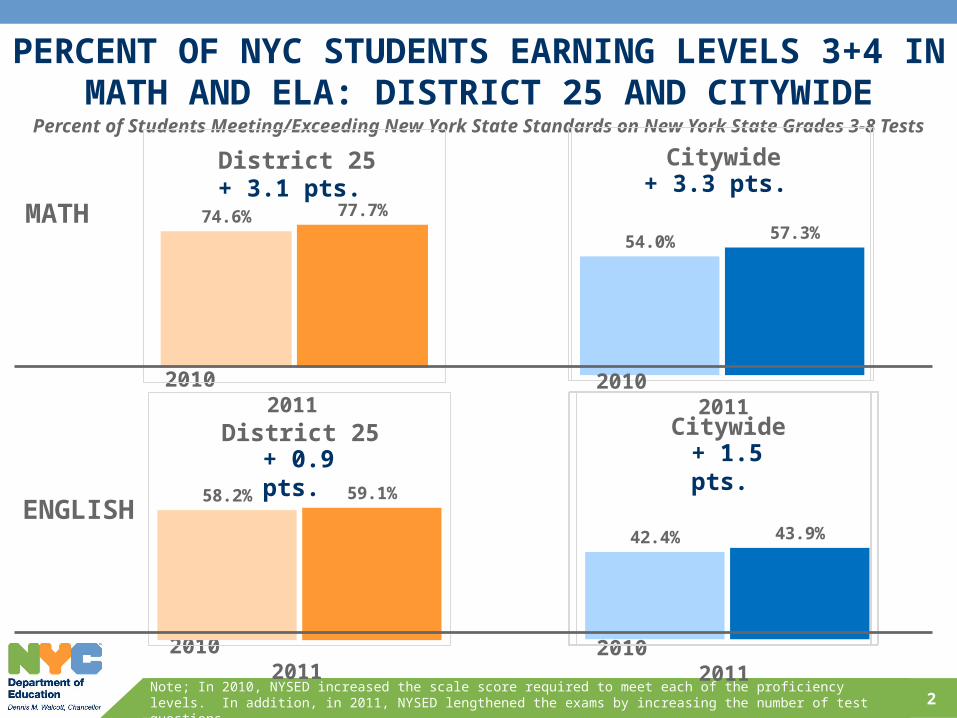
Percent of Students Meeting/Exceeding New York State Standards on New York State Grades 3-8 Tests
Note; In 2010, NYSED increased the scale score required to meet each of the proficiency levels. In addition, in 2011, NYSED lengthened the exams by increasing the number of test questions.
PERCENT OF NYC STUDENTS EARNING LEVELS 3+4 IN MATH AND ELA: DISTRICT 25 AND CITYWIDE
Citywide
ENGLISH
District 25
2010 2011
+ 3.3 pts.
54.0% 57.3%
2010 2011
+ 3.1 pts. MATH
2010 2011
2010 2011
74.6% 77.7%
+ 0.9 pts.
58.2% 59.1%
+ 1.5 pts.
42.4% 43.9%
CitywideDistrict 25
3
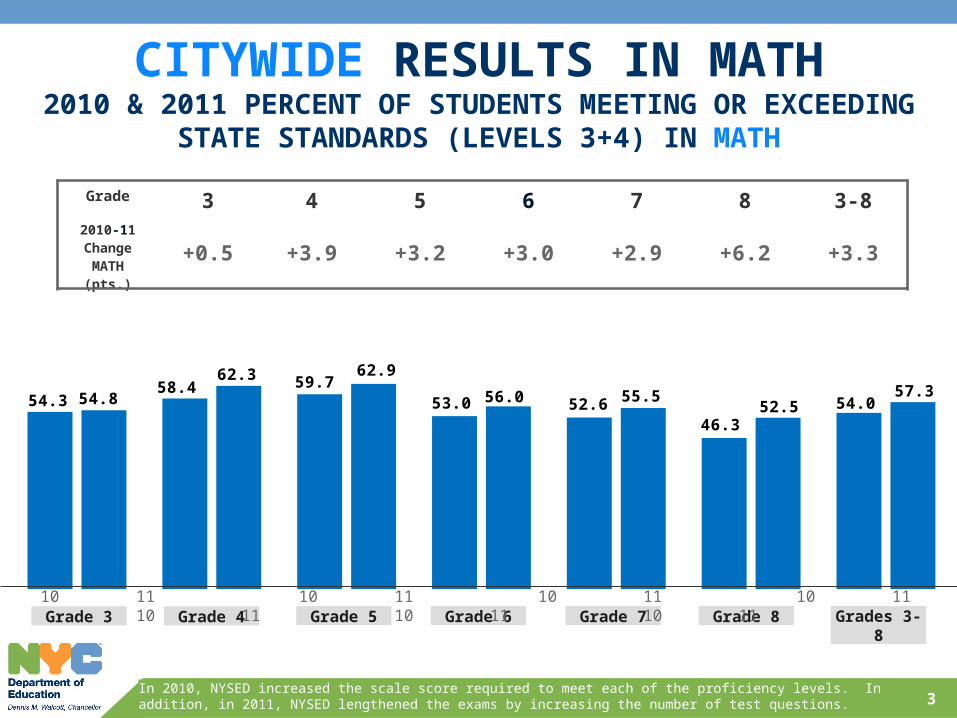
54.358.4 59.7
53.0 52.646.3
54.054.8
62.3 62.9
56.0 55.552.5
57.3
Grade 3 Grade 4 Grade 5 Grade 6 Grade 7 Grade 8 Grades 3-8
CITYWIDE RESULTS IN MATH2010 & 2011 PERCENT OF STUDENTS MEETING OR EXCEEDING
STATE STANDARDS (LEVELS 3+4) IN MATH
Grade 3 4 5 6 7 8 3-82010-11 Change
MATH (pts.)+0.5 +3.9 +3.2 +3.0 +2.9 +6.2 +3.3
10 11 10 11 10 11 10 11 10 11 10 11 10 11
In 2010, NYSED increased the scale score required to meet each of the proficiency levels. In addition, in 2011, NYSED lengthened the exams by increasing the number of test questions.
4
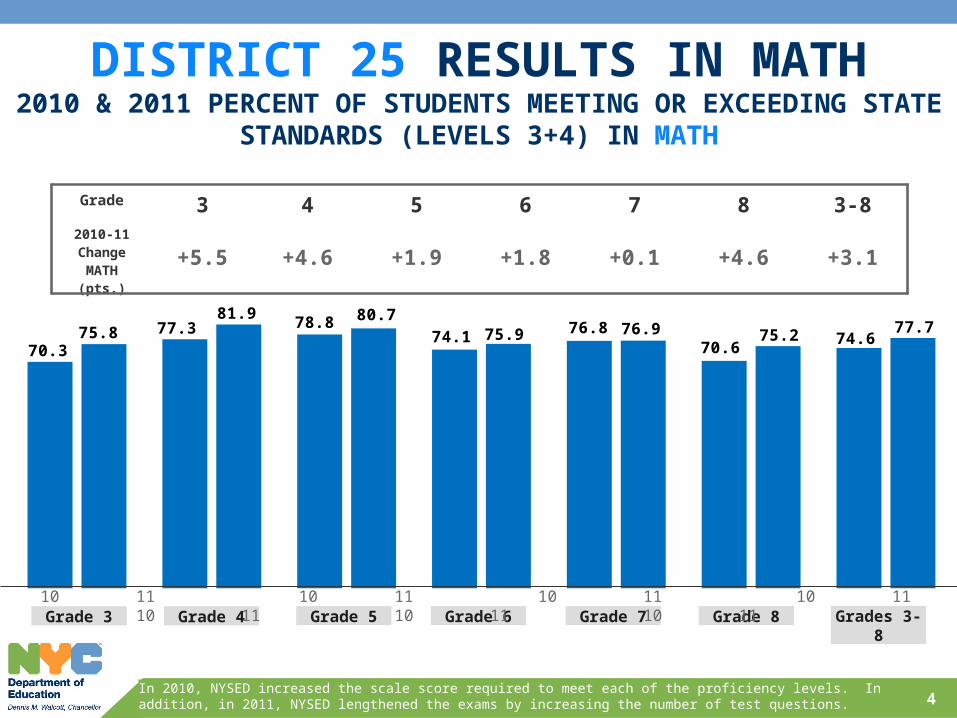
70.3
77.3 78.874.1
76.870.6
74.675.881.9 80.7
75.9 76.9 75.2 77.7
Grade 3 Grade 4 Grade 5 Grade 6 Grade 7 Grade 8 Grades 3-8
DISTRICT 25 RESULTS IN MATH2010 & 2011 PERCENT OF STUDENTS MEETING OR EXCEEDING STATE
STANDARDS (LEVELS 3+4) IN MATH
Grade 3 4 5 6 7 8 3-82010-11 Change
MATH (pts.)+5.5 +4.6 +1.9 +1.8 +0.1 +4.6 +3.1
10 11 10 11 10 11 10 11 10 11 10 11 10 11
In 2010, NYSED increased the scale score required to meet each of the proficiency levels. In addition, in 2011, NYSED lengthened the exams by increasing the number of test questions.

5
46.5 45.6 46.2
40.1 38.2 37.542.4
48.151.0 49.0
43.636.5 35.0
43.9
CITYWIDE RESULTS IN ENGLISH2010 & 2011 PERCENT OF STUDENTS MEETING OR EXCEEDING STATE
STANDARDS (LEVELS 3+4) IN ENGLISH
Grade 3 Grade 4 Grade 5 Grade 6 Grade 7 Grade 8 Grades 3-8
In 2010, NYSED increased the scale score required to meet each of the proficiency levels. In addition, in 2011, NYSED lengthened the exams by increasing the number of test questions.
10 11 10 11 10 11 10 11 10 11 10 11 10 11
Grade 3 4 5 6 7 8 3-82010-11 Change
ELA (pts)+1.6 +5.4 +2.8 +3.5 -1.7 -2.5 +1.5
6
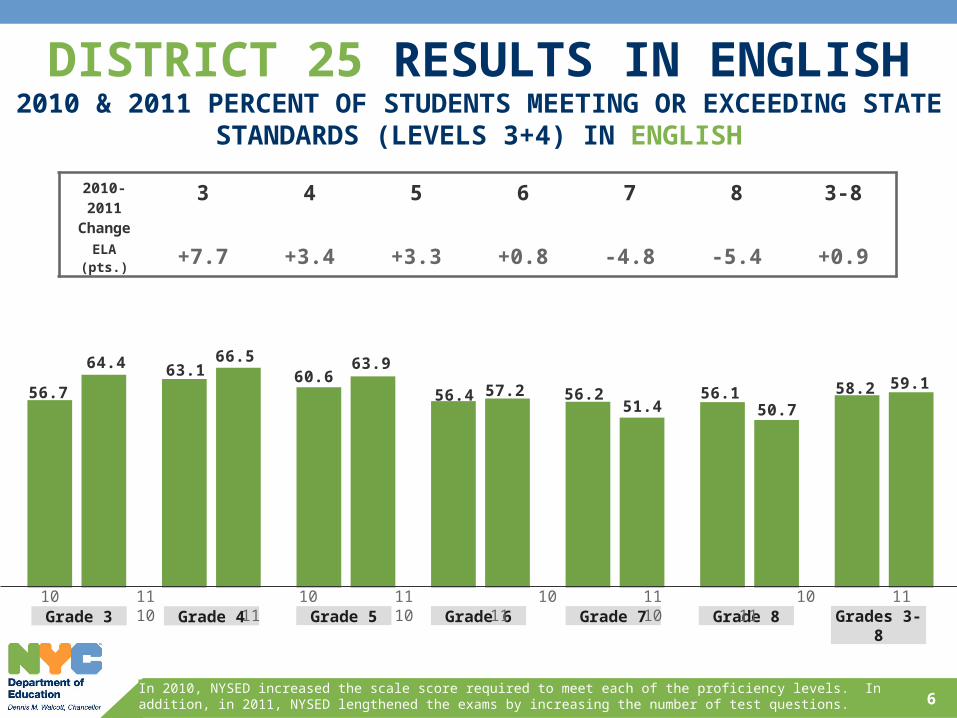
56.7
63.1 60.656.4 56.2 56.1 58.2
64.4 66.5 63.9
57.251.4 50.7
59.1
DISTRICT 25 RESULTS IN ENGLISH2010 & 2011 PERCENT OF STUDENTS MEETING OR EXCEEDING STATE
STANDARDS (LEVELS 3+4) IN ENGLISH
Grade 3 Grade 4 Grade 5 Grade 6 Grade 7 Grade 8 Grades 3-8
In 2010, NYSED increased the scale score required to meet each of the proficiency levels. In addition, in 2011, NYSED lengthened the exams by increasing the number of test questions.
10 11 10 11 10 11 10 11 10 11 10 11 10 11
2010-2011 Change
3 4 5 6 7 8 3-8
ELA (pts.) +7.7 +3.4 +3.3 +0.8 -4.8 -5.4 +0.9

In successful middle schools…> Literacy is a central focus across the curriculum> There is stable, high-quality leadership > Teams of teachers share responsibility for a manageable cohort of students> There is a strong culture, discipline, and academic routines> Every student and family is known well
But middle school performance has stagnated for years on state and national tests, especially in literacy
On September 20, Chancellor Walcott announced a new focus on middle schools:
> Create 50 new middle schools over the next 2 years> Re-focus our leadership pipeline efforts on middle school> Turn around or phase out the lowest-performing middle schools> Channel resources and supports to additional struggling middle schools> Spend $15M in Core Curriculum resources on nonfiction libraries for middle
schools
7
FOCUSING ON MIDDLE SCHOOL REFORM

47
44
4745 44
46
51 5048 48 48 48
50 50 50 51 5153 54
5860
62
6668
70
47
49
53
5659
616163
65
Percent of Students in a Cohort Graduating from High School in 4 Years
Class of
1992-2002: + 0% 2002-2010: + 37%1986-1992: + 9%
NYC Calculation Method NY State Calculation Method
Notes: NYC traditional calculation includes Local and Regents Diplomas, GEDs, Special Education diplomas, and August graduates. It does not include disabled students in self-contained classrooms or District 75 students. The NYS calculation, used since 2005, includes Local and Regents Diplomas and all disabled students. It does not include GEDs and Special Education diplomas.
2005-10
City Method: + 21%
State Method: + 30%
NY State Calculation Method (Including August Grads)
AFTER REMAINING NEARLY FLAT FOR 10 YEARS, NYC’S GRADUATION RATE HAS INCREASED BY 37% SINCE 2002
8
1986 1988 1990 1992 1994 1996 1998 2000 2002 2004 2006 2008 2010
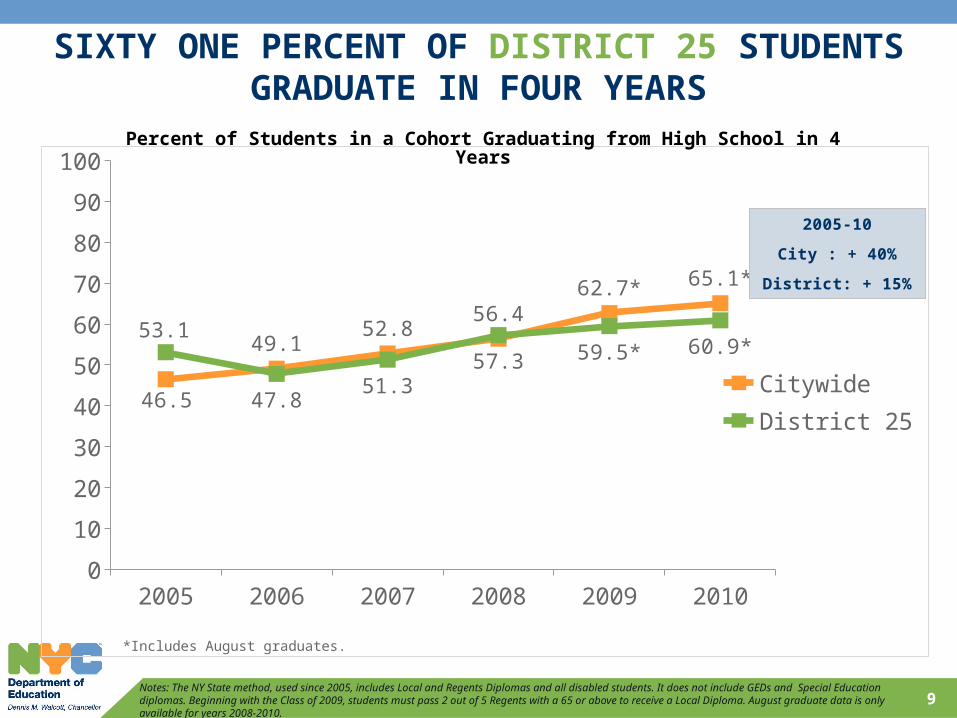
SIXTY ONE PERCENT OF DISTRICT 25 STUDENTS GRADUATE IN FOUR YEARS
2005 2006 2007 2008 2009 20100
10
20
30
40
50
60
70
80
90
100
46.5
49.152.8
56.462.7* 65.1*
53.1
47.851.3
57.3 59.5* 60.9*
CitywideDistrict 25
2005-10
City : + 40%
District: + 15%
9
Percent of Students in a Cohort Graduating from High School in 4 Years
Notes: The NY State method, used since 2005, includes Local and Regents Diplomas and all disabled students. It does not include GEDs and Special Education diplomas. Beginning with the Class of 2009, students must pass 2 out of 5 Regents with a 65 or above to receive a Local Diploma. August graduate data is only available for years 2008-2010.
*Includes August graduates.

2001 2002 2003 2004 August 2005 August 2006 August
16.6% 15.4% 15.6% 18.0% 16.5% 13.9%
17.5%
21.0% 21.8%
25.7% 29.9% 34.7%
12.5%12.7%
15.4%
17.0%16.3%
16.6%
Adv Regents
Regents
Local
10Note: Totals reflect data available at the time of reporting provided by NYS; August graduate data is only available for cohorts 2004-2006The overall rate may not equal the sum of each diploma type due to rounding. *Final year NYS did not include August graduates
AugustGraduation Rate
62.7 %
AugustGraduation Rate
60.7%
Graduation Rate52.8%*Graduation Rate
49.1%Graduation Rate46.5%
AugustGraduation Rate
65.1%
CITYWIDE MORE STUDENTS ARE EARNING REGENTS DIPLOMAS AFTER FOUR YEARS
Percent of Students in a Cohort Graduating from High School in 4 Years
Regents Diploma with Advanced Designation
RegentsDiploma
LocalDiploma
65+ on 2 of 5 Regents & 55+ on 3 of 5
65+ on 3 of 5 Regents & 55+ on 2 out of 5
5 Regents at 65+
55+ on 5 Regents
55+ on 5 Regents
55+ on 5 Regents
55+ on 5 Regents
5 Regents at 65+
5 Regents at 65+
5 Regents at 65+
5 Regents at 65+
5 Regents at 65+7-9 Regents at
65+
7-9 Regents at 65+
7-9 Regents at 65+
7-9 Regents at 65+
7-9 Regents at 65+7-9 Regents at
65+
Required Regents Exams are: English, Math, US History & Government, Global History, and Science; Additional Requirements for Regents with Advanced Designation: Science, Mathematics, and Language Other Than English (LOTE)
Class of ’05 Class of ’06 Class of ’07 Class of ’08 Class of ’09 Class of ’10
2001 2002 2003 2004 2005 August 2006 August
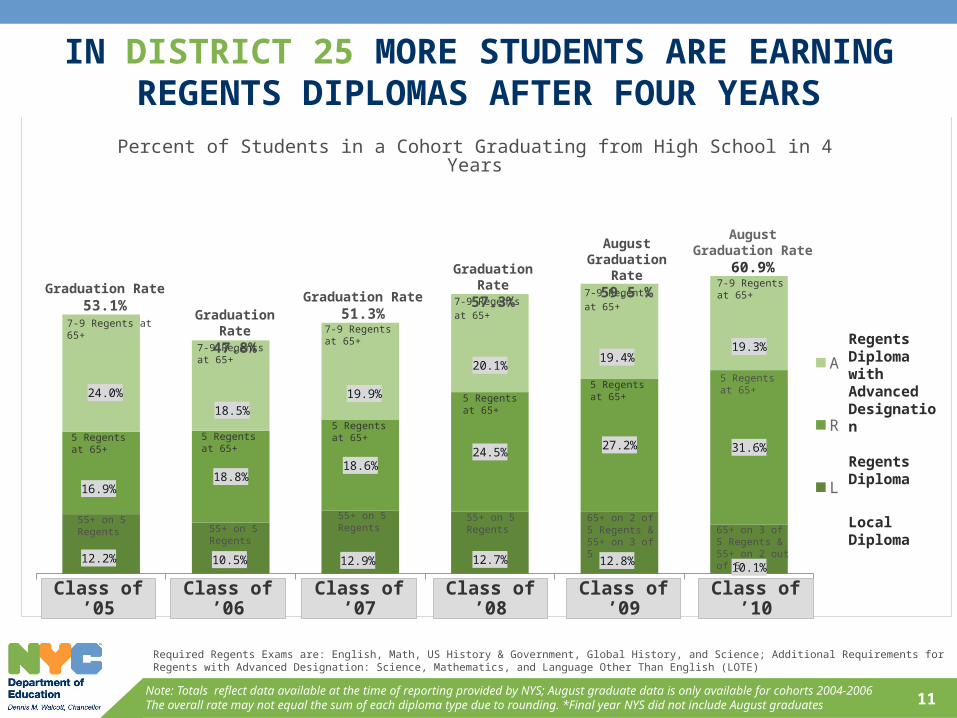
12.2% 10.5% 12.9% 12.7% 12.8%10.1%
16.9%18.8%
18.6%24.5%
27.2% 31.6%
24.0%
18.5%
19.9%
20.1%19.4%
19.3%
Adv Regents
Regents
Local
7-9 Regents at 65+
7-9 Regents at 65+
7-9 Regents at 65+
11Note: Totals reflect data available at the time of reporting provided by NYS; August graduate data is only available for cohorts 2004-2006The overall rate may not equal the sum of each diploma type due to rounding. *Final year NYS did not include August graduates
AugustGraduation Rate
59.5 %Graduation Rate57.3%
Graduation Rate51.3%Graduation Rate
47.8%
Graduation Rate53.1%
AugustGraduation Rate
60.9%
MORE STUDENTS ARE EARNING REGENTS DIPLOMAS AFTER FOUR YEARS
Percent of Students in a Cohort Graduating from High School in 4 Years
Regents Diploma with Advanced Designation
RegentsDiploma
LocalDiploma
65+ on 2 of 5 Regents & 55+ on 3 of 5
65+ on 3 of 5 Regents & 55+ on 2 out of 5
55+ on 5 Regents55+ on 5
Regents
55+ on 5 Regents
55+ on 5 Regents
5 Regents at 65+
5 Regents at 65+
5 Regents at 65+
5 Regents at 65+
5 Regents at 65+
5 Regents at 65+
7-9 Regents at 65+
7-9 Regents at 65+
7-9 Regents at 65+
7-9 Regents at 65+
Required Regents Exams are: English, Math, US History & Government, Global History, and Science; Additional Requirements for Regents with Advanced Designation: Science, Mathematics, and Language Other Than English (LOTE)
IN DISTRICT 25 MORE STUDENTS ARE EARNING REGENTS DIPLOMAS AFTER FOUR YEARS
Class of ’05 Class of ’06 Class of ’07 Class of ’08 Class of ’09 Class of ’10

12
COLLEGE READINESS: ENROLLMENT AT CUNY BY NYCDOE STUDENTS
Source: CUNY Office of Institutional Research and Assessment, init_remedial_need_by_hs_type.xlsx, 07/21/11. *Includes all students who report to CUNY that they have graduated from a NYC high school (at any point in time).
Total Number of DOE Graduates* Enrolling in CUNY as First Time Freshman
2002-10
Citywide
16,254 16,77818,665 19,298
20,93022,697
Senior Colleges Community Colleges
24,29425,589 25,033
Note: In 2010, CUNY saw a decrease in overall first-time freshman enrollment following a change in enrollment policy: from rolling admissions to a formalized application deadline.
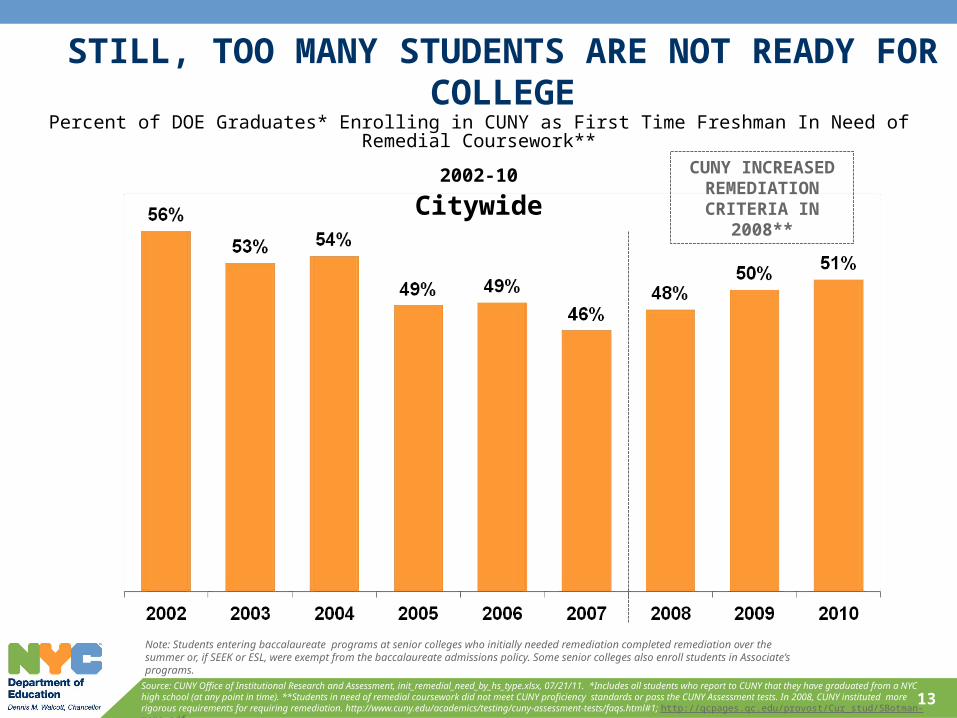
STILL, TOO MANY STUDENTS ARE NOT READY FOR COLLEGE
Percent of DOE Graduates* Enrolling in CUNY as First Time Freshman In Need of Remedial Coursework**
2002-10
Citywide
Source: CUNY Office of Institutional Research and Assessment, init_remedial_need_by_hs_type.xlsx, 07/21/11. *Includes all students who report to CUNY that they have graduated from a NYC high school (at any point in time). **Students in need of remedial coursework did not meet CUNY proficiency standards or pass the CUNY Assessment tests. In 2008, CUNY instituted more rigorous requirements for requiring remediation. http://www.cuny.edu/academics/testing/cuny-assessment-tests/faqs.html#1; http://qcpages.qc.edu/provost/Cur_stud/SBotman-memo.pdf
Note: Students entering baccalaureate programs at senior colleges who initially needed remediation completed remediation over the summer or, if SEEK or ESL, were exempt from the baccalaureate admissions policy. Some senior colleges also enroll students in Associate’s programs.
CUNY INCREASED REMEDIATION
CRITERIA IN 2008**
13

HIGHER EDUCATION LEVELS INCREASE INCOME OPPORTUNITIES
Most of the fastest-growing 21stcentury jobsrequire postsecondary degrees
Average income based on education levels:
14
High School Dropout $20,250
High School Diploma $27,960
2-year College Degree $36,400
4-year College Degree $48,100
Professional Degree $87,780
Goal: Prepare students to graduate from high school ready for college and careers
The Common Core standards are: > Aligned with college and workplace expectations > Focused on developing higher-order skills to solve complex
problems > In line with other high-performing countries > Based on evidence and research
New York State is one of 44 states to have adopted the Common Core State Standards
New York City is among the leading districts in the nation in beginning to integrate these standards into classrooms
15
THE COMMON CORE STATE STANDARDS INITIATIVE

The Common Core standards provide a clear roadmap for teachers, parents, and students about what students should know and be able to do at each grade level—from pre-K to 12
These new, higher standards will:
> Drive changes in curriculum
> Lead to new, more challenging state tests
> Require teachers to strengthen their classroom instruction to make sure students are on track for college and careers
16
WHY ARE THE COMMON CORE STANDARDS IMPORTANT?
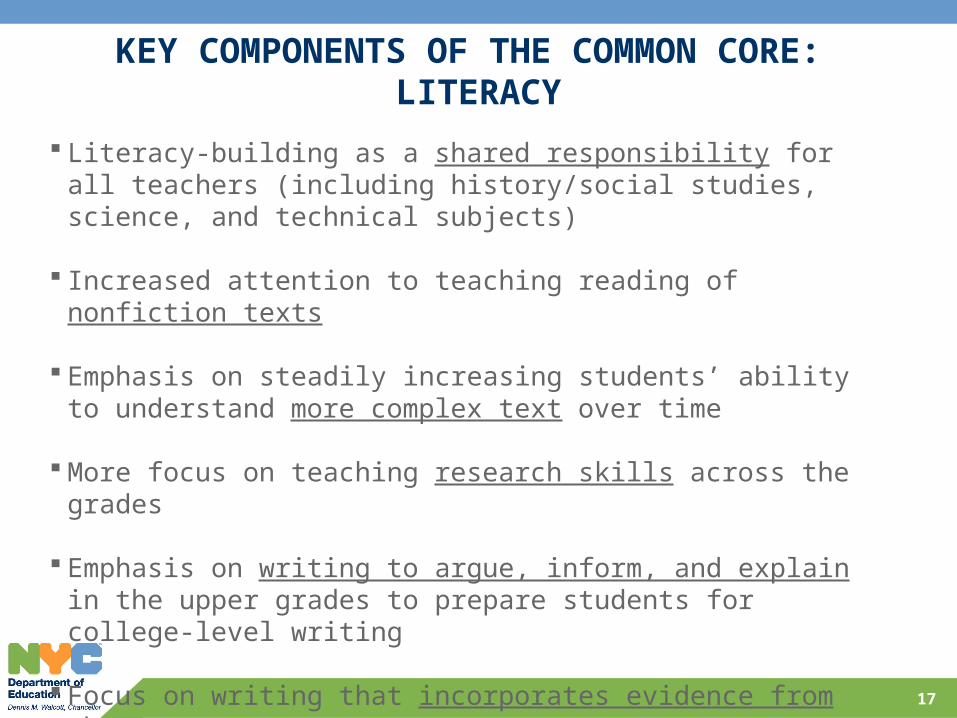
KEY COMPONENTS OF THE COMMON CORE: LITERACY
Literacy-building as a shared responsibility for all teachers (including history/social studies, science, and technical subjects)
Increased attention to teaching reading of nonfiction texts
Emphasis on steadily increasing students’ ability to understand more complex text over time
More focus on teaching research skills across the grades
Emphasis on writing to argue, inform, and explain in the upper grades to prepare students for college-level writing
Focus on writing that incorporates evidence from the text
17
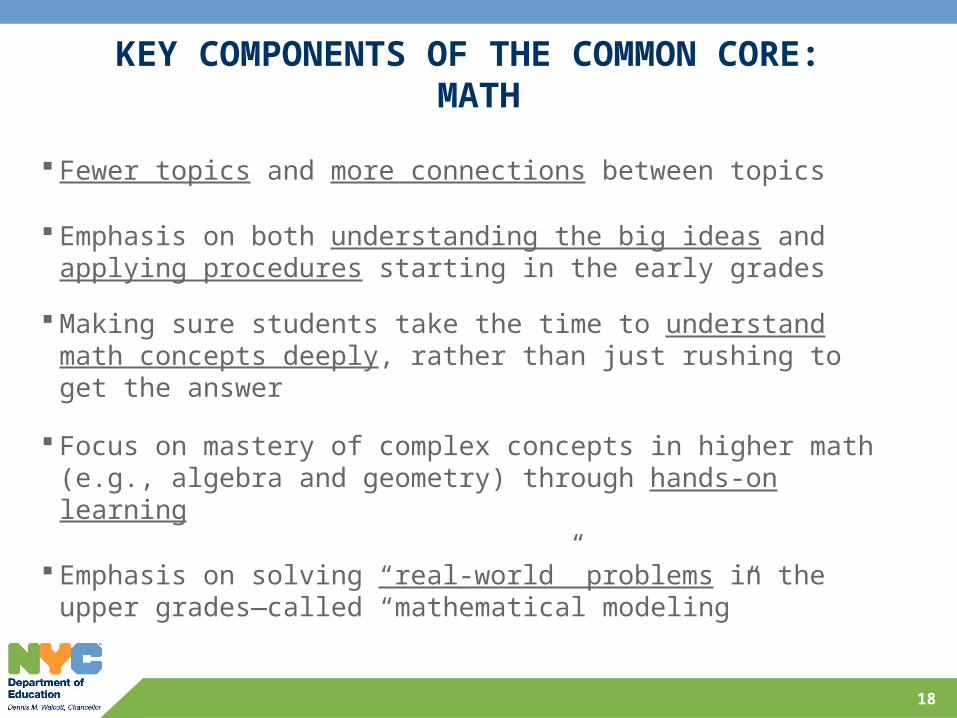
Fewer topics and more connections between topics
Emphasis on both understanding the big ideas and applying procedures starting in the early grades
Making sure students take the time to understand math concepts deeply, rather than just rushing to get the answer
Focus on mastery of complex concepts in higher math (e.g., algebra and geometry) through hands-on learning
Emphasis on solving “real-world” problems in the upper grades—called “mathematical modeling”
18
KEY COMPONENTS OF THE COMMON CORE: MATH

19
HOW NEW YORK STATE TESTS WILL CHANGE
New York and 24 other states are working together to develop new tests in English and math
This group is called the Partnership for Assessment of Readiness for College and Careers (PARCC)
2011-12 2012-13 2013-14 2014-15
NYS tests remain similar to 2010-11
NYS tests begin to integrate Common Core standards
NYS tests fully aligned to
Common Core standards
19
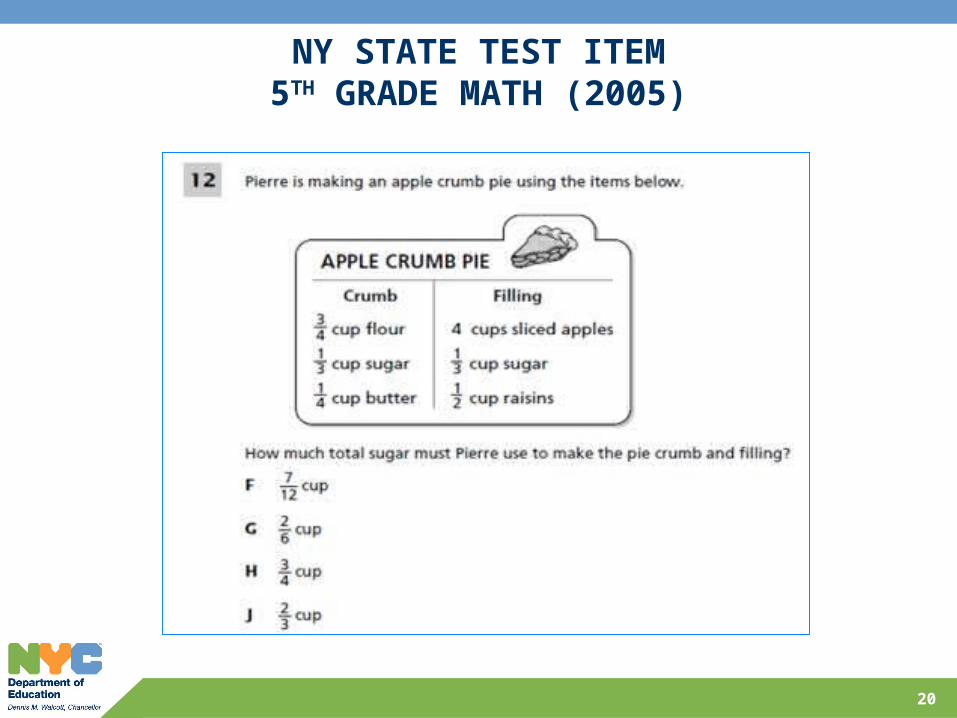
NY STATE TEST ITEM5TH GRADE MATH (2005)
20
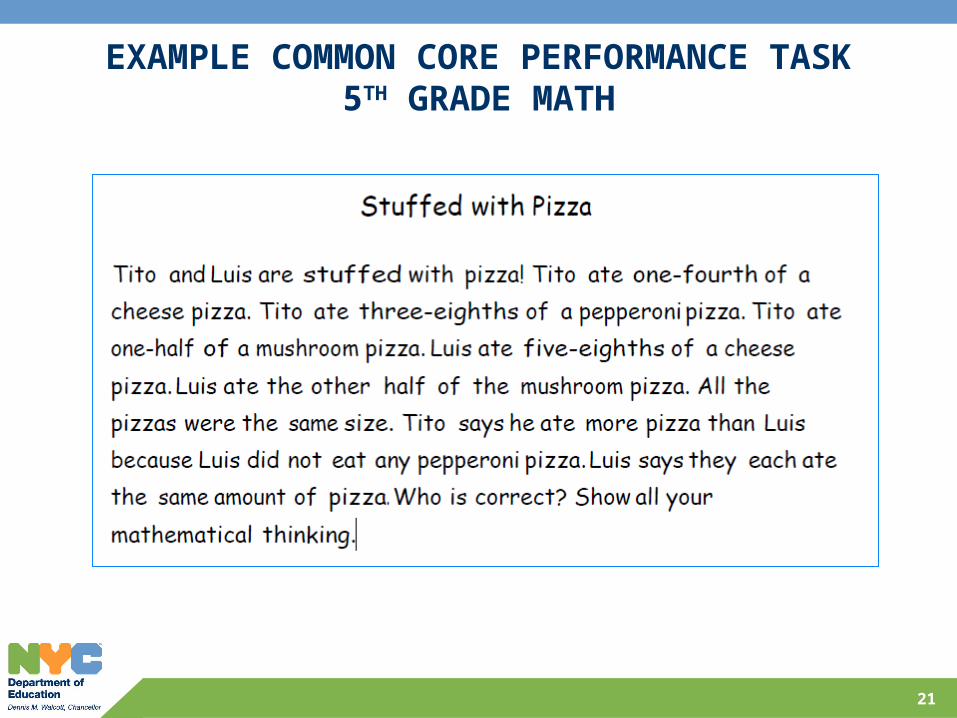
EXAMPLE COMMON CORE PERFORMANCE TASK5TH GRADE MATH
21

EXAMPLE RUBRIC: 5TH GRADE MATH TASK (SUB-SECTION)
22

EXAMPLE ANNOTATED STUDENT WORK
23

WHAT WE ARE DOING TO GET STUDENTS READY
2010-11: Training and resources for educators citywide Targeted work with expert partners and 100 schools
2011-12: Every student will engage in a rigorous, Common Core-
aligned literacy and math task as part of a curriculum unit> In literacy: Students will read and analyze nonfiction texts and
write opinions and arguments in response> In math: Students will engage in a challenging task that requires
them to solve “real-world” problems and/or figure out the reasoning behind arguments to get to a solution
24

SCHOOLS ARE RECEIVING SUPPORT WITH IMPLEMENTING THE COMMON CORE
25
Sample tasks and resources available to all teachers in NYC Common Core-aligned tasks and curriculum units, with examples of
student work Guidance for adapting tasks for all students, including students with
disabilities and English language learners Case studies, work samples, and videos illustrating what this work
looks like in action
Professional development Training to ensure access to the Common Core for all students,
including students with disabilities and English Language Learners In-school support for school leaders and teachers from network
instructional coaches
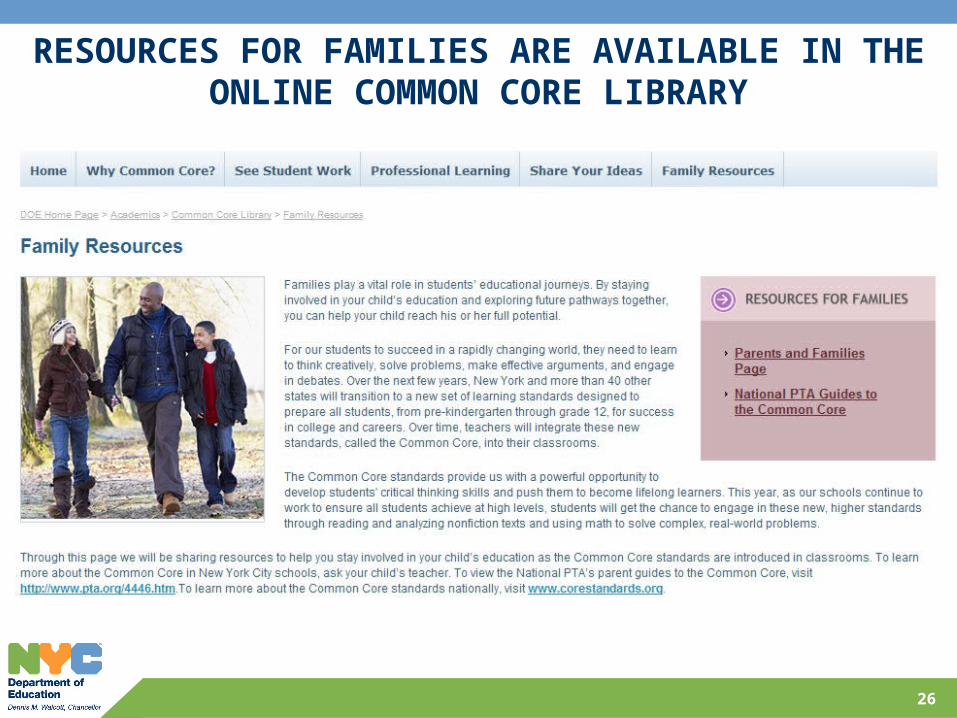
RESOURCES FOR FAMILIES ARE AVAILABLE IN THE ONLINE COMMON CORE LIBRARY
26
Visit schools.nyc.gov/Academics/CommonCoreLibrary and click “Family Resources”

ACCESSING COMMON CORE RESOURCES
The NYC Department of Education’s Common Core Library: http://schools.nyc.gov/Academics/CommonCoreLibrary
The standards themselves and info on the Common Core State Standards Initiative: http://corestandards.org
Guides to the Common Core from the National Parent Teacher Association (PTA): http://pta.org/4446.htm
27

NEXT STEPS FOR PARENTS
Today: turn in any question cards
Tuesday, October 25: Hear from one of the authors of the Common Core standards at a citywide public meeting
Seward Park High School (350 Grand Street, Manhattan) at 6 p.m.
During fall parent/teacher conferences: ask to see a sample of your child’s current work, and ask how you can support your child’s learning at home
28

29
ELEMENTARY SCHOOL PROGRESS REPORT OUTCOMES IN DISTRICT 25
School 2011 Grade
2011 Percentile
2010 Grade
P.S. 029 Queens A 96 BP.S. 024 Andrew Jackson A 96 A
P.S. 079 Francis Lewis A 93 CP.S. 021 Edward Hart A 91 B
P.S. 022 Thomas Jefferson A 88 AP.S. 209 Clearview Gardens A 83 A
P.S. 184 Flushing Manor A 80 AP.S. 214 Cadwallader Colden A 80 A
P.S. 107 Thomas A Dooley A 77 BP.S. 163 Flushing Heights A 76 B
P.S. 154 Queens B 74 CP.S. 169 Bay Terrace B 67 C
P.S. 201 The Discovery School for Inquiry and Research B 64 AP.S. 020 John Bowne B 63 B
P.S. 193 Alfred J. Kennedy B 50 CP.S. 165 Edith K. Bergtraum B 49 B
P.S. 129 Patricia Larkin B 41 BP.S. 120 Queens C 40 A
P.S. 032 State Street C 37 A

30
MIDDLE SCHOOL / K-8 PROGRESS REPORT OUTCOMES IN DISTRICT 25
School School Type
2011 Grade
2011 Percentile
2010 Grade
P.S. 219 Paul Klapper K-8 A 98 ABELL Academy Middle A 88 A
PS/MS 200 - The Pomonok School & STAR Academy K-8 A 87 BThe Queens College School for Math, Science and Technology K-8 A 86 A
P.S. 164 Queens Valley K-8 B 73 AEast-West School of International Studies Middle B 71 A
I.S. 237 Middle B 70 AJ.H.S. 185 Edward Bleeker Middle B 66 A
J.H.S. 194 William Carr Middle B 64 AWorld Journalism Preparatory: A College Board School Middle B 56 C
I.S. 025 Adrien Block Middle B 42 BQueens School of Inquiry, The Middle C 39 AJ.H.S. 189 Daniel Carter Beard Middle C 37 B
I.S. 250 The Robert F. Kennedy Community Middle School Middle C 20 C

QUESTIONS?
31
APPENDIX
32

POTENTIAL VIDEOS TO ADD
33
ELA & Literacy
http://www.teachingchannel.org/videos/common-core-state-standards-for-ela-and-literacy?fd=1
Mathematics
http://www.teachingchannel.org/videos/common-core-state-standards-for-math?fd=1
High School
http://www.teachingchannel.org/videos/common-core-state-standards-high-school?fd=1
Middle School
http://www.teachingchannel.org/videos/common-core-state-standards-middle-school?fd=1
Elementary School
http://www.teachingchannel.org/videos/common-core-state-standards-elementary-school--2?fd=1

EXAMPLE: GRADE 4 MATH PERFORMANCE TASK
34
Farmer Fred’s fields are worth twelve hundred dollars total. The fields are formed with the same properties as your pattern blocks. Each field’s value is based on its size. What fraction of the total value is each field worth? How much is each field worth? Show and explain all of your mathematical thinking.

EXAMPLE: MATH SAMPLE STUDENT WORK
35