supporting information for - beilstein-institut
TRANSCRIPT

S1
Supporting information
for
Characterization of spherical domains at the polystyrene
thin film–water interface
Khurshid Ahmad1,2
, Xuezeng Zhao1, Yunlu Pan
1*, and Danish Hussain
3
1Key Laboratory of Micro-Systems and Micro-Structures Manufacturing, Ministry of Education
and School of Mechatronics Engineering, Harbin Institute of Technology, Harbin 150001, P.R.
China, 2Department of Mechanical Engineering, Main Campus, University of Engineering and
Technology, Peshawar, Pakistan and 3State Key Laboratory of Robotics and Systems and School
of Mechatronics Engineering, Harbin Institute of Technology, Harbin 150001, P.R. China
Email: Yunlu Pan* - [email protected]
* Corresponding author
Additional Experimental Information

S2
Figure S1: Height images of the spherical domains found on various PS coated surfaces.

S3
Figure S2: (a-d) Coalescence of two spherical domains is shown here. The encircled areas
suggest that the coalescence of two spherical domains may result the formation of an irregular
shaped domain.

S4
Figure S3: (a–f) Coalescence at three different locations D1, D2 and D3 on PS coated surface is
shown here. In this figure it can be noticed that D1 and D2 take a regular spherical or nearly
spherical shape but D3 takes an irregular shape as shown in (f). Presence of additional domains
in the vicinity of the domains merging together can help in the growth of these domains.
Moreover, the presence of additional domains as well as binding of the PS film to the silicon
substrate can be the key deciding factors in the shape of these domains resulted from coalescence.

S5
Figure S4: (a–f) height and phase images, respectively, of spherical domains with unknown
particles/contaminants shown in the encircled areas. The unknown particles/contaminants are
clearly visible in the phase images. The encircled area in (a) shows a scratch on the top of the
spherical domain. Similarly, in (d) and (f) the particles can be seen in the areas encircled.
S6
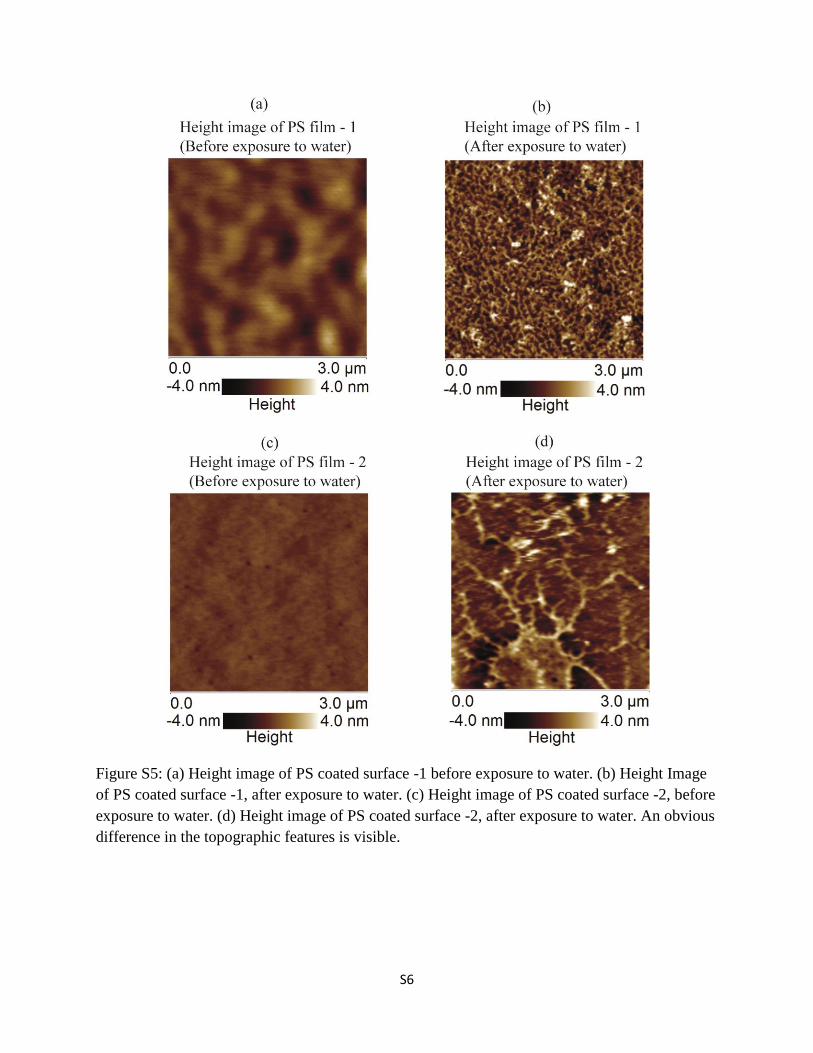
Figure S5: (a) Height image of PS coated surface -1 before exposure to water. (b) Height Image
of PS coated surface -1, after exposure to water. (c) Height image of PS coated surface -2, before
exposure to water. (d) Height image of PS coated surface -2, after exposure to water. An obvious
difference in the topographic features is visible.

S7
Figure S6: (a) Approach and retraction curve of PS surface. (b) Approach and retraction on
spherical domain with Radius/later size, R = 1.3 µm, Height, H = 22 nm. (c) Approach and
retraction on spherical domain with Radius/later size, R = 0.9 µm, Height, H = 16 nm. (d)
Approach and retraction on spherical domain with Radius/later size, R = 0.6 µm, Height, H = 6
nm.

S8
Analysis of surface energy
The analysis of the excess energy per unit area was also conducted. The modulus of elasticity of
polystyrene (PS) film and the pressure inside the blister was taken into account. The critical
stress ( ) can be given by equation 1[1, 2].
√
(1)
Where, is the modulus of elasticity of the PS film, is the excess surface energy per unit area.
And is the radius/lateral size of the blister. At equilibrium the vapour pressure ( ) at room
temperature will be equal to the therefore, equation 1 will take the form:
(2)
where [3], [4] and was obtained from the AFM images. The
ranged from 0.5 µm to 12 µm. Using this data, the surface excess energy was calculated and
is plotted against the as shown in Figure S7.
Figure S7: Variation of surface excess energy with respect to the radius/lateral size of the blister.

S9
References
1. Berkelaar, R. P.; Bampoulis, P.; Dietrich, E.; Jansen, H. P.; Zhang, X. H.; Kooij, E. S.;
Lohse, D.; Zandvliet, H. J. W. Langmuir 2015, 31 (3), 1017-1025.
2. Griffith, A. A. Philosophical transactions of the royal society of london. Series A,
containing papers of a mathematical or physical character 1921, 221, 163-198.
3. Du, B.; Tsui, O. K. C.; Zhang, Q.; He, T. Langmuir 2001, 17 (11), 3286-3291.
4. Lide, D. R. CRC Handbook of Chemistry and Physics, CRC Press, Boca Raton, FL, 2005.