supporting information for: effectivity” “proton exchange
TRANSCRIPT
1
Supporting Information for:
“Proton exchange membrane with plasmon-active surface for enhancement of fuel cell
effectivity”
by
R. Elashnikova, K. Zahorjanovaa, E. Miliutinaa, Z. Kolskab M. Cieslarc, V. Svorcika, O. Lyutakova
a Department of Solid State Engineering, University of Chemistry and Technology, 16628 Prague,
Czech RepublicbFaculty of Science, J.E. Purkyne University, 400 96 Usti nad Labem, Czech Republicc Faculty of Mathematics and Physics, Charles University, 121 16 Prague, Czech Republic
Experimental
Materials and samples preparation
PEM membrane (Nafion Membrane NR 212, 50.8 µm) was supplied from Ion Power. The
conductivity of the surface of PEM membrane was increased by the deposition of thin porous
amorphous carbon layer (“effective” thickness – ca 7 nm) using flash evaporation method (BAL-
TEC). Next, Au clusters were deposited onto a PEM/C surface by vacuum sputtering (99.999 Au
target purity (Safina), DC Ar plasma, gas pressure 4 Pa, discharge power of 7.5 W). The sputtering
time (20 s) was adjusted to create the Au clusters and prevent the formation of continuous Au layer.
Then, a thin Pt layer was deposited on the PEM/C/Au surface (in particular on Au clusters surface)
by samples immersion into 10 mM water solution of H2PtCl6(Sigma-Aldrich),followed by drop wise
addition of 100 mM water solution of ascorbic acid (Sigma Aldrich) with gentle mixing (volume ratio
of solutions is 2.5:1, respectively). After Pt deposition the samples were carefully rinsed with distilled
water and methanol and dried at the ambient conditions.
Commercially available fuel cells from (Horizon – Fuel Cell Technology) was used to test 4
cm2 active-area PEM/C/Au/Pt membrane. The supplied fuel cell station design was modified to
introduce the light triggering: the set-up for PEM membrane mounting was replaced by home-made
one with the addition of a transparent glass (BK7). In turn, the PEM membrane from manufacturer
was replaced by laboratory-prepared PEM/C/Au/Pt membrane. The supply of hydrogen and oxygen
as well as control of the membrane moisture were carried out on the basis of the manufacturer’s
devices. The gases feed rate was7 mLmin-1for hydrogen and 3.5 mLmin-1 for oxygen (controlled
with the use of equipment from the fuel cell station station). The current and voltage produced by the
set-up were measured by a voltammeter, supplied as an integral part of the station kit. The cell
polarisation and power density curves were determined from current/voltage relationship (measured
by multimeters) under the fuel cell loading with different resistors.
Electronic Supplementary Material (ESI) for Nanoscale.This journal is © The Royal Society of Chemistry 2020
2
The light triggering was performed using the LED light source (780 nm emission wavelength,
maximal power – 500 mW). The LED light was collimated on the PEM/C/Au/Pt membrane surface
in the spot with 1.5 cm diameter through a transparent window (see Fig. 1 schematic representation
of set-up).
Measurement techniques
X-ray photoelectron spectroscopy (XPS) was performed using an Omicron Nanotechnology
ESCAProbeP spectrometer fitted with a monochromated Al Kα X-ray source working at 1486.6 eV.
Surface morphology was measured using atomic force microscopy (AFM) in peak force mode on the
Icon (Bruker) microscope. AFM scratch tests were carried out on Au or Au/Pt films deposited on the
glass substrate by profiling across a scratch at the angle of 90° relative to the substrate surface. X-ray
diffraction data (XRD) were collected on XRD diffractometer PANanalytical X'Pert PRO using Cu
Kα radiation (1.5406 Å). All spectra are presented after baseline correction and subtraction of the
spectrum from previous sample preparation stage (i.e. subtraction the spectrum of PEM/C/Au from
spectrum of PEM/C/Au/Pt). UV–Vis absorption spectra were measured by using a Lambda 25 UV–
vis–NIR spectrometer (PerkinElmer, USA) with the scanning rate of 480 nm min–1.To estimate the
surface temperature an ultrathin (10 µm) leaf-type thermocouple was attached to the sample surface
and the laser beam was focused on the sample surface below the working edge of the thermocouple.
The surface area was determined from N2 adsorption and desorption isotherms (Quantachrome
Instruments, NOVA3200) using NovaWin software. Five points Brunauer-Emmett-Teller (BET)
analysis was applied for the total surface area determination and each sample was measured four
times with a relative experimental error of 5 %.
TEM images of nanoparticles were obtained on a JEOL JEM-1010 transmission electron
microscope with a SIS MegaView III digital camera. STEM observations and EDX analyses were
performed on a JEOL JEM-2200FS electron microscope equipped with a 100 mm2 JEOL Dry
SD100GV EDX detector with a Super UTW window.
Proton penetration measurements were performed on the home made equipment, through the
immersion of glass tube filled with diluted nitric acid (pH = 4) in the distilled water and clogged from
the bottom side by pristine PEM (control experiments) or PEM/C/Au/Pt membranes. The proton
penetration was monitored as time-resolved changes of pH in distilled water (under gently stirring)
using the Orion Star A211 (Thermo Scientific) pH-meter.
Electrochemical measurements were performed with Palm Sens 4potentiostat (Palm
Instruments, Netherlands), controlled by PSTrace 5.3 software (5.3.1127 firmware) using a three-
electrode home made cell, which contains the transparent windows for samples illumination. A
HydroFlex hydrogen electrode was used as a reference electrode, a thin platinum wire (10 µm
3
diameter) auxiliary electrode was used as counter electrode and surface modified PEM membranes
were used as the working electrode. Parameters of the voltammetry (VA) measurements were: 10
mVs-1 scan rate and 0.3 to 1.2 mV (in the case of ORR) or -0.2 to 0.9 mV (in the case of HOR)
potential range. The measurements were performed in 0.1 M KOH solution purged with oxygen
(ORR) or hydrogen (HOR) for 20 min. and subsequent measurements were performed at atmospheric
pressure under the continuous flow of corresponding gases through the measurement cell.
Control experiments. The control experiments include the temperature control (the electric current
produced by fuel cell with PEM/C/Au/Pt membrane was estimated at elevated temperature without
illumination), light control (the PEM/C/Au/Pt membrane introduced into fuel cell was illuminated
with wavelength which does not correspond to plasmon absorption band at 450 nm) and plasmonic
control (the PEM membrane surface was decorated only by C and Pt thin layer, according the
previously described procedure, introduced in the fuel cell and illuminated at 780 nm).

4
Figure S1
Evolution of surface morphology of PEM/C/Au samples during the deposition of Au nanoclusters.
The amount of deposited Au was varied using the tuning of depostion time: A – 5 sec (effective
thickness – 0.8 nm), B – 10 sec. (effective thickness – 2.6 nm); C – 20 sec. (effective thickness – 7.1
nm); D – 30 sec. (effective thickness – 10.8 nm); E – 40 sec. (effective thickness – 18.3) and F – 60
sec. (effective thickness – 23.8). *
*Effective thickness was estimated from conrol AFM scratch test smesurements using the
deposition of Au on glass substrate.
A B
C D
E F
5
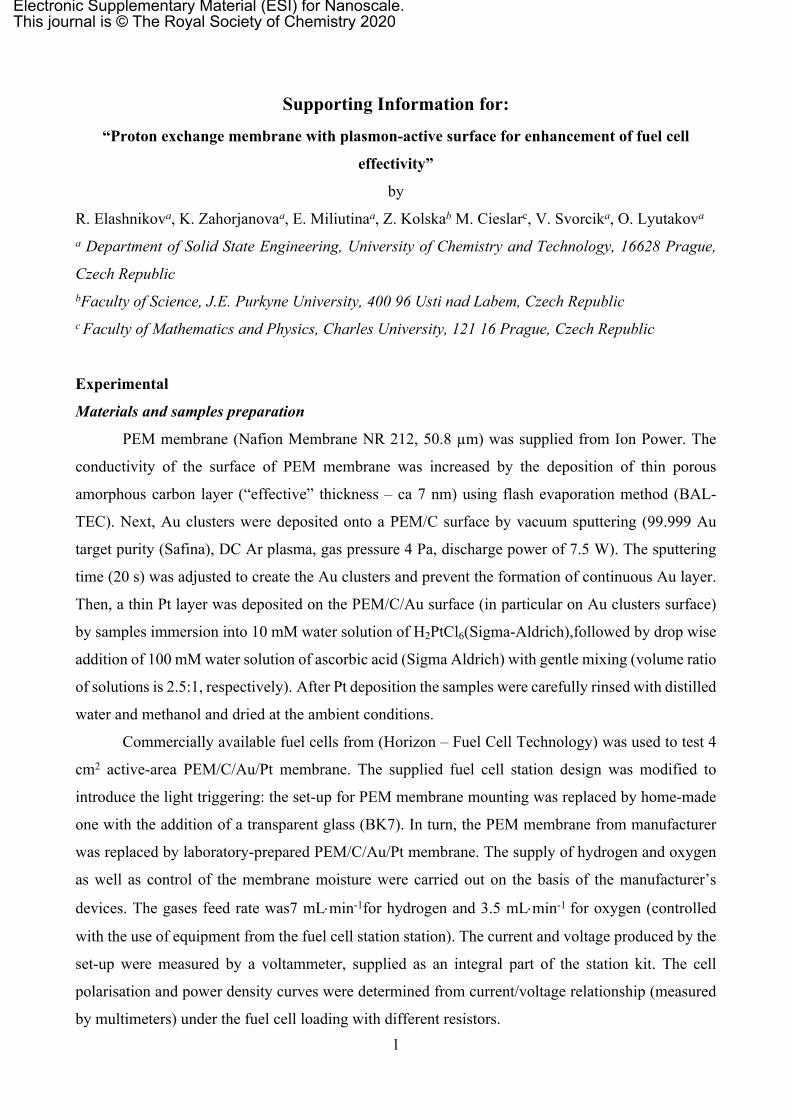
Figure S2
Evolution of surface morphology of PEM/C/Au/Pt surface morphology during the addition of
different amounts of Pt (tuned by reduction time, estimated from control scratch measurements, are
performed on glass/Au supports): A – 0.7 nm; B – 1.2 nm; C – 3.2 nm; D – 7.6 nm.
A B
C D
6
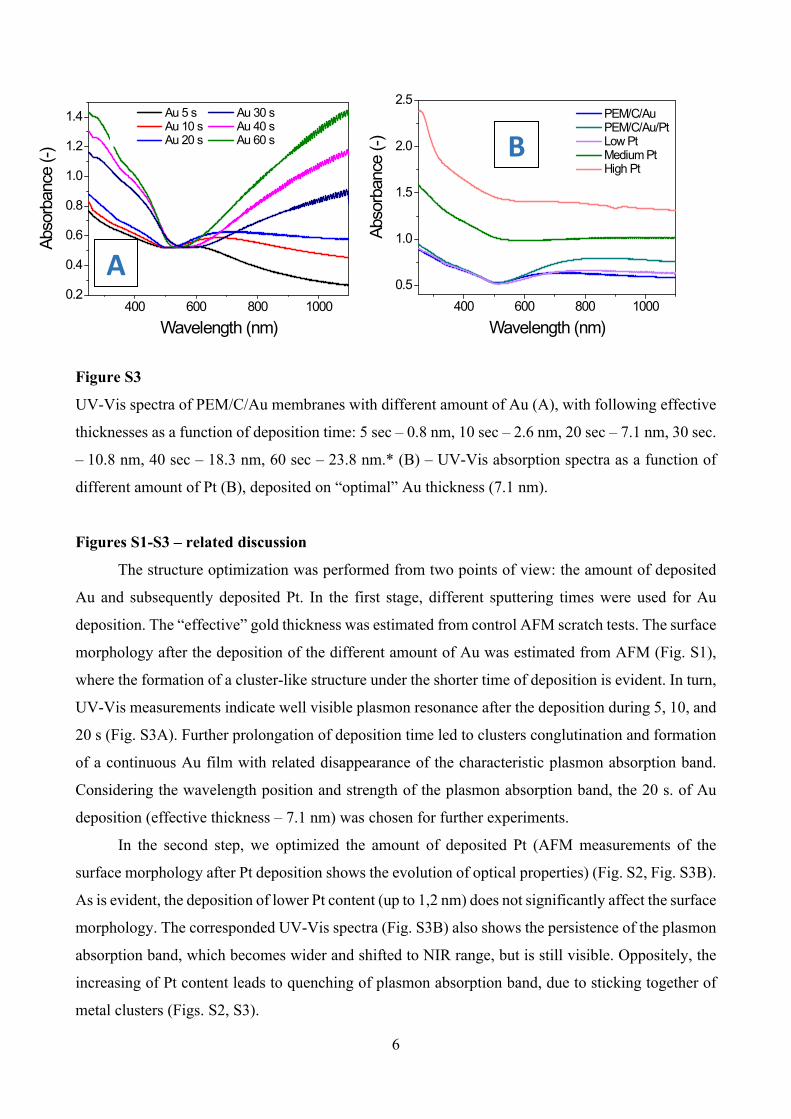
Figure S3
UV-Vis spectra of PEM/C/Au membranes with different amount of Au (A), with following effective
thicknesses as a function of deposition time: 5 sec – 0.8 nm, 10 sec – 2.6 nm, 20 sec – 7.1 nm, 30 sec.
– 10.8 nm, 40 sec – 18.3 nm, 60 sec – 23.8 nm.* (B) – UV-Vis absorption spectra as a function of
different amount of Pt (B), deposited on “optimal” Au thickness (7.1 nm).
Figures S1-S3 – related discussion
The structure optimization was performed from two points of view: the amount of deposited
Au and subsequently deposited Pt. In the first stage, different sputtering times were used for Au
deposition. The “effective” gold thickness was estimated from control AFM scratch tests. The surface
morphology after the deposition of the different amount of Au was estimated from AFM (Fig. S1),
where the formation of a cluster-like structure under the shorter time of deposition is evident. In turn,
UV-Vis measurements indicate well visible plasmon resonance after the deposition during 5, 10, and
20 s (Fig. S3A). Further prolongation of deposition time led to clusters conglutination and formation
of a continuous Au film with related disappearance of the characteristic plasmon absorption band.
Considering the wavelength position and strength of the plasmon absorption band, the 20 s. of Au
deposition (effective thickness – 7.1 nm) was chosen for further experiments.
In the second step, we optimized the amount of deposited Pt (AFM measurements of the
surface morphology after Pt deposition shows the evolution of optical properties) (Fig. S2, Fig. S3B).
As is evident, the deposition of lower Pt content (up to 1,2 nm) does not significantly affect the surface
morphology. The corresponded UV-Vis spectra (Fig. S3B) also shows the persistence of the plasmon
absorption band, which becomes wider and shifted to NIR range, but is still visible. Oppositely, the
increasing of Pt content leads to quenching of plasmon absorption band, due to sticking together of
metal clusters (Figs. S2, S3).
400 600 800 10000.5
1.0
1.5
2.0
2.5
Abso
rban
ce (-
)
Wavelength (nm)
PEM/C/Au PEM/C/Au/Pt Low Pt Medium Pt High Pt
400 600 800 10000.2
0.4
0.6
0.8
1.0
1.2
1.4
Abso
rban
ce (-
)
Wavelength (nm)
Au 5 s Au 30 s Au 10 s Au 40 s Au 20 s Au 60 s
A
B
7
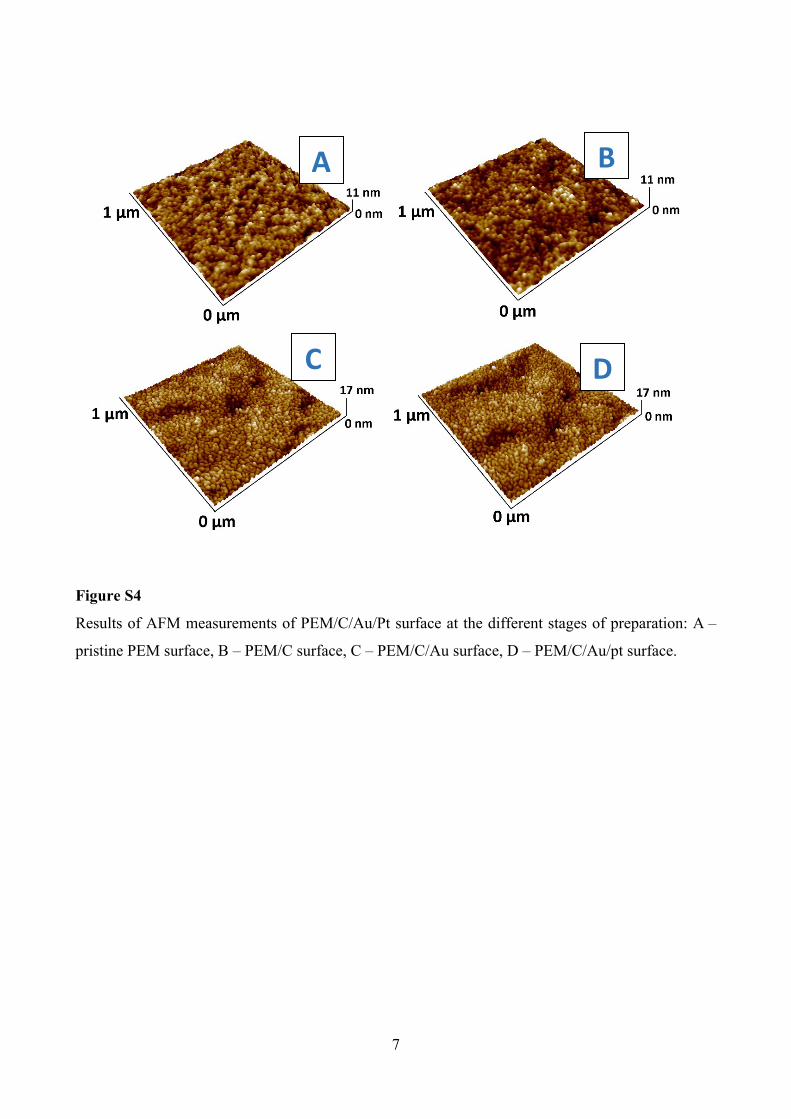
Figure S4
Results of AFM measurements of PEM/C/Au/Pt surface at the different stages of preparation: A –
pristine PEM surface, B – PEM/C surface, C – PEM/C/Au surface, D – PEM/C/Au/pt surface.
D
A B
C
8
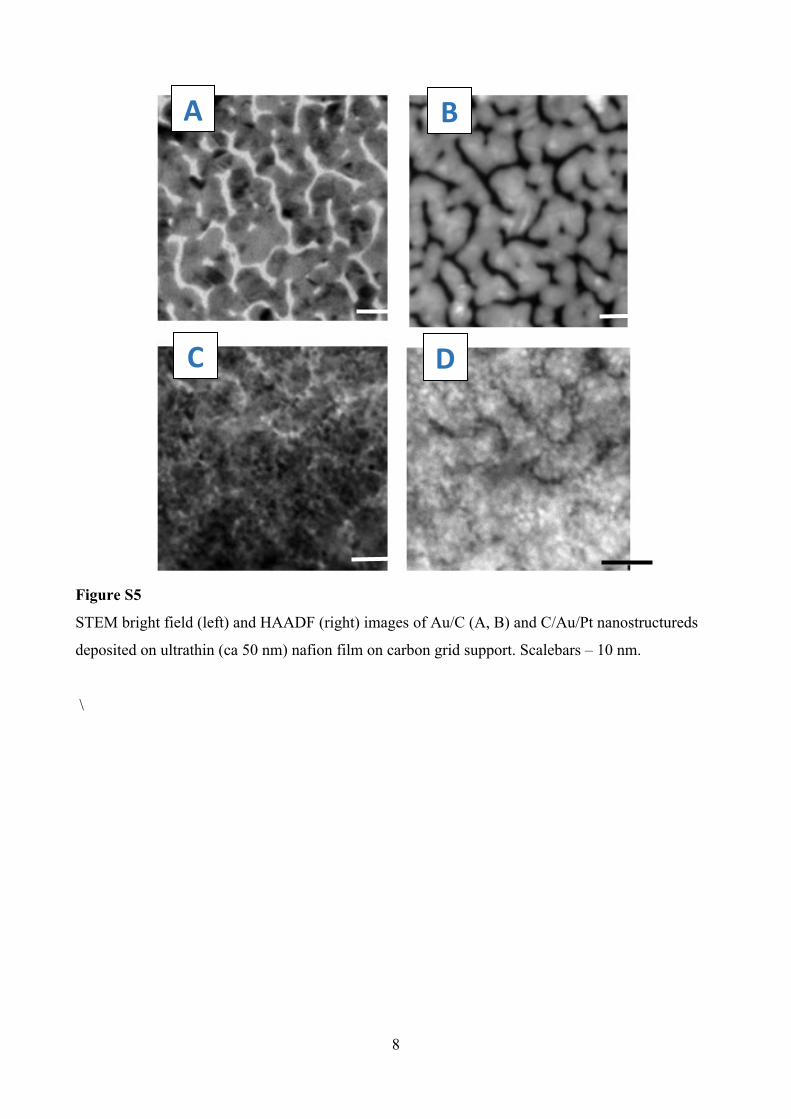
Figure S5
STEM bright field (left) and HAADF (right) images of Au/C (A, B) and C/Au/Pt nanostructureds
deposited on ultrathin (ca 50 nm) nafion film on carbon grid support. Scalebars – 10 nm.
\
A B
C D
9
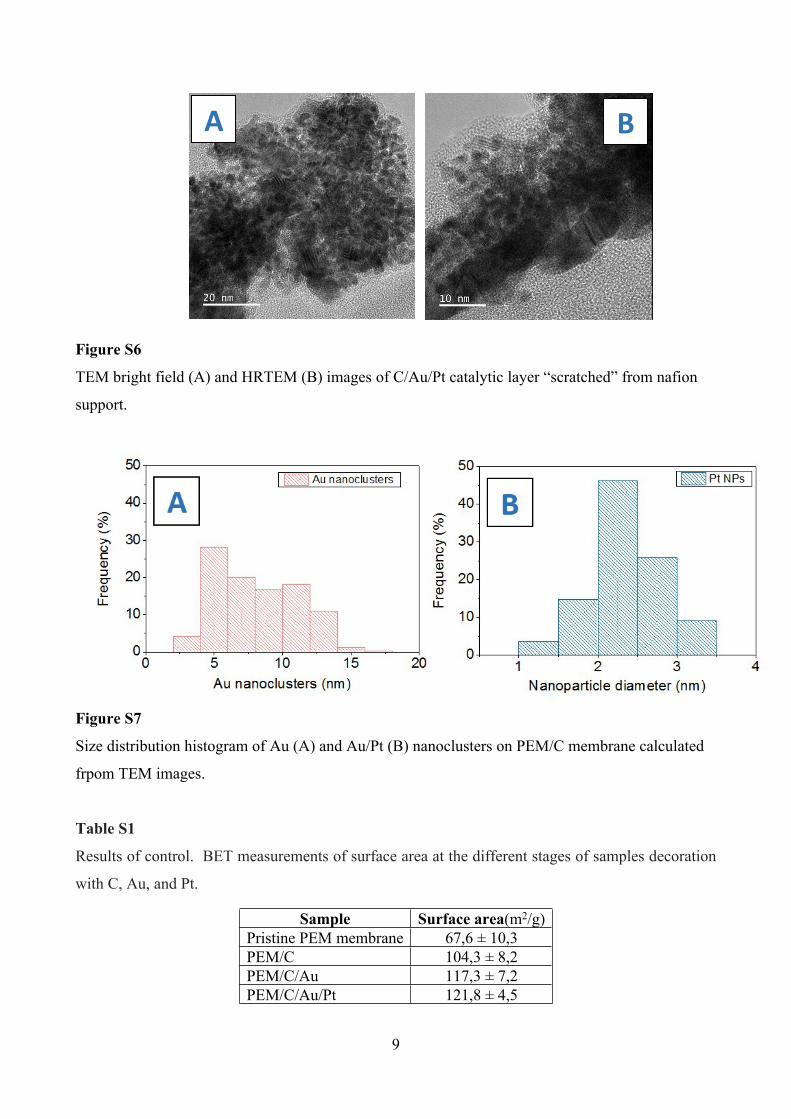
Figure S6
TEM bright field (A) and HRTEM (B) images of C/Au/Pt catalytic layer “scratched” from nafion
support.
Figure S7
Size distribution histogram of Au (A) and Au/Pt (B) nanoclusters on PEM/C membrane calculated
frpom TEM images.
Table S1
Results of control. BET measurements of surface area at the different stages of samples decoration
with C, Au, and Pt.
Sample Surface area(m2/g)Pristine PEM membrane 67,6 ± 10,3PEM/C 104,3 ± 8,2PEM/C/Au 117,3 ± 7,2PEM/C/Au/Pt 121,8 ± 4,5
A B
10
0 100 200 300 4004,4
4,8
5,2
5,6
6,0
pH 6pH 4
Electrode
PEM membraneH+
pH
(-)
Time (sec.)
PEM PEM/C/Au/Pt
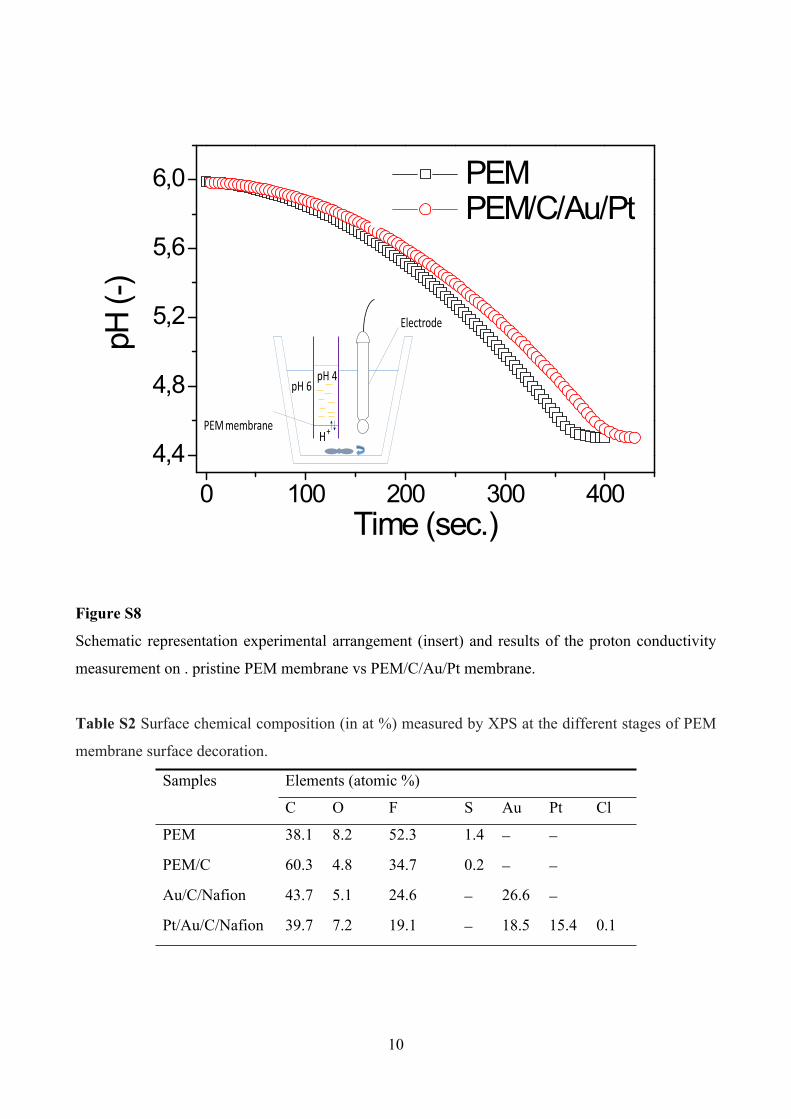
Figure S8
Schematic representation experimental arrangement (insert) and results of the proton conductivity
measurement on . pristine PEM membrane vs PEM/C/Au/Pt membrane.
Table S2 Surface chemical composition (in at %) measured by XPS at the different stages of PEM
membrane surface decoration.
Elements (atomic %)Samples
C O F S Au Pt Cl
PEM 38.1 8.2 52.3 1.4
PEM/C 60.3 4.8 34.7 0.2
Au/C/Nafion 43.7 5.1 24.6 26.6
Pt/Au/C/Nafion 39.7 7.2 19.1 18.5 15.4 0.1
11
800 600 400 200 0
PEM
F 1s
F KLL
Au
O 1s C 1s S 2p
O 1s
F 1s
O 1s
Pt
Inte
nsity
(a.u
.)
PEM/C
Pt 4f
Au+Pt
C 1s
F KLL
C 1s
C 1s
F 1s
F 1s
Au 4f
Au 4f
Au 4p3/2Au 4p
Au 4d3/2Au 4dAu 4d5/2
Pt 4d3/2Pt 4dPt 4d5/2
Pt 4p1/2
Au+Pt
Au 4p3/2Au 4p
Pt 4p3/2Pt 4p
S 2p
PEM/C/Au
F KLL
Binding Energy (eV)
PEM/C/Au/PtF KLL
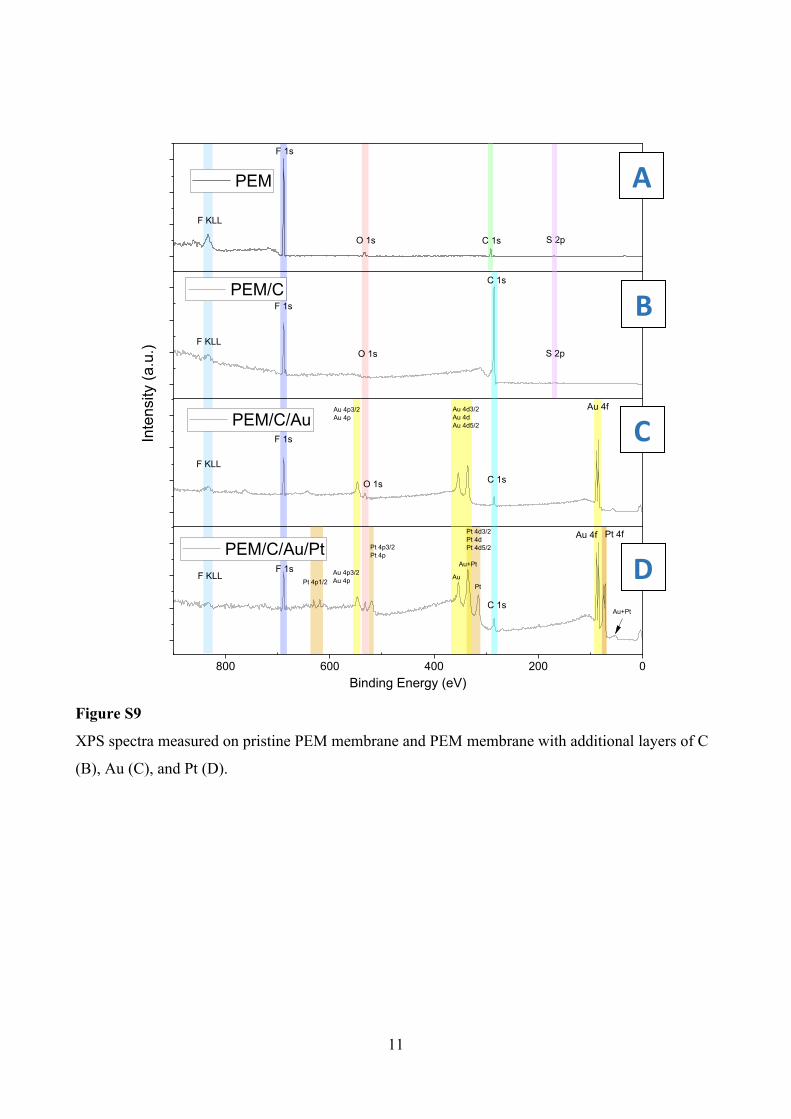
Figure S9
XPS spectra measured on pristine PEM membrane and PEM membrane with additional layers of C
(B), Au (C), and Pt (D).
A
B
C
D
12
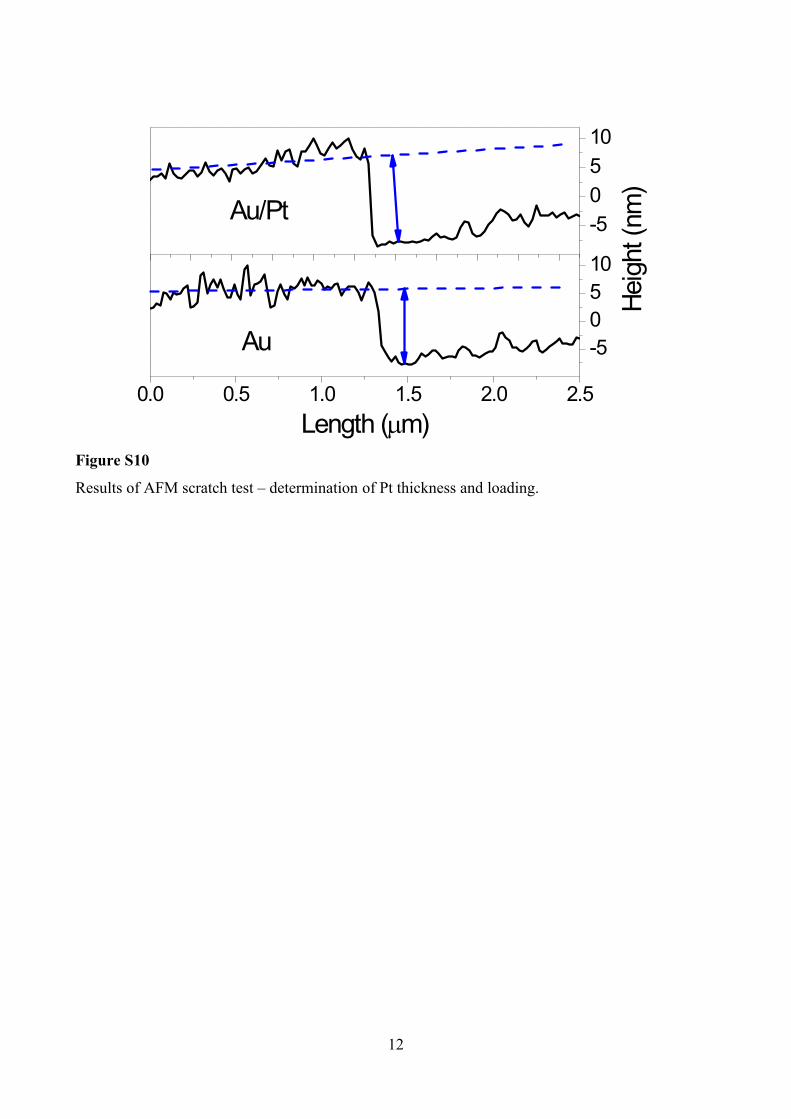
Figure S10
Results of AFM scratch test – determination of Pt thickness and loading.
0.0 0.5 1.0 1.5 2.0 2.5
-50510
Heig
ht (n
m)
Au
Length (m)
-50510
Au/Pt

13
Figure S11
Voltammetry control measurements, performed under the illumination with 450 nm wavelength (A,
B) or without addition of plasmon active Au coating (C, D) with implementation of HOR and ORR
model half-reactions.
0.4 0.6 0.8 1.0 1.2
-0.6
-0.4
-0.2
0.0
Curre
nt (m
A)
E (V) vs RHE
0 mW 150 mW 300 mW
PEM/C/Pt = 780 nm
ORR
-0.2 0.0 0.2 0.4 0.6 0.8 1.0
-0.04
-0.02
0.00
Curre
nt (m
A)
E (V) vs RHE
0 mW 150 mW 300 mW
PEM/C/Pt = 780 nm HOR
-0.2 0.0 0.2 0.4 0.6 0.8 1.0
-0.04
-0.02
0.00
Curre
nt (m
A)
E (V) vs RHE
0 mW 150 mW 300 mW
PEM/C/Au/Pt = 450 nm
HOR
0.4 0.6 0.8 1.0 1.2-0.8
-0.6
-0.4
-0.2
0.0
Curre
nt (m
A)E (V) vs RHE
0 150 mW 300 mW
PEM/C/Au/Pt = 450 nm
ORR
A B
C D

14
0 50 100 150 200 250 300 3500
50
100
150
200
Laser Power (mW)
HOR side ORR side
Figure S12
Produced electric current as a function of laser power under the plasmon triggering, applied
alternatively on different sides of PEM/C/Au/Pt membrane, (sides responsible for HOR or ORR half-
reactions).
0 50 100 150 200 250 300
0,1
0,2
0,3
0,4
0,5
0,6
0,7
0,8
0,9 non-illuminated V vs mA/cm2
non-illuminated mW/cm2 vs mA/cm2
Illuminated V vs mA/cm2
Illuminated mW/cm2 vs mA/cm2
Current density (mA/cm2)
Pot
entia
l (V
)
0102030405060708090100
P
ower
den
sity
(mW
/cm
2 )
Figure S13

15
Polarization curves and power density curves measured in dark and under illumination (780 nm, 30
mW) of fuel cell with C/Au/Pt catalytic layer deposited on PEM membrane.
400 600 800 1000
0.0
0.2
0.4
0.6
Ab
sorp
tion
(-)
Wavelength (nm)
PEM PEM/C/Pt
Figures S14
UV-Vis spectra of PEM coated by C and Pt (without addition of Au)