supporting information for mofs with uio-66 and …2.2. powder x-ray diffraction tab. s5. lattice...
TRANSCRIPT
Supporting Information for
Tuning the stability of bimetallic Ce(IV)/Zr(IV)- based
MOFs with UiO-66 and MOF-808 structure
Martin Lammert, Christian Glißmann and Norbert Stock
1
Electronic Supplementary Material (ESI) for Dalton Transactions.This journal is © The Royal Society of Chemistry 2017

1. Synthesis procedures 3
2. Characterization of Ce/Zr-UiO-66
2.1. Results of the EDX analyses 6
2.2. Powder X-ray diffraction 8
2.3. Thermal stability 15
2.4. pH stability 21
2.5. Thermogravimetric analysis 24
2.6. N2 sorption measurements 28
2.7. DLS measurements 29
3. Characterization of Ce/Zr-MOF-808
3.1. Results of the EDX analyses 30
3.2. Powder X-ray diffraction 31
3.3. Thermal analysis 36
3.4. N2 sorption measurements 37
2

1. Synthesis procedures
Materials and Methods. Cerium ammonium nitrate (98 %, (NH4)2Ce(NO3)6, Alfa Aesar), 1,4-
benzenedicarboxyic acid (98 %, H2BDC, Sigma Aldrich), benzene-1,3,5-tricarboxylic acid (95 %,
H3BTC, Sigma Aldrich), zirconium(IV) dinitrate oxide hydrate (ZrO(NO3)2∙H2O, ABCR),
zirconium(IV) chloride (99 %, ZrCl4, Sigma Aldrich) were used as obtained.
PXRD characterization for product identification was performed on a STOE Stadi P Combi
diffractometer with MoKα1 radiation or with CuKα1 radiation, equipped with a Mythen 1K detector
system and a xy-stage. The high resolution PXRD patterns were recorded on a Stadi P diffractometer
with CuKα1 radiation using a Mythen 1K detector. Therefore samples were prepared by mixing the Ce/Zr-
MOFs with potassium chloride (approximately molar ratio 6:1) acting as internal standard reagent,
respectively and thoroughly grinded before PXRD data were collected. The lattice parameters of the
bimetallic MOFs were calculated using the Le Bail method implemented in the program TOPAS
Academic v4.1. Simultaneously the structure of KCl (a= 6.2890(2) Å) was refined by Rietveld methods
using the same program, with the result to minimize errors e.g. zero point shift, during the determination.
For variable temperature X-ray diffraction measurements, the STOE Stadi P Combi diffractometer with
MoKα1 radiation was equipped with a capillary furnace. These measurements were carried out under air
in a 0.5 mm quartz capillary in a range of 1-19° 2θ with a measuring time of 3 min after each 5 °C
temperature step. At the temperature were the crystallinity drastically decreases the thermal stability was
specified. Due to the 5 °C temperature step an error of ±5 °C must be considered.
Sorption experiments were performed using a BEL Japan Inc. Belsorpmax. The specific surface areas
were determined using the Rouquerol1 approach and the micropore volume was calculated at p/p0 = 0.5.
Thermogravimetric measurements were performed on a TA instruments Q500 under air flow (10 ml
min-1) with a heating rate of 4 K min-1. Energy-dispersive X-ray (EDX) spectroscopy data were recorded
on a Philips XL30 FEG microscope. Each sample was measured three times at different spots. From the
data the average values in at% of Ce, Zr and the standard deviation were calculated. The particle sizes
were measured using a Beckman Coulter DelsaTM Nano C Particle Analyzer. Therefore prior to
measurement the samples were dispersed in ethanol for 30 min in an ultrasonic bath.
3
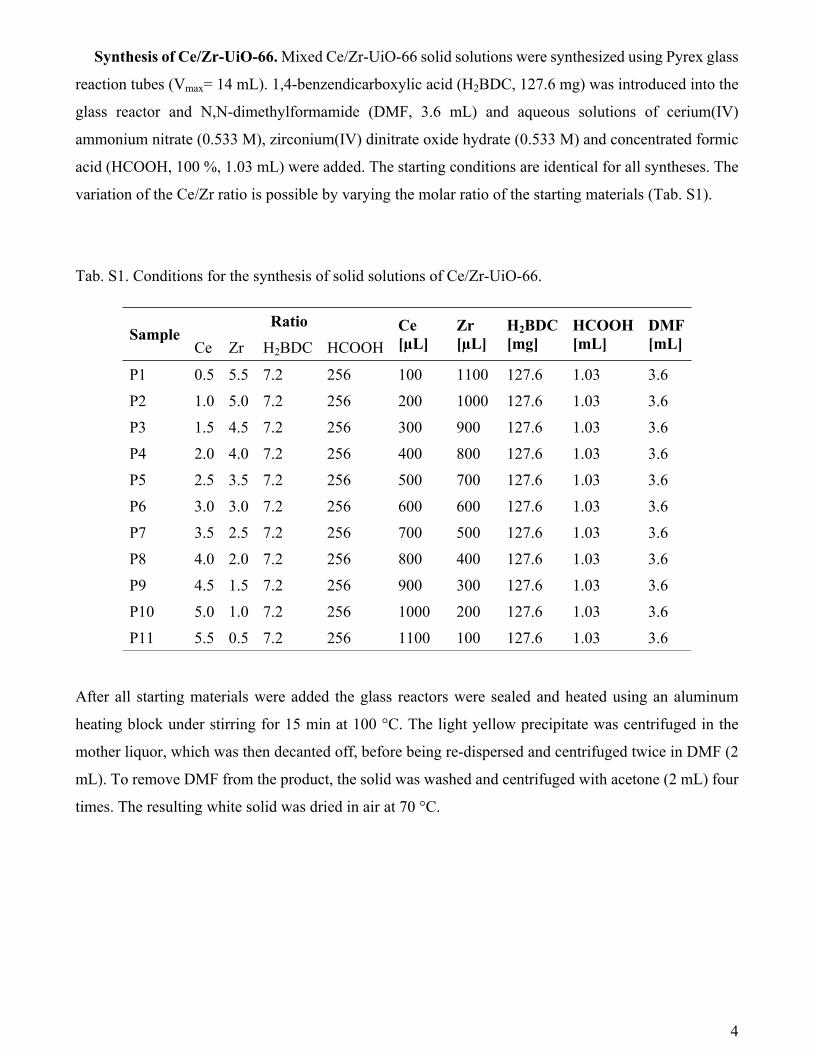
Synthesis of Ce/Zr-UiO-66. Mixed Ce/Zr-UiO-66 solid solutions were synthesized using Pyrex glass
reaction tubes (Vmax= 14 mL). 1,4-benzendicarboxylic acid (H2BDC, 127.6 mg) was introduced into the
glass reactor and N,N-dimethylformamide (DMF, 3.6 mL) and aqueous solutions of cerium(IV)
ammonium nitrate (0.533 M), zirconium(IV) dinitrate oxide hydrate (0.533 M) and concentrated formic
acid (HCOOH, 100 %, 1.03 mL) were added. The starting conditions are identical for all syntheses. The
variation of the Ce/Zr ratio is possible by varying the molar ratio of the starting materials (Tab. S1).
Tab. S1. Conditions for the synthesis of solid solutions of Ce/Zr-UiO-66.
RatioSample
Ce Zr H2BDC HCOOHCe [µL]
Zr [µL]
H2BDC [mg]
HCOOH [mL]
DMF [mL]
P1 0.5 5.5 7.2 256 100 1100 127.6 1.03 3.6
P2 1.0 5.0 7.2 256 200 1000 127.6 1.03 3.6
P3 1.5 4.5 7.2 256 300 900 127.6 1.03 3.6
P4 2.0 4.0 7.2 256 400 800 127.6 1.03 3.6
P5 2.5 3.5 7.2 256 500 700 127.6 1.03 3.6
P6 3.0 3.0 7.2 256 600 600 127.6 1.03 3.6
P7 3.5 2.5 7.2 256 700 500 127.6 1.03 3.6
P8 4.0 2.0 7.2 256 800 400 127.6 1.03 3.6
P9 4.5 1.5 7.2 256 900 300 127.6 1.03 3.6
P10 5.0 1.0 7.2 256 1000 200 127.6 1.03 3.6
P11 5.5 0.5 7.2 256 1100 100 127.6 1.03 3.6
After all starting materials were added the glass reactors were sealed and heated using an aluminum
heating block under stirring for 15 min at 100 °C. The light yellow precipitate was centrifuged in the
mother liquor, which was then decanted off, before being re-dispersed and centrifuged twice in DMF (2
mL). To remove DMF from the product, the solid was washed and centrifuged with acetone (2 mL) four
times. The resulting white solid was dried in air at 70 °C.
4

Synthesis of Ce/Zr-MOF-808. Mixed Ce/Zr-MOF-808 solid solutions were synthesized using Pyrex
glass reaction tubes (maximum volume 14 mL). 1,3,5-benzenetricarboxylic acid (H3BTC, 67.2 mg), was
introduced into the glass reactor and N,N-dimethylformamide (DMF, 1.6 mL) and aqueous solutions of
cerium(IV) ammonium nitrate (0.533 M), zirconium(IV) dinitrate oxide hydrate (0.533 M) and
concentrated formic acid (HCOOH, 100 %, 4.12 mL) were added. The starting conditions are identical
for all syntheses. The variation of the Ce/Zr ratio is possible by varying the molar ratio of the starting
materials (Tab. S2).
Tab. S2. Lattice parameters of the Ce/Zr-UiO-66 compounds obtained by Le Bail profile fitting.
RatioSample
Ce Zr H2BDC HCOOHCe [µL]
Zr [µL]
H2BTC [mg]
HCOOH [mL]
DMF [mL]
M1 1.0 5.0 3.0 1024 200 1000 67.2 4.12 1.6
M2 2.0 4.0 3.0 1024 400 800 67.2 4.12 1.6
M3 3.0 3.0 3.0 1024 600 600 67.2 4.12 1.6
M4 4.0 2.0 3.0 1024 800 400 67.2 4.12 1.6
M5 5.0 1.0 3.0 1024 1000 200 67.2 4.12 1.6
After all starting materials were added, the glass reactors were sealed and heated using an aluminum
heater block under stirring for 20 min at 100 °C. The light yellow precipitate was centrifuged in the
mother liquor, which was then decanted off, before being re-dispersed and centrifuged twice in DMF (2
mL). To remove DMF from the product, the solid was washed and centrifuged with acetone (2 mL) four
times. The resulting white solid was dried in air at 70 °C.
Pure Ce-UiO-66 and Zr-UiO-66 were synthesized for comparison and according the synthesis method
described in literature.2,3
5

2. Characterization of Ce/Zr-UiO-66
2.1. Results of the EDX analyses
Tab. S3: Results of the EDX analysis of the bimetallic Ce/Zr-UiO-66 compounds.
Sample Elements 1. / at% 2. / at% 3. / at% 4. / at% Mean value / at%
Standard deviation
/ at%
Zr 91.94 92.86 90.13 91.88 91.7 1.1P1
Ce 8.06 7.14 9.87 8.12 8.3 1.1
Zr 84.13 85.42 84.53 84.15 84.6 0.6P2
Ce 15.87 14.58 15.47 15.85 15.4 0.6
Zr 82.71 82.01 81.22 82.38 82.1 0.6P3
Ce 17.29 17.99 18.78 17.62 17.9 0.6
Zr 79.76 78.74 80.23 78.85 79.4 0.7P4
Ce 20.24 21.26 19.77 21.15 20.6 0.7
Zr 77.92 78.05 76.85 77.41 77.6 0.5P5
Ce 22.08 21.95 23.15 22.59 22.4 0.5
Zr 72.69 74.72 73.61 73.06 73.5 0.9P6
Ce 27.31 25.28 26.39 26.94 26.5 0.9
Zr 65.56 65.35 65.7 67.11 65.9 0.8P7
Ce 34.44 34.65 34.3 32.89 34.1 0.8
Zr 60.00 59.05 58.56 59.61 59.3 0.6P8
Ce 40.00 40.95 41.44 40.39 40.7 0.6
Zr 49.88 49.11 48.67 49.83 49.4 0.6P9
Ce 50.12 50.89 51.33 50.17 50.6 0.6
Zr 33.73 34.37 34.59 34.91 34.4 0.5P10
Ce 66.27 65.63 65.41 65.09 65.6 0.5
Zr 20.22 21.85 22.49 19.77 21.1 1.3P11
Ce 79.78 78.15 77.51 80.23 78.9 1.3
6

Fig. S4. Comparison of the molar ratio of Ce:Zr used for the synthesis of mixed-metal Ce/Zr-UiO-66
with composition [CexZryO4(OH)4(BDC)6] and measured by EDX analysis.
SampleCex:Zry [at%]
measuredby EDX
Cex:Zry
calculated fromEDX
Cex:Zry
used for synthesis
P1 8.3 : 91.7 0.5 : 5.5 0.5 : 5.5
P2 15.4 : 84.6 0.9 : 5.1 1.0 : 5.0
P3 17.9 : 82.1 1.1 : 4.9 1.5 : 4.5
P4 20.6 : 79.5 1.2 : 4.8 2.0 : 4.0
P5 22.4 : 77.6 1.3 : 4.7 2.5 : 3.5
P6 26.5 : 73.5 1.6 : 4.4 3.0 3.0
P7 34.1 : 65.9 2.0 : 4.0 3.5 : 2.5
P8 40.7 : 59.3 2.4 : 3.6 4.0 : 2.0
P9 50.6 : 49.4 3.0 : 3.0 4.5 : 1.5
P10 65.6 : 34.4 3.9 : 2.1 5.0 : 1.0
P11 78.9 : 21.1 4.7 : 1.3 5.5 : 0.5
7

2.2. Powder X-ray diffraction
Tab. S5. Lattice parameters of all bimetallic UiO-66 compounds obtained by Le Bail profile fitting with
KCl (a = 6.2890(2) Å) as internal standard.
Sample SG a [Å] Rwp /% GoF
P1 𝐹𝑚3̅𝑚 20.8028(8) 4.13 1.99
P2 𝐹𝑚3̅𝑚 20.8636(7) 4.31 1.95
P3 𝐹𝑚3̅𝑚 20.8714(6) 3.91 1.87
P4 𝐹𝑚3̅𝑚 20.8988(4) 4.23 2.01
P5 𝐹𝑚3̅𝑚 20.9198(4) 4.27 1.96
P6 𝐹𝑚3̅𝑚 20.9469(5) 5.00 2.32
P7 𝐹𝑚3̅𝑚 20.9867(4) 5.62 2.50
P8 𝐹𝑚3̅𝑚 21.0329(3) 4.37 1.74
P9 𝐹𝑚3̅𝑚 21.1022(3) 4.66 1.75
P10 𝐹𝑚3̅𝑚 21.2282(4) 7.17 2.16
P11 𝐹𝑚3̅𝑚 21.3511(3) 7.88 2.11
10 20 30 40 50 60 70
15 20 25 30 35 40 45 50 55 60 65 70 75
inte
nsity
/ a.
u.
2 / °
observed calculated difference tics UiO-66 tics KCl
Fig. S1. Le Bail plot of UiO-66 sample P1. The observed PXRD pattern (λ= 1.5401 Å) is shown in black,
the calculated in red and the difference (observed - calculated) of both patterns is given in blue. The
allowed reflection positions of the peaks are given as black and green (KCl) tics.
8

10 20 30 40 50 60 70
15 20 25 30 35 40 45 50 55 60 65 70 75
inte
nsity
/ a.
u.
2 / °
observed calculated difference tics UiO-66 tics KCl
Fig. S2. Le Bail plot of UiO-66 sample P2. The observed PXRD pattern (λ= 1.5401 Å) is shown in black,
the calculated in red and the difference (observed - calculated) of both patterns is given in blue. The
allowed reflection positions of the peaks are given as black and green (KCl) tics.
10 20 30 40 50 60 70
15 20 25 30 35 40 45 50 55 60 65 70 75
inte
nsity
/ a.
u.
2 / °
observed calculated difference tics UiO-66 tics KCl
Fig. S3. Le Bail plot of UiO-66 sample P3. The observed PXRD pattern (λ= 1.5401 Å) is shown in black,
the calculated in red and the difference (observed - calculated) of both patterns is given in blue. The
allowed reflection positions of the peaks are given as black and green (KCl) tics.
9

10 20 30 40 50 60 70
15 20 25 30 35 40 45 50 55 60 65 70 75
inte
nsity
/ a.
u.
2 / °
observed calculated difference tics UiO-66 tics KCl
Fig. S4. Le Bail plot of UiO-66 sample P4. The observed PXRD pattern (λ= 1.5401 Å) is shown in black,
the calculated in red and the difference (observed - calculated) of both patterns is given in blue. The
allowed reflection positions of the peaks are given as black and green (KCl) tics.
10 20 30 40 50 60 70
15 20 25 30 35 40 45 50 55 60 65 70 75
inte
nsity
/ a.
u.
2 / °
observed calculated difference tics UiO-66 tics KCl
Fig. S5. Le Bail plot of UiO-66 sample P5. The observed PXRD pattern (λ= 1.5401 Å) is shown in black,
the calculated in red and the difference (observed - calculated) of both patterns is given in blue. The
allowed reflection positions of the peaks are given as black and green (KCl) tics.
10
10 20 30 40 50 60 70
15 20 25 30 35 40 45 50 55 60 65 70 75
inte
nsity
/ a.
u.
2 / °
observed calculated difference tics UiO-66 tics KCl
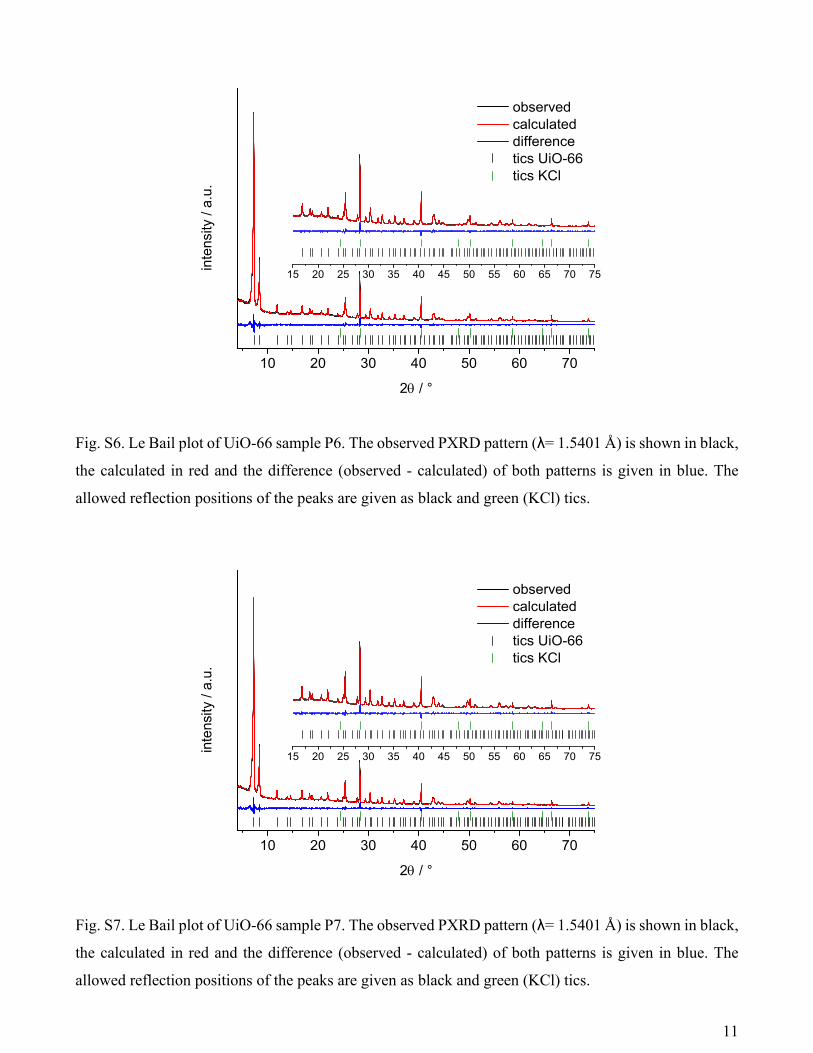
Fig. S6. Le Bail plot of UiO-66 sample P6. The observed PXRD pattern (λ= 1.5401 Å) is shown in black,
the calculated in red and the difference (observed - calculated) of both patterns is given in blue. The
allowed reflection positions of the peaks are given as black and green (KCl) tics.
10 20 30 40 50 60 70
15 20 25 30 35 40 45 50 55 60 65 70 75
inte
nsity
/ a.
u.
2 / °
observed calculated difference tics UiO-66 tics KCl
Fig. S7. Le Bail plot of UiO-66 sample P7. The observed PXRD pattern (λ= 1.5401 Å) is shown in black,
the calculated in red and the difference (observed - calculated) of both patterns is given in blue. The
allowed reflection positions of the peaks are given as black and green (KCl) tics.
11

10 20 30 40 50 60 70
15 20 25 30 35 40 45 50 55 60 65 70 75
inte
nsity
/ a.
u.
2 / °
observed calculated difference tics UiO-66 tics KCl
Fig. S8. Le Bail plot of UiO-66 sample P8. The observed PXRD pattern (λ= 1.5401 Å) is shown in black,
the calculated in red and the difference (observed - calculated) of both patterns is given in blue. The
allowed reflection positions of the peaks are given as black and green (KCl) tics.
10 20 30 40 50 60 70
15 20 25 30 35 40 45 50 55 60 65 70 75
inte
nsity
/ a.
u.
2 / °
observed calculated difference tics UiO-66 tics KCl
Fig. S9. Le Bail plot of UiO-66 sample P9. The observed PXRD pattern (λ= 1.5401 Å) is shown in black,
the calculated in red and the difference (observed - calculated) of both patterns is given in blue. The
allowed reflection positions of the peaks are given as black and green (KCl) tics.
12
10 20 30 40 50 60 70
15 20 25 30 35 40 45 50 55 60 65 70 75
inte
nsity
/ a.
u.
2 / °
observed calculated difference tics UiO-66 tics KCl
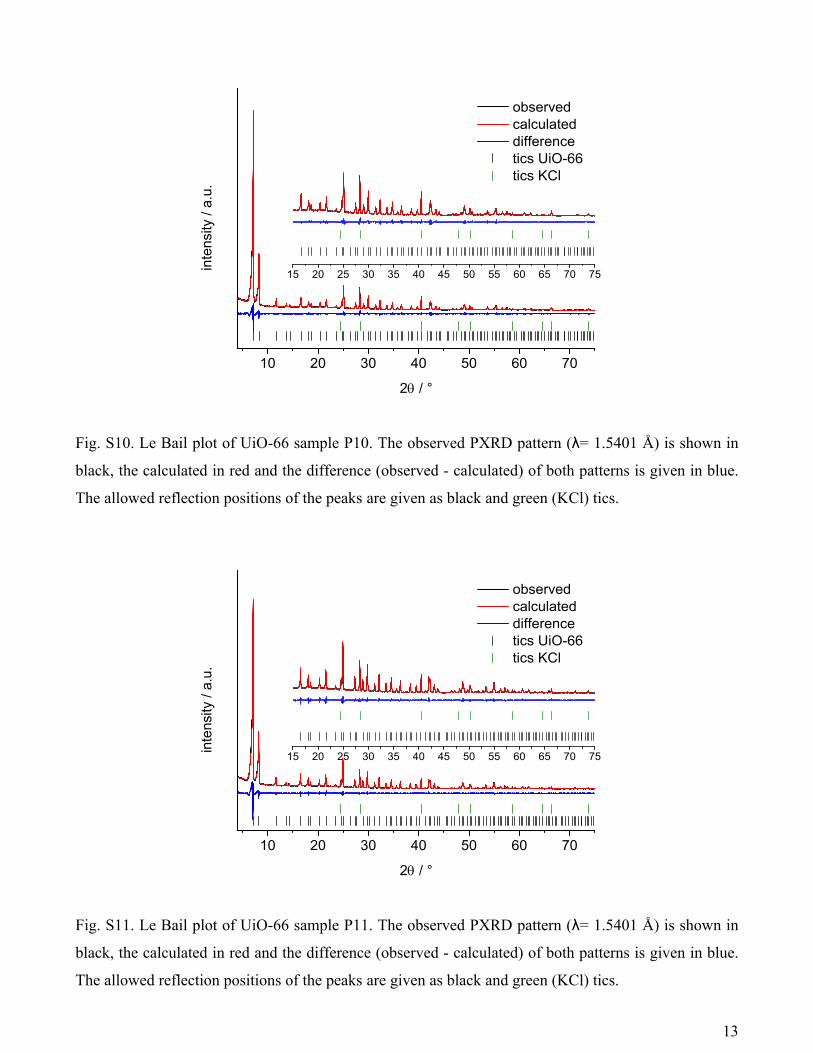
Fig. S10. Le Bail plot of UiO-66 sample P10. The observed PXRD pattern (λ= 1.5401 Å) is shown in
black, the calculated in red and the difference (observed - calculated) of both patterns is given in blue.
The allowed reflection positions of the peaks are given as black and green (KCl) tics.
10 20 30 40 50 60 70
15 20 25 30 35 40 45 50 55 60 65 70 75
inte
nsity
/ a.
u.
2 / °
observed calculated difference tics UiO-66 tics KCl
Fig. S11. Le Bail plot of UiO-66 sample P11. The observed PXRD pattern (λ= 1.5401 Å) is shown in
black, the calculated in red and the difference (observed - calculated) of both patterns is given in blue.
The allowed reflection positions of the peaks are given as black and green (KCl) tics.
13
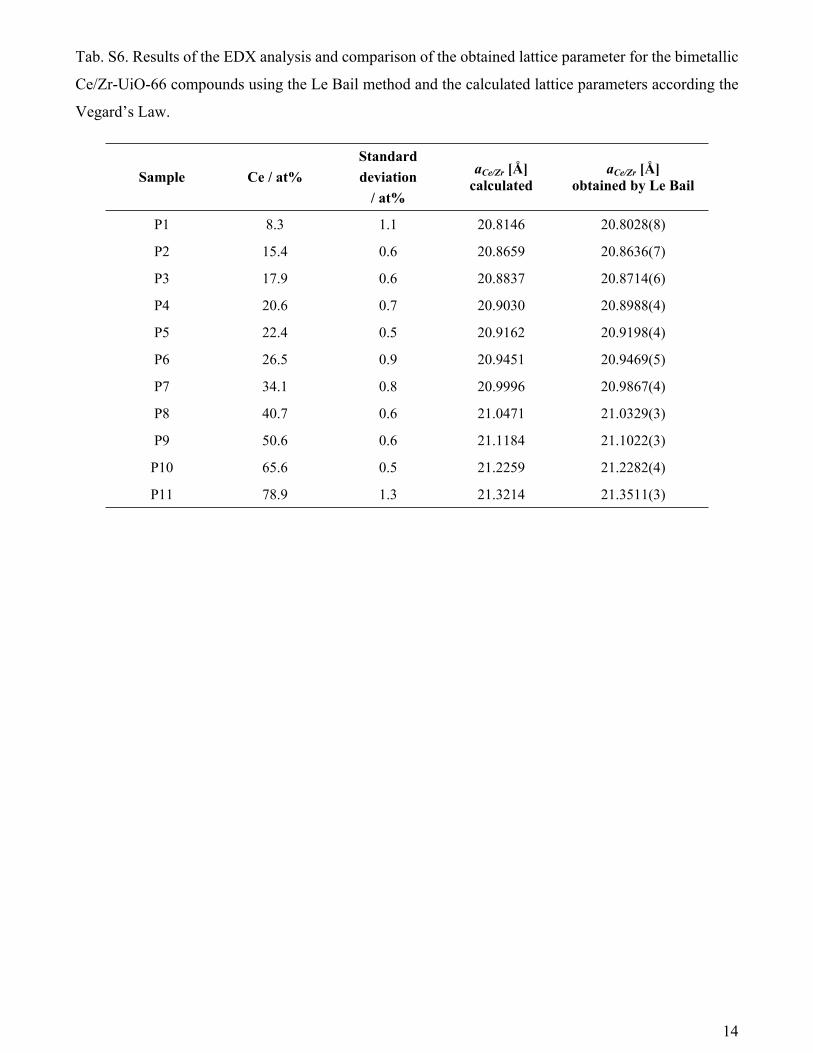
Tab. S6. Results of the EDX analysis and comparison of the obtained lattice parameter for the bimetallic
Ce/Zr-UiO-66 compounds using the Le Bail method and the calculated lattice parameters according the
Vegard’s Law.
Sample Ce / at%Standard deviation
/ at%
aCe/Zr [Å] calculated
aCe/Zr [Å] obtained by Le Bail
P1 8.3 1.1 20.8146 20.8028(8)
P2 15.4 0.6 20.8659 20.8636(7)
P3 17.9 0.6 20.8837 20.8714(6)
P4 20.6 0.7 20.9030 20.8988(4)
P5 22.4 0.5 20.9162 20.9198(4)
P6 26.5 0.9 20.9451 20.9469(5)
P7 34.1 0.8 20.9996 20.9867(4)
P8 40.7 0.6 21.0471 21.0329(3)
P9 50.6 0.6 21.1184 21.1022(3)
P10 65.6 0.5 21.2259 21.2282(4)
P11 78.9 1.3 21.3214 21.3511(3)
14
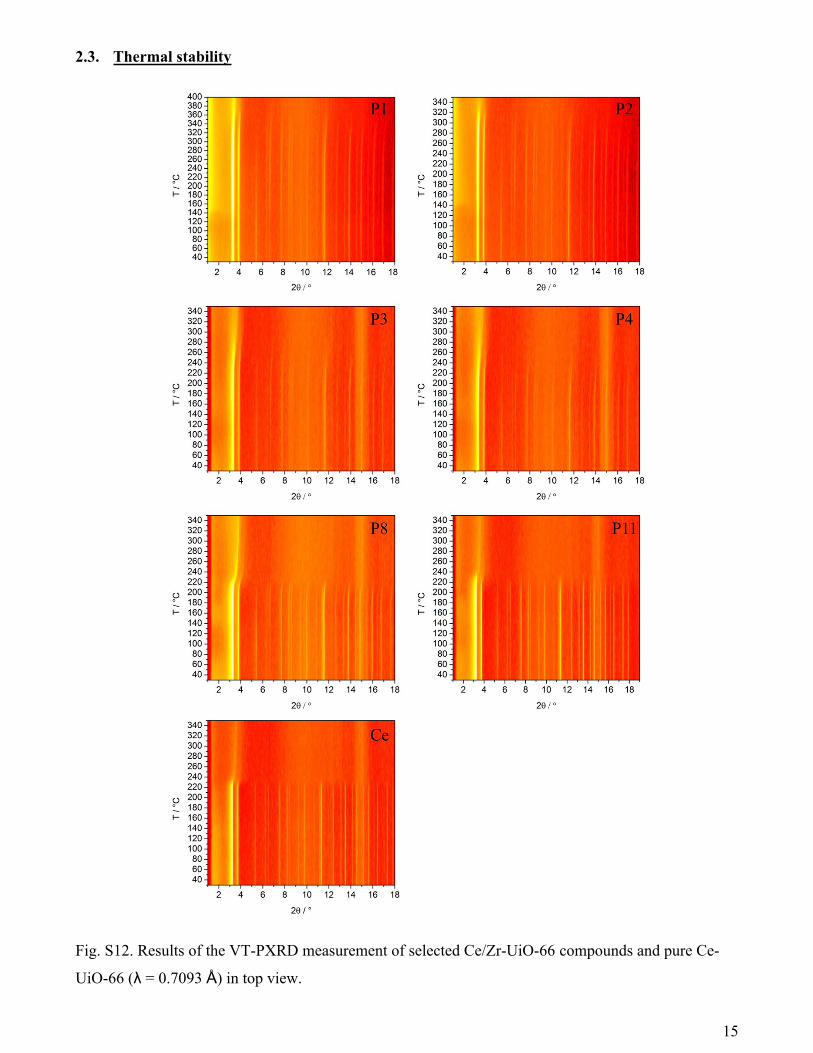
2.3. Thermal stability
Fig. S12. Results of the VT-PXRD measurement of selected Ce/Zr-UiO-66 compounds and pure Ce-
UiO-66 (λ = 0.7093 Å) in top view.
15

Fig. S13. Results of the VT-PXRD measurement (λ = 0.7093 Å) of UiO-66 sample P1. The red PXRD
pattern marks the temperature (350 °C) to which the compound is stable.
Fig. S14. Results of the VT-PXRD measurement (λ = 0.7093 Å) of UiO-66 sample P2. The red PXRD
pattern marks the temperature (350 °C) to which the compound is stable.
16
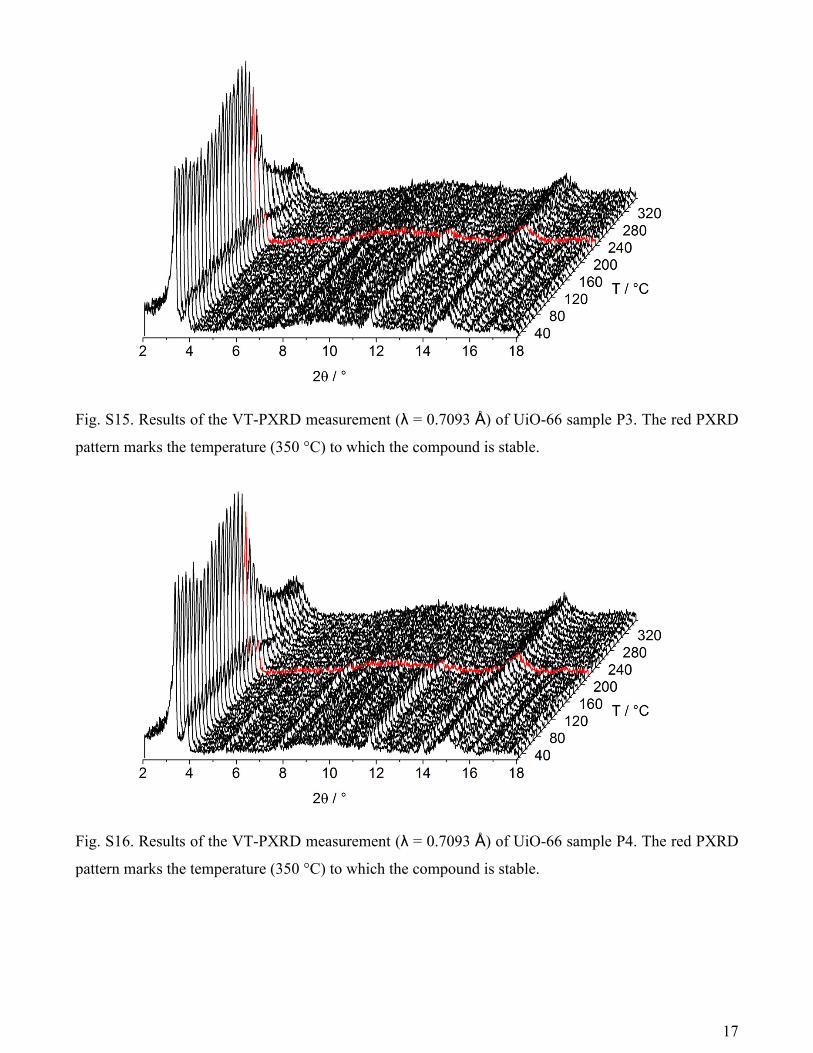
Fig. S15. Results of the VT-PXRD measurement (λ = 0.7093 Å) of UiO-66 sample P3. The red PXRD
pattern marks the temperature (350 °C) to which the compound is stable.
Fig. S16. Results of the VT-PXRD measurement (λ = 0.7093 Å) of UiO-66 sample P4. The red PXRD
pattern marks the temperature (350 °C) to which the compound is stable.
17
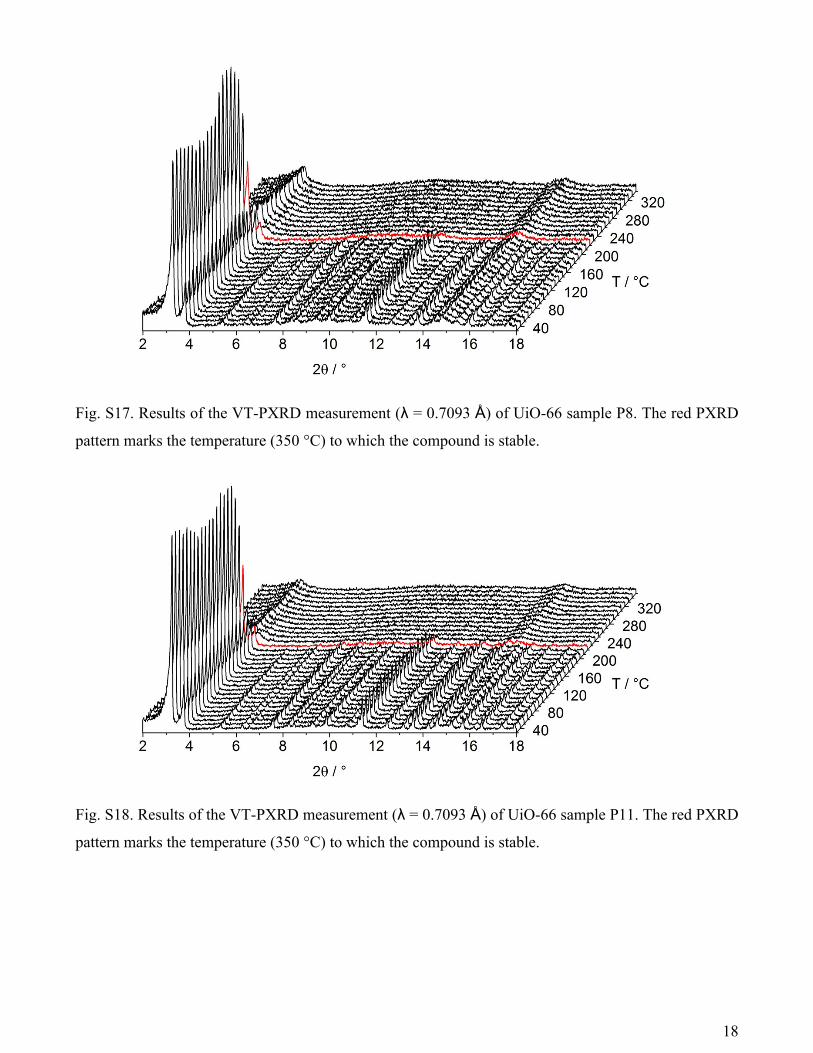
Fig. S17. Results of the VT-PXRD measurement (λ = 0.7093 Å) of UiO-66 sample P8. The red PXRD
pattern marks the temperature (350 °C) to which the compound is stable.
Fig. S18. Results of the VT-PXRD measurement (λ = 0.7093 Å) of UiO-66 sample P11. The red PXRD
pattern marks the temperature (350 °C) to which the compound is stable.
18
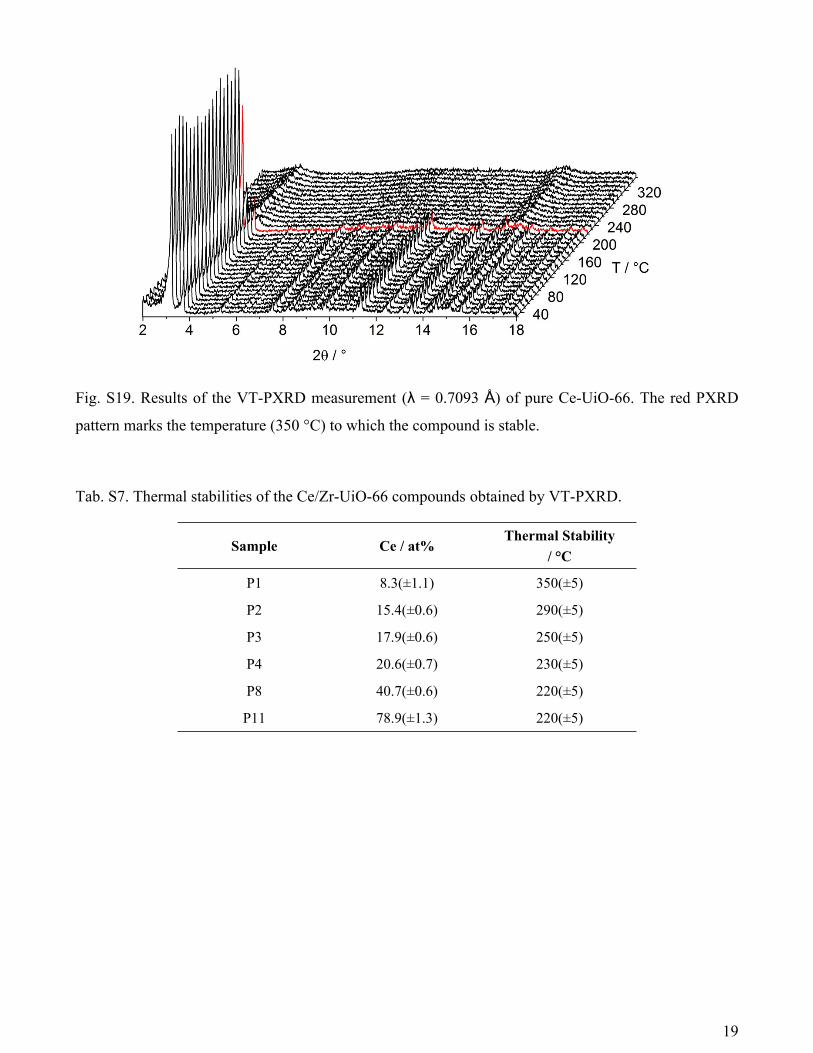
Fig. S19. Results of the VT-PXRD measurement (λ = 0.7093 Å) of pure Ce-UiO-66. The red PXRD
pattern marks the temperature (350 °C) to which the compound is stable.
Tab. S7. Thermal stabilities of the Ce/Zr-UiO-66 compounds obtained by VT-PXRD.
Sample Ce / at%Thermal Stability
/ °C
P1 8.3(±1.1) 350(±5)
P2 15.4(±0.6) 290(±5)
P3 17.9(±0.6) 250(±5)
P4 20.6(±0.7) 230(±5)
P8 40.7(±0.6) 220(±5)
P11 78.9(±1.3) 220(±5)
19
0 2 4 6 8 10 12 14 16 18 20 22 24200220240260280300320340360380400420440
T / °
C
Ce / at%
Equation y = a + b*xWeight Instrumental
Residual Sum of Squares 5.02386
Pearson's r -0.9925Adj. R-Square 0.97757
Value Standard Error Intercept 434.69786 14.04728 Slope -9.93803 0.86578
UiO-66(Ce0.05Zr0.95)
P1
P2
P3P4
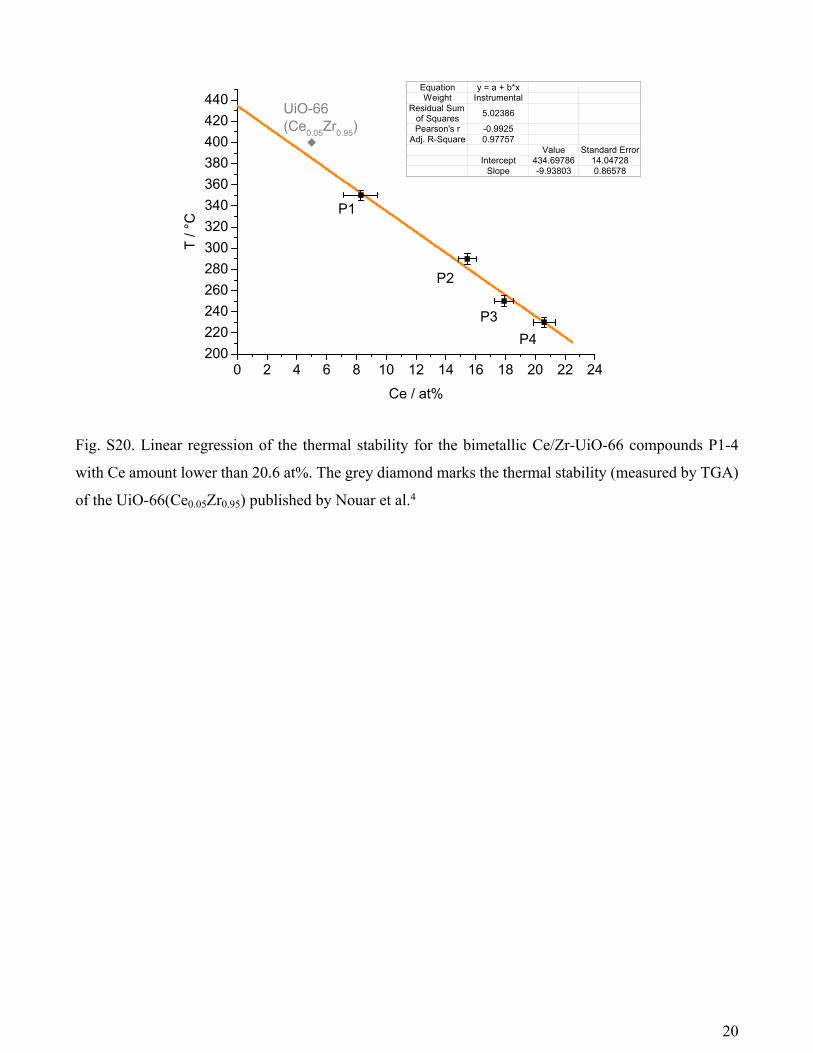
Fig. S20. Linear regression of the thermal stability for the bimetallic Ce/Zr-UiO-66 compounds P1-4
with Ce amount lower than 20.6 at%. The grey diamond marks the thermal stability (measured by TGA)
of the UiO-66(Ce0.05Zr0.95) published by Nouar et al.4
20
2.4. pH stability
2 4 6 8 10 12 14 16 18 20
* **
*H2BDC
inte
nsity
/ a.
u.
2 /°
pH=13
11
9
7
0
1
3
5
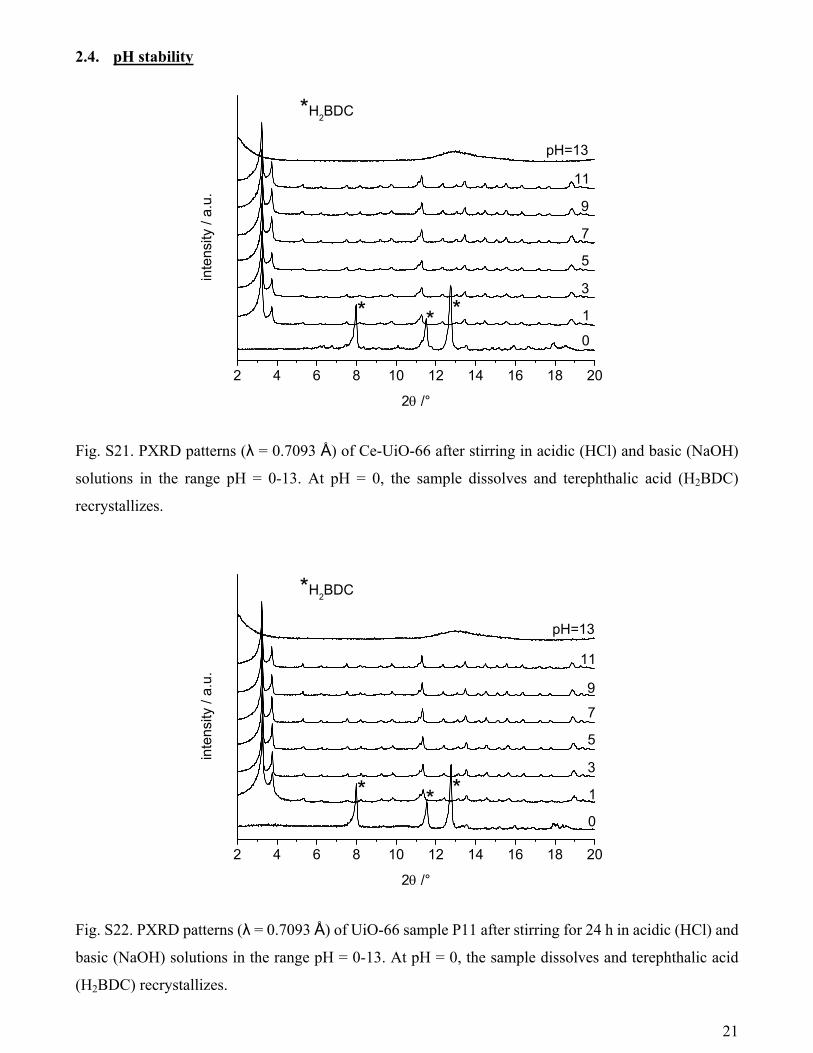
Fig. S21. PXRD patterns (λ = 0.7093 Å) of Ce-UiO-66 after stirring in acidic (HCl) and basic (NaOH)
solutions in the range pH = 0-13. At pH = 0, the sample dissolves and terephthalic acid (H2BDC)
recrystallizes.
2 4 6 8 10 12 14 16 18 20
*H2BDC
inte
nsity
/ a.
u.
2 /°
pH=13
11
9
7
0
1
3
5
* * *
Fig. S22. PXRD patterns (λ = 0.7093 Å) of UiO-66 sample P11 after stirring for 24 h in acidic (HCl) and
basic (NaOH) solutions in the range pH = 0-13. At pH = 0, the sample dissolves and terephthalic acid
(H2BDC) recrystallizes.
21

2 4 6 8 10 12 14 16 18 20
*H2BDC
inte
nsity
/ a.
u.
2 /°
pH=13
11
9
7
0
1
3
5
**
*
Fig. S23. PXRD patterns (λ = 0.7093 Å) of UiO-66 sample P8 after stirring for 24 h in acidic (HCl) and
basic (NaOH) solutions in the range pH = 0-13. At pH = 0, the sample dissolves and terephthalic acid
(H2BDC) recrystallizes.
2 4 6 8 10 12 14 16 18 20
*H2BDC
inte
nsity
/ a.
u.
2 /°
pH=13
11
9
7
0
1
3
5
* * *
Fig. S24. PXRD patterns (λ = 0.7093 Å) of UiO-66 sample P4 after stirring for 24 h in acidic (HCl) and
basic (NaOH) solutions in the range pH = 0-13. At pH = 0, the sample dissolves and terephthalic acid
(H2BDC) recrystallizes.
22
2 4 6 8 10 12 14 16 18 20
inte
nsity
/ a.
u.
2 /°
pH=13
11
9
7
0
1
3
5
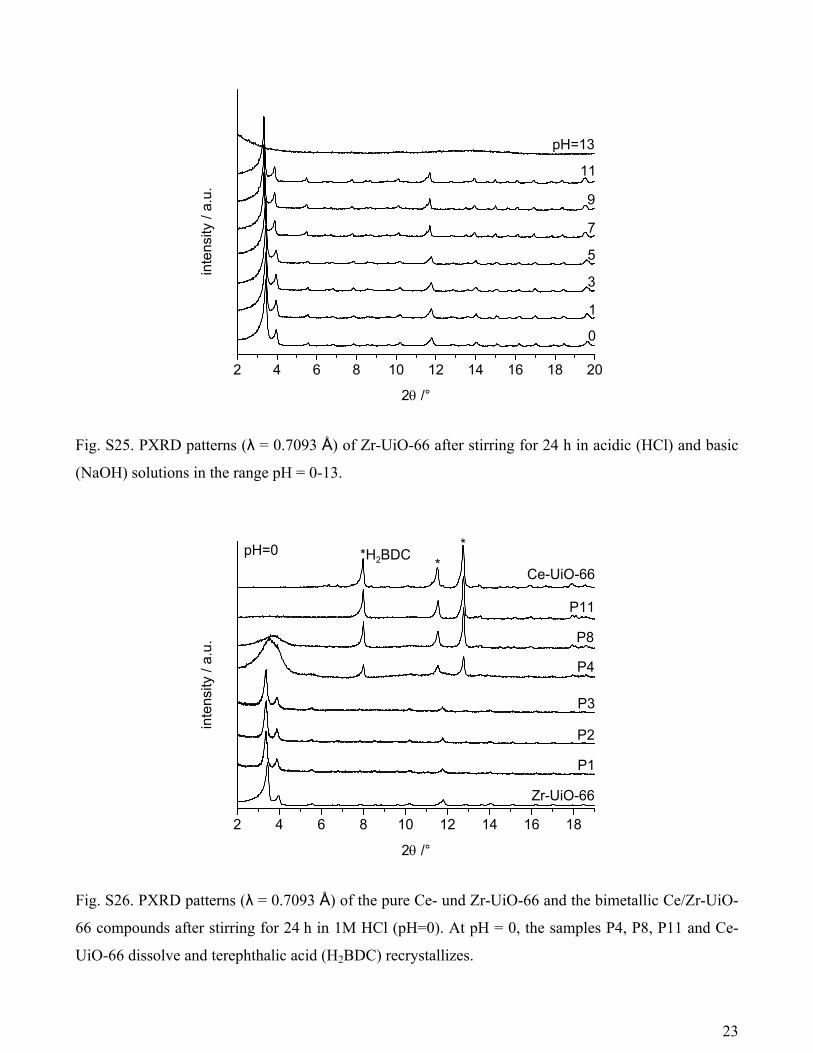
Fig. S25. PXRD patterns (λ = 0.7093 Å) of Zr-UiO-66 after stirring for 24 h in acidic (HCl) and basic
(NaOH) solutions in the range pH = 0-13.
2 4 6 8 10 12 14 16 18
**
pH=0
P4
P3
P1
inte
nsity
/ a.
u.
2 /°
P2
P8
P11
Ce-UiO-66
Zr-UiO-66
*H2BDC
Fig. S26. PXRD patterns (λ = 0.7093 Å) of the pure Ce- und Zr-UiO-66 and the bimetallic Ce/Zr-UiO-
66 compounds after stirring for 24 h in 1M HCl (pH=0). At pH = 0, the samples P4, P8, P11 and Ce-
UiO-66 dissolve and terephthalic acid (H2BDC) recrystallizes.
23

2.5. Thermogravimetric analysis
Tab. S8. Summary of the results of the thermogravimetric experiments on the bimetallic Ce/Zr-UiO-66
compounds. Comparison of the observed weight loss Δm2 (obs.) for the decomposition of the organic
linker molecules with the calculated weight loss Δm2 (calcd.).
Sample MMOF / g mol-1
MOxide / g mol-1
Δm1 / % (obs.)
Δm2 / % (obs.)
Δm2 / % (calcd.)
Δm2 (calcd.) - Δm2 (obs.)
mOxide / %
TDecomposition / °C
P1 1688 764 34.4 34.4 37.7 -3.3 31.2 > 360
P2 1708 783 36.5 33.7 35.2 -1.5 29.8 > 360
P3 1718 793 34.0 34.7 36.5 -1.8 31.3 > 350
P4 1723 798 35.0 35.3 34.4 +1.1 29.7 > 340
P8 1781 857 32.8 34.3 35.5 -1.2 32.9 > 300
P11 1894 969 34.9 32.5 31.1 +1.4 32.6 > 300
100 200 300 400 500 60020
30
40
50
60
70
80
90
100
mas
s / %
T / °C
m1 = 34.4 %
[Ce0.5Zr5.5O4(OH)4(BDC)6]
m2 = 34.4 %
31.2 % Ce0.5Zr5.5O12
Fig. S27. TG curve of UiO-66 sample P1 heated under air flow.
24
100 200 300 400 500 60020
30
40
50
60
70
80
90
100
mas
s / %
T / °C
m1 = 36.5 %
[Ce0.9Zr5.1O4(OH)4(BDC)6]
m2 = 33.7 %
29.8 % Ce0.9Zr5.1O12
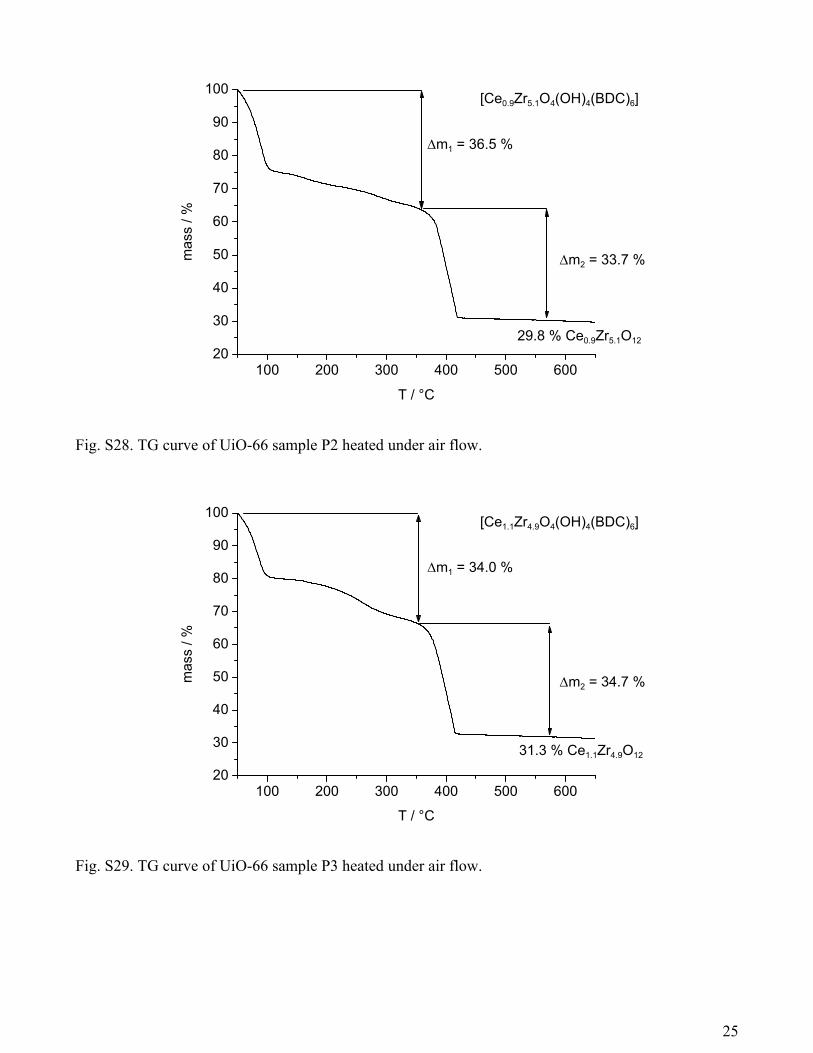
Fig. S28. TG curve of UiO-66 sample P2 heated under air flow.
100 200 300 400 500 60020
30
40
50
60
70
80
90
100
mas
s / %
T / °C
m1 = 34.0 %
[Ce1.1Zr4.9O4(OH)4(BDC)6]
m2 = 34.7 %
31.3 % Ce1.1Zr4.9O12
Fig. S29. TG curve of UiO-66 sample P3 heated under air flow.
25

100 200 300 400 500 60020
30
40
50
60
70
80
90
100[Ce1.2Zr4.8O4(OH)4(BDC)6]
mas
s / %
T / °C
m1 = 35.0 %
m2 = 35.3 %
29.7 % Ce1.2Zr4.8O12
Fig. S30. TG curve of UiO-66 sample P4 heated under air flow.
100 200 300 400 500 60020
30
40
50
60
70
80
90
100
mas
s / %
T / °C
m1 = 32.8 %
m2 = 34.3 %
32.9 % Ce2.4Zr3.2O12
[Ce2.4Zr3.2O4(OH)4(BDC)6]
Fig. S31. TG curve of UiO-66 sample P8 heated under air flow.
26

100 200 300 400 500 60020
30
40
50
60
70
80
90
100
32.6 % Ce4.7Zr1.3O12
[Ce4.7Zr1.3O4(OH)4(BDC)6]
mas
s / %
T / °C
m1 = 34.9 %
m2 = 32.5 %
Fig. S32. TG curve of UiO-66 sample P11 heated under air flow.
6 8 10 12 14 16 18 20
CeO2
P11P8
P4
P3
P2
inte
nsity
/ a.
u.
2 /°
P1ZrO2
Fig. S33. Comparison of the PXRD patterns of the bimetallic Ce/Zr-UiO-66 compounds after the
thermogravimetric analysis (650°C). The low signal to noise ratio in the PXRD patterns of P1, P2 and
P3 are due to very small residue amounts.
27

2.6. N2 sorption measurements
0.0 0.2 0.4 0.6 0.8 1.00
50100150200250300350400450500550600650 P1
P2 P3 P4 P8 P11
V ads
(STP
) / c
m3 g-1
p/p0
Fig. S34. Results of N2 sorption measurements of activated (160 °C, 10-2 kPa) Ce/Zr-UiO-66 compounds.
Filled symbols mark the adsorption, while empty symbols mark the desorption step.
10 15 20 25 30 35 40
inte
nsity
/ a.
u.
2 /°
P11
P8
P4
P3
P2
P1
Fig. S35. PXRD patterns (λ= 1.5406 Å) of Ce/Zr-UiO-66 compounds after the N2 sorption
measurement.
28

2.7. DLS measurements
Tab. S9. Results of the DLS measurement. The hydrodynamic diameter (dH) and the Polydispersity Index
(PI) for the mixed-metal UiO-66 compounds are given.
Sample dH / nm PI
P1 157(41) 0.192
P2 152(19) 0.153
P3 169(25) 0.098
P4 214(28) 0.159
P8 247(7) 0.103
P11 407(18) 0.143
100 200 300 400 500 600
P11
P8
P4
P3
P1
diffe
rent
ial n
umbe
r / a
.u.
dH / nm
P2
Fig. S36. Differential number distribution of the bimetallic Ce/Zr-UiO-66 compounds dispersed in
ethanol.
29

3.0. Characterization of Ce/Zr-MOF-808
3.1. Results of the EDX analyses
Tab. S10: Results of the EDX analysis of the bimetallic Ce/Zr-MOF-808 compounds.
Sample Elements 1. / at% 2. / at% 3. / at% 4. / at% Mean value / at%
Standard deviation
/ at%
Zr 80.46 79.23 81.39 80.69 80.4 0.2M1
Ce 19.54 20.77 18.61 19.31 19.6 0.2
Zr 67.51 69.72 68.45 68.65 68.6 0.3M2
Ce 32.49 30.28 31.55 31.35 31.4 0.3
Zr 60.12 59.10 60.24 59.94 59.9 0.4M3
Ce 39.88 40.90 39.76 40.06 40.1 0.4
Zr 47.21 45.48 45.97 46.26 46.2 0.5M4
Ce 52.79 54.52 54.03 53.74 53.8 0.5
Zr 32.25 31.38 31.03 31.20 31.5 0.7M5
Ce 67.75 68.62 68.97 68.80 68.5 0.7
Tab. S11. Comparison of the molar ratio of Ce:Zr used for the synthesis of mixed-metal Ce/Zr-MOF-
808 with composition [CexZryO4(OH)4(BTC)2(OH)6(H2O)6] and measured by EDX analysis.
SampleCex:Zry [at%]
measuredby EDX
Cex:Zry
calculated fromEDX
Cex:Zry
used for synthesis
M1 19.6 : 80.4 1.2 : 4.8 1.0 : 5.0
M2 31.4 : 68.8 1.9 : 4.1 2.0 : 4.0
M3 40.1 : 59.9 2.4 : 3.6 3.0: 3.0
M4 53.8 : 46.2 3.2 : 2.8 4.0 : 2.0
M5 68.5 : 31.5 4.1 : 1.9 5.0 : 1.0
30
3.2. Powder X-ray diffraction
10 20 30 40 50 60 70
*in
tens
ity /
a.u.
2 /°
M5
M4
M3
M2
M1
Ce-MOF-808
200
* *
220
222
*
KCl
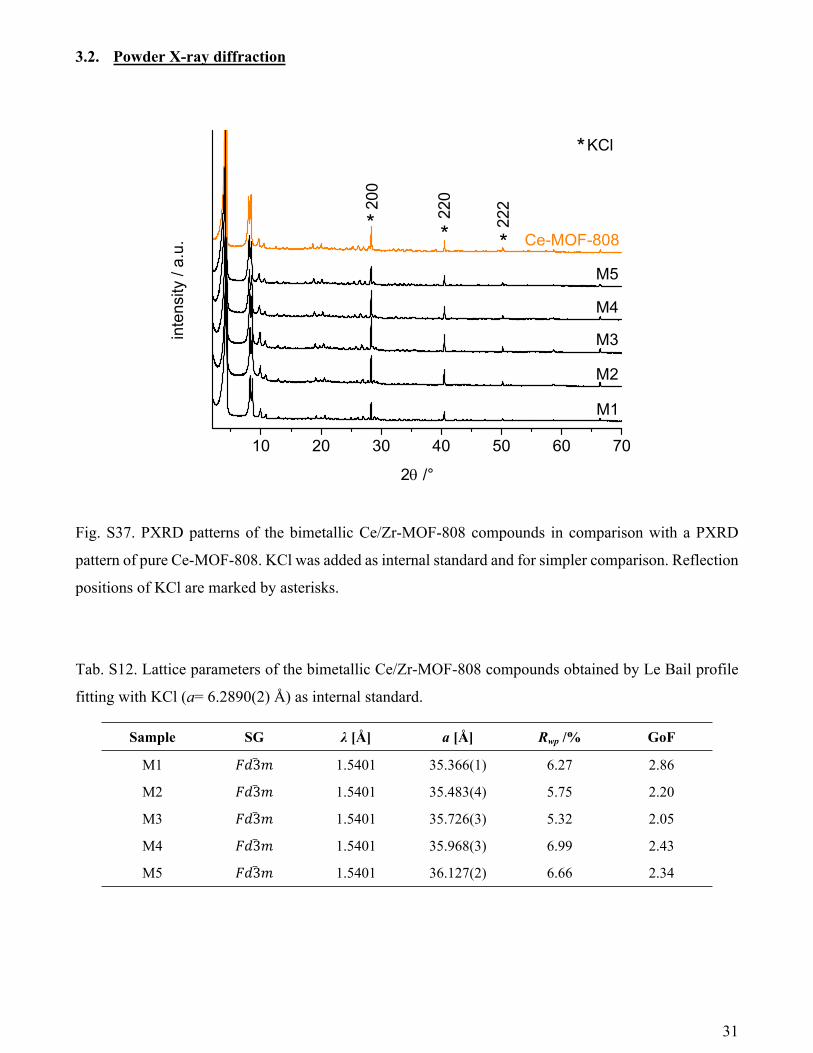
Fig. S37. PXRD patterns of the bimetallic Ce/Zr-MOF-808 compounds in comparison with a PXRD
pattern of pure Ce-MOF-808. KCl was added as internal standard and for simpler comparison. Reflection
positions of KCl are marked by asterisks.
Tab. S12. Lattice parameters of the bimetallic Ce/Zr-MOF-808 compounds obtained by Le Bail profile
fitting with KCl (a= 6.2890(2) Å) as internal standard.
Sample SG λ [Å] a [Å] Rwp /% GoF
M1 𝐹𝑑3̅𝑚 1.5401 35.366(1) 6.27 2.86
M2 𝐹𝑑3̅𝑚 1.5401 35.483(4) 5.75 2.20
M3 𝐹𝑑3̅𝑚 1.5401 35.726(3) 5.32 2.05
M4 𝐹𝑑3̅𝑚 1.5401 35.968(3) 6.99 2.43
M5 𝐹𝑑3̅𝑚 1.5401 36.127(2) 6.66 2.34
31

10 20 30 40 50 60 70
15 20 25 30 35 40 45 50 55 60 65 70 75
inte
nsity
/ a.
u.
2 / °
observed calculated difference tics MOF-808 tics KCl
Fig. S38. Le Bail plot of MOF-808 sample M1. The observed PXRD pattern (λ= 1.5401 Å) is shown in
black, the calculated in red and the difference (observed - calculated) of both patterns is given in blue.
The allowed reflection positions of the peaks are given as black and green (KCl) tics.
10 20 30 40 50 60 70
15 20 25 30 35 40 45 50 55 60 65 70 75
inte
nsity
/ a.
u.
2 / °
observed calculated difference tics MOF-808 tics KCl
Fig. S39. Le Bail plot of MOF-808 sample M2. The observed PXRD pattern (λ= 1.5401 Å) is shown in
black, the calculated in red and the difference (observed - calculated) of both patterns is given in blue.
The allowed reflection positions of the peaks are given as black and green (KCl) tics.
32

10 20 30 40 50 60 70
15 20 25 30 35 40 45 50 55 60 65 70 75
inte
nsity
/ a.
u.
2 / °
observed calculated difference tics MOF-808 tics KCl
Fig. S40. Le Bail plot of MOF-808 sample M3. The observed PXRD pattern (λ= 1.5401 Å) is shown in
black, the calculated in red and the difference (observed - calculated) of both patterns is given in blue.
The allowed reflection positions of the peaks are given as black and green (KCl) tics.
10 20 30 40 50 60 70
15 20 25 30 35 40 45 50 55 60 65 70 75
inte
nsity
/ a.
u.
2 / °
observed calculated difference tics MOF-808 tics KCl
Fig. S41. Le Bail plot of MOF-808 sample M4. The observed PXRD pattern (λ= 1.5401 Å) is shown in
black, the calculated in red and the difference (observed - calculated) of both patterns is given in blue.
The allowed reflection positions of the peaks are given as black and green (KCl) tics.
33

10 20 30 40 50 60 70
15 20 25 30 35 40 45 50 55 60 65 70 75
inte
nsity
/ a.
u.
2 / °
observed calculated difference tics MOF-808 tics KCl
Fig. S42. Le Bail plot of MOF-808 sample M5. The observed PXRD pattern (λ= 1.5401 Å) is shown in
black, the calculated in red and the difference (observed - calculated) of both patterns is given in blue.
The allowed reflection positions of the peaks are given as black and green (KCl) tics.
Tab. S13. Results of the EDX analysis and comparison of the obtained lattice parameter for the bimetallic
Ce/Zr-MOF-808 compounds using the Le Bail method and the calculated lattice parameters according
the Vegard’s Law.
Sample Ce / at%Standard deviation
/ at%
aCe/Zr [Å] calculated
aCe/Zr [Å] obtained by Le Bail
Zr-MOF-8085 0 - 35.076 -
M1 19.6 0.2 35.382 35.366(1)
M2 31.4 0.3 35.508 35.483(4)
M3 40.1 0.4 35.628 35.726(3)
M4 53.8 0.5 35.823 35.968(3)
M5 68.5 0.7 36.019 36.127(2)
Ce-MOF-8086 100 - 36.451 -
34

Fig. S43. Lattice parameters of Ce/Zr-MOF-808 calculated according the Vegard’s Law in comparison
with the lattice parameters obtained by the Le Bail method and using KCl as internal standard.
35

3.3. Thermal stability
Fig. S44. Results of the VT-PXRD measurement of the mixed-metal Ce/Zr-MOF-808 compounds (λ =
0.7093 Å) in top view (left). The red PXRD pattern marks the temperature to which the compounds are
stable (right).
36
3.4. N2 sorption measurements
0.0 0.2 0.4 0.6 0.8 1.00
50100150200250300350400450500550600650
M1 M3 M5
Vad
s(STP
) / c
m3 g-1
p/p0
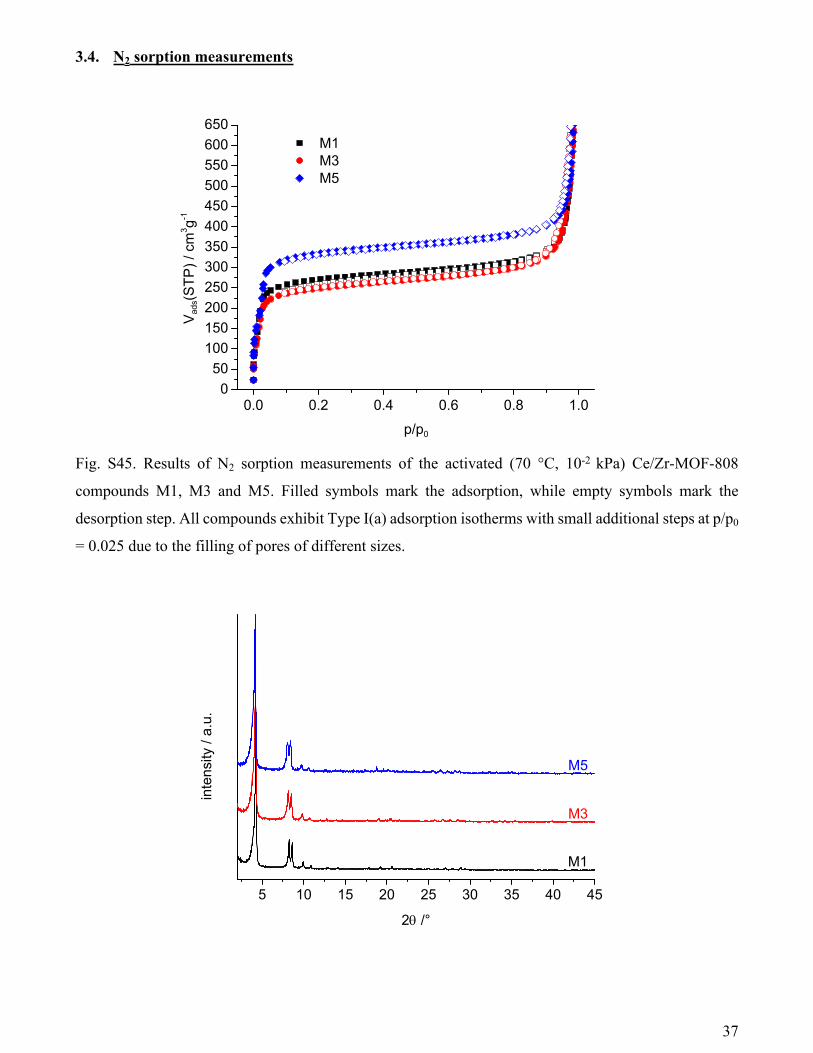
Fig. S45. Results of N2 sorption measurements of the activated (70 °C, 10-2 kPa) Ce/Zr-MOF-808
compounds M1, M3 and M5. Filled symbols mark the adsorption, while empty symbols mark the
desorption step. All compounds exhibit Type I(a) adsorption isotherms with small additional steps at p/p0
= 0.025 due to the filling of pores of different sizes.
5 10 15 20 25 30 35 40 45
M3
M5
inte
nsity
/ a.
u.
2 /°
M1
37

Fig. S46. PXRD patterns (λ= 1.5406 Å) of the bimetallic Ce/Zr-MOF-808 compounds after the N2
sorption measurement.
_______________
1 M. Thommes, K. Kaneko, A. V. Neimark, J. P. Olivier, F. Rodriguez-Reinoso, J.
Rouquerol and S. W. Sing Kenneth, Pure Appl. Chem., 2015, 87, 1051-1069.
2 M. Lammert, M. T. Wharmby, S. Smolders, B. Bueken, A. Lieb, K. A. Lomachenko, D.
D. Vos and N. Stock, Chem. Commun., 2015, 51, 12578-12581.
3 J. H. Cavka, S. Jakobsen, U. Olsbye, N. Guillou, C. Lamberti, S. Bordiga and K. P.
Lillerud, J. Am. Chem. Soc., 2008, 130, 13850-13851.
4 F. Nouar, M. I. Breeze, B. C. Campo, A. Vimont, G. Clet, M. Daturi, T. Devic, R. I.
Walton and C. Serre, Chem. Commun., 2015, 51, 14458-14461.
5 H. Furukawa, F. Gándara, Y.-B. Zhang, J. Jiang, W. L. Queen, M. R. Hudson and O.
M. Yaghi, J. Am. Chem. Soc., 2014, 136, 4369-4381.
6 M. Lammert, C. Glißmann, H. Reinsch and N. Stock, Cryst. Growth Des., 2016, DOI:
10.1021/acs.cgd.1026b01512.
38