supporting information for - rsc.org · 0.04 0.08 0.12 0.16 0.20 ce 1 2 ... valuestandard error b...
TRANSCRIPT

Supporting Information for
A Novel Fluorescent “Turn-On” Chemodosimeter for Cyanide Based on Dual
Reversible and Irreversible Deprotonation of NH and CH Group
Chuanxiu Zhang, a, b
Chuanxiang Liu,* a Baiyun Li,
a, b Jinju Chen,
a Hua Zhang,*
a Zhou Hu
a and
Fengping Yi *
b
a School of Chemical and Environmental Engineering, Shanghai Institute of Technology, 201418
Shanghai, China b School of Perfume and Aroma Technology, Shanghai Institute of Technology, 201418 Shanghai,
China
e-mail: [email protected]; [email protected]; [email protected]
Table of Contents
1. 1H,
13C NMR, IR and HRMS-ESI copies of the compound 2 (Fig.S1-S4). ................................ S1
2. 1H,
13C NMR, IR and HRMS-ESI copies of the dosimeter 4 (Fig.S5-S8) .................................. S4
3. 1H,
13C NMR, IR and HRMS-ESI copies of the dosimeter 5 (Fig.S9-S12) ................................ S7
4. 1H,
13C NMR, IR and HRMS-ESI copies of the compound 6 (Fig.S13-S16). .......................... S10
5. 1H,
13C NMR, IR and HRMS-ESI copies of the compound 7 (Fig.S17-S20). .......................... S13
6. Interference experiments of 5 toward cyanide (Fig.S21). ......................................................... S16
7. The UV detection limit of the probe 5 with CN (Fig.S22). ..................................................... S17
8. The UV detection limit of the probe 4 with CN (Fig.S23). ..................................................... S18
9. UV-visible titration of 5 with Bu4N+CN
in CH3CN (Fig.S24). ............................................... S19
10. UV-visible titration of 4 with Bu4N+CN
in CH3CN (Fig.S25). ............................................. S20
11. Fluorescence spectra of 5 in the presence of different anions in CH3CN (Fig.S26). .............. S21
12. Comparative table of this sensor with others (Table.S1). ....................................................... S21
13. UV-visible titration of 7 with Bu4N+CN
in CH3CN (Fig.S27). ............................................. S21
14. The fluorescence detection limit of probe 5 with CN (Fig.S28). .......................................... S23
15. Linear fluorescence response of probe 5 to CN (Fig.S29) . .................................................. S24
16. Fluorescence spectra of compound 5 with NaCN in mixture solvents (Fig.S30) ................... S25
17. Fluorescence spectra of compound 5 with in Bu4N+CN
mixture solvents (Fig.S31) ............ S26
18. The pH-dependent behaviour of the probe 5 in different pH values (Fig.S32). ...................... S27
19. Confocal microscopic images of RAW 264.7 Macrophages cells (Fig.S33) .......................... S28
20. The detailed 1H NMR titration of 7 and 5 with F
(6–10 ppm) (Fig.S34) .............................. S29
21. The 1H NMR titration of 5 with CN
(Fig.S35) ...................................................................... S30
22. The 1H NMR titration of 7 with CN
(Fig.S36) ...................................................................... S31
23. The final state of compound 5 and 7 with F and CN
(Fig.S37). .......................................... S32
Electronic Supplementary Material (ESI) for New Journal of Chemistry.This journal is © The Royal Society of Chemistry and the Centre National de la Recherche Scientifique 2015

S1
1. 1H,
13C NMR, IR and HRMS-ESI copies of the compound 2.
Fig. S1. 1H NMR (CDCl3, 400 MHz) spectra of compound 2.

S2
Fig. S2. 13
C NMR (DMSO-d6, 100 MHz) spectra of compound 2.
Fig. S3. IR spectra of compound 2.

S3
Fig. S4. ESI mass spectra of compound 2.

S4
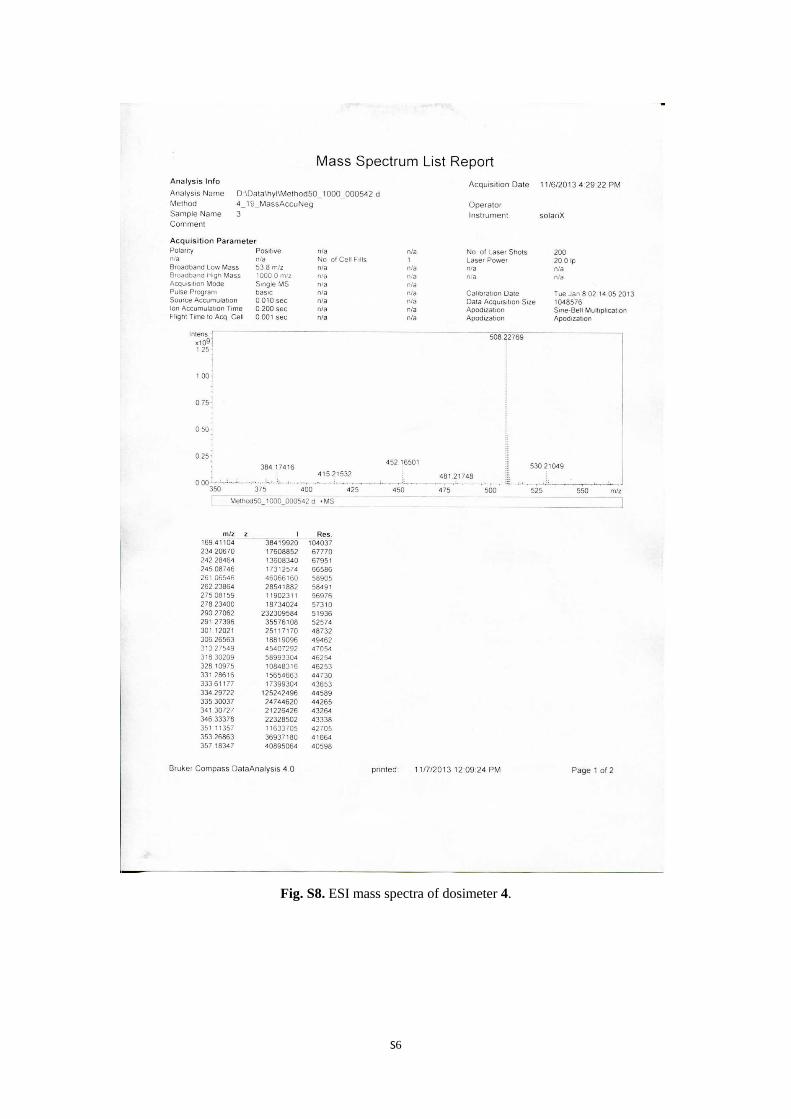
2. 1H,
13C NMR, IR and HRMS-ESI copies of the dosimeter 4
Fig. S5. 1H NMR (CDCl3, 400 MHz) spectra of dosimeter 4.

S5
Fig. S6.
13C NMR (DMSO-d6, 100 MHz) spectra of dosimeter 4.
Fig. S7. IR spectra of dosimeter 4.
S6
Fig. S8. ESI mass spectra of dosimeter 4.

S7
3. 1H,
13C NMR, IR and HRMS-ESI copies of the dosimeter 5
Fig. S9. 1H NMR (DMSO-d6, 500 MHz) spectra of dosimeter 5.

S8
Fig. S10. 13
C NMR (DMSO-d6, 100 MHz) spectra of dosimeter 5.
Fig. S11. IR spectra of dosimeter 5.

S9
Fig. S12. ESI mass spectra of dosimeter 5.

S10
4. 1H,
13C NMR, IR and HRMS-ESI copies of the compound 6.
Fig. S13. 1H NMR (CDCl3, 400 MHz) spectra of compound 6.

S11
Fig. S14. 13
C NMR (DMSO-d6, 100 MHz) spectra of compound 6.
Fig. S15. IR spectra of compound 6.

S12
Fig. S16. ESI mass spectra of compound 6.

S13
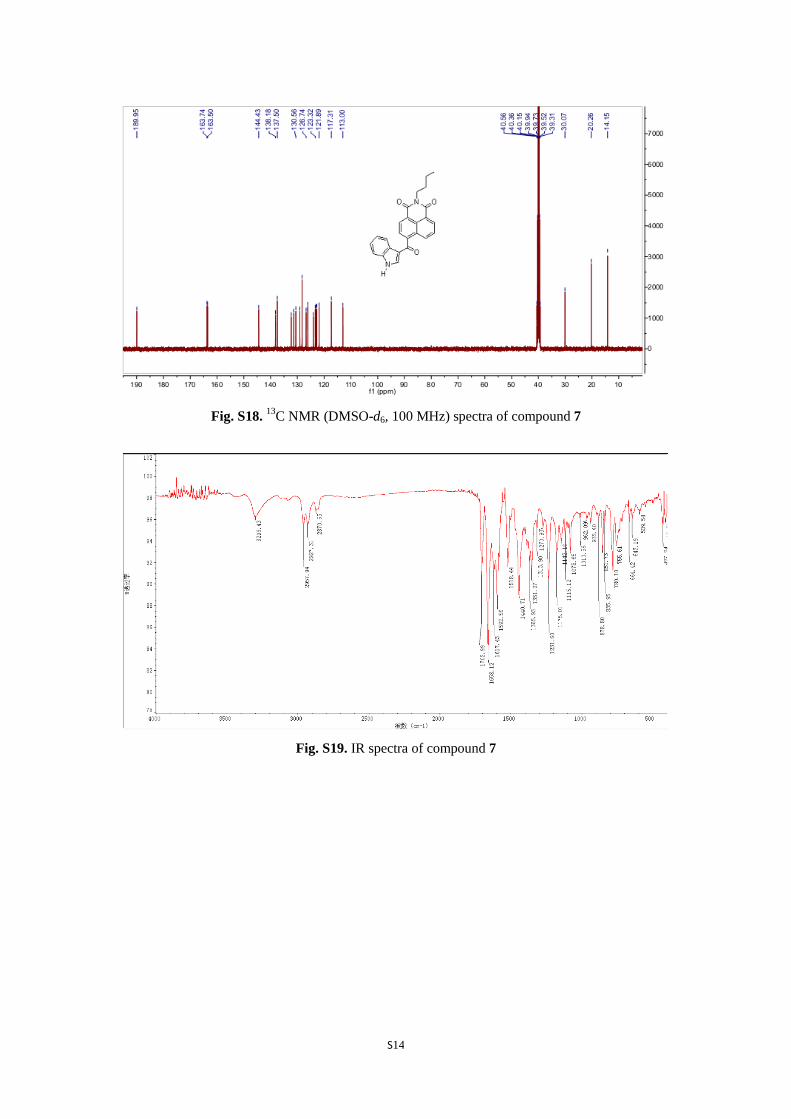
5. 1H,
13C NMR, IR and HRMS-ESI copies of the compound 7.
Fig. S17. 1H NMR (CDCl3, 400 MHz) spectra of compound 7.
S14
Fig. S18. 13
C NMR (DMSO-d6, 100 MHz) spectra of compound 7
Fig. S19. IR spectra of compound 7

S15
Fig. S20. ESI mass spectra of compound 7
S16
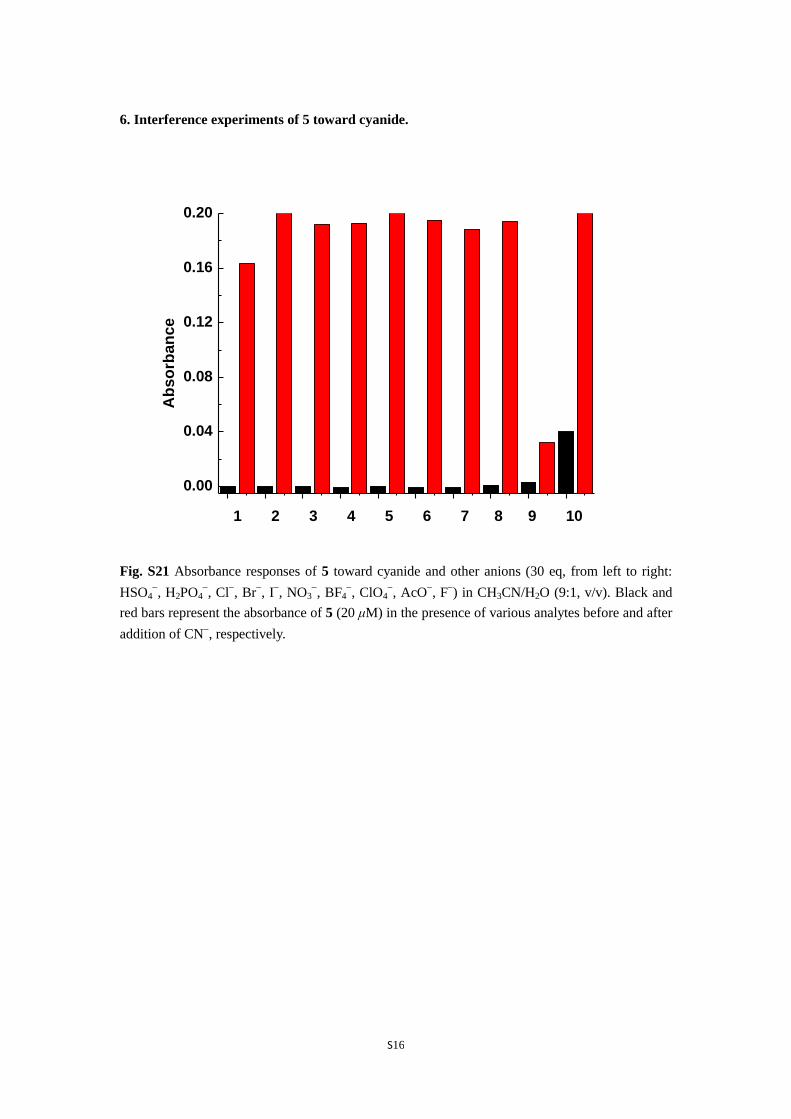
6. Interference experiments of 5 toward cyanide.
0.00
0.04
0.08
0.12
0.16
0.20
Ab
so
rban
ce
1 2 3 4 5 6 7 8 9 10
Fig. S21 Absorbance responses of 5 toward cyanide and other anions (30 eq, from left to right:
HSO4, H2PO4
, Cl
, Br
, I
, NO3
, BF4
, ClO4
, AcO
, F
) in CH3CN/H2O (9:1, v/v). Black and
red bars represent the absorbance of 5 (20 μM) in the presence of various analytes before and after
addition of CN, respectively.

S17
7. The UV detection limit of the probe 5 with CN.
0 5 10 15 20 250.0
0.1
0.2
0.3
0.4
0.5
A6
13
/A3
33
[CN-]/
Equation y = a + b*x
Weight No Weighting
Residual Sum of Squares0.0016
Pearson's r 0.99454
Adj. R-Square 0.98693
Value Standard Error
B Intercept 0.00462 0.0122
B Slope 0.02404 0.00113
y = 0.00462 + 0.02404*x
R2=0.98693
Fig. S22. Absorbance intensity ratio (A610/A333) of dosimeter 5 (20 μM) as a function of CN
concentration from 0- 42 μM (0–2.1 equiv),
SD N
0.01791 7
The result of the analysis as follows:
Linear Equation : y = 0.00462 + 0.02404 * x, R2 = 0.98693
S = 2.404 * 104, K = 3, δ = 0.01791
LOD = K * δ/S = 2.235 μM
S18
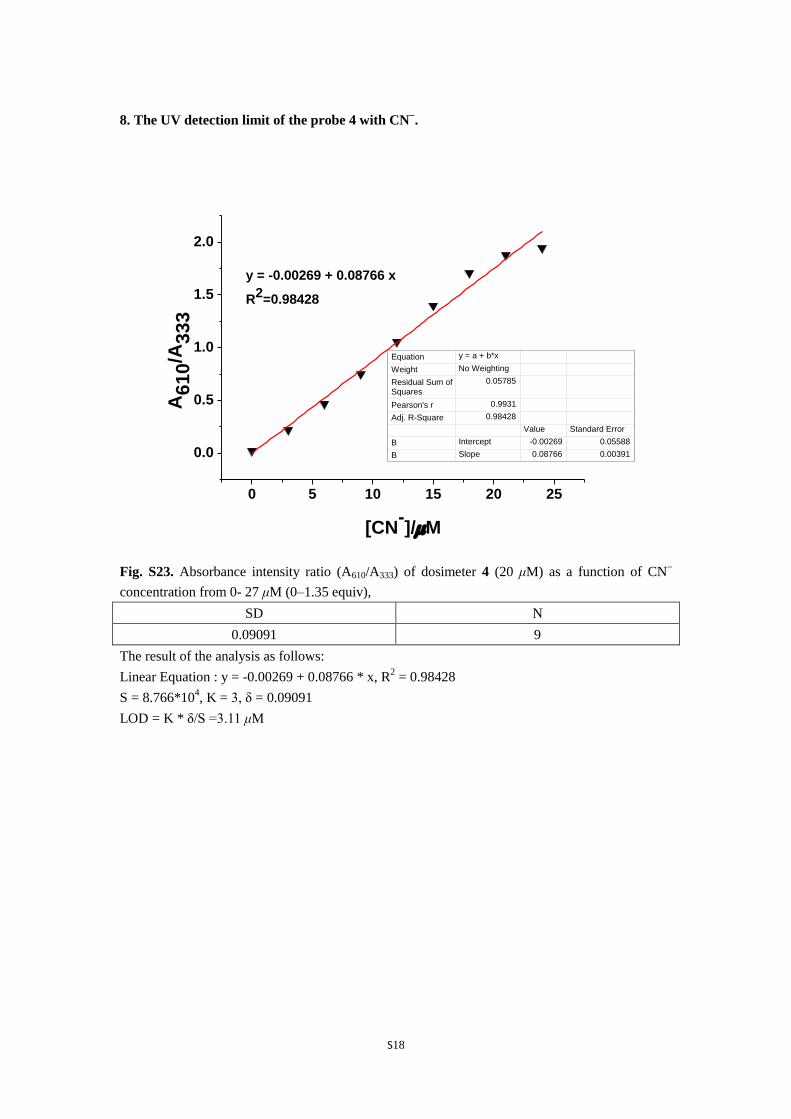
8. The UV detection limit of the probe 4 with CN.
0 5 10 15 20 25
0.0
0.5
1.0
1.5
2.0
A6
10
/A3
33
[CN-]/M
y = -0.00269 + 0.08766 x
R2=0.98428
Equation y = a + b*x
Weight No Weighting
Residual Sum of Squares
0.05785
Pearson's r 0.9931
Adj. R-Square 0.98428
Value Standard Error
B Intercept -0.00269 0.05588
B Slope 0.08766 0.00391
Fig. S23. Absorbance intensity ratio (A610/A333) of dosimeter 4 (20 μM) as a function of CN
concentration from 0- 27 μM (0–1.35 equiv),
SD N
0.09091 9
The result of the analysis as follows:
Linear Equation : y = -0.00269 + 0.08766 * x, R2 = 0.98428
S = 8.766*104, K = 3, δ = 0.09091
LOD = K * δ/S =3.11 μM

S19
9. UV-visible titration of 5 with Bu4N+CN
in CH3CN.
300 400 500 600 700 8000.0
0.1
0.2
0.3
0.4
0.5
0 20 40 60 80 100 120 140 160 180 2000.00
0.02
0.04
0.06
0.08
0.10
0.12
0.14
Ab
so
rban
ce
Wavelength (nm)
Ab
so
rban
ce
[CN-]/
Fig. S24. UV-visible titration of 5 (20 μM) with Bu4N+CN
in CH3CN. The inset shows the
absorbance at 610 nm as a function of [CN].

S20
10. UV-visible titration of 4 with Bu4N+CN
in CH3CN.
300 400 500 600 700 8000.0
0.1
0.2
0.3
0.4
0.5
0 50 100 150 200 2500.00
0.05
0.10
0.15
0.20
0.25
0.30
0.35
0.40
Ab
so
rban
ce
Wavelength (nm)
333 nm
380 nm
610 nm
Ab
so
rba
nc
e
[CN-]/M
Fig. S25. UV-visible titration of 4 (20 μM) with Bu4N+CN
in CH3CN. The inset shows the
absorbance at 333, 380 and 610 nm as a function of [CN].

S21
11. Fluorescence spectra of 5 in the presence of different anions in CH3CN.
390 420 450 480 510 540 570 600
0
500
1000
1500
2000
2500
3000
3500
4000
5+CN-
5, 5+other anions
Wavelength (nm)
I (a
.u.)
.
Fig. S26. Fluorescence spectra of 5 (20 μM) in the presence of different anions (ca. 24 equiv) in
CH3CN.
12. Comparative table of this sensor with others.
Table S1. Comparison of this sensor with others
Fluorescence
change
Recognition site
J. Org. Chem. (2011) 76, 6962 On-Off Single: C=C double bonds
Org. Lett. (2006) 8, 5721 On-Off Single: C=C double bonds
Chem. Lett. (2011) 40, 623 On-Off Single: C=C double bonds
J. Org. Chem. (2009) 74, 7496
Org. Lett. (2008) 10, 461
Tetrahedron Lett. (2008) 49, 5544
On-Off
On-Off
On-Off
Single: C=N double bonds
Single: C=O double bonds
Single: C=O double bonds
This sensor Off-On Dual deprotonation: CH
(irreversible) and NH
(reversible)

S22
13. UV-visible titration of 7 with Bu4N+CN
in CH3CN.
300 400 500 600 700 8000.0
0.1
0.2
0.3
0.4
0.5
0 50 100 150 200 250 300 350 400
0.0
0.1
0.2
0.3
0.4
0.5
Ab
so
rban
ce
Wavelength (nm)
300nm
345nm
444nm
Ab
so
rba
nc
e
[CN-]/
Fig. S27. UV-visible titration of 7 (20 μM) with Bu4N+CN
in CH3CN. The inset shows the
absorbance at 300, 345 and 444 nm as a function of [CN].

S23
14. The fluorescence detection limit of probe 5 with CN.
-4.6 -4.4 -4.2 -4.0 -3.8 -3.6 -3.4
0.2
0.4
0.6
0.8
1.0
(F-F
0)/
(F m
ax-F
0)
lg [CN-]
Equation y = a + b*x
Weight No Weighting
Residual Sum of Squares
0.04386
Pearson's r 0.9868
Adj. R-Square 0.97203
Value Standard Error
Concatenate Intercept 3.33773 0.11818
Concatenate Slope 0.71753 0.0304
y = 3.34 + 0.718*x
LOD = K*S = 0.226
Fig. S28. Response of fluorescence intensity to changing CN concentrations in CH3CN. ([5] = 20
μM, [CN] = 5000 μM, λex = 353 nm, λem = 373 nm).
SD N
0.05407 16
The result of the analysis as follows:
Linear Equation : y = 3.34 + 0.718 * x, R2 = 0.97203
S = 7.18 * 105, K = 3, δ = 0.05407
LOD = K * δ/S = 0.226 μM

S24
15. Linear fluorescence response of probe 5 to CN .
2 4 6 8 10
300
400
500
600
[CN_]/
I (a
.u.)
Equation y = a + b*x
Weight No Weighting
Residual Sum of Squares
1604.619
Pearson's r 0.98895
Adj. R-Square 0.97069
Value Standard Error
B Intercept 234.43 24.25614
B Slope 42.245 3.65675
y = 234.43 + 42.245*x
R2 = 0.97089
Fig. S29. Linear fluorescence response of probe 5 to CN concentration ranging from 0 to 10 μM.

S25
16. Fluorescence spectra of compound 5 with NaCN in mixture solvents
400 450 500 550 6000
100
200
300
400
500
0 1000 2000 3000 4000 5000
0
100
200
300
400
500
I (a
.u.)
Wavelength (nm)
I (a
.u.)
[CN_
]/M
Fig. S30. Fluorescence spectra of compound 5 (20μM) upon gradual addition of NaCN (0-200
equiv)in CH3CN/H2O (95/5; v/v)with excitation at 353nm. Inset: Plot of fluorescence intensity
(λex=420nm).
S26
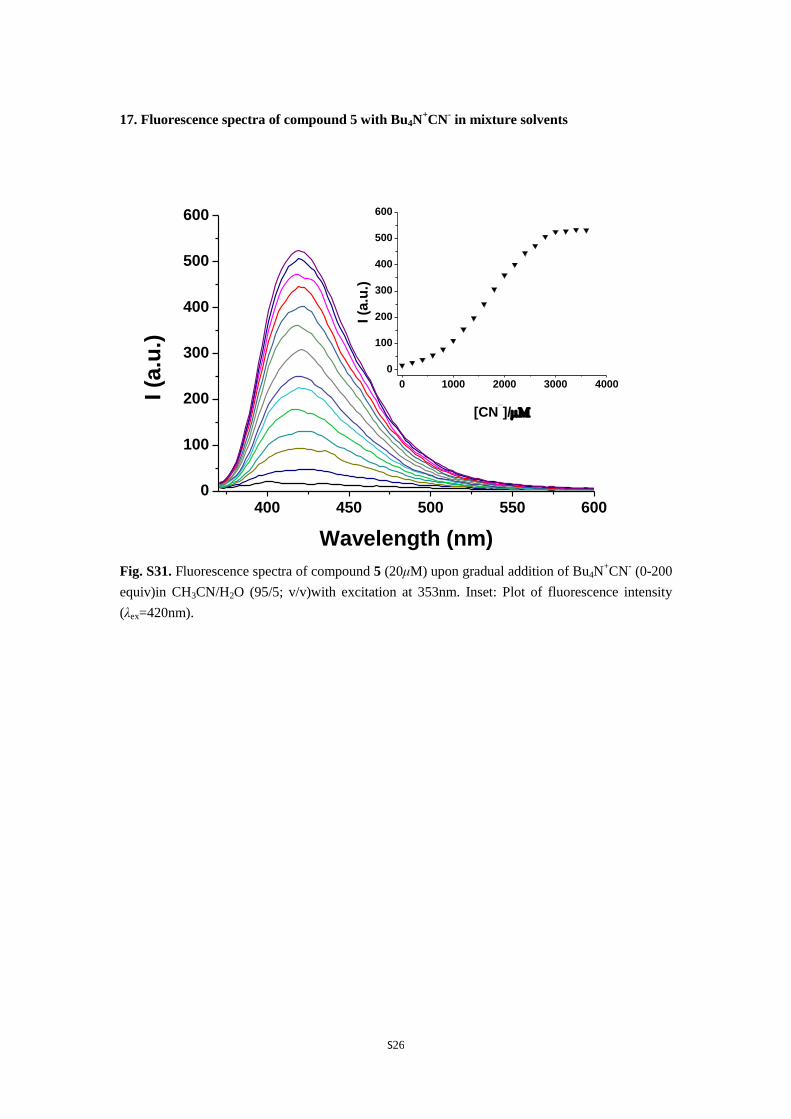
17. Fluorescence spectra of compound 5 with Bu4N+CN
- in mixture solvents
400 450 500 550 6000
100
200
300
400
500
600
0 1000 2000 3000 4000
0
100
200
300
400
500
600
I (a
.u.)
Wavelength (nm)
I (a
.u.)
[CN_
]/
Fig. S31. Fluorescence spectra of compound 5 (20μM) upon gradual addition of Bu4N+CN
- (0-200
equiv)in CH3CN/H2O (95/5; v/v)with excitation at 353nm. Inset: Plot of fluorescence intensity
(λex=420nm).
S27
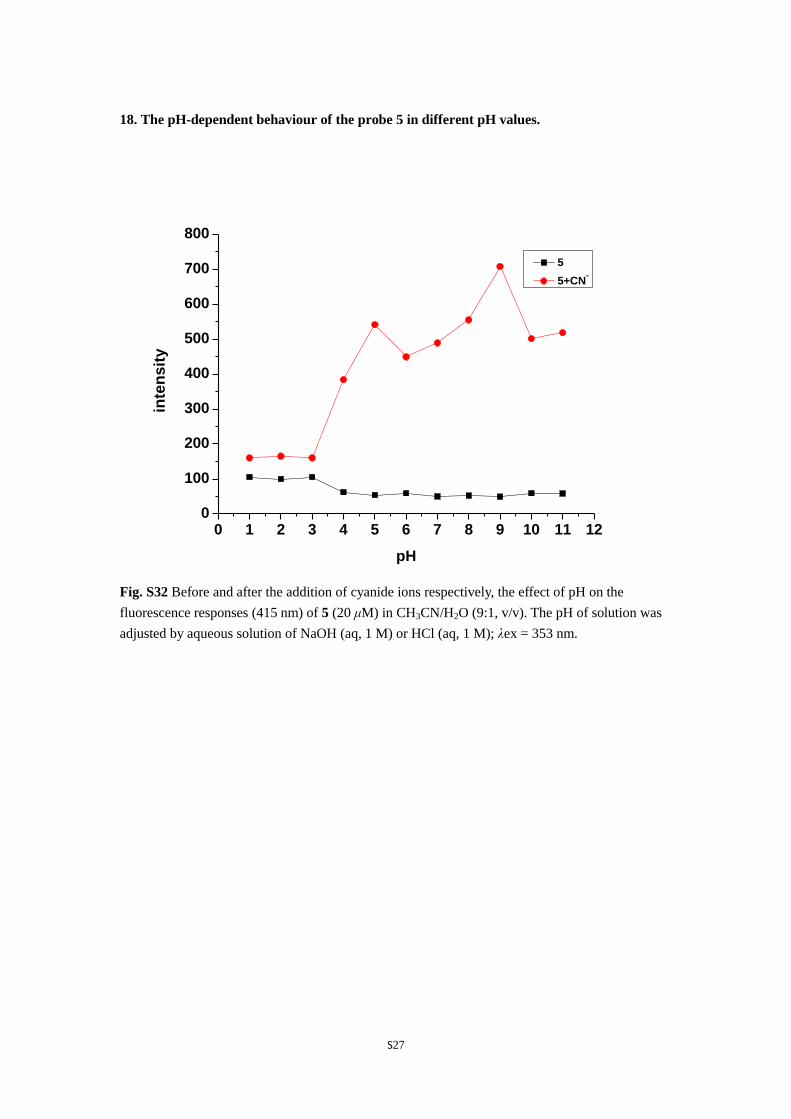
18. The pH-dependent behaviour of the probe 5 in different pH values.
0 1 2 3 4 5 6 7 8 9 10 11 120
100
200
300
400
500
600
700
800
inte
nsit
y
pH
5
5+CN-
Fig. S32 Before and after the addition of cyanide ions respectively, the effect of pH on the
fluorescence responses (415 nm) of 5 (20 μM) in CH3CN/H2O (9:1, v/v). The pH of solution was
adjusted by aqueous solution of NaOH (aq, 1 M) or HCl (aq, 1 M); λex = 353 nm.

S28
19. Confocal microscopic images of RAW 264.7 Macrophages cells
sensor 5 sensor 5 + CN_
Confocal
Normal
Fig. S33. Confocal fluorescence microscope images of RAW 264.7 Macrophages cells in the
presence of sensor 5 (100 μM). The fluorescence images were recorded after 10 min of treatment
of CN (100 μM) at 37 °C.

S29
20. The detailed 1H NMR titration of 7 and 5 with F
(6–10 ppm)
Fig. S34. Plots of 1H NMR spectra of 7 (red) and 5 (black) on addition of F
in DMSO-d6
(expanded the region of 6–10 ppm).

S30
21. The 1H NMR titration of 5 with CN
Fig. S35. Plots of 1H NMR spectra of 5 (red, 3.0 × 10
-2 mol/L) on addition of CN
in DMSO-d6
(from bottom to top, CN equiv. = 0, 1.0, 2.0, 3.0, 4.0, 5.0, 6.0, 7.0, 9.0, 11.0, 11.0 (overnight),
11.0 (after 24 hours).

S31
22. The 1H NMR titration of 7 with CN
HN
NO O
O
HD
HE
HA
HB
HC
HF
HG
HH
HI HJ
Fig. S36. Plots of
1H NMR spectra of 7 (3.0 × 10
-2 mol/L) on addition of CN
in DMSO-d6.

S32
23. The final state of compound 5 and 7 with F and CN
.
300 400 500 600 700 800
0.0
0.1
0.2
0.3
0.4
0.5
Wavelength (nm)
Ab
so
rban
ce
5-F-
7-F-
5-CN-
7-CN-
Fig. S37. UV-vis spectra of 5 and 7 after addition of F and CN
in CH3CN (The final state).