supporting information - pnas information ... collection and dna extraction of symbiotic acantharia...
TRANSCRIPT

Supporting informationDecelle et al. 10.1073/pnas.1212303109SI Materials and MethodsCollection and DNA Extraction of Symbiotic Acantharia and CulturedPhaeocystis Strains. Symbiotic Acantharia were collected in 2010and 2011 at different locations worldwide (Table S1). Acan-tharian cells were harvested at the subsurface by slowly towingnets (64- and 200-μm mesh size) and either directly isolated orpreserved within the bulk sample in 70% ethanol. Micropipetteisolation of cells using an inverted microscope was conducted,and each single cell sorted was individually cleaned three timesin successive 0.2-μm filtered seawater baths. Freshly isolated andcleaned cells were then maintained for several hours in 0.2 μmfiltered seawater to allow self-cleaning. Both fresh and ethanol-preserved cells were photographed under an inverted micro-scope and finally isolated into a guanidine-containing extractionbuffer (GITC). Eppendorf tubes containing the samples werestored at −20 °C until processing. The single-cell DNA extrac-tion of the Acantharia–symbiont holobiont was carried out asdescribed previously (1). Detailed information on each isolatedspecimen, such as the picture and collection data, are available athttp://abims.sb-roscoff.fr/renkan.In parallel, 23 strains of Phaeocystis sp., isolated in different
oceans worldwide, were obtained from various culture collections.Codes for strain sources are as follows: RCC, Roscoff CultureCollection, France; NIES, National Institute for EnvironmentalStudies, Japan; PCC, Plymouth Culture Collection, UnitedKingdom; and K, Scandinavian Culture Collection of Algae andProtozoa, Copenhagen, Danemark. Cultured cells were harvestedin exponential growth phase and concentrated by centrifugation.Total nucleic acids were extracted using the the NucleospinRNA II kit (Macherey-Nagel) and quantified using a NanodropND-1000 Spectrophotometer (Labtech International).
Gene Amplification and Phylogenetic Methods for the Host Acantharia.Polymerase chain reactions (PCR) on Acantharia were performedwith Radiolaria-specific primers to amplify the partial 18S and 28S(D1/D2 domains) rDNA genes (see ref. 1 for details). Additionalsequences of symbiotic Acantharia were acquired from GenBankand added to the sequences obtained in this study. This datasetwas then aligned with MAFFT v6.818 (2) and concatenated in onepartition (94 taxa with 2.4 kb aligned characters), and phylogeneticrelationships were reconstructed with RAxML (3), using the GTR+G model. The phylogenetic tree of Acantharia was used for thecophylogenetic analyses (see below). Sequences obtained from thehost Acantharia were deposited in GenBank under accession nos.JQ697697–JQ6977738.
Gene Amplification and Phylogenetic Methods for Phaeocystis inSymbiosis and in Culture. PCRs on symbiotic and culturedPhaeocystis were conducted to amplify the 18S and 28S rDNAand the plastidial rbcL and psbA genes (see refs. 4–11 for de-tailed information on primers). Amplifications were performedwith the Phusion high-fidelity DNA polymerase (Finnzymes) ina 25-μL reaction volume, using the following PCR parameters:30 s at 98 °C; followed by 35 cycles of 10 s denaturation at 98 °C,30 s annealing at 50 °C for the 18S, 28S, and psbA genes and at55 °C for rbcL gene, and 30 s extension at 72 °C; with a finalelongation step of 10 min at 72 °C. PCR products were thenpurified by EXOSAP-IT (GE Healthcare Bio-Sciences) and bi-directionally sequenced using the ABI-PRISM Big Dye Termi-nator Cycle Sequencing Kit (Applied Biosystems). Rawsequences were edited and assembled with Chromas Pro v.1.5(Gene Codes). Sequences obtained from Phaeocystis in symbiosis
and in culture were deposited in GenBank under accession nos.JX660702–JX660995.Single-locus analyses were performed for each genetic marker.
Sequences of acantharian symbionts and Phaeocystis strains ob-tained in this study were added to GenBank sequences from otherPhaeocystis strains and related environmental clone libraries. Thefour datasets were thus aligned with MAFFT v6.818. The defaultalignment algorithm was used for sequences coding for the plas-tidial rbcL and psbA genes, whereas for rDNA sequences the Q-INS-i alignment option taking into account the secondary struc-ture was selected. Ambiguous regions of the 18S and the 28SrDNA alignment, characterized by a high rate of insertion/de-letion, were removed before analyses, using the software Gblocksv.0.91b (12). A list of taxa included in these single-locus datasets isprovided upon request. For phylogenetic analyses, each datasetcontained five outgroup sequences from the Prymnesiophyceae(Emiliania huxleyi, Isochrysis galbana, Pleurochrysis carterae,Prymnesium parvum, and Imantonia rotunda). For each dataset,the optimal model of evolution was determined under the AIC,AICc, and BIC criteria implemented in jModelTest (13). Maxi-mum-likelihood (ML) analyses and statistical support were as-sessed by performing 1,000 bootstrap replicates as implementedon the RAxML version 7.2.0 blackbox servers. Resulting single-gene phylogenies are shown in Figs. S1–S3.After visual checking of the congruence of each single-locus
phylogeny, a concatenated dataset was constructed. This datasetconstituted 3,170 bp obtained by concatenation of the sequences ofthe ribosomal loci 18S (686 pb) and 28S (827 pb) and the plastidialpsbA (564 pb) and rbcL (1093 pb) genes for 131 taxa: 98 sym-bionts, 28 Phaeocystis culture strains, and 5 Haptophyta taxa as theoutgroup. Accession numbers of the sequences and details of thedataset are available upon request. All analyses on the concate-nated four-locus alignment were carried out with a model in whichthe dataset was partitioned by marker, thus defining four partitions.Maximum-likelihood phylogenies were inferred using RAxML withGTR+I+Γ model parameters estimated independently for eachpartition by jModelTest. Analyses were performed for each datasetat least four times, with different starting trees. Statistical supportwas assessed by performing 2,000 bootstrap replicates.The Bayesian inference was conducted on the concatenated
datasets (in one partition), using Beast v.1.6.1 and companionsoftware (14) under the GTR+I+Γ (4) model. Two Markovchain Monte Carlo (MCMC) chains were run for 50 milliongenerations, sampling every 1,000 generations. The two runswere combined with LogCombiner v1.6.1, and convergence oflog-likelihoods and parameter values were assessed in Tracerv1.4.1. Ten percent of the total trees were discarded as burn-in,and the remaining trees were used by TreeAnnotator 1.5.4 tobuild the consensus tree and to calculate the posterior proba-bilities (PP) of each node. The final tree was visualized withFigTree v1.3.1. The multigene phylogeny is presented Fig. S4.
Mantel Test. Mantel tests were performed to assess whether thedistributions of the host (Acantharia) and the symbiont (Phaeo-cystis) are driven by a biogeographical pattern. A geographicaldistance matrix based on coordinates and a pairwise genetic dis-tance matrix were built for each genetic marker of each partner,using Geographic Distance Matrix Generator v.1.2.3 (15) andMEGA5 (16), respectively. A Pearson’s correlation between thematrices was then tested using the R package ape, on the basis of999 permutations. Correlations were significant (P value = 0.001)only for the genetic markers of the symbiont Phaeocystis: 0.406,
Decelle et al. www.pnas.org/cgi/content/short/1212303109 1 of 10

0.425, 0.858, and 0.652 for the 18S rDNA, the 28S rDNA, psbAgene, and rbcL gene, respectively. No significant correlations werefound for both the 18S rDNA and the 28S rDNA of the hostAcantharia (P > 0.29).
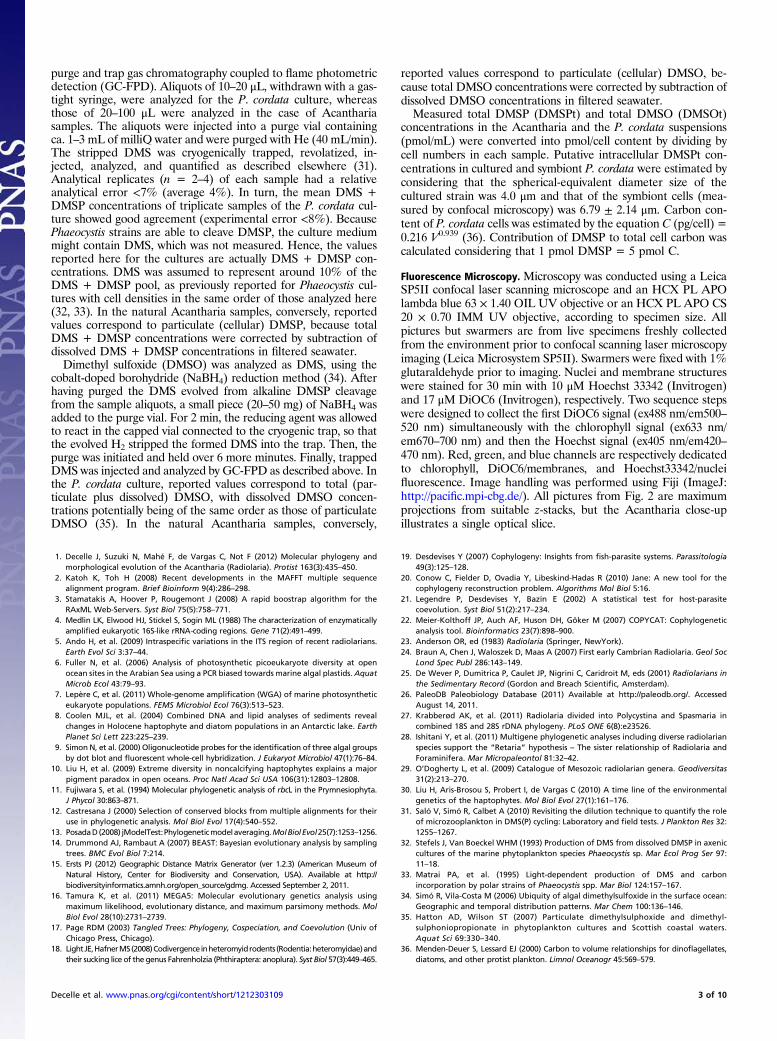
Cophylogenetic Analyses. Several methods have been published tostudy cophylogenetic patterns between hosts and their symbionts(17, 18), which can be classified into event-based methods andglobal-fit methods (19). Event-based methods generally aim atreconciling tree topologies of hosts and symbionts by adequatelymixing four or five kinds of coevolutionary events (cospeciation orcodivergence, host switch, duplication, sorting, and failure to di-verge—not used in all methods) and find the best reconstructionsby minimizing their global cost (each event type is attributeda cost) to produce optimal cophylogenetic scenarios. The signifi-cance of the global cost is assessed against a random distributionof costs generated using random trees: If the observed optimalcost is significantly lower than optimal costs computed from ran-domly generated trees, then a global cospeciation signal is present.Global-fit methods do not rely on events but assess the congru-ence between the two trees, taking the pattern of host specificityinto account; again the observed level of congruence is testedagainst a random distribution. No scenario is produced but thecomputational burden is much lighter than for event-basedmethods. The phylogenetic trees of 94 host taxa (Acantharia) and94 symbiont taxa (each symbiont is associated with one host),inferred as explained above, have been used in these cophyloge-netic analyses. We used an event-based method, Jane 3 (20), and aglobal-fit method, ParaFit (21), implemented in CopyCat (22). Janewas used with the following event–cost scheme: cospeciation = 0,duplication = 1, host switch = 2, sorting = 1, failure = 1; anumber of generations of 500; and a population size of 50. Sta-tistical tests for tree congruence in ParaFit and Jane were carriedout with 999 permutations, and symbiont trees instead of tipmappings were randomized in Jane. Results of these differentcophylogenetic analyses are shown in Figs. S5 and S6.
Molecular Clock Analyses. Divergence times of Acantharia andPhaeocystis were estimated using Bayesian relaxed-clock methodsimplemented in BEAST v.1.6.1. For host Acantharia, 18S rDNAsequences of several representatives from each acantharian cladewere retrieved fromGenBank: clades B, C, D, E, and F and AcanthI, II, and III. Because Acantharia do not have a fossil record, weused an indirect calibration with five fossil-based calibration pointsfrom other fossilizable Radiolaria: Spumellaria and Nassellaria (alist of used taxa with their GenBank accession numbers is availableupon request). The 18S rDNA sequences of these radiolariangroups, publicly available, were therefore added to the acanthariansequences to build a dataset of 98 taxa with 525 unambiguouslyaligned positions, using Gblocks v.0.91b. The monophyly of theAcantharia (ingroup) was set in BEAST. Different models wereanalyzed by alternatively adding or removing calibrations. Thecross-comparison between these different models allowed us to testthe reliability of each calibration and see how the age of each nodewas affected by various calibrations. The best model was chosenaccording to the molecular clock statistics as explained below.Here are the details of the five calibration points used in this
study:
Node 1: The calibration for the root of the tree corresponds tothe first appearance of radiolarian fossils in the Phanerozoic,which is recognized to be in the early Cambrian, 542 Mya (23,24). We therefore set a minimum (542 Mya) and maximum(800 Mya) bound with a uniform probability, U (542–800), toallow uncertainty about the origin of Radiolaria.Node 2: This calibration is based on the first occurrence offossils of Nassellaria in the Devonian, 316–459 Mya (25, 26).The prior was normally distributed with a mean of 370 and
a SD of 50: N (370, 50). The Nassellaria–Spumellaria cladewas forced to form a monophyletic group as shown in recentmultigene phylogenies (27, 28).Node 3: The genus Hexacontium and the family Spongodiscidae(represented by the taxa Dictyocoryne spp., Stylodictya sp., Spon-godiscus spp., Spongaster sp., and Euchitonia sp.) appear in thefossil record in the Triassic (26). However, according to ref. 25,Hexacontium would occur instead in the Jurassic (150–200 Mya)and another study (29) identifies the first members of the Spon-godiscidae in the Campanian deposits around 80 Mya. In differ-ent molecular phylogenies (27),Hexacontium and Spongodiscidaegroup together within a monophyletic clade. Thus, we decidedto constrain the node of this clade with a calibration at 200Mya and a broad SD of 50: N (200, 50), covering the Triassicand Jurassic due to the uncertainties mentioned above.Node 4: Fossils of Actinomma sp. would first appear in theTriassic but with some taxonomic uncertainty (25) and wereobserved in the Cretaceous in many places worldwide (26).The family Actinommidae would have a reliable fossil in theJurassic (175 Mya). The node corresponding to the divergenceof Actinomma sp. was therefore set at 170 Mya: N (170, 30).Node 5: This node corresponds to the first fossils of the genusCladococcus, which would be in the Cenozoic era (Paleocene, 60Mya) (25, 26). We used N (60, 20) as a prior for this calibration.
The Markov chains were run two times for 30 million gen-erations and sampled every 1,000 generations. The two runswere combined with LogCombiner v1.6.1, and the first 6,000trees were discarded as burn-in. MCMC chain convergence andstationarity were assessed using Tracer v1.5 by examining ef-fective sample sizes (effective sample size values > 500) for allparameters, such as posterior, prior, likelihood, etc. Node agesand the 95% highest posterior density (HPD) interval for di-vergence times were calculated using TreeAnnotator v1.6.1 andvisualized with FigTree v1.3.1 (Fig. S7).For Phaeocystis, the divergence time analysis was carried out
with four fossil-based calibrations from coccolithophores used ina previous study (30). The molecular dataset comprises the nu-clear 18S and 28S rDNA and plastidial rbcL genes of Phaeocystis(from the clades defined in this study) and from other hapto-phytes: 78 taxa in total with 3,773 aligned characters. The threegenes were considered into one single partition (30), the Pav-lovales were set as the outgroup, and Phaeocystis was set asa monophyletic group.We used four calibration points:
Node 1: First occurrence in the fossil record of heterococco-liths: N (220, 4).Node 2: Divergence of Umbilicosphaera sp. and Coccolithussp.: N (65, 2).Node 3: First occurrence of Helicosphaera sp.: N (25, 1).Node 4: Divergence of Umbilicosphaera sp. and Calcidiscussp.: N (24, 2).
TheMarkov chains were run two times for 50million generationsand sampled every 1,000 generations. The two runs were combinedwith LogCombiner v1.6.1, and the first 10,000 trees were discardedas burn-in. The corresponding molecular clock is shown in Fig. S8.
Dimethylsulfoniopropionate and Dimethyl Sulfoxide Analyses andCalculations of Cell Content. Aliquots of an exponentially growingPhaeocystis cordata culture were preserved in 12-mL gas-tight glassvials, with no headspace. The vials were immediately capped andcrimped after adding two NaOH pellets (0.2 M final concentra-tion, pH > 12). Samples with 0.22 μm filtered seawater containing50–200 acantharian cells and blanks containing only filteredseawater were processed and stored in the same way. Dime-thylsulfoniopropionate (DMSP) was measured, within 2 mo, asthe dimethylsulfide (DMS) evolved by alkaline hydrolysis, using
Decelle et al. www.pnas.org/cgi/content/short/1212303109 2 of 10
purge and trap gas chromatography coupled to flame photometricdetection (GC-FPD). Aliquots of 10–20 μL, withdrawn with a gas-tight syringe, were analyzed for the P. cordata culture, whereasthose of 20–100 μL were analyzed in the case of Acanthariasamples. The aliquots were injected into a purge vial containingca. 1–3 mL of milliQ water and were purged with He (40 mL/min).The stripped DMS was cryogenically trapped, revolatized, in-jected, analyzed, and quantified as described elsewhere (31).Analytical replicates (n = 2–4) of each sample had a relativeanalytical error <7% (average 4%). In turn, the mean DMS +DMSP concentrations of triplicate samples of the P. cordata cul-ture showed good agreement (experimental error <8%). BecausePhaeocystis strains are able to cleave DMSP, the culture mediummight contain DMS, which was not measured. Hence, the valuesreported here for the cultures are actually DMS + DMSP con-centrations. DMS was assumed to represent around 10% of theDMS + DMSP pool, as previously reported for Phaeocystis cul-tures with cell densities in the same order of those analyzed here(32, 33). In the natural Acantharia samples, conversely, reportedvalues correspond to particulate (cellular) DMSP, because totalDMS + DMSP concentrations were corrected by subtraction ofdissolved DMS + DMSP concentrations in filtered seawater.Dimethyl sulfoxide (DMSO) was analyzed as DMS, using the
cobalt-doped borohydride (NaBH4) reduction method (34). Afterhaving purged the DMS evolved from alkaline DMSP cleavagefrom the sample aliquots, a small piece (20–50 mg) of NaBH4 wasadded to the purge vial. For 2 min, the reducing agent was allowedto react in the capped vial connected to the cryogenic trap, so thatthe evolved H2 stripped the formed DMS into the trap. Then, thepurge was initiated and held over 6 more minutes. Finally, trappedDMS was injected and analyzed by GC-FPD as described above. Inthe P. cordata culture, reported values correspond to total (par-ticulate plus dissolved) DMSO, with dissolved DMSO concen-trations potentially being of the same order as those of particulateDMSO (35). In the natural Acantharia samples, conversely,
reported values correspond to particulate (cellular) DMSO, be-cause total DMSO concentrations were corrected by subtraction ofdissolved DMSO concentrations in filtered seawater.Measured total DMSP (DMSPt) and total DMSO (DMSOt)
concentrations in the Acantharia and the P. cordata suspensions(pmol/mL) were converted into pmol/cell content by dividing bycell numbers in each sample. Putative intracellular DMSPt con-centrations in cultured and symbiont P. cordata were estimated byconsidering that the spherical-equivalent diameter size of thecultured strain was 4.0 μm and that of the symbiont cells (mea-sured by confocal microscopy) was 6.79 ± 2.14 μm. Carbon con-tent of P. cordata cells was estimated by the equation C (pg/cell) =0.216 V0.939 (36). Contribution of DMSP to total cell carbon wascalculated considering that 1 pmol DMSP = 5 pmol C.
Fluorescence Microscopy. Microscopy was conducted using a LeicaSP5II confocal laser scanning microscope and an HCX PL APOlambda blue 63 × 1.40 OIL UV objective or an HCX PL APO CS20 × 0.70 IMM UV objective, according to specimen size. Allpictures but swarmers are from live specimens freshly collectedfrom the environment prior to confocal scanning laser microscopyimaging (Leica Microsystem SP5II). Swarmers were fixed with 1%glutaraldehyde prior to imaging. Nuclei and membrane structureswere stained for 30 min with 10 μM Hoechst 33342 (Invitrogen)and 17 μM DiOC6 (Invitrogen), respectively. Two sequence stepswere designed to collect the first DiOC6 signal (ex488 nm/em500–520 nm) simultaneously with the chlorophyll signal (ex633 nm/em670–700 nm) and then the Hoechst signal (ex405 nm/em420–470 nm). Red, green, and blue channels are respectively dedicatedto chlorophyll, DiOC6/membranes, and Hoechst33342/nucleifluorescence. Image handling was performed using Fiji (ImageJ:http://pacific.mpi-cbg.de/). All pictures from Fig. 2 are maximumprojections from suitable z-stacks, but the Acantharia close-upillustrates a single optical slice.
1. Decelle J, Suzuki N, Mahé F, de Vargas C, Not F (2012) Molecular phylogeny andmorphological evolution of the Acantharia (Radiolaria). Protist 163(3):435–450.
2. Katoh K, Toh H (2008) Recent developments in the MAFFT multiple sequencealignment program. Brief Bioinform 9(4):286–298.
3. Stamatakis A, Hoover P, Rougemont J (2008) A rapid boostrap algorithm for theRAxML Web-Servers. Syst Biol 75(5):758–771.
4. Medlin LK, Elwood HJ, Stickel S, Sogin ML (1988) The characterization of enzymaticallyamplified eukaryotic 16S-like rRNA-coding regions. Gene 71(2):491–499.
5. Ando H, et al. (2009) Intraspecific variations in the ITS region of recent radiolarians.Earth Evol Sci 3:37–44.
6. Fuller N, et al. (2006) Analysis of photosynthetic picoeukaryote diversity at openocean sites in the Arabian Sea using a PCR biased towards marine algal plastids. AquatMicrob Ecol 43:79–93.
7. Lepère C, et al. (2011) Whole-genome amplification (WGA) of marine photosyntheticeukaryote populations. FEMS Microbiol Ecol 76(3):513–523.
8. Coolen MJL, et al. (2004) Combined DNA and lipid analyses of sediments revealchanges in Holocene haptophyte and diatom populations in an Antarctic lake. EarthPlanet Sci Lett 223:225–239.
9. Simon N, et al. (2000) Oligonucleotide probes for the identification of three algal groupsby dot blot and fluorescent whole-cell hybridization. J Eukaryot Microbiol 47(1):76–84.
10. Liu H, et al. (2009) Extreme diversity in noncalcifying haptophytes explains a majorpigment paradox in open oceans. Proc Natl Acad Sci USA 106(31):12803–12808.
11. Fujiwara S, et al. (1994) Molecular phylogenetic analysis of rbcL in the Prymnesiophyta.J Phycol 30:863–871.
12. Castresana J (2000) Selection of conserved blocks from multiple alignments for theiruse in phylogenetic analysis. Mol Biol Evol 17(4):540–552.
13. PosadaD(2008) jModelTest:Phylogeneticmodelaveraging.MolBiolEvol25(7):1253–1256.14. Drummond AJ, Rambaut A (2007) BEAST: Bayesian evolutionary analysis by sampling
trees. BMC Evol Biol 7:214.15. Ersts PJ (2012) Geographic Distance Matrix Generator (ver 1.2.3) (American Museum of
Natural History, Center for Biodiversity and Conservation, USA). Available at http://biodiversityinformatics.amnh.org/open_source/gdmg. Accessed September 2, 2011.
16. Tamura K, et al. (2011) MEGA5: Molecular evolutionary genetics analysis usingmaximum likelihood, evolutionary distance, and maximum parsimony methods. MolBiol Evol 28(10):2731–2739.
17. Page RDM (2003) Tangled Trees: Phylogeny, Cospeciation, and Coevolution (Univ ofChicago Press, Chicago).
18. LightJE,HafnerMS(2008)Codivergence inheteromyidrodents (Rodentia:heteromyidae)andtheir sucking lice of the genus Fahrenholzia (Phthiraptera: anoplura). Syst Biol 57(3):449–465.
19. Desdevises Y (2007) Cophylogeny: Insights from fish-parasite systems. Parassitologia49(3):125–128.
20. Conow C, Fielder D, Ovadia Y, Libeskind-Hadas R (2010) Jane: A new tool for thecophylogeny reconstruction problem. Algorithms Mol Biol 5:16.
21. Legendre P, Desdevises Y, Bazin E (2002) A statistical test for host-parasitecoevolution. Syst Biol 51(2):217–234.
22. Meier-Kolthoff JP, Auch AF, Huson DH, Göker M (2007) COPYCAT: Cophylogeneticanalysis tool. Bioinformatics 23(7):898–900.
23. Anderson OR, ed (1983) Radiolaria (Springer, NewYork).24. Braun A, Chen J, Waloszek D, Maas A (2007) First early Cambrian Radiolaria. Geol Soc
Lond Spec Publ 286:143–149.25. De Wever P, Dumitrica P, Caulet JP, Nigrini C, Caridroit M, eds (2001) Radiolarians in
the Sedimentary Record (Gordon and Breach Scientific, Amsterdam).26. PaleoDB Paleobiology Database (2011) Available at http://paleodb.org/. Accessed
August 14, 2011.27. Krabberød AK, et al. (2011) Radiolaria divided into Polycystina and Spasmaria in
combined 18S and 28S rDNA phylogeny. PLoS ONE 6(8):e23526.28. Ishitani Y, et al. (2011) Multigene phylogenetic analyses including diverse radiolarian
species support the “Retaria” hypothesis – The sister relationship of Radiolaria andForaminifera. Mar Micropaleontol 81:32–42.
29. O’Dogherty L, et al. (2009) Catalogue of Mesozoic radiolarian genera. Geodiversitas31(2):213–270.
30. Liu H, Aris-Brosou S, Probert I, de Vargas C (2010) A time line of the environmentalgenetics of the haptophytes. Mol Biol Evol 27(1):161–176.
31. Saló V, Simó R, Calbet A (2010) Revisiting the dilution technique to quantify the roleof microzooplankton in DMS(P) cycling: Laboratory and field tests. J Plankton Res 32:1255–1267.
32. Stefels J, Van Boeckel WHM (1993) Production of DMS from dissolved DMSP in axeniccultures of the marine phytoplankton species Phaeocystis sp. Mar Ecol Prog Ser 97:11–18.
33. Matrai PA, et al. (1995) Light-dependent production of DMS and carbonincorporation by polar strains of Phaeocystis spp. Mar Biol 124:157–167.
34. Simó R, Vila-Costa M (2006) Ubiquity of algal dimethylsulfoxide in the surface ocean:Geographic and temporal distribution patterns. Mar Chem 100:136–146.
35. Hatton AD, Wilson ST (2007) Particulate dimethylsulphoxide and dimethyl-sulphoniopropionate in phytoplankton cultures and Scottish coastal waters.Aquat Sci 69:330–340.
36. Menden-Deuer S, Lessard EJ (2000) Carbon to volume relationships for dinoflagellates,diatoms, and other protist plankton. Limnol Oceanogr 45:569–579.
Decelle et al. www.pnas.org/cgi/content/short/1212303109 3 of 10

Fig. S1. Maximum-likelihood phylogeny inferred from RAxML with the psbA gene. Black, symbiont sequences; red, culture sequences; green, environmentalsequences. Only RAxML bootstrap values ≥70% are shown.
Decelle et al. www.pnas.org/cgi/content/short/1212303109 4 of 10

Fig. S2. Maximum-likelihood phylogeny inferred from RAxML with the 28S rDNA marker. Black, symbiont sequences; red, culture sequences; green, envi-ronmental sequences. Only RAxML bootstrap values ≥70% are shown.
Decelle et al. www.pnas.org/cgi/content/short/1212303109 5 of 10

Fig. S3. Maximum-likelihood phylogeny inferred from RAxML with the 18S rDNA marker. Black, symbiont sequences; red, culture sequences; green, envi-ronmental sequences. Only RAxML bootstrap values ≥70% are shown.
Decelle et al. www.pnas.org/cgi/content/short/1212303109 6 of 10

Fig. S4. Maximum-likelihood phylogeny inferred from RAxML with the concatenated 18S and 28S rDNA, rbcL, and psbA genes. Only RAxML bootstrap values≥70% are shown.
Decelle et al. www.pnas.org/cgi/content/short/1212303109 7 of 10
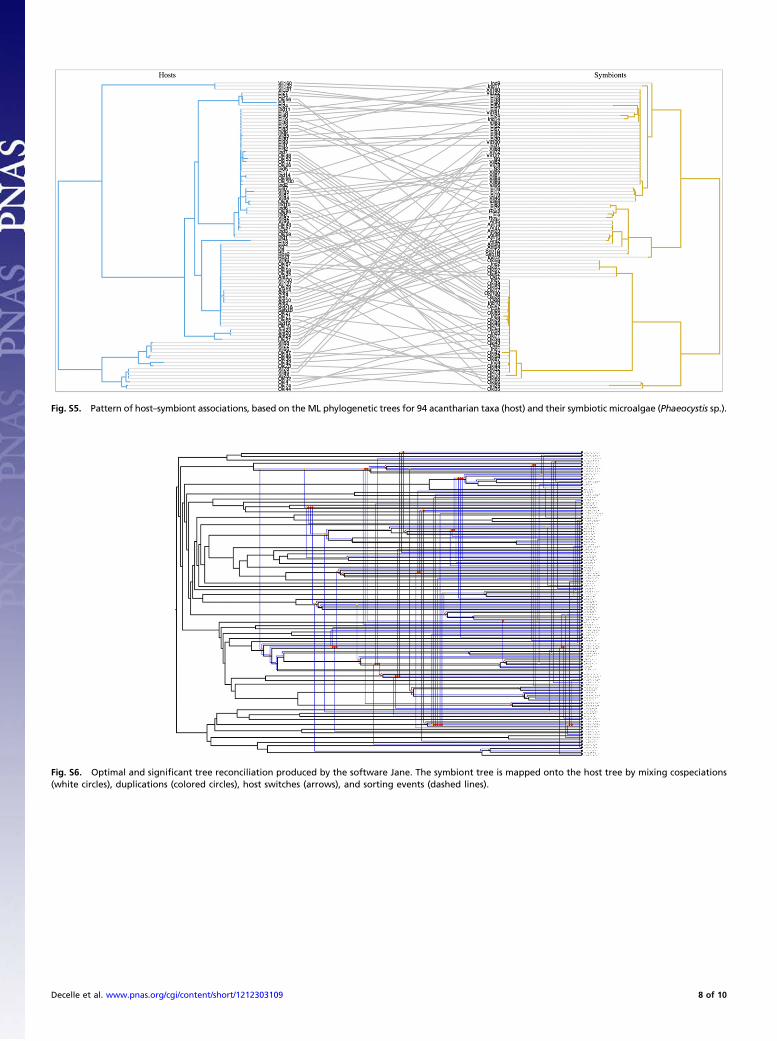
Fig. S5. Pattern of host–symbiont associations, based on the ML phylogenetic trees for 94 acantharian taxa (host) and their symbiotic microalgae (Phaeocystis sp.).
Fig. S6. Optimal and significant tree reconciliation produced by the software Jane. The symbiont tree is mapped onto the host tree by mixing cospeciations(white circles), duplications (colored circles), host switches (arrows), and sorting events (dashed lines).
Decelle et al. www.pnas.org/cgi/content/short/1212303109 8 of 10

Fig. S7. Time-calibrated tree of the radiolarian groups, Acantharia, Spumellaria, and Nassellaria, using five fossil-based calibration points (red stars), based onnuclear 18S rDNA. Node divergences were estimated with a Bayesian relaxed clock model and the GTR + I + G model, implemented in the software packageBEAST. Blue bars indicate the 95% highest posterior density (HPD) intervals of the posterior probability distribution of node ages.
Fig. S8. Time-calibrated tree of haptophytes, including the Phaeocystales, using four fossil-based calibration points from coccolithophores (red stars), based onnuclear 18S and 28S rDNA and plastidial rbcL gene. Node divergences were estimated with a Bayesian relaxed clock model and the GTR + I + Gmodel, implementedin the software package Beast. Blue bars indicate the 95% highest posterior density (HPD) intervals of the posterior probability distribution of node ages.
Decelle et al. www.pnas.org/cgi/content/short/1212303109 9 of 10

Table S1. Geographic origins of the Acantharia (host) sampled in this study that live withsymbiotic Phaeocystis
Oceanic region Sampling sites Latitude Longitude
Mediterranean sea Naples 40°44′52.75′′N 14°14′50.53′′EVillefranche 43°40′55.20′′N 7°18′44.76′′E
Red sea Eilat 29°30′18.15′′N 34°57′25.01′′EEast Pacific Ocean Okinawa 26°13′6.12′′N 127°16′26.69′′EIndian Ocean Indian st39 18°41′60.00′′N 66°17′60.00′′E
Indian st41 14°35′60.00′′N 69°54′0.00′′EEnglish Channel Roscoff 48°45′5.49′′N 3°57′18.58′′WAntarctic Antarctica st84 60°12′0.85′′S 60°30′2.10′′W
Antarctica st85 62°0′13.40′′S 49°16′53.36′′WAntarctica st86 64°21′0.569′′S 53°00′0.367′′WAntarctica st88 63°24′0.598′′S 56°47′0.621′′W
South Atlantic Seb st80 40°39′0.245′′S 52°12′0.477′′W
Decelle et al. www.pnas.org/cgi/content/short/1212303109 10 of 10