supporting information - pnas.org · digests were resolved on a 0.8% aga- rose gel, and the vector...
TRANSCRIPT

Supporting InformationRzeniewicz et al. 10.1073/pnas.1417100112SI Materials and MethodsCell Lines.All cell lines were cultured at 37 °C, containing 5% CO2under humidifying conditions. The THP-1 monocytic cell linewas purchased from the American Type Culture Collection (LGCStandards) and passaged in RPMI medium containing 10% FCS,1% antibiotics (penicillin/streptomycin), and 50 μM β-mercap-toethanol. HUVECs were purchased from Lonza and maintainedin endothelial cell growth media (EGM-2) supplemented withgrowth factors and antibiotics provided within their “bullet kits.”Cells were initially expanded for six or fewer passages and wereharvested and stored in liquid nitrogen for final use in flow assaysor Western blotting. Confluent HUVECs were split with trypsin/EDTA solution and seeded onto 10 μg/mL bovine-derived fibro-nectin. HEK 293T cells were a kind gift from Yolanda Calle,University of Roehampton, London, United Kingdom. Cells weremaintained in RPMI-1640 medium supplemented with 10% FCSand 1% antibiotics (penicillin/streptomycin). Cells were routinelypassaged at a 1:3 ratio on the third day. Cos-7 cells were main-tained in DMEM supplemented with 10% FCS and 1% antibiotics(penicillin/streptomycin). One day before transfection, Cos-7 cellswere seeded to reach 70–80% confluence. Cells were then col-lected from triple-vent 14-cm dishes (Greiner Bio-One) usingtrypsin/EDTA (Invitrogen) and washed with 5 mL of cold elec-troporation buffer [120 mm KCl, 10 mm K2PO4·KH2PO4 (pH 7.6),25 mm Hepes, 2 mm MgCl2, and 0.5% Ficoll]. Following centri-fugation, the trypsinizing solution was aspirated; cells were washedtwice in ice-cold PBS and then finally resuspended in 250 μL of coldelectroporation buffer and electroporated at 250 V and 960 μF(Bio-Rad electroporator) with 2 μg of DNA for each construct.Ezrin and moesin band 4.1-ezrin-radixin-moesin (FERM) domainsand L-selectin constructs were both cloned into pcDNA3.1 vectors(Invitrogen) and have been described in a previous report (1).
PrimaryMonocyte Isolation.Human peripheral blood mononuclearcells (PBMCs) were isolated from 100 mL of fresh venous bloodusing Ficoll-Paque (GEHealthcare).Monocytes were enriched fromthe PBMCs using immunomagnetic beads (Pan Monocyte IsolationKit; Miltenyi Biotec). Briefly, PBMCs were depleted of nonmono-cytic cells, including T cells, natural killer cells, B cells, and basophils,allowing for the selection of an “untouched” whole-monocyte popu-lation. Monocyte purity and viability were assessed before furtherexperiments by staining for CD14 and 7-aminoactinomycin D, re-spectively. Cells were analyzed using a MACSQuant flow cytometer(Miltenyi Biotec). Purity was assessed to be at or above 90%.
Lentiviral Vector Construction. Human L-selectin cDNA was am-plified by PCR assay from a pCMV6-AC-GFP vector (OriGene).PCR primers were designed with BamHI and XhoI restrictionsites engineered at the 5′ and 3′ ends, respectively. PCR productsamplified by Pfu DNA polymerase (Stratagene) were excisedfrom 0.8% agarose gels and purified using a QIAquick Gel Ex-traction Kit (Qiagen) according to the manufacturer’s protocol.The pHR′SIN-SEW lentiviral backbone vectors were providedby Adrian Thrasher, Institute of Child Health, University Col-lege London, London, United Kingdom, and were carrying ei-ther enhanced GFP (hereafter referred to as GFP) or monomericRFP (hereafter referred to as RFP) C-terminal tags. The lentiviralvectors were linearized by double digestion with BamHI and XhoIrestriction enzymes (New England Biolabs) according to themanufacturer’s protocol. Digests were resolved on a 0.8% aga-rose gel, and the vector was purified with a QIAquick Gel Ex-traction Kit according to the manufacturer’s protocol. Purified
vectors were dephosphorylated with calf intestinal alkalinephosphatase (New England Biolabs) for 1 h at 37 °C and cleanedfrom the reaction mixture using a QIAquick Gel Extraction Kitaccording to the manufacturer’s protocol. The vectors were thenligated with the insert, with a molar vector-to-insert ratio of 1:3.Ligation was performed using T4 DNA ligase (Promega) in a10-μL reaction at 4 °C overnight before transformation. Singlecolonies were picked and cultured for plasmid purification usinga QIAprep Miniprep DNA Isolation Kit (Qiagen).The template vector was further mutated to produce mutant
forms of L-selectin via PCR-based mutagenesis kits (QuikChange;Agilent Technologies).The primers (all written in 5′–3′ format) used in this study
include the following:
WT L-selectin (for PCR cloning of human L-selectin)
Forward (Fwd): GAGAGAGGATCCGGTACCGAGGAGA
Reverse (Rev): GAGAGACTCGAGATATGGGTCATTCA-TACTTCTC
PCR primers for cloning and mutagenesis of L-selectin
Two-step cloning of ΔM-N mutant
ΔMIKE (first step)
Forward: CAAAAGTTTCTCACCCCTCTTCATTC
Rev: GAATGAAGAGGGGTGAGAAACTTTTG
ΔMIKEGDYN (second step)
Fwd: GACAAAAGTTTCTCAGGTGATTATAACCCC
Rev: GGGGTTATAATCACCTGAGAAACTTTTGTC
S364A
Fwd: GATTAAAAAAAGGCAAGAAAGCCAAGAGAAG-TATGAATGACC
Rev: GGTCATTCATACTTCTCTTGGCTTTCTTGCCTTT-TTTTAATC
S364D
Fwd: GGCAAGGAGATTAAAAAAAGGCAAGAAAGAC-AAGAGAAGTATGAATGACCCATATCAC
Rev: GTGATATGGGTCATTCATACTTCTCTTGTCTTTCT-TGCCTTTTTTTAATCTCCTTGCC
S367A
Fwd: GGCAAGAAATCCAAGAGAGCTATGAATGACCC-ATATCAC
Rev: GTGATATGGGTCATTCATAGCTCTCTTGGATTTC-TTGCC
S367D
Fwd: GGCAAGAAATCCAAGAGAGATATGAATGACCC-ATATCAC
Rev: GTGATATGGGTCATTCATATCTCTCTTGGATTTCT-TGCC
PCR primers designed to clone CaM-RFP
Fwd: GAGAGAGGATCCATGGCTGACCAACTG ACTGAA
Rev: GAGAGACTCGAGCTTTGCTGTCAT CATTTG
Rzeniewicz et al. www.pnas.org/cgi/content/short/1417100112 1 of 14

Generation of Lentiviral Particles. Lentiviruses were generated inHEK 293T cells through transfection of the psPAX2 (envelope)and pMD.G (packaging) vectors, together with the lentiviralvector. Approximately 10–15 × 106 HEK cells were plated intodishes with a diameter of 14 cm. HEK cells were transfected in4 mL of OPTIMEM (Life Technologies) containing 30, 10, and40 μg of psPAX2, pMD, and pHR′SIN vector DNA, respectively.Another tube containing 4 mL of OPTIMEM with 1 μL of 10 mMpolyethylene imine was then added to the first tube, mixed, andincubated at room temperature for 15 min. Following aspirationof HEK cell media (RPMI-1460 containing 10% FCS and peni-cillin/streptomycin), the 8-mL transfection mix was added ina drop-wise manner to the HEK cells. After 4 h of incubation, thetransfection media were aspirated and replaced with fresh HEKcell media. Cell supernatants containing lentivirus particles werecollected 48 h and 72 h after transfection. Both harvests werepooled, filter-sterilized using a 0.45-μm filter (MILLEX GP),concentrated by ultracentrifugation (50,000 × g), aliquoted, andstored at −80 °C. Viral titers were established by infecting 80%confluent HEK cells with a series dilution of concentrated virus.FACS analysis of trypsinized HEK cells was performed on day 3postinfection and used to quantify the percentage of GFP/RFP-positive cells.
Transduction of THP-1 Cells. THP-1 cells were cultured at a densityof 0.4 × 10⁶ cells per milliliter 1 d before transduction. On thefollowing day, 1 × 10⁶ cells were harvested and resuspended in1 mL of fresh media into which lentivirus particles were added.The volume of concentrated virus that was added per trans-duction was calculated on the basis of the titer and desiredmultiplicity of infection (MOI) according to the followingequation: (Number of cells transduced) × (MOI)/(Titer) = (Mil-liliters of virus). The MOIs used were consistent between all celllines and never exceeded a value of 20 per lentiviral construct.Following infection, cell lines were then placed in a cell cultureincubator and fed fresh media 2 d after infection. Four days aftertransduction, the media were replaced entirely and cells werecultured as normal, maintaining cell densities from 0.5–0.9 × 10⁶
cells per milliliter.
FACS Analysis and Cell Sorting. All cells were sorted using eithera FACSAria II or MoFlo cell sorter housed within King’s CollegeLondon’s Biomedical Research Centre. All cell lines were sortedto match expression levels between WT and mutant L-selectin–expressing cell lines (an example is provided in Fig. S3).
SEM. SEM was performed using an in-house service, and followedsimilar procedures that have been published by our group (2). Inbrief, THP-1 cells were allowed to adhere to poly-L-lysine–coated coverslips, fixed in a Karnovsky mixture (3% glutaral-dehyde and 1% PFA in 0.08 M sodium cacodylate buffered topH 7.4 with 0.1 M HCL), rinsed in 0.1 M sodium cacodylatebuffer, and osmicated for 1 h in 1% aqueous osmium tetroxidebefore dehydration in ascending steps of (50–100%) alcohols.Cells were subjected to two 5-min changes of hexamethyldisila-zane and were then resuspended in a 500-μL volume. Dried cellswere sputter-coated with gold-palladium before imaging. Notethat samples were carbon-coated in experiments where immuno-gold labeling of DREG56 (an anti-human L-selectin monoclonalantibody) was used. Where immunogold labeling of THP-1 cellswas used, THP-1 cells stably expressing WT L-selectin–GFP werelabeled with primary and secondary antibodies on ice for 30 minbefore adhesion on to poly-L-lysine–coated coverslips and fixation.
Immunoprecipitation. Cell lysates were generated from 2 × 10⁷
THP-1 cells. After pelleting cells by centrifugation at 400 × g,cells were lysed in 1 mL of ice-cold lysis buffer [25 mM Tris·HCl(pH 7.4), 150 mM NaCl, 1% Nonidet P-40 (Fluka), 1% oval-
bumin, protease inhibitor mixture, and Ser/Thr and Tyr kinase/phosphatase inhibitor mixture] and left to incubate for 15 min onice. Lysates were centrifuged at 14,000 × g, and the supernatantwas retained and incubated with 25 μL of pre-equilibratedGFPTrap beads (Chromotek). The lysate/bead mixture was leftto rotate at 4 °C overnight. Beads were washed four times in ice-cold lysis buffer containing 0.1% Nonidet P-40, and subsequentlyresolved on polyacrylamide gels for Western blotting.
Western Blotting. Gels were transferred to a PVDF Immobilon-P(Millipore) transfer membrane, which had been presoaked inmethanol and then equilibrated in NuPAGE transfer buffer(Invitrogen), set at a constant rate of 25 V for 2 h. Membraneswere blocked in 5% milk buffer in Tris-buffered saline (TBS)containing 0.1% Nonidet P-40 for at least 1 h at room temper-ature. The primary antibody of interest was added at a dilution of1:1,000 in blocking solution and incubated at 4 °C with continuousagitation overnight at 4 °C. Membranes were washed in TBS for5 min and then in 0.1% Nonidet P-40/TBS for 5 min before beingwashed again in TBS. The membrane was blocked again for atleast 60 min at room temperature, after which HRP-conjugatedsecondary antibody was added at a dilution of 1:5,000 for a fur-ther 60 min. For detection of protein in immunoprecipitatedsamples Trueblot (Rockland) antibodies, which specifically rec-ognize nondenatured antibody, were used to reduce signal gen-erated from immunoprecipitating antibody. For detection ofCaM, the PVDF membranes were incubated for 15 min at roomtemperature in 20 mL of 1% glutaraldehyde in PBS before thefirst blocking step. This technique prevented CaM protein frombeing washed from the membrane during the labeling procedure.After glutaraldehyde fixation, the membrane was thoroughlywashed, as described above, before starting the blocking andlabeling process. Signal detection was performed using a chemi-luminescent reagent (PerkinElmer) as directed by the manu-facturer, followed by exposure of membranes to X-ray films(Fuji). Films were developed using a Compact 4× automaticX-ray film developer (Xograph). Developed films were scannedwith a commercially available Canon scanner for image processing.
Western Blot Assay of L-Selectin–GFP Shedding in Static TransmigrationAssays. HUVEC monolayers were grown to confluence in six-wellplastic dishes and stimulated overnight with 10 ng/mL recombinanthuman TNF-α (R&D Systems). THP-1 cell suspensions wereadded to each well at a density of 2 × 10⁵ cells per milliliter andincubated for 0, 5, 10, 20, 30, or 60 min. The supernatant (un-bound THP-1 fraction) and HUVEC fraction (bound THP-1fraction) were then harvested, washed once with PBS, and lysed inan appropriate volume of Cytobuster Protein Extraction Reagent(Merck Millipore) supplemented with protease inhibitor mixture.Samples were boiled to 95 °C for 5 min and resolved on poly-acrylamide gels. L-selectin–GFP was detected by Western blottingusing anti-GFP antibody (Chromotek).
ConfocalMicroscopy.All specimens were fixed in 4% (vol/vol) PFAand imaged using an inverted SP5 confocal microscope (LeicaMicrosystems). Unless otherwise stated, all images were acquiredusing a 63× objective (N.A. = 1.4 oil immersion). GFP was excitedat λ = 488 nm with an argon laser, whereas TRITC-phalloidin andAlexa Fluor 633 were excited with helium-neon lasers at λ =543/568 nm and 633 nm, respectively. Images were acquired assingle z planes (0.75 μm) or as series of Z-stacks.Acquired Z-stacks were saved as a series of tagged image file
format files and imported into Imaris imaging software (BitplaneAG). Three-dimensional reconstruction was performed manuallyusing the “volume rendering” task for both green and red chan-nels, which corresponded to L-selectin–GFP–stained and TRITC-phalloidin–stained actin, respectively.
Rzeniewicz et al. www.pnas.org/cgi/content/short/1417100112 2 of 14

Wide-Field Fluorescence Microscopy. All leukocyte/endothelial inter-actions under flow were performed at 37 °C and acquired using anOlympus IX81 time-lapse inverted fluorescence microscope con-nected to a Hamamatsu C10600 ORCA-R2 digital video camera.All images were acquired using a Plan Fluor 10× objective lens(N.A. = 0.30), with acquisition rates set to four frames perminute. At least three different fields of view were acquired foreach flow assay, representing regions at the beginning, middle,and end of the flow chamber.
Spinning Disk Confocal Microscopy. An inverted Nikon TI-E mi-croscope was used, equipped with a Yokogawa CSU-X1 SpinningDisk Confocal unit, as well as an Andor NEO EM-CCD cameraand a Sutter filter wheel. For laser excitation, the 488-nm lineof an Agilent MLC laser was used and the emission filter was setat 525/30 (Chroma). Z-series were acquired using a Mad CityLabs nanodrive-controlled Piezo stage using a Nikon apo 40×1.25-water immersion N.A. objective. The movie is a maximumintensity projection of a Z-series, using Z-steps of 0.75 μm, anoriginal Z-range of 26 μm in depth, and a selected Z-rangeof ∼15 μm.
Disuccinimidyl Suberate Cross-Linking of CaM/L-Selectin Peptides.DSS (disuccinimidyl suberate; Pierce) is a homobifunctionalchemical cross-linker. Each end of the chemical is capped with anamine-reactive NHS ester, separated by an 11.4-Å spaced arm.The two NHS groups within a single DSS molecule can reactwith amines with the distance provided by the spacer. Cross-linking experiments were performed using fixed concentrationsof DSS (0.1 mM) and CaM (4.6 μM). L-selectin peptide con-centrations are indicated in the legend of Fig. 4. The DSS cross-linker was dissolved in DMSO and was added to the reactiontube at a maximum volume of 0.625 μL. This volume equates to a2.5% (vol/vol) final DMSO content in each reaction, an amountthat did not affect the stability/electrophoretic mobility of CaM
or the L-selectin tail, as determined with control experimentsconducted with an equivalent volume of DMSO only.
Micropipette Assay.Assays were followed according to Volpe et al.(3). Fibronectin solution was added to glass-bottomed dishes5 cm in diameter (glass thickness = 0.17 mm/no. 1.5) in 5 μg/mLfibronectin for 1 h at 37 °C. Excess fibronectin was removedthrough two rounds of PBS washes. Before the addition of cells,dishes were further incubated in imaging media (PBS containingcalcium and magnesium supplemented with 1% FBS, penicillin/streptomycin, 40 μM sodium pyruvate, 1 mg/mL fatty acid-freeBSA, and 1 mg/mL glucose) to block nonspecific binding of cellsto glass bottoms. Cells were seeded at a density of 1 × 10⁶ cellsper milliliter in warm imaging media left to adhere for 30 min at37 °C. Excess unbound cells were removed before imaging. Allexperiments were conducted at 37 °C and performed within 1 h.Images were acquired at the rate of one frame every 10 s usingan inverted 40× objective lens attached to a Nikon EclipseTE2000-U epifluorescence microscope.Micropipettes were manufactured in-house. Borosilicate glass
capillaries with an i.d. of 0.5 mm were pulled using a P-97Flaming/Brown micropipette puller (Sutter Instrument Com-pany). Pipettes were pulled using the following parameters: heat =500, pull = 500, velocity = 30, and time = 250. The micropipettewas attached to a pressure system [Narishige IM300 microinjector(0.7 psi)]. Avoiding air bubbles, the pipette tip was filled with 200nMMCP-1 diluted in imaging media supplemented with a 10-kDaTRITC-dextran tracer to observe gradient formation and that theneedle did not become blocked during the assay. Optimal polar-ization responses were obtained by culturing THP-1 cells in RPMI1640 GlutaMAX (Gibco, Life Technologies), supplemented with10% (vol/vol) HyClone FBS (GE Healthcare) and 1% (vol/vol)penicillin/streptomycin.
1. Killock DJ, et al. (2009) In Vitro and in Vivo Characterization of Molecular Interactionsbetween Calmodulin, Ezrin/Radixin/Moesin, and L-selectin. J Biol Chem 284(13):8833–8845.
2. Burns SO, et al. (2010) A congenital activating mutant of WASp causes altered plasmamembrane topography and adhesion under flow in lymphocytes. Blood 115(26):5355–5365.
3. Volpe S, Thelen S, Pertel T, Lohse MJ, Thelen M (2010) Polarization of migratingmonocytic cells is independent of PI 3-kinase activity. PLoS ONE 5(4):e10159.
Rzeniewicz et al. www.pnas.org/cgi/content/short/1417100112 3 of 14

Fig. S1. TEM of primary monocytes under static and flow conditions. (A) TEM of primary monocytes across TNF-activated HUVECs performed under staticconditions. Analysis was performed exactly as outlined for Fig. 1B. The average time taken for monocytes to transmigrate is 8.5 min. The additional 2.5 min istaken up by monocyte crawling before TEM. This observation suggests that recruitment from flow may act to localize monocytes better to sites of emigrationthan under static conditions. (B) Extended view of monocytes transmigrating from Fig. 1F. Green arrows are pointing to five monocytes captured in the processof TEM. Moreover, their protruding pseudopods are expressing L-selectin. Arrows indicate a breach in continuity of the VE-cadherin signal and suggest TEM(paracellular) is actively taking place. “Holes” can be seen in the phalloidin (actin) stain, identifying the route taken by the transmigrating leukocyte. Yellowarrows are used in the merged channels image to avoid confusion with green L-selectin signal.
Rzeniewicz et al. www.pnas.org/cgi/content/short/1417100112 4 of 14

Fig. S2. Characterization of a cellular model to study L-selectin shedding during TEM. (A) Amino acid sequence corresponding to the junction of the 17-aaL-selectin cytoplasmic tail (blue) and GFP (green). The 11-aa linker is indicated in red. (B, i) Typical SEM image of a THP-1 cell possessing abundant microvilliwhen seeded and fixed onto poly-L-lysine–coated glass coverslips. Nontransduced THP-1 cells were found to possess similar microvillar structures. (Scale bar:2 μm.) (B, ii and iii) Close-up views of THP-1 microvilli. L-selectin was labeled with DREG56 monoclonal antibody, followed by 10-nm immunogold labeling withsecondary antibody. Positive (ii) and negative (iii) images allow for easier detection of immunogold particles on microvilli. (Scale bar: 1 μm.) (C) Two anti-GFPimmunoprecipitation experiments are resolved in lanes 1 and 2 using lysates derived from THP-1 cells expressing GFP alone (lane 1) or full-length WT L-selectin–GFP
Legend continued on following page
Rzeniewicz et al. www.pnas.org/cgi/content/short/1417100112 5 of 14

(lane 2). (Upper) Anti-GFP immunoblot reveals the three major molecular mass species of WT L-selectin–GFP in lane 2. IB, immunoblot; FL, full length; IC,intracellular form of L-selectin–GFP; MRF, membrane-retained fragment (after shedding). (Lower) Anti-CaM immunoblot shows endogenous CaM coprecipi-tating with WT L-selectin–GFP, but not GFP alone. (D) N-terminal domain of moesin-GFP or ezrin-GFP was coexpressed with WT L-selectin (L-Sel)–RFP in Cos-7cells, and FRET efficiency between the two fluorochromes was measured by FLIM (Materials and Methods). The lifetime of fluorescence is expressed innanoseconds as a pseudocolor scale ranging from red (low lifetime with a very high probability of interaction) to blue (high lifetime with a very low probabilityof interaction). Note that donor (GFP) lifetime is 2.3 ns, and any value lower than this value is calculated as FRET efficiency. (E) THP-1 cells expressing WTL-selectin–GFP were perfused over increasing concentrations of immobilized biotinylated sLex (Materials and Methods) at 1.25 dyn/cm2. Av, average; FoV, fieldof view. (F) Coperfusion experiments were performed using untransduced THP-1 cells (UT) and THP-1 cells expressing GFP alone (GFP) or WT L-selectin–GFP(WT). (i and ii) Control experiments for (iii). Results are expressed as the percentage of cells recruited after 15 min of flow. Three independent coperfusionswere performed for each pair of cell lines. Error bars represent SEM. A two-tailed, unpaired Student’s t test was used for statistical analysis. ***P < 0.001.(G) Optical sections (0.75 μm) of a THP-1 cell undergoing TEM. The continuous VE-cadherin stain in blue (Alexa Fluor 633 secondary antibody) is breachedspecifically where the THP-1 cell is undergoing TEM. HUVEC-derived actin stress fibers are clearly seen to overlay monocyte pseudopods. Note that monocytesdo not produce actin stress fibers. (Scale bar: 5 μm.) (H) Anti-GFP immunoblot of extracts derived from THP-1 cells expressing WT L-selectin–GFP, stimulatedwith or without 10 nM phorbol myristate acetate (PMA) for 10 min. An increase in the cleaved product and a concomitant loss of the full-length (FL) form areobserved in the right-hand lane, indicating robust shedding in response to PMA stimulation. MRF, membrane-retained fragment. (I, Left) Similar Western blotsperformed on THP-1 cells bound to TNF-activated HUVECs over a time course (static assay; SI Materials and Methods). Lysates were generated from bound andunbound fractions of THP-1 cells, and reveal that the majority of cells bind to activated HUVECs between 1 and 5 min under static conditions. Equal volumes ofextract were generated so that lanes could be compared and quantified by densitometric analysis over time. Quantitation of the surface or FL form wasperformed only on the bound fraction of cells. Note that shedding peaks by ∼20 min. (I, Right) Loss of FL signal in the Western blot is expressed as thepercentage of L-selectin remaining on the surface in the bar graph. All values were normalized against an actin loading control. One-way ANOVA, followed byTukey’s posttest, was used for statistical analysis, and is the sum of at least three independent experiments. *P < 0.05; **P < 0.01.
Fig. S3. Characterization of THP-1 cell lines expressing WT and ΔM-N L-selectin. Following lentiviral transduction, all THP-1 monocytes were sorted by flowcytometry to express matched levels of L-selectin–GFP using an in-house cell sorting service. To verify that surface expression levels were matched between celllines, DREG56 monoclonal antibody, followed by phycoerythrin (PE)-conjugated secondary monoclonal antibody, was used to analyze mean fluorescenceintensities. (A) Forward and side scatter profiles of THP-1 cells. The R1 gate depicts the gate within which cells were analyzed. (B) PE fluorescence intensityhistogram with overlaid profiles of WT L-selectin–GFP, ΔM-N L-selectin–GFP, and THP-1 cells labeled with an isotype-matched control. All L-selectin Serto Ala/Asp mutants were similarly sorted against THP-1 cells expressing WT L-selectin–GFP. FL2H, phycoerythrin fluorescence channel. (C and D) Manders’colocalization coefficiency (M2) between LAM1-14 and L-selectin–GFP remains the same above and below the endothelial monolayer in ΔM-N cells (white barsin D), which is in stark contrast to cells expressing WT L-selectin (black bars in D). A two-tailed unpaired Student’s t test was used to calculate differencesbetween TOP and BOTTOM optical sections, and error bars represent SEM. ***P < 0.001. (Scale bar: 9 μm.)
Rzeniewicz et al. www.pnas.org/cgi/content/short/1417100112 6 of 14

Fig. S4. (A) Whole-cell lysates were prepared from HUVEC monolayers treated with or without TNF-α for 16 h and biglycan levels were detected from eachgroup by Western blotting. Densitometric analysis was performed on the biglycan band as indicated in Fig. 2H, and values were normalized against actinloading controls for each group. No change in biglycan expression levels was observed before and after TNF stimulation. Data are expressed from five in-dependent experiments. A.U., arbitrary units; F.I., fluorescence intensity obtained from quantification of IRDye secondary antibodies (LI-COR Biosciences).(B) Immunofluorescence staining of biglycan in TNF-activated HUVEC monolayers reveals a higher expression in the basolateral compartment. HUVECs wereseeded onto fibronectin-coated glass coverslips 13 mm in diameter (10 μg·mL−1) and stimulated for 16 h with 10 ng·mL−1 TNF. Cells were fixed in 4% (vol/vol)PFA solution, and one set of samples was subjected to permeabilization with ice-cold PBS containing 0.1% Nonidet P-40 for 3 min, whereas the other groupwas left untreated. Immunostaining of biglycan revealed a stronger signal in the basolateral compartment, most notably in the nonpermeabilized preparation(prep), which should specifically detect the extracellular fraction of biglycan. PFA fixation was sufficient to permit phalloidin staining, in the absence ofpermeabilization, but not antibody staining. This phenomenon was likely due to a size exclusion phenomenon, because phalloidin is much smaller than wholeantibody. Protein disulfide isomerase (PDI) is an intracellular endoplasmic reticulum marker that was used to control for immunofluorescence staining betweenpermeabilized and nonpermeabilized cells. Anti-PDI antibody was obtained from Abcam [mouse monoclonal anti-PDI antibody (RL90)]. Note that instrumentparameter settings were kept constant for all acquisitions. Immunofluorescence staining of actin (phalloidin-Alexa Fluor 633), biglycan (Alexa Fluor 488), andPDI (Alexa Fluor 568) was used to stain all preparations. Images were acquired with a 63× objective lens and are representative of three independent ex-periments. (Scale bar: 25 μm.)
Rzeniewicz et al. www.pnas.org/cgi/content/short/1417100112 7 of 14

Fig. S5. Typical examples of morphological changes that THP-1 cells undergo as they protrude beneath the endothelial monolayer. Still images were grabbedfrom time-lapse recordings of flow assays (using Volocity software). GFP signal refers to the GFP tag on L-selectin.
Rzeniewicz et al. www.pnas.org/cgi/content/short/1417100112 8 of 14

Fig. S6. (A and B) Expression of L-selectin in THP-1 cells potentiates proinvasive behavior, which is significant only at early time points. It is thought thatshedding of L-selectin may “rein-in” excessive protrusive behavior at later time points. Cells expressing GFP alone (GFP) or WT L-selectin–GFP (WT) wereperfused over TNF-activated HUVECs for 6 or 15 min. Cells were scored for having one, two, or multiple (Multi) protrusions (as in Fig. S4). All other cells weredeemed to be adherent, but not protruding. Values are given as the percentage of the total number of cells adhered at the 15-min time point. (C and D) TAPI-0 (10 μM)does not alter protrusive behavior in THP-1 cells that do not express L-selectin. Cells expressing GFP alone were perfused over TNF-activated HUVECs in the samemanneras in A and B. (E) Primary monocytes were labeled with Cell Tracker Green (Molecular Probes, Life Technologies) and perfused over TNF-activated HUVECs for10 min, followed by a further 15 min with perfusion media. Samples were fixed and stained for L-selectin (using LAM1-14 and Alexa Fluor 555) and actin(phalloidin-Alexa Fluor 633). Note that the cell outlines appear more irregular in the TAPI-0–treated monocytes and that transmigrated cells haveretained L-selectin expression (red signal). These still images reflect the time-lapse recordings provided in Movies S1 and S7. (Scale bar: 25 μm.)
Rzeniewicz et al. www.pnas.org/cgi/content/short/1417100112 9 of 14

Fig. S7. Expression of CCR2 remains unchanged between different THP-1 cell lines. (A) Fluorescence intensity profiles of THP-1 cells expressing WT or ΔM-NL-selectin–FP or GFP alone. In all cases, cells showed matched expression levels of CCR2. The ΔM-N (DMN) cells were stained with an isotype-matched controlantibody to identify the negative (NEG) profile. APC-H, allophycocyanin fluorescence channel. (B) Western blotting of whole-cell lysates also confirmedmatched expression levels. Taken together, these results indicate matched surface level expression of CCR2 and at the whole-cell lysate level.
Movie S1. Monocytes isolated from healthy donors, labeled with LAM1-14 directly conjugated to Alexa Fluor 555, were perfused over TNF-activated HUVECs.Phase and wide-field fluorescence images were acquired using an Olympus IX-81 fluorescence time-lapse microscope. Images were acquired at a rate of fourframes per minute over a 25-min period using an inverted 10× objective lens. (Scale bar: 45 μm.)
Movie S1
Rzeniewicz et al. www.pnas.org/cgi/content/short/1417100112 10 of 14

Movie S2. Primary human monocytes were perfused over TNF-activated HUVECs for 6 min, fixed, and stained for L-selectin (LAM1-14 + Alexa Fluor 488secondary) and TRITC-phalloidin. Imaris software used to render 3D, multiple 0.75-μm confocal sections revealed that the pseudopod contains L-selectin (green)and is penetrating beneath the endothelial monolayer (red). (Scale bar: 3 μm.)
Movie S2
Movie S3. THP-1 cells expressing matched levels of either WT or ΔM-N L-selectin–GFP were perfused over TNF-activated HUVECs for 20 min, and events wererecorded using a Nikon spinning disk confocal microscope. Images were acquired as a series of Z-stacks and reconstituted into a 4D movie. Note that GFP-positive spots appear in pseudopods specifically within the WT cell line at later time points, which was not observed in the ΔM-N cell line. (Scale bar: 10 μm.)
Movie S3
Movie S4. THP-1 cells stably expressing GFP alone were perfused over TNF-activated HUVECs for 15 min. Side-by-side phase and GFP channels are shown. Theframe rate is four frames per minute.
Movie S4
Rzeniewicz et al. www.pnas.org/cgi/content/short/1417100112 11 of 14
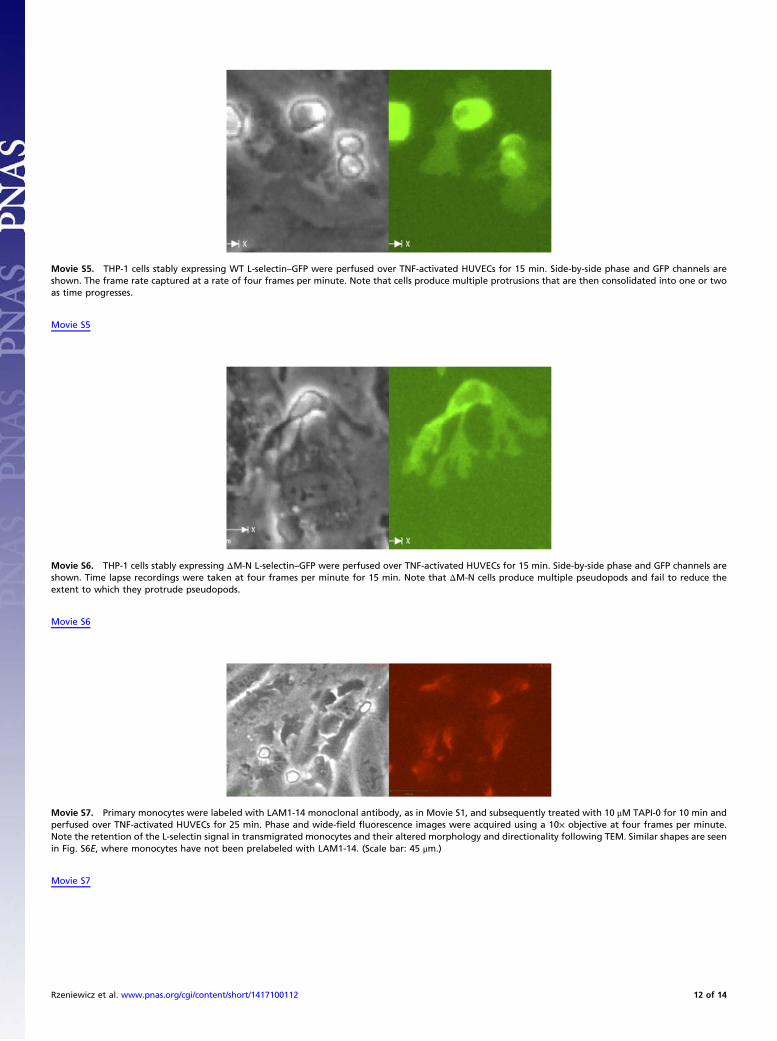
Movie S5. THP-1 cells stably expressing WT L-selectin–GFP were perfused over TNF-activated HUVECs for 15 min. Side-by-side phase and GFP channels areshown. The frame rate captured at a rate of four frames per minute. Note that cells produce multiple protrusions that are then consolidated into one or twoas time progresses.
Movie S5
Movie S6. THP-1 cells stably expressing ΔM-N L-selectin–GFP were perfused over TNF-activated HUVECs for 15 min. Side-by-side phase and GFP channels areshown. Time lapse recordings were taken at four frames per minute for 15 min. Note that ΔM-N cells produce multiple pseudopods and fail to reduce theextent to which they protrude pseudopods.
Movie S6
Movie S7. Primary monocytes were labeled with LAM1-14 monoclonal antibody, as in Movie S1, and subsequently treated with 10 μM TAPI-0 for 10 min andperfused over TNF-activated HUVECs for 25 min. Phase and wide-field fluorescence images were acquired using a 10× objective at four frames per minute.Note the retention of the L-selectin signal in transmigrated monocytes and their altered morphology and directionality following TEM. Similar shapes are seenin Fig. S6E, where monocytes have not been prelabeled with LAM1-14. (Scale bar: 45 μm.)
Movie S7
Rzeniewicz et al. www.pnas.org/cgi/content/short/1417100112 12 of 14

Movie S8. Frame-by-frame recording of DMSO-treated monocytes perfused over TNF-activated HUVECs. Cells were perfused for the first 10 min, followed by15 min of perfusion with media containing DMSO. Protrusion/retraction maps were generated for every nontouching monocyte. Each frame was usedto provide a mean cell volume, mean protrusion area (green), and mean retraction area (red).
Movie S8
Movie S9. Frame-by-frame recording of TAPI-0–treated monocytes perfused over TNF-activated HUVECs. Cells were perfused for the first 10 min, followedby 15 min of perfusion with media containing 10 μM TAPI-0. Protrusion/retraction maps were generated for every nontouching monocyte. Each frame wasused to provide a mean cell volume, mean protrusion area (green), and mean retraction area (red).
Movie S9
Rzeniewicz et al. www.pnas.org/cgi/content/short/1417100112 13 of 14

Movie S10. Micropipette assay. THP-1 cells expressing WT L-selectin–GFP were challenged with 200 nM CCL2 (MCP-1) for ∼10 min. The asterisk denotes theposition of the micropipette tip.
Movie S10
Movie S11. Micropipette assay. THP-1 cells expressing ΔM-N L-selectin–GFP were challenged with 200 nM CCL2 (MCP-1) for ∼10 min. The asterisk denotes theposition of the micropipette tip.
Movie S11
Rzeniewicz et al. www.pnas.org/cgi/content/short/1417100112 14 of 14