supporting information - pnas · sequence. tet and a tet analog, dox (sigma-aldrich), were used for...
TRANSCRIPT

Supporting InformationKanehiro et al. 10.1073/pnas.1120368109SI Materials and MethodsCell Lines, Culture, and Animal Experiments. DT40-SW cells withAID expression switched off were used as AID-knockout cells (1).The wild-type DT40 and NIH 3T3 were obtained from RIKENCell Bank. NSObcl-2 was provided by B. Diamond (ColumbiaUniversity). DT40 cells were cultured in RPMI1640 medium(MP Biomedicals) supplemented with 10% FBS (JRH Bio-sciences), 1% chicken serum (Sigma), 50 μM 2-mercaptoethanol,2 mM glutamine, 1 mM pyruvic acid, 100 μg/mL penicillin G, and50 μg/mL streptomycin at 40 °C in 5% CO2 and 95% air. TheCommittee of Laboratory Animal Care of Okayama Universityapproved all animal experiments.
Primers and Construction of Expression Vectors.All primers for PCRare listed in Table S2. The chicken SRSF1, preSRSF1, SRSF1-3,and Flag-tagged SRSF1-3 DNA fragments were generated byPCR using cDNAs prepared from the wild-type DT40 cells byKOD Plus DNA polymerase (Toyobo). DNA fragments wereinserted into pCI-bsr vector (2). A chicken AID cDNA fragment(1) and loxP-flanked blasticidin S resistance gene cassette (3)were cloned into pExpress vector (3) for AID overexpression.DT40 cells were transfected with linearized DNA constructs byelectroporation as described previously (1).
RT-PCR. cDNA was prepared as described previously (1). TheSRSF1 and SRSF1-3 transcripts were amplified from cDNA us-ing KOD FX DNA polymerase (Toyobo). The transcriptionlevels of the SRSF1, SRSF1-3, and AID genes were determinedby quantitative RT-PCR using the iQ SYBR Green Supermixand iQ5 real-time PCR detection system (Bio-Rad Laborato-ries). Data were normalized to the level of the β-actin or gapdhtranscript.
Western Blot Analysis. Western blot was carried out as describedpreviously (4), using the following antibodies: mouse anti-ASF/SF2 mAb (clone 96; Santa Cruz Biotechnology), mouse anti-AIDmAb (clone L7E7; Cell Signaling Technology), rabbit anti-hem-agglutinin (HA) polyclonal Ab (eBioscience), mouse anti-humanβ-actin (Abcam), horseradish peroxidase (HRP)-conjugated goatanti-mouse IgG (Vector Laboratories), HRP-conjugated goatanti-rabbit IgG (Santa Cruz Biotechnology). The listed antibodiesagainst human and mouse proteins were able to bind chickencounterparts. Blots were developed using the ECL AdvanceWestern Blotting Detection System (GE Healthcare), and chem-iluminescence was detected using the ChemiDoc XRS system(Bio-Rad Laboratories) according to the instructions of themanufacturer.
Analysis of Hypermutation in the IgV Gene. DT40 cells were prop-agated from single subclones that were sorted using FACS Ariaequipped with Auto Cell Deposit Unit (BD Biosciences) andmaintained for 1 mo. The IgVL and IgVH genes were amplifiedfrom genomic DNA by PCR using KOD Plus DNA polymerase(Toyobo), cloned, and sequenced. PCR products were clonedinto the pCR-Blunt vector (Invitrogen) and sequenced using theBigDye Terminator v1.1 Cycle Sequencing Kit and ABI PRISM310 Genetic Analyzer (Applied Biosystems). Nucleotide se-quences corresponding to mature V(D)J (387 bp for VH and 321bp for VL) were compared with the original IgV sequences (Fig.S1) to find mutations. Mutations were categorized as GCV orpoint mutation by comparing mutated sequences with publishedV pseudogene sequences (5, 6) as reported previously (4). Se-
quences with the identical mutations were counted as one in-dependent mutant, because the mutant likely occurred at theearly stage of propagation from a single cell. The frequency ofmutation events was calculated by dividing all mutation events bythe total analyzed nucleotide numbers. The primers used foramplification of the IgV genes are listed in Table S2.An artificial GCV substrate, G/B construct was also used to
analyze hypermutation frequency in DT40-SW cells as describedpreviously (2). AID expression in DT40-SW cells were switchedon, and single cells expressing AID (AID-ON cells) were sortedas described previously (1). The G/B construct is composed ofa transcribed enhanced blue fluorescent protein (EBFP) geneand an untranscribed enhance green fluorescent protein (EGFP)gene (Fig. 4). The expression of the construct is driven by theCMV promoter and a synthetic intron composed of β-globin 5′-splice donor and IgVH 3′-splice acceptor that are derived fromthe pCI-neo vector (Promega). When gene conversion occurs onthe EBFP gene using the EGFP gene as a sequence donor, theoriginal blue fluorescence of G/B construct-bearing cells wasconverted to strong green fluorescence. AID expression inDT40-SW cells can be reversibly switched on and off by treatingwith 4-hydroxytamoxyfen (4-OHT), and AID-expressing (AID-ON) cells can be selected according to expression of EGFPwhose gene is linked downstream of the AID gene through IRES(1). DT40-SW was transfected with an expression DNA con-struct of the SRSF1-3 gene. The G/B construct was integratedinto the unrearranged allele of the IgVL gene in DT40-SW cellsoverexpressing SRSF1-3 as previously described (2). After treat-ment with 4-OHT, single AID-ON cells were sorted as greenfluorescent cells into 96-well plates with FACS Aria equippedwith Auto Cell Deposit Unit (BD Biosciences). Colonies weretransferred to 24-well plate and maintained for 1 mo between∼1 × 10⁵ and 1 × 10⁶ cells. Frequency of cells with stronggreen fluorescence was analyzed using FACS Calibur (BDBiosciences).
SRSF1-Depletion Assay.Depletion of SRSF1 in DT40-ASF cells bytetracycline treatment leads to genomic instability, which can bedetected as occurrence of Tet resistant clones (7). Induction ofTet resistance was a result of translocation of the SRSF1 cDNA-containing transgene to downstream of an enhancer/promotersequence. Tet and a Tet analog, Dox (Sigma-Aldrich), were usedfor detecting occurrence of drug-resistance clones. After 1 μg/mL Tet or 50 ng/mL Dox treatment for 2 d, DT40-ASF cellswere seeded on 96-well plates at 2, 20, 200, 2,000, or 20,000 cells/well. Cells were maintained in the presence of 1μg/mL Tet or50 ng/mL Dox for 10 d, and the surviving clones were scored.
ChIP. ChIP assays were carried out according to a recentlyreported method with modifications (8). A total of 2.5 × 10⁷ cellswere treated with 1% (vol/vol) formaldehyde for crosslinking for10 min at room temperature, followed by quenching with 0.15 Mglycine (final concentration). Nuclear fractions were separatedafter treated in cell lysis buffer [10 mM Tris-HCl (pH 8.0), 10mM NaCl, 0.5% (vol/vol) Nonidet P-40]. After rinsing with celllysis buffer, crosslinked nuclear samples were then sonicatedusing a Bioruptor (Cosmo Bio) in 200 μL of radioimmuno-precipitation assay (RIPA) buffer [20 mM Tris-HCl (pH 8.0), 2mM EDTA, and 1% (vol/vol) Triton X-100 with 0.5% (wt/vol)SDS and 0.5% (wt/vol) sodium deoxycholate] to obtain DNAfragments in the range of 200–1000 bp. After centrifugation at18,000 × g for 10 min, sonicated chromatins were diluted in 1 mL
Kanehiro et al. www.pnas.org/cgi/content/short/1120368109 1 of 8

of RIPA with final concentrations of 150 mM NaCl, 0.1% (wt/vol) SDS, and 0.1% (wt/vol) sodium deoxycholate (indicated asRIPA0.1 below), precleared with protein G-conjugated magneticbeads (Dynabeads Protein G; Invitrogen Dynal AS) that hadbeen blocked with 5 mg/mL acetylated BSA and 1 mg/mL sharedsalmon testis DNA, and immunoprecipitated at 4 °C for 12 hwith 5 μg of mouse anti-AID mAb (clone ZA001; Invitrogen),rabbit anti-acetylated histone H4 (Millipore), anti-Flag [cloneM2 (Sigma-Aldrich) or clone 1E6 for quantitative PCR (Wako)]or isotype-matched control (mouse IgG1, clone G3A1; CellSignaling Technology), followed by incubation at 4 °C for 1 hwith preblocked Dynabeads Protein G. Beads were washed oncewith RIPA0.1 buffer alone and then three times with RIPA0.1buffer plus 0.5 M NaCl, three times with LiCl buffer [10 mMTris-HCl (pH 8.0), 1 mM EDTA, 0.25 M LiCl, 0.5% (vol/vol)Nonidet P-40, and 0.5% (wt/vol) sodium deoxycholate], oncewith TE buffer [10 mM Tris-HCl (pH 8.0) and 1 mM EDTA]plus 0.2% (vol/vol) Triton X-100, and finally once with TE buffer
alone. A protease inhibitor mixture (Nakalai Tesque) was addedto all buffers for treating nuclear and chromatin fractionsthroughout the processes before DNA extraction. ChIP DNAwas extracted at 65 °C for 4 h in 200 μL of TE buffer with 0.2 MNaCl, 1% (wt/vol) SDS, proteinase K (1 mg/mL), and 0.1 MNaHCO3. Samples were subjected to phenol/chloroform ex-traction and ethanol precipitation or purification with MinElutePCR Purification Kit (Qiagen) for quantitative PCR. ExtractedDNA was also analyzed by PCR amplification using KOD FX-neo DNA polymerase (Toyobo).
Analysis of Nuclear Unspliced RNA. Total RNA was extracted fromthe nuclear fraction of DT40 cells using TRIzol Reagent (Invi-trogen) and treated with DNase I (Takara Bio). cDNA wassynthesized from total RNA using random hexamer primers andthe SuperScript II Reverse Transcriptase (Invitrogen). Splicedand unspliced IgH transcripts were amplified using KOD FXDNA polymerase (Toyobo).
1. Kanayama N, Todo K, Reth M, Ohmori H (2005) Reversible switching of immunoglobulinhypermutation machinery in a chicken B cell line. Biochem Biophys Res Commun 327:70–75.
2. Kanayama N, Todo K, Takahashi S, Magari M, Ohmori H (2006) Genetic manipulationof an exogenous non-immunoglobulin protein by gene conversion machinery ina chicken B cell line. Nucleic Acids Res 34:e10.
3. Arakawa H, Lodygin D, Buerstedde JM (2001) Mutant loxP vectors for selectablemarker recycle and conditional knock-outs. BMC Biotechnol 1:7.
4. Magari M, et al. (2010) Enhancement of hypermutation frequency in the chicken B cellline DT40 for efficient diversification of the antibody repertoire. Biochem Biophys ResCommun 396:353–358.
5. Reynaud CA, Dahan A, Anquez V, Weill JC (1989) Somatic hyperconversion diversifiesthe single Vh gene of the chicken with a high incidence in the D region. Cell 59:171–183.
6. Reynaud CA, Anquez V, Grimal H, Weill JC (1987) A hyperconversion mechanismgenerates the chicken light chain preimmune repertoire. Cell 48:379–388.
7. Li X, Manley JL (2005) Inactivation of the SR protein splicing factor ASF/SF2 results ingenomic instability. Cell 122:365–378.
8. Yamane A, et al. (2011) Deep-sequencing identification of the genomic targets of thecytidine deaminase AID and its cofactor RPA in B lymphocytes. Nat Immunol 12:62–69.
Kanehiro et al. www.pnas.org/cgi/content/short/1120368109 2 of 8

BM SP TH NSObcl-2 NIH-3T3
Non-immunized Balb/c
SFRS1SFRS1-3
-actin
Fig. S2. Expressions of mouse SRSF1 and SRSF1-3 transcripts were examined using total RNAs extracted from bone marrow (BM), spleen (SP), and thymus (TH)cells of a BALB/c mouse and NSObcl-2 mouse myeloma cells and NIH 3T3 mouse fibroblast cells.
Fig. S1. DT40-ASF cells lack IgV hypermutation activity. (A) The nucleotide sequences of the IgVH and IgVL genes of DT40-ASF. The IgV genomic DNA wasamplified by PCR, cloned, and sequenced. The sequences encoding the mature V regions are shown. The complementarity determining regions (CDRs)according to the Kabat definition are indicated as bold letters. D and J segments are underlined. (B) Summary of mutation frequency in the IgVL genes ofthe wild-type DT40 and DT40-ASF cells. This table is the summary of experimental data for Fig. 1. aGCV, the event number of gene conversions; bPM, theevent number of point mutations.
Kanehiro et al. www.pnas.org/cgi/content/short/1120368109 3 of 8

#1 #2
20 230
0
1
1
22 3
A
B C
D
DT40-WT DT40-ASF
DT40-ASFpreSRSF1R
#1 #2
SRSF1 SRSF1-3
-actin
Cell line SubcloneMutated/Analyzed
sequencesMutation events GCVa/PMb/Total
Events/bp(x10-4)
DT40-ASF #1 0/22 0/0/0 0vector #2 1/22 0/1/1 1.4
Total(Average) 1/44 0/1/1 0.7DT40-ASF #1 6/20 3/4/7 10.9preSRSF1R #2 13/23 3/9/12 16.3
Total(Average) 19/43 6/13/19 13.8
#1 #2CDR1 CDR2 CDR3
0 300CDR1 CDR2 CDR3
0 300
27
Fig. S3. Transfection with the chicken preSRSF1 cDNA restored hypermutation in DT40-ASF. The resultant strain is indicated as preSRSF1R. (A) preSRSF1R cellsexpressed spliced and unspliced forms of mRNAs encoding SRSF1 and SRSF1-3, respectively. Two independent transfectants of preSRSF1R were analyzed. (B)Sequence analysis of the IgVL gene of preSRSF1R cells. Genomic DNAs extracted from two independent transfectants cultured for 30 d were used for sequenceanalysis. Pie charts depict the proportion of the total number of sequences (number at center) containing one to three mutations. (C) Mutated IgVL sequencesare illustrated. Horizontal bars show independent sequences. Solid bars, and balls and sticks indicate gene conversion tracts and point mutations, respectively.The numbers of identical sequences are indicated on the right side. (D) Summary of sequence analysis of the IgVL genes of preSRSF1R cells. aGCV, the eventnumber of gene conversions; bPM, the event number of point mutations.
Kanehiro et al. www.pnas.org/cgi/content/short/1120368109 4 of 8

DT40-ASF
38 51
SRSF1-3RVector
C
B
A
12
3 4 5 60
0
1
Cell line SubcloneMutated/Analyzed
sequencesMutation events
GCVa/PMb/Otherc/TotalEvents/bp
( 10-4)
DT40-WT#1 3/18 1/3/0/4 5.7#2 14/24 4/5/0/9 9.7
Total(Average) 17/42 2/7/0/9 8.0DT40-ASF
Vector#1 8/18 0/1/0/1 1.4#2 2/20 1/1/0/2 2.6
Total(Average) 10/38 1/2/0/3 2.0
SRSF1-3R#1 24/26 15/24/4/43 43#2 23/25 26/29/8/63 65
Total(Average) 47/51 40/53/12/106 54
DT40-WT SRSF1-3R
#1 #2 #1 #2CDR1 CDR2 CDR3
Vector #1 #2
0 300CDR1 CDR2 CDR3
0 300
CDR1 CDR2 CDR30 300
CDR1 CDR2 CDR30 300
CDR1 CDR2 CDR30 300
CDR1 CDR2 CDR30 300
2
56
82
42
DT40-WT
1
2
3
0
8
Fig. S4. GCV and SHM in the IgVH gene were also restored in DT40-ASF by transfection with the SRSF1-3 cDNA. (A) Sequence analysis of the IgVH genes of thewild-type DT40 cells and DT40-ASF cells transfected with a mock vector and the SRSF1-3 cDNA (indicated as DT40-WT, Vector, and SRSF1-3R, respectively).Genomic DNAs extracted from two independent clones cultured for 30 d were used for sequence analysis. Pie charts depict the proportion of the total numberof sequences (number at center) containing one to six mutations. (B) Analyzed IgVH sequences are illustrated. Horizontal bars show independent sequences.Solid bars, balls and sticks, open squares, open triangles, and vertical bars indicate gene conversion tracts, point mutations, deletions, insertions, and am-biguous mutations, respectively. The numbers of identical sequences are indicated on the right side. (C) Summary of mutation frequency in the IgVH genes ofDT40-WT, Vector, and SRSF1-3R cells. aGCV, the event number of gene conversions; bPM, the event number of point mutations; cOther, deletions, insertions,and ambiguous mutations.
Kanehiro et al. www.pnas.org/cgi/content/short/1120368109 5 of 8

#1 #2
4/58 4/50
5 10
CDR1 CDR2 CDR3 CDR1 CDR2 CDR3
AIDO/E+SRSF1-3R
#1 #2 #3CDR1 CDR2 CDR3 CDR1 CDR2 CDR3 CDR1 CDR2 CDR3
9/44 7/42 11/42 Mutants
/Analyzed clones
0 3000 3000 300
AIDO/E
Mutants/Analyzed clones
0 300 0 300
18
5
21
B
A
Cell line SubcloneMutated/Analyzed
sequencesMutation events GCVa/PMb/Total
Events/bp(x10-4)
DT40-ASF#1 1/30 0/1/1 1.0
Vector #2 1/32 0/1/1 1.0Total(Average) 2/62 0/2/2 1.0
#1 4/58 0/4/4 2.1AIDO/E #2 17/50 0/5/5 3.1
Total(Average) 21/108 0/9/9 2.6#1 26/44 2/12/14 9.9
AIDO/E #2 11/42 2/6/8 5.9+ SRSF1-3R #3 29/42 6/8/14 10.4
Total(Average) 65/128 10/26/36 8.8
Fig. S5. Mutation analysis of the IgV genes in DT40-ASF cells transfected with a mock vector or AID and/or SRSF1-3 cDNAs (Vector, AIDO/E, or AIDOE+SRSF1-3R,respectively). (A) Mutated IgVL sequences of DT40-ASF cells overexpressing AID and/or SRSF1-3 are illustrated as horizontal bars. The results of two or threeindependent transfectants are shown. Data are displayed as Fig. S3. The number of independent mutants in total analyzed clones is shown below. (B) Summaryof mutation frequency in the IgVL genes of DT40-ASF cells overexpressing AID and SRSF1-3. This table is the summary of experimental data of Fig. 5D. aGCV,the event number of gene conversions; bPM, the event number of point mutations.
FLAG-cSRSF1-3
1 µg/ml Dox
-Actin
F-SRSF1-3RVector
Anti-FLAG
Anti-HAHA-hSRSF1
– + – +
Fig. S6. The protein level of SRSF1-3 is regulated by SRSF1. DT40-ASF cells transfected with a mock vector and a Flag-tagged chicken SRSF1-3 cDNA weretreated with 1 μg/mL Dox for 48 h. The protein levels of Flag-SRSF1-3 and HA-tagged human SRSF1 in DT40-ASF cells were analyzed by Western blotting usinganti-Flag and anti-HA mAbs, respectively. β-Actin was used as a control.
Kanehiro et al. www.pnas.org/cgi/content/short/1120368109 6 of 8
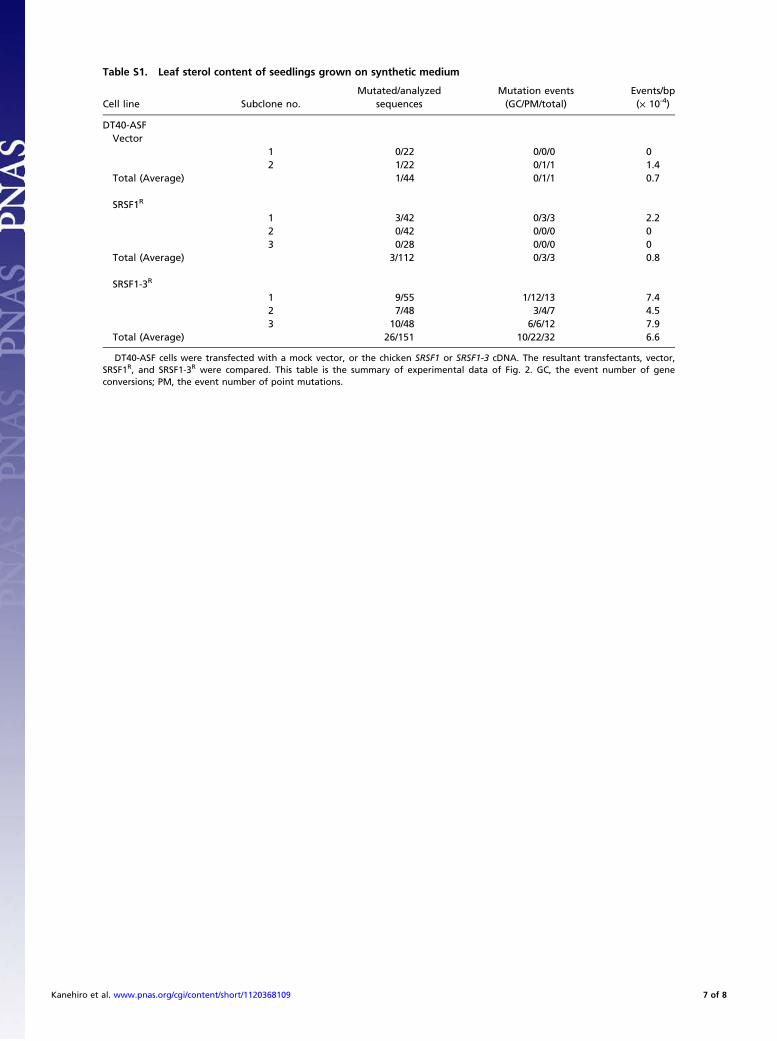
Table S1. Leaf sterol content of seedlings grown on synthetic medium
Cell line Subclone no.Mutated/analyzed
sequencesMutation events(GC/PM/total)
Events/bp(× 10-4)
DT40-ASFVector
1 0/22 0/0/0 02 1/22 0/1/1 1.4
Total (Average) 1/44 0/1/1 0.7
SRSF1R
1 3/42 0/3/3 2.22 0/42 0/0/0 03 0/28 0/0/0 0
Total (Average) 3/112 0/3/3 0.8
SRSF1-3R
1 9/55 1/12/13 7.42 7/48 3/4/7 4.53 10/48 6/6/12 7.9
Total (Average) 26/151 10/22/32 6.6
DT40-ASF cells were transfected with a mock vector, or the chicken SRSF1 or SRSF1-3 cDNA. The resultant transfectants, vector,SRSF1R, and SRSF1-3R were compared. This table is the summary of experimental data of Fig. 2. GC, the event number of geneconversions; PM, the event number of point mutations.
Kanehiro et al. www.pnas.org/cgi/content/short/1120368109 7 of 8

Table S2. Primers used in this study
Primer Sequence (5′ to 3′) Target Figure
RT-PCRcASF-CLF CGCACCGCCGCAGCCATTGCCGACC Chicken SRSF1 and SRSF1-3 Fig. 1cASF-CLR GAGTAAAGGAAAACTGTGTACAACAGTGGcASF3-CLR GCATGCTGACAGACTGCAGATATCG Chicken SRSF1-3mASF-CLF GGTATCAGTGCGCCGAGCTGATAAAGG Mouse SRSF1and SRSF1-3 Fig. S2mASF-CLR TTATGTACGAGAGCGAGATCTGCTATGcIgHLF-Q ACTCGTCTCCTCCCTCCTGCTCCTG Chicken IgH L exon Fig. 6cJH1R2 GCCGCAAATGATGGACCGAC Chicken IgH J 3′ intronβ-Actin F2 AGTGTGACGTTGACATCCGTA Mouse β-ACTIN Figs. 1 and 6β-Actin R2 GCCAGAGCAGTAATCTCCTTCT
Quantitative RT-PCRcASF F1-Q GTACAGAGTGATCGTCTCGGGG Chicken SRSF1and SRSF1-3 Figs. 1–3cASF1-R2-Q GGCAGTTTCTCCCTCATGAGATC Chicken SRSF1cASF3-R3-Q CTGGCCAAAACCAAGTAAGCG Chicken SRSF1-3cAID-rt3 CCCGACATGTGGCTGACTT Chicken AID Figs. 1 and 4cAID-rt4 AGGCGGGCAGTGAAAATGcAct-rt1 TTGTTGACAATGGCTCCGGTATGTG Chicken β-ACTIN Figs. 1–4cAct-rt2 GGGCTTCATCACCAACGTAGCTGTCcgapdh-f GAGGTGCTGCCCAGAACATCATC Chicken GAPDH Fig. 1cgapdh-r CCCGCATCAAAGGTGGAGGAATTotal ASF-f GCGTGAAGCAGGTGATGTATG Chicken and human SRSF1 Fig. 1Total ASF-r CGGATGTAGGCAGTTTCTCC
ChIPcvh3f-ch AGCCCTCCACGCTCCTTTGAGTTG Chicken IgVH Fig. 5cvh3r-ch AGGAGGGAGGAGACGAGTGGcv4f-ch AGGCGTAGGACGTGGCTGGG Chicken IgVLcv4r-ch CGAGTACCTGAGGTGTGGGCGAGgapdhf-ch GTCCAAGTGGTGGCCATC Chicken GAPDHgapdhr-ch CAATCTCAGCTCTCCACCTTCh2af-ch GCCTTGTGACTCTCGGTCTTC Chicken histone H2Ah2ar-ch CTGCGGAAAGGTAACTACGCcact-exf GACGGACTACCTCATGAAGATCCTG Chicken β-ACTINcact-inr GACCTAGGTACCTCAATCATCCTCFLAG-cASF-CLF GGAATTCGCCACCATGGACTACAAGGACGACG
ACGACAAGGGCATGTCCGGAGGGGGCGTFLAG-tagged SRSF1–3 gene cloning
Mutation analysisCVLF61 GGCACGGAGCTCTGTCCCATTGCTG Chicken IgL V exon Figs. 1, 2, and 4 and
Figs. S1 and S3–S5CVLR31 CCCCAGCCTGCCGCCAAGTCCAAGcvh1f2 GGCGGCTCCGTCAGCGCTCTCT Chicken IgH V exoncjh1r2 GCCGCAAATGATGGACCGAC
Kanehiro et al. www.pnas.org/cgi/content/short/1120368109 8 of 8