supporting information - royal society of chemistry · s4 found 439.23. synthesis of zn(dbda). a...
TRANSCRIPT

S1
Design and Synthesis of Squaramide-Based MOFs as
Efficient MOF-supported Hydrogen-Bonding
Organocatalysts
Xiaoping Zhang,§,a,b Zhenjie Zhang,§,a Jake Boissonnaulta and Seth M. Cohen*,a
Department of Chemistry and Biochemistry, University of California, San Diego, La Jolla, California 92093, United States
Department of Chemistry, Key Laboratory of Advanced Energy Materials Chemistry (MOE), Collaborative Innovation Center of Chemical Science and Engineering, Nankai University,
Tianjin 300071, P. R. China
SUPPORTING INFORMATION
Electronic Supplementary Material (ESI) for ChemComm.This journal is © The Royal Society of Chemistry 2016

S2
General Materials and Methods. Unless otherwise noted, all starting materials were obtained from commercial suppliers (Sigma-Aldrich, Acros Organics, Spectrum, Omnisolv, and others), and used without further purification. 1H NMR spectroscopy was measured on a Varian Mercury-400 NMR spectrometer, chemical shifts were quoted in parts per million (ppm) referenced to the appropriate solvent peak or 0 ppm for TMS. ESI-MS was performed using a ThermoFinnigan LCQ-DECA mass spectrometer, and the data was analyzed using the Xcalibur software suite. Inductively coupled plasma optical emission spectrometer (ICP-OES) was tested on a Perkin Elmer Optima 3000 ICP Emission Spectrometer (the concentration of the MOFs were 600-800 ppb). Centrifugation was performed using a Beckman Coulter Microfuge Lite Centrifuge, with a fixed-angle rotor at 6000 rpm for 2 min. FTIR data were collected at ambient temperature on a Bruker ALPHA FTIR Spectrometer from 4000 cm-1 and 400 cm-1, and experimental backgrounds were corrected using OPUS software package. The following indications are used to characterize absorption bands: strong (s), medium (m), weak (w), and broad (br).
Energy Dispersed X-ray Spectroscopy (EDX). Approximately 1-3 mg of Cu(dbda)x(tptc)1-x (x = 1, 0.75, 0.49, 0.18, 0) were transferred to conductive carbon tape on a sample holder disk, and coated using a Ir-sputter coating for 8 sec. A Philips XL ESEM instrument was used for acquiring images using a 7.5 kV energy source under vacuum.
Thermalgravimetric Analysis (TGA). Approximately 5-10 mg of dried MOFs sample was used for TGA measurements. Samples were analyzed under a stream of N2 (80 mL/min) using a Mettler Toledo TGA/DSC STARe System running from room temperature to 800 °C with a scan rate of 5 °C/min.
Powder X-ray Diffraction (PXRD) Analysis. As-synthesized MOFs were isolated by filtration and air-dried for 5 min prior to data collection. The samples were spread on a zero field sample holder. PXRD data were collected at ambient temperature on a Bruker D8 Advance diffractometer at 40 kV, 40 mA for Cu Kα (λ =1.5418 Å), with a scan speed of 0.2 sec/step, a step size of 0.04° in 2θ, and a 2θ range of 5 to 40°.
BET Surface Area Analysis. Low-pressure gas adsorption measurements were measured with an ASAP 2020 surface area and pore size analyzer. Before gas sorption tests, as-synthesized MOFs were been soaked in 10.0 mL MeOH (refreshed every 24 h) for 3 d. Approximately 60-80 mg of each MOFs were transferred to preweighed sample tubes and evacuated on a vacuum line for 1 h at room temperature, and subsequently degassed at 60 °C on an ASAP 2020 Adsorption analyzer for 10 h. The sample tube was reweighed to obtain a consistent mass for the degassed sample. UHP grade (99.999%) N2 were used for all measurements. The sample temperature was maintained at 77 K (liquid nitrogen bath).
Single-Crystal X-ray Diffraction (XRD). The suitable crystals (~20 µm × 20 µm × 20 µm) of Zn(dbda) and Cu(dbda) were selected and diffraction data was collected on a Bruker Apex diffractometer using Mo Kα (λ = 0.71073 Å) radiation. Metal

S3
atoms were found in the Fourier difference map and refined anisotropically. The disordered solvent molecules within the framework were treated with the “SQUEEZE” protocol in PLATON to account for electron density.1, 2 The structure was solved by direct methods using SHELXTL and refined by full-matrix least squares on F2 using SHELX-97.3 Non-hydrogen atoms were refined with anisotropic displacement parameters during the final cycles. Hydrogen atoms were placed in calculated positions. Crystallographic data (excluding structure factors) for the structures reported in this paper have been deposited in the Cambridge Crystallographic Data Center (CDCC) as CCDC 1472314 and 1472315.
MOF Digestion and Analysis by 1H NMR. ~5 mg of Cu(dbda)x(tptc)1-x (x = 0.75, 0.49, 0.18) was dried in air and digested with sonication in 750 µL DMSO-d6 and 10 µL of 35% DCl.
General Procedure for Catalysis Experiments. Indole (18 mg, 0.15 mmol), β-nitrostyrene (15 mg, 0.1 mmol), and 5 mol% MOF catalyst were added to 1.0 mL of dry CHCl3 in a 8.0 mL glass vial. A freeze-pump-thaw method was used to degas the system. The vial was connected to a Schlenk line, and liquid nitrogen in a dewar was used to freeze the solution. When the solvent was frozen, the frozen solution was placed under vacuum for 10 min, then purged with nitrogen, and then thawed until the solvent melted. The reaction mixture was incubated at 50 ºC for 24 h under N2. After cooling down, the solution was evaporated under vacuum to remove the solvent and 750 µL CD2Cl2 was used to dissolve the product for 1H NMR analysis. The reaction was monitored by 1H NMR spectroscopy via the integration of α-vinyl and β-vinyl proton of β-nitrostyrene (δ 8.02 − 8.07 ppm) and the resulting aliphatic proton of the product 3-(2-nitro-1-phenylethyl)-1H-indole (δ 4.95 − 5.25 ppm). To test recyclability, the supernatant was separated from the catalyst by centrifugation. The solid catalysts were washed with MeOH (3×5 mL) and soaked in the MeOH for 24 h. After soaking, the solids were centrifuged and dried in air. The dried MOFs were directly used for the next run of Friedel-Crafts catalysis.
Synthesis of Squaramide Ligand and MOFs.
Synthesis of 5,5’-((3,4-dioxocylcobut-1-ene-1,2-diyl)bis(azanediyl))diisophthalic acid (H4dbda). H4dbda ligand was synthesized according to a literature procedure (Fig. S1).4 5-Amino-isophthalic acid (761 mg, 4.2 mmol), Zn(CF3SO3)2 (145 mg, 0.4 mmol), and 3,4-diethoxy-3-cyclobutene-1,2-dione (295 uL, 2 mmol) was added into 19.0 mL toluene and 1.0 mL NMP. After heating to reflux at 100 ºC for 24 h under a N2 atmosphere, a yellow precipitate was harvested by filtration and washed with MeOH (10 mL). To further purify the product, the yellow solid was stirred in boiling MeOH (20 mL) for 5 min and then isolated by vacuum filtration, and washed with MeOH (3×5 mL). This purification procedure was repeated two more times, and the product was dried at 80 ºC for 12 h. Yield: 1.41 g (80%) based on 3,4-diethoxy-3-cyclobutene-1,2-dione. 1H NMR (400 MHz, DMSO-d6): δ 10.24 (s, 2H), 8.13 (d, J = 20 Hz, 6H). ESI-MS (m/z): [M]- calculated for [C20H11N2O10]- 439.32,
S4
found 439.23.
Synthesis of Zn(dbda). A mixture of Zn(NO3)2·6H2O (60 mg, 0.20 mmol) and H4dbda (22 mg, 0.05 mmol) in 2.0 mL of DMF and 0.2 mL EtOH was sealed in a 20 mL glass vial and heated to 80 °C for 24 h. After cooling, pale-yellow block crystals were collected by filtration. The crystals were washed with DMF (3×5 mL) and stored in DMF. Yield: 20 mg (67% based on H4dbda). IR: ṽ = 3196 (br), 1788 (w), 1552 (m), 1360 (s), 898 (w), 771 (m), 710 (w), 662 (w).
Synthesis of Zn(dbda)x(tptc)1-x (x = 0.75, 0.49, 0.18, 0). These compounds were prepared via the same procedure as Zn(dbda) but with different ratio of mixed ligands: H4dbda (16 mg, 0.038 mmol) and H4tptc (5 mg, 0.0125 mmol); H4dbda (11 mg, 0.025 mmol) and H4tptc (10 mg, 0.025 mmol); H4dbda (5.5 mg, 0.0125 mmol) and H4tptc (15 mg, 0.0375 mmol); and H4tptc (20 mg, 0.050 mmol), respectively. All the harvested crystals were washed with DMF (3×5 mL) and stored in DMF. While the block crystals of Zn(tptc) were colorless, the crystals of (Zn(dbda)x(tptc)1-
x (x = 0.75, 0.49, 0.18) are pale-yellow. Yield calculated based on the total amount of combined ligand: 21 mg (71%) for Zn(dbda)0.75(tptc)0.25, 17 mg (71%) for Zn(dbda)0.49(tptc)0.51, 21 mg (72%) for Zn(dbda)0.18(tptc)0.82, and 21 mg (73%) for Zn(tptc), respectively. IR: for Zn(dbda)0.75(tptc)0.25, ṽ = 3198 (br), 1787 (w), 1551 (m), 1364 (s), 1110 (w), 770 (m), 709 (w); for Zn(dbda)0.49(tptc)0.51, ṽ = 3207 (br), 1614 (w), 1555 (m), 1362 (s), 1109 (w), 770 (m), 714 (m); for Zn(dbda)0.18(tptc)0.82, ṽ = 3201 (br), 1613 (w), 1547 (m), 1358 (s), 1108 (w), 836 (w), 771 (w), 718 (m); for Zn(tptc), ṽ = 3237 (br), 1618 (w), 1561 (m), 1448 (w), 1359 (s), 1107 (w), 915 (w), 836 (w), 770 (w), 719 (m).
Synthesis of Cu(dbda) using PSE. 50 mg of Zn(dbda) crystals were placed in 10 mL MeOH containing Cu(NO3)2·2.5H2O (9.3 mg/mL). The solution was incubated at room temperature for 2 d, with a fresh Cu(NO3)2·2.5H2O solution (10 mL) provided every 12 h. The harvested Cu(dbda) crystals were washed with MeOH (3×5 mL) and then immersed in 10 mL of pure MeOH for 2 d with a fresh MeOH solution provided every 12 h. Yield: 51 mg (98%). IR: ṽ = 3080 (br), 1789 (w), 1687 (w), 1614 (m), 1366 (s), 901 (w), 765 (m), 716 (w), 666 (w), 475 (w).
Synthesis of Cu(dbda)x(tptc)1-x (x = 0.75, 0.49, 0.18, 0) using PSE. All of the compounds were prepared via the same procedure as described above for Cu(dbda), but using the corresponding Zn(dbda)x(tptc)1-x MOFs instead of Zn(dbda) crystals for the metal exchange. Yield: 51 mg (98%) for Cu(dbda)0.75(tptc)0.25, 52 mg (99%) for Cu(dbda)0.49(tptc)0.51, 51 mg (98%) for Cu(dbda)0.18(tptc)0.82, and 52 mg (99%) for Cu (tptc). IR: for Cu(dbda)0.75(tptc)0.25, ṽ = 3081 (br), 1789 (w), 1556 (m), 1361 (s), 901 (w), 766 (m), 717 (m), 475 (w); for Cu(dbda)0.49(tptc)0.51, ṽ = 3173 (br), 1551 (m), 1358 (s), 1079 (w), 836 (w), 767 (m), 719 (w), 475 (w); for Cu(dbda)0.18(tptc)0.82, ṽ = 3185 (br), 1609 (w), 1560 (m), 1449 (w), 1356 (s), 1080 (w), 834 (w), 769 (m), 722 (w), 477 (w); for Cu (tptc), ṽ = 3211 (br), 1608 (w), 1572 (m), 1450 (m), 1357 (s), 1081 (w), 915 (w), 834 (w), 769 (m), 723 (w), 485 (w).
S5
Synthesis of Cu(tptc) using solvothermal methods. H4tptc (0.05 g, 0.12 mmol) and Cu(NO3)2·2.5H2O (0.1 g, 0.43 mmol) were mixed and dispersed in DMF/1,4-dioxane/H2O (2:1:1 v/v/v, 15 mL). Then added 2 drops of aqueous HCl (37%). The solution was kept at 80 ºC for 3 days. The blue crystalline product was separated by filtration washed by DMF (3×5 mL), and then dried briefly in air (yield: 76 mg, 70%).
Synthesis of Cu(dbda)0.12(tptc)0.88, Cu(dbda)0.31(tptc)0.69, and Cu(dbda) using solvothermal methods. The mixed-ligand MOFs were prepared via the same procedure as Cu(tptc) but with different ratio of mixed ligands: H4dbda (13.2 mg, 0.03 mmol) and H4tptc (36.5 mg, 0.09 mmol); H4dbda (26.4 mg, 0.06 mmol) and H4tptc (25.0 mg, 0.06 mmol); and H4dbda (52.8 mg, 0.12 mmol), respectively. The materials were isolated as blue powders. Yield: 76 mg (69%) for Cu(dbda)0.12(tptc)0.88, 70 mg (63%) for Cu(dbda)0.31(tptc)0.69, 0% for Cu(dbda).

S6
Table S1. Crystal Data and Structure Refinement for Zn(dbda) and Cu(dbda).
Zn(dbda) Cu(dbda)
formula C180H54N18O108Zn18 C194H54N18O117Cu18
FW 5373.77 5648.54T (K) 296(2) 296(2)crystal system Trigonal Trigonalspace group R-3m R-3ma (Å) 18.816(2) 18.2623(6)b (Å) 18.816(2) 18.2623(6)c (Å) 38.416(5) 39.6543(13)α (deg) 90.00 90.00 (deg) 90.00 90.00γ (deg) 120.00 120.00V (Å3) 11778(3) 11453.3(8)Z 1 1ρcalc (g/cm3) 0.758 0.819μ (mm-1) 0.946 0.870
index ranges-23 ≤ h ≤ 22-20 ≤ k ≤ 21-48 ≤ l ≤ 48
-23 ≤ h ≤ 23-22 ≤ k ≤ 20-50 ≤ l ≤ 50
reflns collected 14002 28287Independent(Rint) 2950 (0.0458) 2365 (0.0453)GOF on F2 1.184 1.133R1, ωR2 [I>2 (I)] 0.0700, 0.1823 0.0689, 0.2158R1, ωR2 (all data) 0.0901, 0.1900 0.0784, 0.2267largest diff. peak/hole (e/Å3) 1.44, -0.55 1.17, -0.65
Table S2. Metal ion content analysis for Cu(dbda)x(tptc)1-x (x = 1, 0.75, 0.49, 0.18, 0).
Samples EDX ICP-OES
Cu(dbda) Cu 99%Zn 1%
Cu >99%Zn N/A
Cu(dbda)0.75(tptc)0.25 Cu 100%Zn 0%
Cu >99%Zn N/A
Cu(dbda)0.49(tptc)0.51 Cu 92%Zn 8%
Cu >99%Zn N/A
Cu(dbda)0.18(tptc)0.82 Cu 92%Zn 8%
Cu >99%Zn N/A
Cu(tptc) Cu 92%Zn 8%
Cu >99%Zn N/A
N/A = Zn2+ was below the detection limit of the instrument.

S7
Table S3. Summary of unit cells and parameters in Zn(dbda) and Cu(dbda).
Zn(dbda) Cu(dbda)
Metal-Metal bond distanc 2.999 Å 2.629 Å
Metal-O bond distance
Zn-O (DMF) = 2.004(11) ÅZn-O (COO) = 2.036(11) ÅZn-O (COO) = 2.024(10) ÅZn-O (COO) = 2.049(10) Å
Cu-O (MeOH) = 2.171(5) ÅCu-O (COO) = 1.947(3) Å
Table S4. Friedel-Crafts reaction of indole and β-nitrostyrene in different solvents.
entry catalyst solvent Temp (ºC) time Yield (%)
1 Cu(dbda) CH3CN 25 24 h 0
2 Cu(dbda) Toluene 25 24 h 15
3 Cu(dbda) CH2Cl2 25 24 h 38
4 Cu(dbda) CHCl3 25 24 h 60
5 Cu(dbda) CH2Cl2 35 24 h 61
6 Cu(dbda) CHCl3 35 24 h 79
7 Cu(dbda) Toluene 50 24 h 88
8 Cu(dbda) CHCl3 50 24 h 99
9 Cu(dbda) CD2Cl2 25 24 h 32
Fig. S1 Preparation of H4dbda.
Fig. S2 1H NMR spectrum of the H4dbda ligand.

S8
Fig. S3 Structure of Zn(dbda) viewed along crystallographic b-axis.
Fig. S4 Schematic representation of (4,5)-connected framework of Zn(dbda). Purple: 4-connected Zn-paddle wheel SBU nodes; green: 4-connected DBDA ligand.

S9
Fig. S5 PXRD patterns of Zn(dbda) after activation at 60 ºC for 10 h.
Fig. S6 Simulated PXRD pattern (based on XRD, red) of Zn(dbda) and as-synthesized Zn(dbda) upon exposure to various organic solvents for 24 h at room temperature. Abbreviations: EA, ethyl acetate; DCM, dichloromethane; MeOH, methanol; n-Hex, n-hexane; EtOH, ethanol; Tol, toluene; Diox, 1,4-dioxane; TCM, trichloromethane; NMP, N-methyl-2-pyrrolidone.
S10
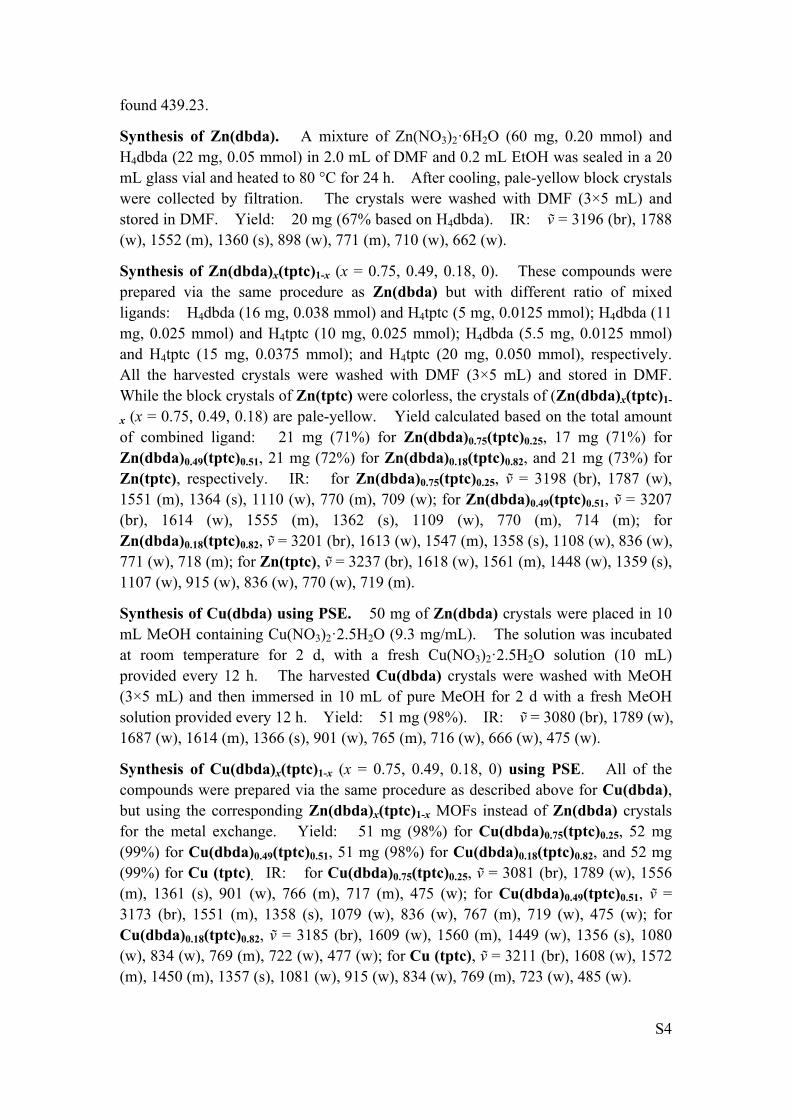
Fig. S7 Simulated PXRD patterns (based on XRD, red) of Zn(dbda) and as-synthesized Zn(dbda) upon exposure to water for 3 h.
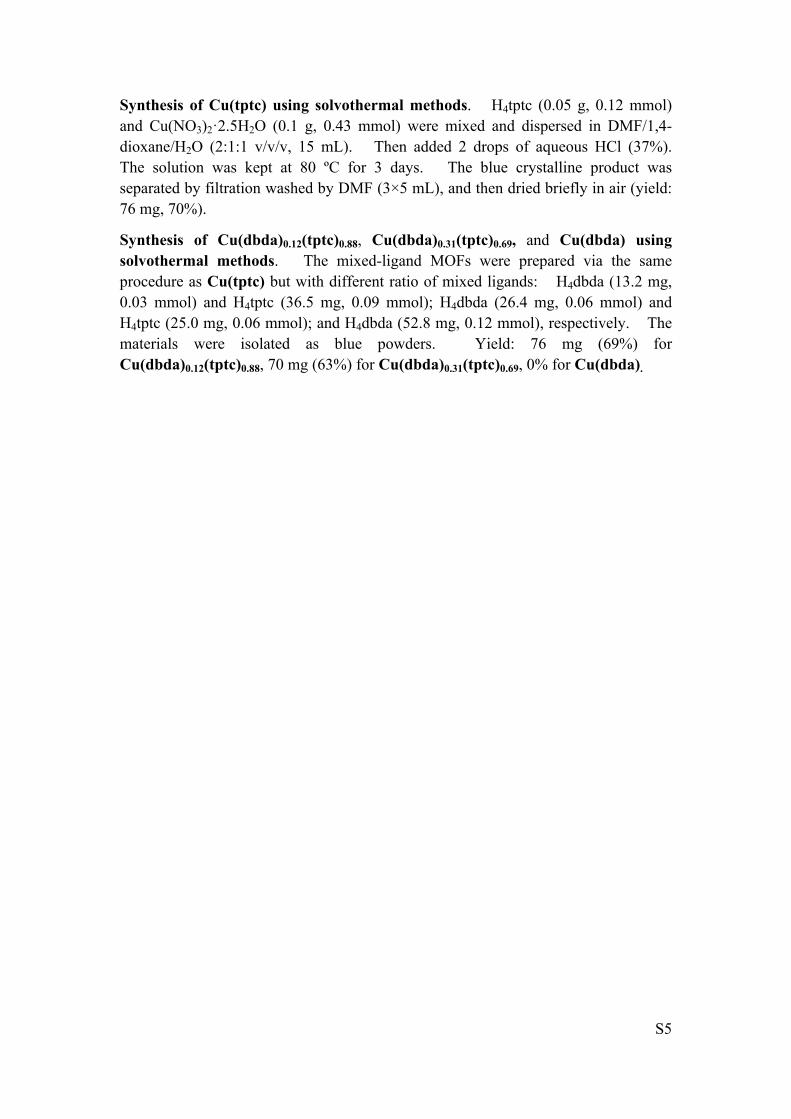
Fig. S8 1H NMR spectrum (400 MHz) of the reaction between indole and β-nitrostyrene with 5 mol% loading of Zn(dbda) as catalyst. No reaction was observed under these conditions.

S11
Fig. S9 Top: Simulated PXRD patterns (based on XRD, red) of Zn(dbda), and Zn(dbda) after catalysis. Bottom: As-synthesized Zn(dbda) after soaking in CHCl3 at 50 ºC for 8 h.
Fig. S10 Photographs of Cu(dbda) and Zn(dbda) crystals.

S12
Fig. S11 EDX spectra of Cu(dbda), produced by PSE of Zn(dbda).
Fig. S12 Simulated PXRD patterns (based on XRD, red) of Cu(dbda), and as-synthesized Cu(dbda) upon exposure to various organic solvents for 90 h at room temperature. Abbreviations: EA, ethyl acetate; DCM, dichloromethane; MeOH, methanol; n-Hex, n-hexane; EtOH, ethanol; Tol, toluene; Diox, 1,4-dioxane; TCM, trichloromethane; NMP, N-methyl-2-pyrrolidone.

S13
Fig. S13 Simulated PXRD patterns (based on XRD, red) of Cu(dbda) and Cu(dbda) upon exposure to water for 3 h at room temperature.
Fig. S14 1H NMR spectrum (400 MHz) monitoring the reaction between indole and β-nitrostyrene in CH3CN, toluene, CH2Cl2, CD2Cl2, and CHCl3 solvents. The reaction was carried out using 5 mol% of Cu(dbda) catalyst in 1 mL of solvent for 24 h at the temperature indicated in the figure. The reaction in CD2Cl2 was performed under the same condition as reported in reference 20 of the main text (J. Am. Chem. Soc., 2015, 137, 919-925).

S14
Fig. S15 1H NMR spectrum (400 MHz) monitored the reaction between indole and β-nitrostyrene with no catalyst, H4dbda, Cu(NO3)2, and Cu(dbda) at 50 ºC for 24 h ( 5 mol% loading of catalyst).
Fig. S16 Left: 1H NMR spectrum (400 MHz) of the reaction between indole and β-nitrostyrene from 30 min to 24 h using 5 mol% of Cu(dbda) catalyst at 50 ºC. Right: Graphical depiction of the reaction conversion at each time point (black line). A test was performed with the same catalysis procedure where the reaction progress was measured after 30 min, and then the MOF was removed using a PTFE microfilter. The reaction progress was again measured after another 23.5 h, which showed no progression of the reaction (red line, and top 1H NMR spectrum at left).

S15
Fig. S17 Left: 1H NMR spectrum (400 MHz) of catalyst recycling performed with 5 mol% of Cu(dbda) in CHCl3 at 50 ºC for 24 h. Right: Graphical depiction of the reaction yield for each run.
Fig. S18 PXRD patterns of Cu(dbda), simulated, (based on XRD, red) experimental Cu(dbda) before catalysis (black), and experimental Cu(dbda) catalyst after 5 reaction cycles (blue).

S16
Fig. S19 1H NMR spectra (400 MHz) monitoring the reaction between indole and substituted β-nitrostyrene using 5 mol% of Cu(dbda) in CHCl3 at 50 ºC for 24 h.
Fig. S20 EDX spectra of the Cu(dbda)0.75(tptc)0.25.

S17
Fig. S21 EDX spectra of the Cu(dbda)0.49(tptc)0.51.
Fig. S22 EDX spectra of the Cu(dbda)0.18(tptc)0.82.
Fig. S23 EDX spectra of the Cu(tptc).

S18
Fig. S24 Simualted PXRD patterns of Cu(dbda) and Cu(tptc) (based on XRD, red and purple), and as-synthesized Cu(dbda)x(tptc)1-x (x = 1, 0.75, 0.49, 0.18, 0).

S19
Fig. S25 1H NMR spectra (400 MHz) collected to determine the ratio of ligands present in Cu(dbda)x(tptc)1-x (x = 0.75, 0.49, 0.18).
Fig S26. Simualted PXRD patterns of Cu(dbda) and Cu(tptc) (based on XRD, red and purple), and as-synthesized Cu(dbda)x(tptc)1-x (x = 0.12, 0.31, 0) using a modification of a direct solvothermal method from the literature).5

S20
Fig S27. 1H NMR spectra (400 MHz) collected to determine and compare the ratio of ligands present in Cu(dbda)x(tptc)1-x (x = 0.49, 0.18, PSE method) and Cu(dbda)x(tptc)1-x (x = 0.31, 0.12, direct solvothermal method).
Fig. S28 1H NMR spectra (400 MHz) monitoring the reaction between indole and substituted β-nitrostyrene using 5 mol% of Cu(dbda)x(tptc)1-x in CHCl3 at 50 ºC for 24 h.

S21
Fig. S29 TGA traces of Zn(dbda)x(tptc)1-x (x = 1, 0.75, 0.49, 0.18, 0).
Fig. S30 TGA traces of Cu(dbda)x(tptc)1-x (x = 1, 0.75, 0.49, 0.18, 0).
S22
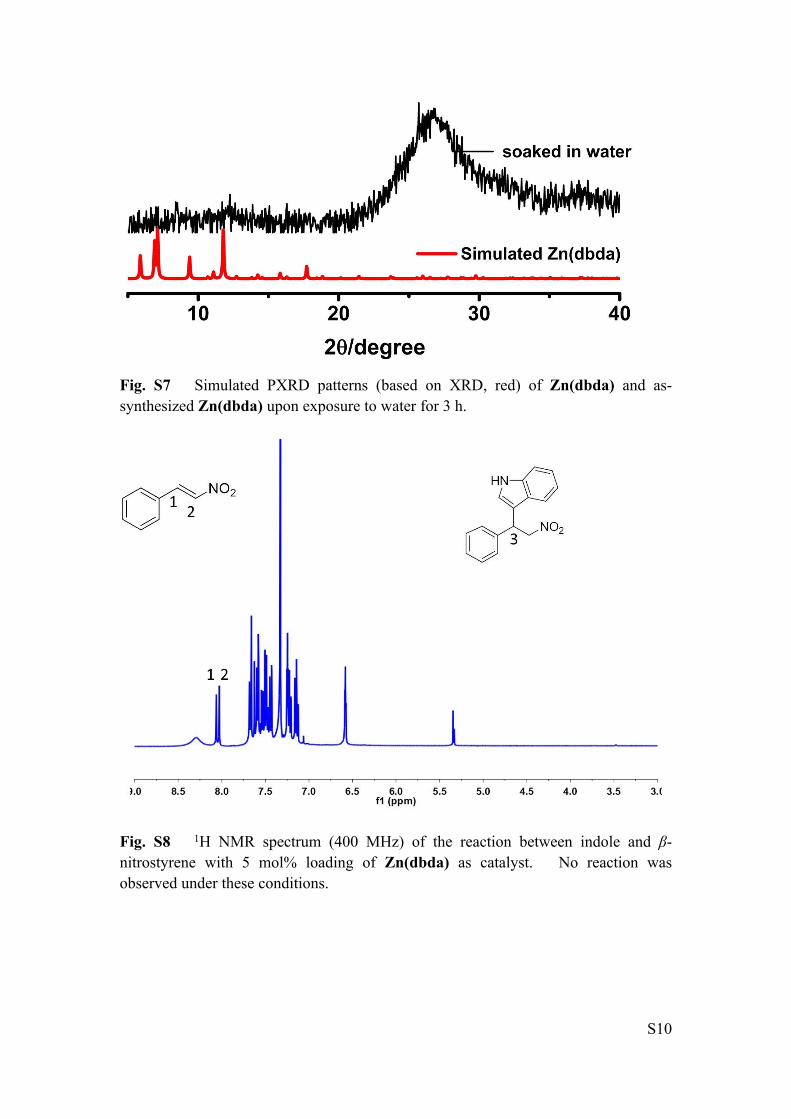
Fig. S31 Proposed mechanism of the reaction beween indole and β-nitrostyrene catalyzed by Cu(dbda). Reproduced from reference 6.
References
1. P. van der Sluis and A. L. Spek, Acta Cryst. , 1990, A46, 194-201.2. A. Spek, J. Appl. Cryst. , 2003, 36, 7-13.3. G. Sheldrick, Acta Cryst., 2008, A64, 112-122.4. A. Rostami, A. Colin, X. Y. Li, M. G. Chudzinski, A. J. Lough and M. S. Taylor, J. Org.
Chem., 2010, 75, 3983-3992.5. X. Lin, J. Jia, X. Zhao, K. M. Thomas, A. J. Blake, G. S. Walker, N. R. Champness, P.
Hubberstey and M. Schröder, Angew. Chem. Int. Ed., 2006, 45, 7358-7364.6. D. Roca-Lopez, E. Marques-Lopez, A. Alcaine, P. Merino and R. P. Herrera, Org. Biomol.
Chem., 2014, 12, 4503-4510.