supporting information - pnas · supporting information ... ed50a; dionex) and a gamma detector...
TRANSCRIPT
Supporting InformationClark et al. 10.1073/pnas.1410326111SI Materials and MethodsAll chemicals were purchased from Sigma–Aldrich unless oth-erwise noted. All chemicals were used without further purifica-tion. Ethanol (200 proof) was purchased from the Universityof California, Los Angeles (UCLA) Chemistry Department.Hydrochloric acid (1N, certified) and sodium hydroxide (2N,certified) were purchased from Fisher Scientific. DFA for theenzymatic reactions and in vivo metabolite analyses was fromCarbosynth. The solid-phase extraction cartridges Silica Sep-Pak(WAT020520), tC18 Sep-Pak cartridge (WAT036805), and Sep-Pak Plus Alumina N Cartridges (WAT020510) were purchasedfrom Waters Associates. The Sep-Pak Maxi-clean SCX (AT21903)cartridge was purchased from Alltech Associates. READI-CLINGcartridges (KT-100) were from Huayi Isotopes. The silica car-tridge was preconditioned with 10 mL of anhydrous hexane, thetC18 cartridge was preconditioned with 5 mL of ethanol followedby 10 mL of 18-mΩ H2O, the alumina cartridge was precondi-tioned with 10 mL of 18-mΩ H2O, the Maxi-clean SCX cartridgewas preconditioned with 10 mL of 18-mΩ H2O, and the KT-100cartridge was preconditioned with 5 mL of ethanol followed by10 mL of 18-mΩ H2O. TLC was performed on EMD Milliporesilica gel 60 F254 TLC aluminum sheets and visualized witha UV-254 lamp or 10% (vol/vol) sulfuric acid in ethanol stain.NMR spectra were obtained on Bruker AV300 and AV500 in-struments at the UCLA Molecular Instrumentation Center(MIC) Magnetic Resonance Laboratory. Mass spectra wererecorded on a Waters LCT Premier with ACQUITY liquidchromatography (LC) instrument at the UCLA MIC MassSpectrometry Laboratory.
[19F]2-Deoxy-2-Fluoroarabinose Synthesis. [19F]-2-deoxy-2-fluoro-1,3,5-tri-O-benzoyl-α-D-arabinofuranose. In an oven-dried, 5-mL, round-bottom flask, 1,3,5-tri-O-benzoyl-α-D-ribofuranose (0.1 g, 0.216mmol) was coevaporated twice with 1 mL of dry toluene, purgedwith argon, and dissolved in 1 mL of dry dichloromethane. Whilestirring at room temperature (RT), diethylaminosulfur tri-fluoride (0.04 mL, 0.3 mmol) was carefully added, and the re-action mixture was warmed to 40 °C for 12 h. A second portionof diethylaminosulfur trifluoride (0.04 mL, 0.3 mmol) was addedto the reaction mixture, and heating with stirring was continuedfor another 12 h. TLC in dichloromethane indicated completeconversion to a spot with an Rf of 0.35. The reaction mixture wasdiluted with 2 mL of methylene chloride and quenched with3 mL of saturated aqueous NaHCO3. Phases were separated,the aqueous layer was extracted with dichloromethane (2 mL,twice), and the combined organic phase was dried over anhy-drous Na2SO4. The salt was filtered off, and the filtrate wasconcentrated and purified on 4 g of silica gel (1 × 10-cm columnequilibrated in dichloromethane) eluting with dichloromethane:
0.095 g (95% theoretical yield) of [19F]-2-deoxy-2-fluoro-1,3,5-tri-O-benzoyl-α-D-arabinofuranose (product 1) was obtained.Spectral data were in agreement with the published data (1): 1HNMR (500 MHz, CDCl3) δ 8.04 [multiplet (m), 6H (Hydrogen)],7.58 (m, 3H), 7.41 (m, 6H), 6.75 [doublet (d), J-coupling constant(J) = 9.1 Hz, 1H], 5.62 [doublet of doublets (dd), J = 19.5, 3.2 Hz,1H], 5.38 (d, J = 48.2 Hz, 1H), 4.77 (m, 1H), 4.73 (dd, J = 12.0,3.7 Hz, 1H), and 4.70 (dd, J = 12.0, 4.7 Hz, 1H); 13C NMR (100MHz, CDCl3) δ 166.2, 165.4, 164.5, 133.9, 133.8, 133.2, 130.0,129.9, 129.6, 129.1, 128.7, 128.6, 128.5, 128.4, 99.5, 99.2, 97.7,96.2, 84.0, 76.9, 76.6, and 63.6; and 19F NMR (282 MHz, CDCl3)δ −190.8; high-resolution mass spectrometry (HRMS) m/z [TOFMS positive electrospray (ES+)] calculated for C26H21FO7 (M +Na+) = 487.1169 and found 487.0402.[19F]-2-deoxy-2-fluoro-D-arabinose ([19F]DFA; product 2) was
obtained by the reaction of 0.01 g (0.021 mmol) of product 1 with1 mL of NaOMe (0.3 M in methanol) at 30 °C for 60 min, withsubsequent neutralization with Amberlyst-15 resin (The DowChemical Company) and lyophilization of the filtrate. The 1/1.5 =α/β mixture was assigned according to the published infor-mation (2): 1H NMR (300 MHz, CD3OD) δ 5.22 (triplet, J =4.0 Hz, 1H, β-H1), 4.62 [doublet of doublets of doublets (ddd),J = 50.2, 8.9, 3.4 Hz, 1H, α-H2], 4.56 (dd, J = 12.0, 4.7 Hz, 2H),4.32 (ddd, J = 51.5, 8.9, 7.3 Hz, 1H, β-H2), and 4.00 to 3.53 (m, 8H,α/β − H3, H4, H5, H5′); 19F NMR (282 MHz, CD3OD) δ −194.3,−204.2, −208.0, −210.3; and HRMS m/z (TOF MS ES+) calculatedfor C5H8FO4 (M + 3H+) = 155.0720 and found 155.0195. In-terestingly, NMR, including 19F, indicates that DFA is a mixture ofmostly pyranose α and β anomers (88%) and a minority of furanoseanomers (11%).
[18F]DFA synthesis. The [18F]DFA synthetic approach was inspired byprevious syntheses of fluorinated nucleoside analogs, such as [18F]-2′-deoxy-2′-fluoro-5-methyl-1-β-D-arabinofuranosyluracil and[18F]-2′-deoxy-2′-fluoro-5-iodo-1-β-D-arabinofuranosyluracil (3).The synthesis of [18F]DFA was performed using two semi-automated, stand-alone modular units (4). No carrier-added [18F]fluoride was produced in an RDS-111 cyclotron from [18O]H2O(98% isotopic purity; Rotem, Inc.) in a silver target. Aqueous [18F]fluoride ion (100 μL) was treated with a solution of K2CO3 (1.5mg) dissolved in 14 μL of H2O and Kryptofix K222 (Sigma-Aldrich; 10 mg) dissolved in 950 μL of anhydrous acetonitrile andthen mixed. The mixture was heated at 118 °C and evaporatedunder a nitrogen flow with four 0.5-mL additions of anhydrousacetonitrile to complete the azeotropic drying. To the dry complex,10 mg of sugar precursor 2-O-(trifluoromethylsulfonyl)-1,3,5-tri-O-benzoyl-α-D-ribofuranose (Advanced Biochemical Compounds)was added, and the reaction mixture was heated at 155 °C for15 min under sealed conditions. After the fluorination wascomplete and the solution cooled to 40 °C, the protected [18F]
Clark et al. www.pnas.org/cgi/content/short/1410326111 1 of 11
DFA was loaded onto a tC18 Sep-Pak cartridge and rinsed with 2mL of H2O. This H2O was discarded. After drying the cartridge,1 mL of NaOH (2N) was added and the cartridge was allowed tostand for 3 min at RT. The product was then eluted with 2 mL ofH2O and loaded on a KT-100 cartridge. The [18F]DFA was fi-nally eluted off from the cartridge system with sterile injectable18-mΩ H2O, the pH was adjusted to 7, and the solution wassterilized by passing through a 0.22-μm filter.The radiochemical purity was determined by radio-TLC and
analytical HPLC, and it was judged to be 99 ± 0% pure. Theradio-TLC stationary phase is TLC-silica gel, and the mobilephase is acetonitrile/H2O (95:5 vol/vol). The Rf of [
18F]DFA isabout 0.5. High-performance anion exchange chromatography(HPAEC), in combination with a pulsed amperometric de-tector (electrochemical detector, ED50A; Dionex) and a gammadetector (model 105 S; Carroll and Ramsey Associates) using a50-μL loop with a CarboPac PA1 column (Dionex; 4 × 250 mm),was used with a flow rate of 1 mL/min of 0.15 M NaOH. Analysiswas performed using PeakSimple software.[18F]-L-2-deoxy-2-fluoroarabinose synthesis. [18F]-L-2-deoxy-2-fluo-roarabinose was prepared and characterized in the same manneras [18F]DFA, except that 2-O-(trifluoromethylsulfonyl)-1,3,5-tri-O-benzoyl-α-L-ribofuranose (Advanced Biochemical Compounds)was used in the synthesis instead of 2-O-(trifluoromethylsulfonyl)-1,3,5-tri-O-benzoyl-α-D-ribofuranose.[18F]DFA characterization. [18F]DFA was compared with the [19F]DFA standard on the HPAEC system described above. The [18F]DFA and [19F]DFA standard coinjection produced a single peakon the gamma detector at 4.5 min that coeluted with the onepredominant peak on the electrochemical detector.[18F]DFA plasma stability test. Blood (∼1 mL total) was collectedfrom eight mice in EDTA-containing blood collection tubes(Capiject; Terumo) and centrifuged (15 min, 3,000 × g, 4 °C).The supernatant was collected as plasma. Plasma (500 μL) wascombined with [18F]DFA (300 μL, 600 μCi). An aliquot (50 μL)of this solution was injected into the HPAEC system describedabove to provide the “0-min” time point. The remaining samplewas incubated for 2 h at 37 °C, after which an additional aliquot(50 μL) was injected into the HPAEC system described above toprovide the “2-h” time point.[18F]DFA specific activity. [18F]DFA specific activity was determinedby first creating a standard curve plotting moles of DFA vs.signal in the HPAEC system described above. [18F]DFA aliquotswith known amounts of radioactivity were injected into the sameHPAEC system, and the amount of DFA was determined fromthe standard curve. From these values, the specific activity wascalculated.[18F]-2-fluoro-2-deoxyglucose was obtained from the UCLA
Department of Nuclear Medicine.Mice. All mouse studies were performed according to theguidelines of the UCLA Animal Research Committee. FemaleC57BL/6 mice (8–12 wk old) were used for all experiments, ex-cept where noted otherwise. Male C57BL/6 mice aged 12–13 wkwere used for the streptozotocin (STZ) experiments. Female ob/obmice were obtained from The Jackson Laboratory (stock no.000632) or were from the Tontonoz laboratory (UCLA). FemaleAgouti mice (stock no. 002468) and male diet-induced obesitymice (stock nos. 380050 and 380056) were obtained from TheJackson Laboratory. The ob/ob mice were imaged at 8–12 wk ofage. Agouti and diet-induced obesity mice were imaged at 22–24wk of age.Micro-PET/computed tomography imaging. Mice were anesthetizedwith 2% (vol/vol) isoflurane and injected i.v. with ∼100 μCi of thePET probe. For static scans, 50 min after each injection, a 10-min computed tomography (CT) scan was taken on a micro-CATII CT scanner (Siemens), followed by a 10-min PET scan on anInveon micro-PET scanner (Siemens). For dynamic scans, micewere injected with [18F]DFA and immediately PET-scanned. Scans
were performed for the next 3 h, after which a 10-min CT scan wastaken. The mice were kept under 2% (vol/vol) isoflurane for theentire experiment. PET images were reconstructed using fil-tered-back projection. PET/CT images were coregistered, aspreviously described (5). All images, except for those in Fig. 2H,are coronal sections. Images in Fig. 2H are transverse sections.Quantification of PET/CT images. PET images were analyzed withAMIDE software (6). To determine the percentage of injecteddose per gram in each organ, the total activity in a 2-mm3 or3-mm3 box was measured and divided by the entire activity in themouse (after subtracting any activity that remained in the tail).This value was then scaled to report values per gram of tissue.For the liver, the box was drawn in the upper right corner of theleft lobe. All images were quantified by an individual unaware ofthe treatment group.Autoradiography.Mice were anesthetized and injected with 2 μCi of[14C]ribose (Moravek Biochemicals) in 200 μL of sterile saline.After 1 h, the mice were killed and embedded in a 3% (wt/vol)solution of carboxymethylcellulose and then frozen in a dry ice-methanol bath. Images were taken with a digital camera, and 100-μm sections were cut with a Leica cryostat. Sections were dehy-drated overnight and exposed to a Fujifilm imaging plate fora week. The Fujifilm cassettes were imaged on a Fuji BAS imager.Ex vivo biodistribution. Mice were anesthetized and injected with2 μCi of [14C]ribose or 100 μCi of [18F]DFA in 200 μL of sterilesaline. After 1 h, the animals were killed and tissues were re-moved, placed in preweighed scintillation vials, and reweighed.For the [14C]-containing samples, the tissues were dissolved in2 mL of Solvable (Perkin–Elmer) with overnight heating andmixing at 50 °C. H2O2 [30% (wt/wt) in H2O] was added drop-wise until the samples were clear in color, 10 mL of scintillationfluid (OptiPhase Supermix Mixture; Perkin–Elmer) was added,and the radioactive content was measured by liquid scintillation.In the case of the [18F]-containing samples, tissues were imme-diately analyzed on a gamma counter.Hepatocyte, stellate cell, Kupffer cell, and endothelial cell isolations.Hepatocytes, stellate cells, Kupffer cells, and endothelial cellswere isolated as previously described (7–9).Coinjection studies. [18F]DFA was combined with 50 μL of 500 mMribose, and the solution was injected into mice. After 1 h, theanimals were imaged with micro-PET/CT, as described above.Ribose transporter studies. Human ribokinase (RBKS) and a GFPfusion of mouse Slc2a2 or human RBKS and a control vector weretransfected into 293T cells with Lipofectamine 2000 (Invitrogen)following the manufacturer’s protocol. Two to three days later,the medium was replaced with glucose-free DMEM supple-mented with 10% (vol/vol) FBS, glutamine, and penicillin/strep-tomycin. The cells were lifted from the plate with titration;counted; pelleted at 524 × g for 5 min; and resuspended in glu-cose-free DMEM supplemented with 10% (vol/vol) FBS, gluta-mine, and penicillin/streptomycin to a final concentration of500,000 cells per milliliter. Cells (100 μL) were plated in a 96-wellvacuum manifold filter plate and allowed to incubate at 37 °C in5% (vol/vol) CO2 for 4 h. [3H]ribose or [3H]glucose (MoravekBiochemicals) was diluted at a dose of 1 μCi into 50 μL of mediaand added to each well. The cells were incubated at 37 °C in 5%(vol/vol) CO2 for 1 h and then washed six times with warm media.The plates were dried, and the activity in each well was measuredby scintillation counting.To determine the subcellular localization of the Slc2a2-GFP
fusion, transfected 293T cells were grown on Millicell EZ slides(Millipore), stainedwithDAPI, and imaged by confocalmicroscopy.Ribose transporter kinetics. Cells were prepared as described abovefor the ribose transporter studies. [3H]ribose (1 μCi) was dilutedinto 50 μL of 100 mM, 10 mM, 1 mM, 100 μM, 10 μM, 1 μM, or100 nM ribose in media and added to separate wells. The cellswere incubated at 37 °C in 5% (vol/vol) CO2 for 10 min, after
Clark et al. www.pnas.org/cgi/content/short/1410326111 2 of 11

which they were washed six times with warm media. The plateswere dried, and the activity in each well was measured with liquidscintillation counting. The apparent K0.5 value was determinedusing Graphpad Prism.RBKS and Slc2a2 mRNA levels.RNA was obtained frommouse tissuesor isolated liver cell preparations using an RNEasy Mini Kit(Qiagen) following the manufacturer’s protocol. cDNA wasprepared with SuperScript III First-Strand Synthesis SuperMixfor qRT-PCR (Invitrogen) following the manufacturer’s pro-tocol. Quantitative reverse transcription (qRT)-PCR was per-formed with MESA FAST qPCR MasterMix Plus for SYBRAssay No Rox (Eurogentec) following the manufacturer’s protocol.Actin was used as a control for the mouse tissues, and GAPDHwas used as a control for the isolated liver cells. qRT-PCR pri-mers for Slc2a2, ribokinase (RBKS), and actin were from Sigma.qRT-PCR primers for GAPDH were from Operon. The qRT-PCR primer sequences are as follows: actin forward, GATG-TATGAAGGCTTTGGTC; actin reverse, TGTGCACTTTTAT-TGGTCTC; GAPDH forward, TGTTCCTACCCCCAATGTGT;GAPDH reverse, GGTCCTCAGTGTAGCCCAAG; RBKS for-ward, GAATATCATCGTCATAGTGGC; RBKS reverse, GAA-CAAGGTTTTCACTCCAC; Slc2a2 forward, TTGTGCTGCTG-GATAAATTC; and Slc2a2 reverse, AAATTCAGCAACCAT-GAACC.Combined LC/tandem MS. Using a modification of a previously de-scribed method (10), samples were injected (typically 20 μL forthe in vitro assays and 2–8 μL for the in vivo metabolite analyses)onto a reverse-phase HPLC column (4 μM, 80 Å, 150 × 2.0 mm,Synergi Hydro-RP; Phenomenex) equilibrated in solvent A(10 mM tributylamine, 15 mM AcOH in H2O) and eluted (0.2mL/min) with an increasing concentration of solvent B (methanol:0/0, 10/0, 30/100, 31/0, 60/0 min/% B). The effluent from thecolumn was directed to an electrospray ion source (Agilent JetStream) connected to a triple-quadrupole mass spectrometer(Agilent 6460) operating in the negative ion tandem MS (MS/MS)multiple reaction monitoring (MRM) mode, in which the intensityof specific parent-to-fragment ion transitions (ribose-5-phosphate:229.01/139, 229.01/97, 229.01/79 eluting at ∼14.7 min; DFA-5-phosphate: 231.01/139, 231.01/97, 231.01/79, eluting at ∼19.4 min;sedoheptulose-7-phosphate: 289.03/199, 289.03/139, 289.03/97,289.03/79, eluting at ∼14.7 min; 4-deoxy-4-fluorosedoheptulose-7-phosphate: 291.03/139, 291.03/97, 291.03/79, eluting at ∼16.5min; phosphoribosyl pyrophosphate: 388.94/176.9, 388.94/158.9,388.94/79, eluting at ∼23.6 min; fluoro-phosphoribosyl pyrophos-phate: 390.94/176.9, 390.94/158.9, 390.94/79; erythrose-4-phos-phate: 199/97, 199/79, eluting at ∼14.3 min) were monitored usinginstrumental conditions optimized for all available standards (ri-bose-5-phosphate, sedoheptulose-7-phosphate, and phosphoribosylpyrophosphate).Ribose-5-phosphate and DFA-5-phosphate were quantified by
measuring the area under the curve for the 229/79 and 231/79MRM traces, respectively. The 4-deoxy-4-fluorosedoheptulose-7-phosphate was quantified by measuring the area under the curvefor the 291/79 MRM traces (for the brain samples) and 291/97MRM traces (for all other samples).DFA transporter studies.The 293T cells were transfected with a GFPfusion of mouse Slc2a2 and human RBKS or a control vector andhuman RBKS. Cells were prepared as described above for theribose transporter studies, except that they were plated ontoa six-well plate. After the 4-h incubation in glucose-free DMEMsupplemented with 10% (vol/vol) FBS, glutamine, and penicillin/streptomycin, DFA was added to a final concentration of 500 μM.The cells were incubated for an additional 1 h at 37 °C, 5% (vol/vol) CO2. Following the incubation, the media were removed,and 250 μL of ice-cold 80% (vol/vol) methanol was added to thecells. The cells were scraped into the methanol, and the lysatewas collected. The plate was washed with an additional 100 μL ofice-cold 80% (vol/vol) methanol and combined with the first
collection. The metabolites were extracted three times in 80%(vol/vol) ice-cold methanol using centrifugation (16,000 × g, 5min, 4 °C) to pellet the insoluble material. The pooled meth-anol supernatants were dried in a vacuum centrifuge. Thesamples were resuspended in a solution (40 μL) containing 5 mMtributylamine, 7.5 mM AcOH, 1.2 mM NaCl, 31 mM KCl, 3.75mM K2HPO4 (pH 7.4), and 0.3 mM MgSO4 in H2O; they werethen centrifuged (16,000 × g for 5 min at RT), and aliquots of thesupernatant were analyzed by LC/MS/MS-MRM.
In Vitro Metabolite Analysis with Isolated Proteins. Enzyme preparation.Human cDNA sequences (Origene) were cloned into the pQE-80L vector (Qiagen). Proteins were expressed in Escherichia coliand purified with His-tag protein purification resin (Pierce) fol-lowing the manufacturer’s protocols. Protein purity was assessedby resolving 2–10 μL of each protein fraction by SDS/PAGE andstaining the gel with GelCode Blue (Pierce).RBKS reactions. The RBKS reactions contained the followingcomponents: 50 mM Tris·HCl (pH 7.8), 3 mM ATP, 100 mMKCl, 10 mM MgCl2, 5 mM ribose or DFA, and 2 μg of purifiedRBKS in a final volume of 10 μL. The reactions were incubatedat 37 °C for 1 h and analyzed by LC/MS/MS-MRM.Transketolase reactions. The transketolase reaction contained thefollowing components: 50 mM Tris·HCl (pH 7.8), 3 mM ATP,100 mM KCl, 10 mM MgCl2, 5 mM xylulose-5-phosphate, 1 mMthiamine pyrophosphate, 5 mM ribose or DFA, 2 μg of purifiedRBKS, and 2 μg of purified transketolase in a final volume of10 μL. The reactions were incubated at 37 °C for 1 h and ana-lyzed by LC/MS/MS-MRM.Transaldolase 1 reactions.The transaldolase 1 reaction contained thefollowing components: 50 mM Tris·HCl (pH 7.8), 3 mM ATP,100 mM KCl, 10 mM MgCl2, 5 mM xylulose-5-phosphate, 1 mMthiamine pyrophosphate, 5 mM ribose or DFA, 1 μg of purifiedRBKS, 1 μg of purified transketolase, and 1 μg of purifiedtransaldolase 1 in a final volume of 10 μL. The reactions wereincubated at 37 °C for 1 h and analyzed by LC/MS/MS-MRM.Ribose-5-phosphate isomerase reactions. The ribose-5-phosphateisomerase reaction contained the following components: 50 mMTris·HCl (pH 7.8), 3 mM ATP, 100 mM KCl, 10 mM MgCl2,5 mM ribose or DFA, 1 μg of purified RBKS, and 1 μg of purifiedribose-5-phosphate isomerase in a final volume of 10 μL. Thereactions were incubated at 37 °C for 1 h and analyzed by LC/MS/MS-MRM.Phosphoribosyl pyrophosphate synthetase 1 or 2 reactions. The phos-phoribosyl pyrophosphate synthetase 1 or 2 reactions containedthe following components: 50 mMTris·HCl (pH 7.8), 3 mMATP,10 mMMgCl2, 2 mM phosphoenolpyruvate, 0.014 units/μL lacticdehydrogenase, 0.01 units/μL pyruvate kinase, 5 mM ribose orDFA, and 2 μg of purified RBKS in a final volume of 10 μL. Thereactions were incubated at 37 °C for 1 h. To 8 μL of these re-actions, the following additional components were added: 3 mMATP, 50 mM NaHPO4 (pH 7.0), 1 μM DTT, and 2 μg of purifiedphosphoribosyl pyrophosphate synthetase 1 or 2 to a final vol-ume of 10 μL. The reactions were incubated at 37 °C for anadditional 1 h and analyzed by LC/MS/MS-MRM.
In vivo metabolite analysis. Mice were injected via the tail veinwith 12.5 μmol of DFA. After 30 min, 1 h, or 3 h, the mice werekilled and their organs and blood were harvested and flash-frozen. Blood was collected in EDTA-containing blood collec-tion tubes (Capiject) and centrifuged (15 min, 3,000 × g, 4 °C).The supernatant was collected as plasma, and the blood cellswere flash-frozen. While still frozen, each tissue was weighed andhomogenized in 80% (vol/vol) ice-cold methanol using centri-fugation (5,250 × g, 5 min, 4 °C) to pellet the insoluble material.The methanol supernatants were dried in a vacuum centrifuge.The samples were resuspended in a solution (40–80 μL) con-taining 5 mM tributylamine, 7.5 mM AcOH, 1.2 mM NaCl, 31mM KCl, 3.75 mM K2HPO4 (pH 7.4), and 0.3 mM MgSO4 in
Clark et al. www.pnas.org/cgi/content/short/1410326111 3 of 11

H2O and were centrifuged (16,000 × g, 5 min, RT), and aliquotsof the supernatant were analyzed by LC/MS/MS-MRM.Relative levels of ribose-5-phosphate in WT and ob/ob mice or
mice fed a 10% kcal fat diet and mice fed a 60% kcal fat diet weredetermined by measuring the area under the curve for the 229/79MRM trace in the liver and heart metabolite extracts. Thesevalues were then divided by the respective weight of each organ.
Immunoblotting. The 293T cells were homogenized in ice-coldradioimmunoprecipitation buffer containing Complete ProteaseInhibitor Mixture (2×; Roche), Phosphatase Inhibitor 2 (1×;Sigma), and Phosphatase Inhibitor 3 (1×; Sigma). Protein con-centrations were determined by a BCA protein assay (Pierce).Thirty micrograms of each tissue was resolved by SDS/PAGE andtransferred onto a nitrocellular membrane. The membrane wasblocked in 5% (wt/vol) milk/PBS-Tween 20 for 1 h at RT andthen blotted with one of the following antibodies overnight at4 °C: ERK1/2 (1:2,000, L34F12; Cell Signaling) or GFP (1:5,000,prepared in the laboratory of O.N.W.). Following primary antibodyincubation, HRP-conjugated secondary antibodies (1:10,000)were added for 1 h at RT, chemiluminescence reagents wereadded for 5 min at RT, and the blot was exposed to film (Kodak).
STZ treatments.Mice were fasted overnight and treated with STZ(200 mg/kg, freshly dissolved in 100 mM citrate buffer, pH 4.5)through an i.p. injection. On the fifth day, insulin levels weremeasured from the serum with a Rat/Mouse Insulin ELISA kit(Millipore) following the manufacturer’s protocol. On the seventhday, the mice were PET/CT-imaged with [18F]DFA, and their bloodglucose levels were measured using a Lifescan OneTouch Ul-tra Blood Glucose Monitoring System (Fisher Scientific).
Serum ribose concentrations. Blood (200 μL) was collected fromWT and ob/ob mice via retroorbital bleeding in gel barrier bloodcollection tubes (Capiject) and centrifuged (15 min, 16,000 × g,4 °C), and 75 μL of supernatant was retained in microcentrifugetubes. Aqueous ribose standards (75 μL of 0.5, 1, 4, and 8 ng/μL)were similarly prepared in duplicate. [13C]Ribose (10 μL of
10 ng/μL in water; Omicron Biochemicals, Inc.) was added toeach sample and standard, and all were treated with 255 μL ofmethanol, followed by centrifugation (15 min, 16,000 × g, 4 °C).The supernatant was transferred to glass gas chromatographyinjector vials, dried in a vacuum concentrator overnight, re-suspended in 100 μL of acetonitrile, dried again in a vacuumconcentrator for 1 h, resuspended in 100 μL of benzene, anddried again for 1 h. The samples were then treated with 100 μLof 2% methoxyamine (wt/vol) in anhydrous pyridine (60 °C, 1 h),dried as above for 1 h, and then treated with 50 μL of N,O-Bis(trimethylsilyl)trifluoroacetamide + 10% (vol/vol) trimethyl-chlorosilane (Thermo Scientific; 60 °C, 1 h). The derivatizedsamples were placed in an autosampler (Agilent 7683 series),and 1 μL of each was injected (splitless mode) into a bonded-phase nonpolar fused silica capillary column (ZB-5; Phenom-enex; phenyl/dimethylpolysiloxane 5/95, 60 m × 0.25 mm, 0.10-μm film thickness, 250 °C injector port) and eluted (constantflow, 1 mL/min) with ultrahigh-purity helium (6890A GC system;Agilent Technologies) with a linear temperature gradient (min/°C:0′/50, 3′/50, 53′/300, 63′/300). The end of the column (GC/electron impact (EI)-MS transfer line at 250 °C) was directlyinserted into the EI source (180 °C, 70 eV) of a TOF massspectrometer (Waters GCT; calibrated with perfluorotributyl-amine immediately before the analysis of each batch of samples)scanning from m/z 40–650 [0.9 s per scan at a resolution(FWHM) of 7,000, lock-mass from column bleed at 207.0329 −C5H15Si3O3] with a 15-min solvent delay. Data were collectedand analyzed with instrument manufacturer-supplied software(MassLynx, version 4.1). From the reconstructed ion traces form/z 307 and m/z 310, the peak areas for ribose and 13C-ribose(coeluting at 35.35 min), respectively, were integrated. Ribose areaswere normalized to 13C-ribose, a standard curve of peak area ratiosvs. standard ribose concentration was plotted, and serum riboseconcentrations were interpolated from this standard curve.
1. Tann CH, Brodfuehrer PR, Brundidge SP, Sapino C, Howell HG (1985) Fluorocarbohydratesin synthesis—An efficient synthesis of 1-(2-deoxy-2-fluoro-beta-deuterium-arabino-furanosyl)-5-iodouracil (beta-FIAU) and 1-(2-deoxy-2-fluoro-beta-deuterium-arabino-furanosyl)thymine (beta-FMAU). J Org Chem 50(19):3644–3647.
2. Bols M, Lundt I (1990) Preparation of 2,3-epoxyaldonolactones and their conversioninto 2-fluoro-2-deoxy-aldonolactones and 2-fluoro-2-deoxy-sugars. Acta Chem Scand44:252–256.
3. Mangner TJ, Klecker RW, Anderson L, Shields AF (2003) Synthesis of 2′-deoxy-2′-[18F]fluoro-beta-D-arabinofuranosyl nucleosides, [18F]FAU, [18F]FMAU, [18F]FBAU and[18F]FIAU, as potential PET agents for imaging cellular proliferation. Synthesis of[18F]labelled FAU, FMAU, FBAU, FIAU. Nucl Med Biol 30(3):215–224.
4. Amaraesekera B, et al. (2013) High-pressure, compact, modular radiosynthesizer forproduction of positron emitting biomarkers. Appl Radiat Isot 78:88–101.
5. Chow PL, Stout DB, Komisopoulou E, Chatziioannou AF (2006) A method of imageregistration for small animal, multi-modality imaging. Phys Med Biol 51(2):379–390.
6. Loening AM, Gambhir SS (2001) AMIDE: A completely free system for medicalimaging data analysis. J Nucl Med 42(5):192P–192P.
7. Zhang Y, Castellani LW, Sinal CJ, Gonzalez FJ, Edwards PA (2004) Peroxisomeproliferator-activated receptor-gamma coactivator 1alpha (PGC-1alpha) regulatestriglyceride metabolism by activation of the nuclear receptor FXR. Genes Dev 18(2):157–169.
8. Beaven SW, et al. (2011) Liver X receptor signaling is a determinant of stellate cellactivation and susceptibility to fibrotic liver disease. Gastroenterology 140(3):1052–1062.
9. Hansen B, Arteta B, Smedsrød B (2002) The physiological scavenger receptor functionof hepatic sinusoidal endothelial and Kupffer cells is independent of scavengerreceptor class A type I and II. Mol Cell Biochem 240(1-2):1–8.
10. Luo B, Groenke K, Takors R, Wandrey C, Oldiges M (2007) Simultaneousdetermination of multiple intracellular metabolites in glycolysis, pentose phosphatepathway and tricarboxylic acid cycle by liquid chromatography-mass spectrometry. JChromatogr A 1147(2):153–164.
Clark et al. www.pnas.org/cgi/content/short/1410326111 4 of 11

105 kDa
78 kDa
TKT
38 kDa
28 kDa
RBKS
62 kDa
49 kDa
RPIA
38 kDa
28 kDa
PRPS1 PRPS2
38 kDa
28 kDa49 kDa
39 kDa
TALDO1
Fig. S1. Coomassie stain of proteins isolated and expressed in E. coli. PRPS1, phosphoribosyl pyrophosphate synthetase 1; PRPS2, phosphoribosyl pyro-phosphate synthetase 2; RBKS, ribokinase; RPIA, ribose-5-phosphate isomerase; TALDO1, transaldolase 1; TKT, transketolase.
Clark et al. www.pnas.org/cgi/content/short/1410326111 5 of 11
RBKS O
OHOH
OP
OH
Ribose-5-phosphate
Ribose
O
OHOH
HO
OH
Time (min)
Sig
nal
Ribose-5-phosphate MRM trace(m/z 229 (M H) -> m/z 79)
HO
O
OH
OH
OH
OH
OP
Sedoheptulose-7-phosphate
TKTO
OHOH
OP
OH
Ribose-5-phosphate
Sig
nal
Time (min)
Sedoheptulose-7-phosphate MRM trace(m/z 289 (M H) -> m/z 79)
HO
OH
OH
OH
OP
HO
O
OH
OH
OH
OH
OP
Sedoheptulose-7-phosphate
TALDO1
Erythrose-4-phosphate
Sig
nal
Time (min)
Erythrose-4-phosphate MRM trace(m/z 199 (M H) -> m/z 79)
Ribose-5-phosphate
O
OHOH
OP
OH RPIA
Ribulose-5-phosphate
OH
O
OH
OHOP
Time (min)
Ribulose-5-phosphate
Ribose-5-phosphate
Sig
nal
Ribose-5-phosphate / Ribulose-5-phosphate MRM trace
(m/z 229 (M H) -> m/z 79)
Ribose-5-phosphate
O
OHOH
OP
OH O
OHOH
OP
O P O P
Phosphoribosyl pyrophosphate
PRPS1
Sig
nal
Time (min)
Phosphoribosyl pyrophosphate MRM trace(m/z 388.9 (M H) -> m/z 158.9)
O
OHOH
OP
O P O P
Phosphoribosyl pyrophosphate
O
OHOH
OP
OH
Ribose-5-phosphate
PRPS2
Sig
nal
Time (min)
Phosphoribosyl pyrophosphate MRM trace(m/z 388.9 (M H) -> m/z 158.9)
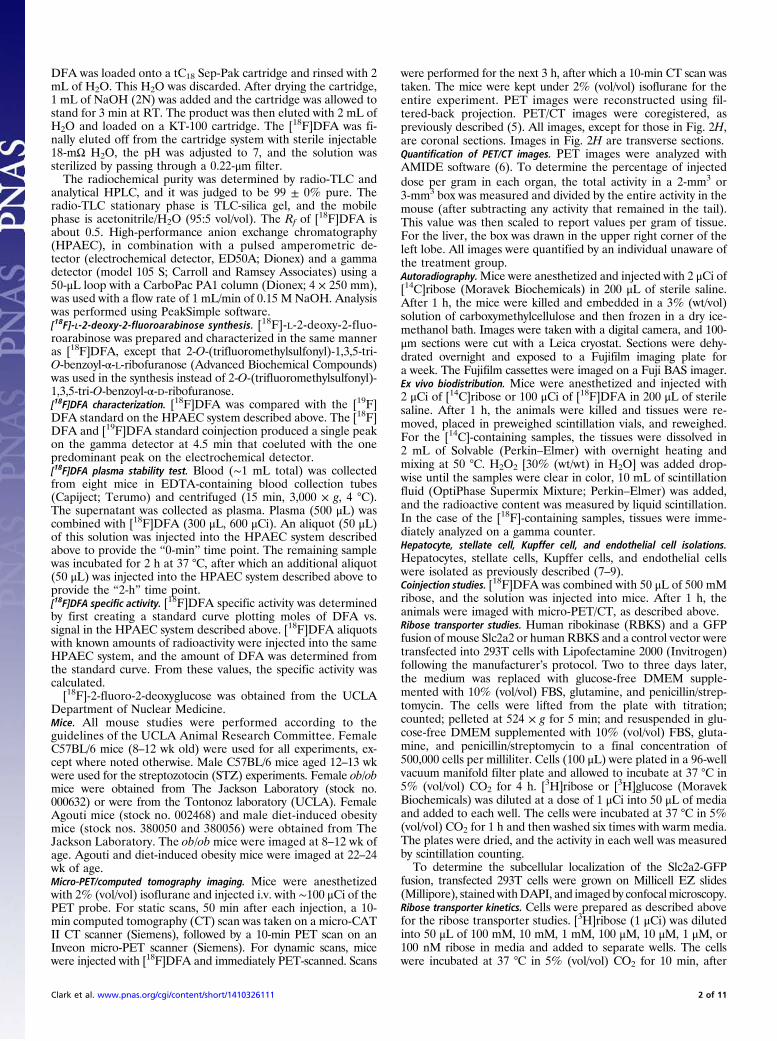
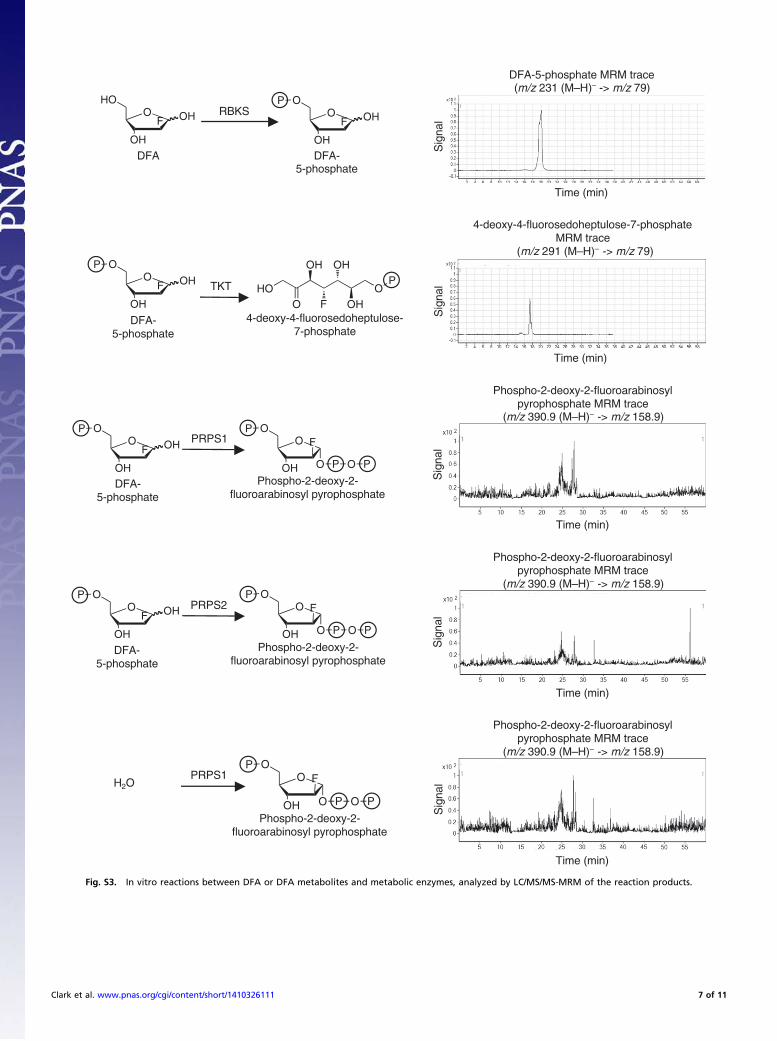
Fig. S2. In vitro reactions between ribose or ribose metabolites and metabolic enzymes, analyzed by LC/MS/MS-MRM of the reaction products.
Clark et al. www.pnas.org/cgi/content/short/1410326111 6 of 11
Time (min)
DFA-5-phosphate
O
OH
F
O
OH
PO
OH
F
HO
OH
DFA
RBKS
Sig
nal
DFA-5-phosphate MRM trace(m/z 231 (M H) -> m/z 79)
7-phosphate
HOO
OH
F
OH
OH
OP
DFA-5-phosphate
O
OH
F
O
OH
P
TKT
Time (min)
Sig
nal
MRM trace(m/z 291 (M H) -> m/z 79)
PRPS1
Phospho-2-deoxy-2-
O
OH
O
O P O P
FP
DFA-5-phosphate
O
OH
F
O
OH
P
Time (min)
Sig
nal
pyrophosphate MRM trace(m/z 390.9 (M H) -> m/z 158.9)
PRPS2
Phospho-2-deoxy-2-
O
OH
O
O P O P
FP
DFA-5-phosphate
O
OH
F
O
OH
P
Time (min)
Sig
nal
pyrophosphate MRM trace(m/z 390.9 (M H) -> m/z 158.9)
PRPS1
Phospho-2-deoxy-2-
O
OH
O
O P O P
FP
H2O
Time (min)
Sig
nal
pyrophosphate MRM trace(m/z 390.9 (M H) -> m/z 158.9)
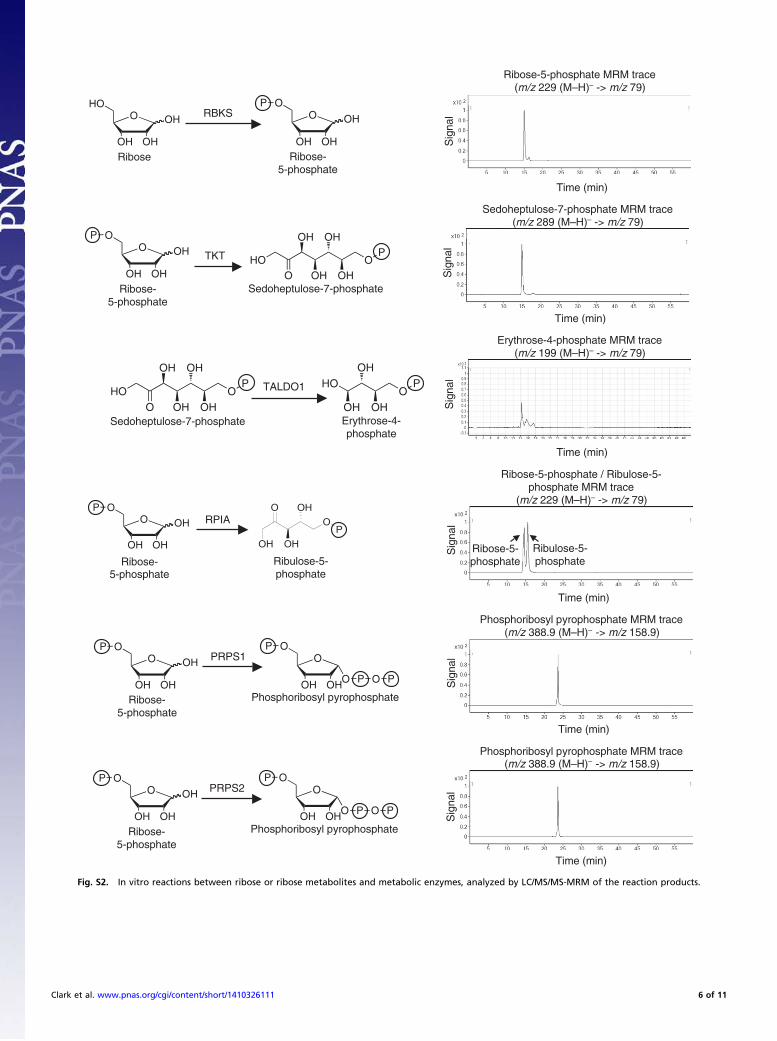
Fig. S3. In vitro reactions between DFA or DFA metabolites and metabolic enzymes, analyzed by LC/MS/MS-MRM of the reaction products.
Clark et al. www.pnas.org/cgi/content/short/1410326111 7 of 11
Brain, 60 minutes post DFA injection
Brain, 60 minutes post saline injection
Brain, 60 minutes post DFA injection
Brain, 60 minutes post saline injection
MRM traces MRM traces
Heart, 60 minutes post DFA injection
Heart, 60 minutes post saline injection
Heart, 60 minutes post DFA injection
Heart, 60 minutes post saline injection
Intestines, 60 minutes post DFA injection
Intestines, 60 minutes post saline injection
Intestines, 60 minutes post DFA injection
Intestines, 60 minutes post saline injection
Sig
nal
Sig
nal
Sig
nal
Sig
nal
Sig
nal
Sig
nal
Sig
nal
Sig
nal
Sig
nal
Sig
nal
Sig
nal
Sig
nal
Time (min) Time (min)
Time (min) Time (min)
Time (min) Time (min)
Spleen, 60 minutes post DFA injection
Spleen, 60 minutes post saline injection
Spleen, 60 minutes post DFA injection
Spleen, 60 minutes post saline injectionS
igna
lS
igna
l
Sig
nal
Sig
nal
Time (min) Time (min)
Fig. S4. (Continued)
Clark et al. www.pnas.org/cgi/content/short/1410326111 8 of 11
Blood cells, 60 minutes post DFA injection
Blood cells, 60 minutes post saline injection
Blood cells, 60 minutes post DFA injection
Blood cells, 60 minutes post saline injection
Sig
nal
Sig
nal
Sig
nal
Sig
nal
Time (min) Time (min)
Kidney, 60 minutes post DFA injection
Kidney, 60 minutes post saline injection
Kidney, 60 minutes post DFA injection
Kidney, 60 minutes post saline injection
Sig
nal
Sig
nal
Sig
nal
Sig
nal
Time (min) Time (min)
Liver, 60 minutes post DFA injection
Liver, 60 minutes post saline injection
Liver, 60 minutes post DFA injection
Liver, 60 minutes post saline injection
Sig
nal
Sig
nal
Sig
nal
Sig
nal
Time (min) Time (min)
Muscle, 60 minutes post DFA injection
Muscle, 60 minutes post saline injection
Muscle, 60 minutes post DFA injection
Muscle, 60 minutes post saline injection
Sig
nal
Sig
nal
Sig
nal
Sig
nal
Time (min) Time (min)
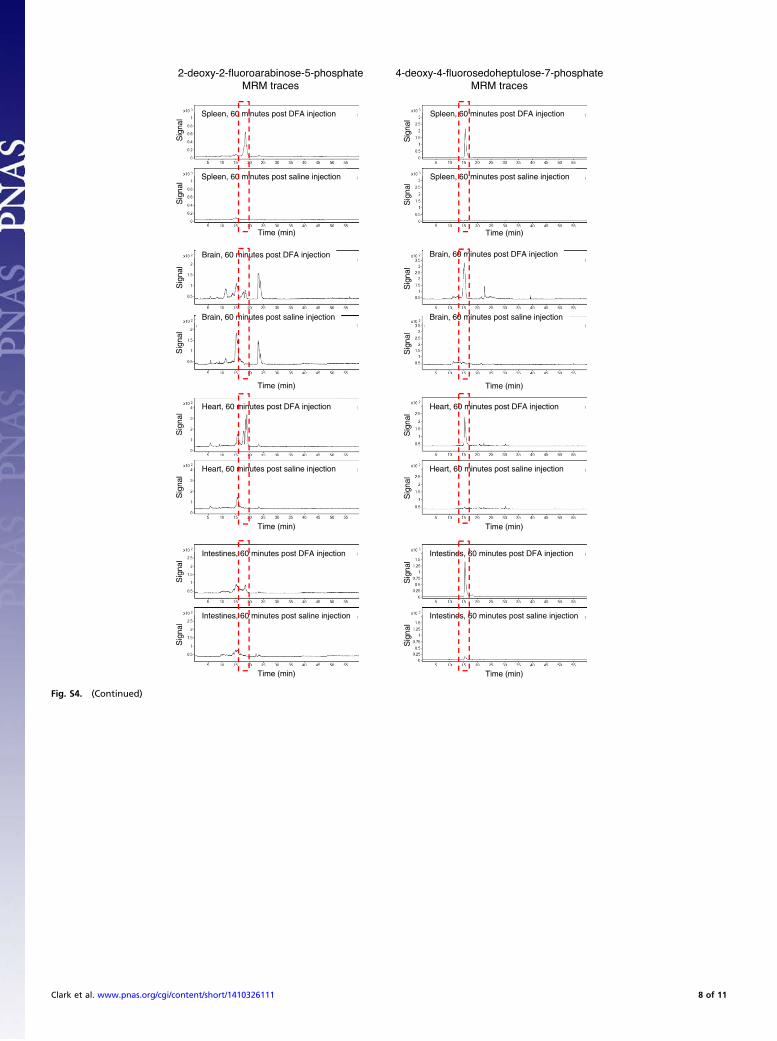
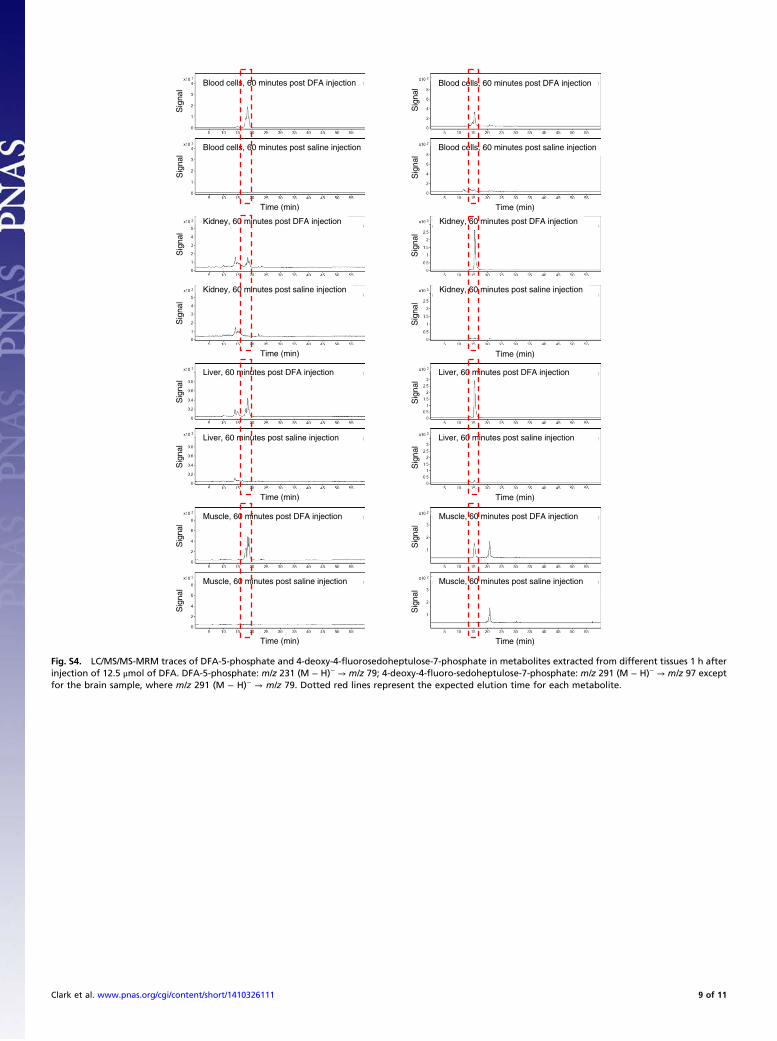
Fig. S4. LC/MS/MS-MRM traces of DFA-5-phosphate and 4-deoxy-4-fluorosedoheptulose-7-phosphate in metabolites extracted from different tissues 1 h afterinjection of 12.5 μmol of DFA. DFA-5-phosphate: m/z 231 (M − H)− → m/z 79; 4-deoxy-4-fluoro-sedoheptulose-7-phosphate: m/z 291 (M − H)− → m/z 97 exceptfor the brain sample, where m/z 291 (M − H)− → m/z 79. Dotted red lines represent the expected elution time for each metabolite.
Clark et al. www.pnas.org/cgi/content/short/1410326111 9 of 11

kinetics phosphate kinetics
Brain
0
0.5
1.0
1.5
2.0
2.5
3.0
3.5
0 20 40 60 80 100 120 140 160 180 200
Time (min)
AU
C/m
g
05
101520253035404550
0 20 40 60 80 100 120 140 160 180 200
Time (min)
AU
C/m
g
020406080
100120140160180
0 20 40 60 80 100 120 140 160 180 200
Time (min)
AU
C/m
g
Intestines
0
80
160
240
320
400
480
0 20 40 60 80 100 120 140 160 180 200Time (min)
AU
C/m
g
Kidneys
080
160240320400480560640720
0 20 40 60 80 100 120 140 160 180 200
Time (min)
AU
C/m
g
0
400
800
1200
1600
2000
2400
2800
3200
0 20 40 60 80 100 120 140 160 180 200
Time (min)
AU
C/m
g
Liver
Time (min)
0
40
80
120
160
200
240
280
0 20 40 60 80 100 120 140 160 180 200
AU
C/m
g
0
200
400
600
800
1000
1200
0 20 40 60 80 100 120 140 160 180 200
Time (min)
AU
C/m
g
Muscle
0
50
100
150
200
250
0 20 40 60 80 100 120 140 160 180 200
Time (min)
AU
C/m
g
0
5
10
15
20
25
30
35
0 20 40 60 80 100 120 140 160 180 200Time (min)
AU
C/m
g
Heart
0102030405060708090
0 20 40 60 80 100 120 140 160 180 200
Time (min)
AU
C/m
g
020406080
100120140160180200
0 20 40 60 80 100 120 140 160 180 200
AU
C/m
g
Time (min)
Fig. S5. (Continued)
Clark et al. www.pnas.org/cgi/content/short/1410326111 10 of 11

0
200
400
600
800
1000
1200
0 20 40 60 80 100 120 140 160 180 200Time (min)
AU
C/m
g
Spleen
0
400
800
1200
1600
2000
2400
0 20 40 60 80 100 120 140 160 180 200
Time (min)
AU
C/m
g
Bloodcells
0
500
1000
1500
2000
2500
3000
3500
0 20 40 60 80 100 120 140 160 180 200
AU
C/m
icro
L
0
50
100
150
200
250
0 20 40 60 80 100 120 140 160 180 200
Time (min)
AU
C/m
icro
L
kinetics phosphate kinetics
Time (min)
Fig. S5. Quantification of LC/MS/MS-MRM traces of DFA-5-phosphate and 4-deoxy-4-fluorosedoheptulose-7-phosphate in metabolites extracted from dif-ferent tissues 30 min, 1 h, and 3 h after injection of 12.5 μmol of DFA. The values have been corrected for tissue weight and LC injection volume. AUC, areaunder the curve.
Clark et al. www.pnas.org/cgi/content/short/1410326111 11 of 11