supporting information - pnas€¦ · supporting information ... (primer prtyw422 and prtyw423) ......
TRANSCRIPT
Supporting InformationAnders et al. 10.1073/pnas.1115858109SI Materials and MethodsGeneration of Phylogenetic Tree. All of the glycosyltransferase(GT) 61 coding nucleotide and amino acid sequences present inPhytozome v7.0 (www.phytozome.net) were taken for the fol-lowing fully sequenced organisms: Selaginella moellendorffii,Physcomitrella patens, Arabidopsis thaliana, Populus trichocarpa,Oryza sativa, and Sorghum bicolor. Proteins were identified asGT61 family by being in PFAM PF04577 or having KEGG Or-tholog identifier K03714, which gave the same set of Arabidopsisproteins listed as GT61s at CAZy [www.cazy.org; (1)]. Togetherwith coding regions of the wheat sequences TaXAT1 and TaX-AT2 sequenced here, amino acid sequences were aligned usingthree multiple sequence alignment (MSA) methods, namelyMuscle (2), MAFFT (3), and ClustalW (4). The MSA having thebest identity score was first identified and then automaticallytrimmed using the software trimAL (5) (default “automated”setting). The resulting amino acid MSA was then back-translatedcodon-by-codon to form a nucleotide MSA and used to carry outa statistical selection of nucleotide substitution models withjMODELTEST (6). The best substitution model found accord-ing to the Akaike Information Criterion criterion was the GTR+G+I. A phylogenetic reconstruction has been conducted usingthe suite of software BEAST (7). First, a parameter file with theGTR+G+I model, an uncorrelated relaxed clock (mean fixed to1.0) and a birth-death prior was set up. This parameter file wasthen passed to BEAST and three runs were performed (eachMarkov-chain Monte Carlo chain was 50-million steps long andwas sampled every 5,000 steps). After we checked the mixing andthe convergence of the chains with Tracer (6), an estimate of thephylogenetic tree was obtained using the consensus method inTreeAnnotator (6) (using burn-in fixed to 10%, maximum cladecredibility and mean node heights). An unrooted version of theresulting consensus tree, with branch length in units of sub-stitutions per site, is shown in Fig. S1A.
Plant Material and Growth Conditions. Wheat plants were grownin temperature-controlled glasshouse rooms, as previously de-scribed (8).Arabidopsis seeds were surfaced-sterilized and then sown on
solid medium [0.5× Murashige and Skoog salts, 1% sucrose (wt/vol), pH 5.8] and, if applicable, selected by addition of 15 μg/mLof hygromycin or 30 μg/mL of phosphinothricin. After stratifica-tion for 48 h, plates were transferred to the growth room (20 °C,16-h light/8-h dark) and after 1–2 wk the seedlings were trans-ferred to soil.The Fox line for OsXAT2 (LOC_Os02g22480, K36913) and for
OsXAT3 (LOC_Os03g37010, K06419) were developed by theRice Genome Project of the National Institute of AgrobiologicalSciences and provided by the Rice Genome Resource Center,Japan (9).
Construct Preparation and Generation of Transgenic Material. TheTaXAT1 (TaGT61_1) and TaXAT2 (TaGT61_2) full-lengthcDNAs were cloned from wheat var. Cadenza endosperm cDNAusing primer pairs GT61-1F1, GT61-1R1 and GT61-2F3, GT61-2R, respectively (Table S3) cloned into pGem-T Easy system(Promega) and sequenced (European Molecular Biology Labo-ratory accession nos. FR873610.1, FR846232.1). Two variants(putative homeologues from the three genomes of hexaploidwheat) of each sequence were also found in this cDNA sample,these variants had >96% nucleotide identity to TaXAT1 orTaXAT2. The TaXAT2 coding sequence was fused in frame to
the 5′ end of GFP5 in pVKH18-En6 as described in ref. 10, usingprimer GT61-2XbaF and GT61-2SalR (Table S3) to introduceunique XbaI and SalI restriction sites at the 5′ and 3′ end, re-spectively. The resulting TaXAT2-GFP construct was used fortransient expression in tobacco.The TaXAT1 RNAi construct with the starchy endosperm-
specific HMW1Dx5 promoter was created as described in ref. 8,except that here the target fragment 235–729 bp of the 1,521-bpTaXAT1 sequence was used. This fragment has identicalstretches of >130 bp with the two variants of TaXAT1, but thelongest stretch of identity with any TaXAT2 transcript is 16 bp;thus, it would be expected to suppress all forms of TaXAT1 andhave no effect on TaXAT2. Wheat plants were transformed andzygosity was determined in T1 seeds as previously described (8).Five independently transformed plants carrying the RNAitransgene were identified by PCR and homozygous and azygous(null segregants, used as within-line controls) T1 progeny wereidentified by quantitative PCR. These five plants were the onlylines identified which had both homozygous and azygous progenyand there was no selection of lines by phenotype. T2 plants weregrown in a complete four-block statistical design with four rep-licate pots per line (four plants per pot) and one pot per block.Mature T3 seeds were harvested and pooled together for eachpot to give 10 g of seeds for each of the four biological replicatesamples per line. The moisture of the samples was measuredusing a near-infrared spectroscopy (NIRFlex N-500; BÜCHI)and adjusted to 15%. These seed samples were milled in a MicroScale LabMill (FQC-2000; Metefém Szövetkezet) and passedthrough 250-μm and 150-μm sieves to give pure white flour fromthe starchy endosperm.The pIRX9::TaXAT2-myc construct used for stable trans-
formation of Arabidopsis consists of the PCR-amplified 1923bp5′ intergenic genomic region of IRX9 (At2g37090; primer KpnIAt2g37090 and ApaI At2g37090) (Table S3). The fragment wascloned into pGreen [BASTA resistance (BAR)] with KpnI andApaI restrictions sites. A 1,500-bp 3′ intergenic genomic regionof IRX9 was amplified using primer SmaI At2g37090 and NotIAt2g37090 (Table S3) and then cloned in via SmaI and NotIrestriction sites. The PCR-amplified wheat cDNA of TaXAT2without stop codon (primer ApaI TaXAT2 and SmaI XhoITaXAT2) (Table S3) was inserted using ApaI and SmaI re-striction sites, adding a XhoI restriction site with the antisenseprimer. A 3× Myc tag was then inserted via the XhoI restrictionsite. The complete modified area was sequenced and the vectortransformed into Arabidopsis wild-type (ecotype: Columbia) andgux1-2 gux2-1 (gux) double-mutants (At3g18660, SALK_063763;At4g33330, GABI_722F09) (11) using the floral dipping tech-nique (12). At least three independent transgenic lines wereanalyzed and data of a representative line are shown.
Quantitative RT-PCR of TaXAT Transcripts in Wheat Endosperm. De-veloping T3 seeds were harvested at 17 d post anthesis and purestarchy endosperm from the central 16 grains was dissected usinga razor blade, snap-frozen in liquid nitrogen, and lyophilized.Following homogenization in a TissueLizer (Qiagen), total RNAwas isolated according to ref. 13, and adjusted to microfuge scale.cDNA synthesis and qRT-PCR was performed as described inref. 14 with the exception of using the Invitrogen PlatinumGreen qPCR SuperMix-UDG (www.invitrogen.com). Expressionof endogenous TaXAT1 was determined with a 139-bp amplicon(primers prTYW13 and prTYW14) (Table S3) and TaXAT2expression was determined with a 100bp amplicon (primers
Anders et al. www.pnas.org/cgi/content/short/1115858109 1 of 10

prTYW412 and prTYW413) (Table S3). (These primers are alldesigned to regions of TaXAT1 and TaXAT2, which are identicalin the three forms found and will therefore determine totaltranscript abundance for all forms.) Three reference genes wereused to normalize expression: Ta2526, a stably expressed ESTfrom grain (primer prTYW19 and TYW20) (Table S3), GAPDH(primer prTYW422 and prTYW423) (Table S3), and Succinatedehydrogenase (SDH, primer prTYW424 and prTYW425) (TableS3). Data were analyzed according to ref. 15. Because theTaXAT1 and TaXAT2 amplicons are of similar length, located atsimilar positions from the 3′ end of the respective target tran-scripts, and show almost identical individual PCR efficiencies(1.89 and 1.88), they can be used to compare expression ofTaXAT1 and TaXAT2 in the same sample. This process was donefor azygous controls, and ratio of expression values in transgenicsamples relative to their azygous control samples for each ofTaXAT1 and TaXAT2 also determined.
Transient Expression of Proteins in Tobacco and Confocal Analysis.TaXAT2-GFP was transformed into Agrobacterium tumefaciens(GV3101) to transform the lower epidermal surface of Nicotianatabacum, as previously decribed (16). The GONST1-YFP con-struct (17) was coinfiltrated. Confocal imaging was performedusing an inverted laser scanning microscope (Zeis LSM510META) with a 63× oil immersion objective. For imaging ex-pression of GFP and YFP, excitation lines of an argon ion laserof 458 nm for GFP and 514 nm for YFP with a 475/525-nm band-pass filter for GFP and a 530/600-nm band-pass filter for YFPwere used alternately with line-switching, using the multitrackfacilities of the microscope. Appropriate controls were performedto exclude any cross-talk and bleed-through of fluorescence.
Protein Extraction and Western Blotting. Basal inflorescence stemmaterial from 5- to 6-wk-old plants was ground in 1× Laemmli-buffer (60 mM Tris/HCl pH6.8, 2% (wt/vol) SDS, 10% (vol/vol)Glycerin, 0.01% Bromophenol Blue, 1.5% (vol/vol) β-Mercap-toethanol), boiled for 3 min, and centrifuged to remove celldebris. SDS/PAGE and protein gel blotting were performed aspreviously described (18). Antibody dilutions were: c-Myc (A14)antibody (Santa Cruz), 1:1,000, goat anti-rabbit antibody con-jugated to horseradish peroxidase (Bio-Rad), 1:5,000. Detectionwas performed with the Amersham ECL Plus Western BlottingDetection System (GE Healthcare).
Analysis of Arabinoxylan and (1,3);(1,4)-β-Glucan by High-PerformanceAnion-Exchange Chromatography. Analysis of endosperm arabi-noxylan (AX) and (1,3);(1,4)-β-glucan by digestion with endo-xylanase (Xylanase M1; Megazyme) and lichenase (Megazyme)followed by high-performance anion-exchange ehromatography(HPAEC) of resultant oligosaccharides was as described in ref.8, with the exception that the column used was Carbopac PA-1(Dionex) with dimensions 2 mm × 250 mm and the flow rate was0.25 mL/min. Peaks were identified from the retention times ofreference compounds established during the development ofthis technique (19, 20). Resulting peak areas are a measure ofabundance per unit dry weight for a specific oligosaccharide.Each of the four biological replicates was analyzed in threetechnical repeats. ANOVA was applied to oligosaccharideabundances, taking account of the randomized block design andbiological and technical replication. The Cadenza wild-type linewas included, giving an overall control plus five-by-two factorialtreatment structure. Main effects of transgene (n, azygous nullcontrol; H, homozygous transgenic), line (1–5) and interactionwere tested. (Tables S1 and S2). To summarize the effect of thetransgene over all lines (Fig. 1A), ratios of mean oligosaccharideabundance in transgenic samples to that in their azygous con-trols were averaged across all lines.
1H-NMR Analyses of Wheat Endosperm. Nonstarch polysaccharidefrom transgenic and azygous control endosperm (white flour)samples was prepared as previously described (21) and suspendedin D2O [containing 0.01% (wt/vol) d4-TSP] at a concentration of1 mg/mL. NMR spectra were recorded at 70 °C on a BrukerDPX 400 spectrometer (Bruker Biospin) using 512 scans of 64 Kdatapoints over a sweep width of 24 ppm, the residual waterpeak was suppressed by presaturation. AX peak assignmentswere based on (22, 23): H1 Araf δ peaks at 5.39 ppm for Arafα-(1,3)–linked to monosubstituted nonterminal Xylp and 5.28ppm and 5.21 ppm for Araf α-(1,3)–linked and α-(1,2)–linked todi-substituted nonterminal Xylp, respectively. [The last valuetakes account of a change of −0.02 ppm from references abovefor instrument conditions used here (24)]. Arabinogalactanpeptide (AGP) H1 Araf peak at 5.25 assignment is based on ref.25 and confirmed under these conditions by spiking samples withAGP preparations (26). Transgenic sample and azygous controlfrom two independent lines were analyzed and spectra froma representative line (line 3) are shown.
Preparation of Alcohol-Insoluble Residue. Basal inflorescence stemsfrom 5-to 6-wk-old plants were boiled for 30 min at 70 °C in 96%(vol/vol) ethanol and homogenized using a ball mixer (GlenCreston). The pellet was successively washed with 100% (vol/vol)ethanol, chloroform:methanol 2:3 (twice), 65% (vol/vol), 80%(vol/vol), and 100% ethanol and then air-dried.
Enzyme Hydrolysis and Analysis of Oligosaccharides by PolysaccharideAnalysis by Carbohydrate Gel Electrophoresis. One hundred mi-crograms of alcohol-insoluble residue (AIR) was treated with 4MNaOH for 1 h, and neutralized with HCl. Xylan was digestedin 0.1 M ammonium acetate buffer (pH 5.5) overnight at roomtemperature with excess of enzyme to ensure complete digestion.Enzymes used were: endo-xylanase GH11, NpXyn11A from Ne-ocallimastix patriciarum (27) and α-arabinofuranosidase GH62,Abf62A from Pseudomonas cellulosa (28), both kind gifts fromH. Gilbert (Newcastle University, Newcastle upon Tyne, UnitedKingdom). Xylan standards (X)1–6 were purchased from Mega-zyme. After digestion, samples were lyophilized in a centrifugalvacuum evaporator, labeled with 8-aminonaphthalene-1,3,6-tri-sulfonic acid (ANTS) and 2% of starting material analyzed byPAGE, as previously described (29). ANTS-signals were visual-ized using a Genebox (Syngene) equipped with a transilluminatorwith long-wave tubes emitting at 365 nm and a short-pass (500–600 nm) filter.
Arabidopsis AIR Fractionation and Analysis by NMR. AIR (200 mg)was chemically fractionated according to ref. 30, and the 1 MKOH (xylan-rich) fraction lyophilised following extensive dialysisagainst water. The 1 M KOH fraction or wheat arabinoxylan (10mg) was digested with endoxylanase GH11, as described above.Samples were lyophilised, resuspended in D2O (700 μL; 99.9%purity; Cambridge Isotope Labs) and transferred to a 5-mmNMR tube. NMR spectra were recorded at 298 K with a BrukerDRX spectrometer operating at 500 MHz equipped with a TXIprobe. Chemical shifts were measured relative to internal ace-tone at δ= 2.225 ppm. Two-dimensional NOESY, TOCSY, and13C-HSQC were recorded using established methods (31); themixing times were 70 ms and 200 ms for the TOCSY and NO-ESY, respectively. Data were processed using the Azara suite ofprograms (v. 2.8, copyright 1993–2011, Wayne Boucher andDepartment of Biochemistry, University of Cambridge, UnitedKingdom) and chemical-shift assignment was performed usingAnalysis v2.1 (32). Assignment of Araf substituents was assistedby the endoxylanase GH11 digested wheat arabinoxylan sample,and published chemical-shift data (23).
Anders et al. www.pnas.org/cgi/content/short/1115858109 2 of 10

1. Cantarel BL, et al. (2009) The carbohydrate-active enzymes database (CAZy): Anexpert resource for Glycogenomics. Nucleic Acids Res 37(Database issue):D233–D238.
2. Edgar RC (2004) MUSCLE: Multiple sequence alignment with high accuracy and highthroughput. Nucleic Acids Res 32:1792–1797.
3. Katoh K, Misawa K, Kuma K, Miyata T (2002) MAFFT: A novel method for rapidmultiple sequence alignment based on fast Fourier transform. Nucleic Acids Res 30:3059–3066.
4. Thompson JD, Higgins DG, Gibson TJ (1994) CLUSTAL W: Improving the sensitivity ofprogressive multiple sequence alignment through sequence weighting, position-specific gap penalties and weight matrix choice. Nucleic Acids Res 22:4673–4680.
5. Capella-Gutiérrez S, Silla-Martínez JM, Gabaldón T (2009) trimAl: A tool for automatedalignment trimming in large-scale phylogenetic analyses. Bioinformatics 25:1972–1973.
6. Posada D (2008) jModelTest: Phylogenetic model averaging.Mol Biol Evol 25:1253–1256.7. Drummond AJ, Rambaut A (2007) BEAST: Bayesian evolutionary analysis by sampling
trees. BMC Evol Biol 7:214.8. Nemeth C, et al. (2010) Down-regulation of the CSLF6 gene results in decreased (1,3;
1,4)-beta-D-glucan in endosperm of wheat. Plant Physiol 152:1209–1218.9. Kondou Y, et al. (2009) Systematic approaches to using the FOX hunting system to
identify useful rice genes. Plant J 57:883–894.10. Dunkley TPJ, et al. (2006) Mapping the Arabidopsis organelle proteome. Proc Natl
Acad Sci USA 103:6518–6523.11. Mortimer JC, et al. (2010) Absence of branches from xylan in gux mutants reveals
potential for simplification of lignocellulosic biomass. Proc Natl Acad Sci USA 107:17409–17414.
12. Clough SJ, Bent AF (1998) Floral dip: A simplified method for Agrobacterium-mediated transformation of Arabidopsis thaliana. Plant J 16:735–743.
13. Chang S, Puryear J, Cairney J (1993) A simple and efficient method for isolating RNAfrom pine trees. Plant Mol Biol Rep 11:113–116.
14. Pellny TK, et al. (2008) Mitochondrial respiratory pathways modulate Arabidopsisnitrate sensing and nitrogen-dependent regulation of plant architecture in Nicotianasylvestris. Plant J 54:976–992.
15. Rieu I, Powers SJ (2009) Real-time quantitative RT-PCR: Design, calculations, andstatistics. Plant Cell 21:1031–1033.
16. Brandizzi F, Snapp EL, Roberts AG, Lippincott-Schwartz J, Hawes C (2002) Membraneprotein transport between the endoplasmic reticulum and the Golgi in tobacco leavesis energy dependent but cytoskeleton independent: Evidence from selectivephotobleaching. Plant Cell 14:1293–1309.
17. Baldwin TC, Handford MG, Yuseff MI, Orellana A, Dupree P (2001) Identification andcharacterization of GONST1, a golgi-localized GDP-mannose transporter in Arabidopsis.Plant Cell 13:2283–2295.
18. Lauber MH, et al. (1997) The Arabidopsis KNOLLE protein is a cytokinesis-specificsyntaxin. J Cell Biol 139:1485–1493.
19. Ordaz-Ortiz JJ, Devaux MF, Saulnier L (2005) Classification of wheat varieties based onstructural features of arabinoxylans as revealed by endoxylanase treatment of flourand grain. J Agric Food Chem 53:8349–8356.
20. Saulnier L, et al. (2009) Wheat endosperm cell walls: Spatial heterogeneity ofpolysaccharide structure and composition using micro-scale enzymatic fingerprintingand FT-IR microspectroscopy. J Cereal Sci 50:312–317.
21. Englyst HN, Quigley ME, Hudson GJ (1994) Determination of dietary fibre as non-starch polysaccharides with gas-liquid chromatographic, high-performance liquidchromatographic or spectrophotometric measurement of constituent sugars. Analyst(Lond) 119:1497–1509.
22. Hoffmann RA, Geijtenbeek T, Kamerling JP, Vliegenthart JF (1992) 1H-N.m.r. study ofenzymically generated wheat-endosperm arabinoxylan oligosaccharides: Structuresof hepta- to tetradeca-saccharides containing two or three branched xylose residues.Carbohydr Res 223:19–44.
23. Gruppen H, et al. (1992) Characterisation by 1H NMR spectroscopy of enzymicallyderived oligosaccharides from alkali-extractable wheat-flour arabinoxylan.Carbohydr Res 233:45–64.
24. Toole GA, et al. (2010) Temporal and spatial changes in cell wall composition indeveloping grains of wheat cv. Hereward. Planta 232:677–689.
25. Loosveld AMA, Grobet PJ, Delcour JA (1997) Contents and structural features ofwater-extractable arabinogalactan in wheat flour fractions. J Agric Food Chem 45:1998–2002.
26. Tryfona T, et al. (2010) Carbohydrate structural analysis of wheat flour arabinogalactanprotein. Carbohydr Res 345:2648–2656.
27. Vardakou M, et al. (2008) Understanding the structural basis for substrate andinhibitor recognition in eukaryotic GH11 xylanases. J Mol Biol 375:1293–1305.
28. Beylot MH, McKie VA, Voragen AG, Doeswijk-Voragen CH, Gilbert HJ (2001) ThePseudomonas cellulosa glycoside hydrolase family 51 arabinofuranosidase exhibitswide substrate specificity. Biochem J 358:607–614.
29. Goubet F, Jackson P, Deery MJ, Dupree P (2002) Polysaccharide analysis using carbo-hydrate gel electrophoresis: A method to study plant cell wall polysaccharides andpolysaccharide hydrolases. Anal Biochem 300:53–68.
30. Brown DM, et al. (2007) Comparison of five xylan synthesis mutants reveals newinsight into the mechanisms of xylan synthesis. Plant J 52:1154–1168.
31. Cavanagh J, Fairbrother WJ, Palmer AG, Skelton NJ (1996) Protein NMR Spectroscopy:Principles and Practice (Academic Press, San Diego, CA).
32. Vranken WF, et al. (2005) The CCPN data model for NMR spectroscopy: Developmentof a software pipeline. Proteins 59:687–696.
Anders et al. www.pnas.org/cgi/content/short/1115858109 3 of 10
0.2
e
*
At2g
0336
0
At3g18170
Os0
2g04
250
Sb03g007920
Sb10
g029
380
Smo11902
Os10g35020
Os04g12010
Os1
2g13
640Sb10g020470
Sb03g046290
Sb02g041650Sb
03g0
0801
0 Os01g331370Sb10g020460
Pp1s269_6
Pop
tr_0
010s
1696
0
Sb10g002800
At3g
1032
0 Sm
o85736
Sb04g035100
Sb0
3g00
7900
Sb03g
0080
20
Sb03g007910
Pp1s41_12
Pop
tr_0
010s
1695
0
Popt
r_00
16s0
5740
Sb03g007950O
s01g02920
Os01g02900
Poptr_0015s04170
Sb04g000840
Os08g39380
OsXAT3
Poptr_0012s04840
Os11g36700At2g41640
Sb01g025290
Sb03g007960
Poptr_0001s37150
Sb03g042820
Os06g20570Sb09g019360
Poptr_0233s00200
Sb10g029360
Os0
2g22
650
OsXAT2
Sb03g008000At3g18180
Sb10g020480
Sb04g013150
Os01g02940
At3g57380P
optr
_000
8s09
220
Os01g02910
Os0
2g22
190
Os06g49300
Sb03g009110
Sb10g018270
Sb07g028020
Os01g72610
Smo168165
Sb10g018300
Os05g32540Po
ptr_
0006
s047
10
Sb0
4g02
850
Os0
6g49
320
TaXAT1
Os06g28124
TaXAT2
Pp1s330_2
Sm
o86384
At2
g033
70
Os02g22380
Os07g46380
Sb0
4g02
0210
AtXYLT
Sb03g007370
Sm
o426574
Poptr_0015s04180
Os06g27560
Os01g02930
Clade C
Clad B
Clade A
***
*
A
B
TaXAT2-GFP GONST1-YFP composite
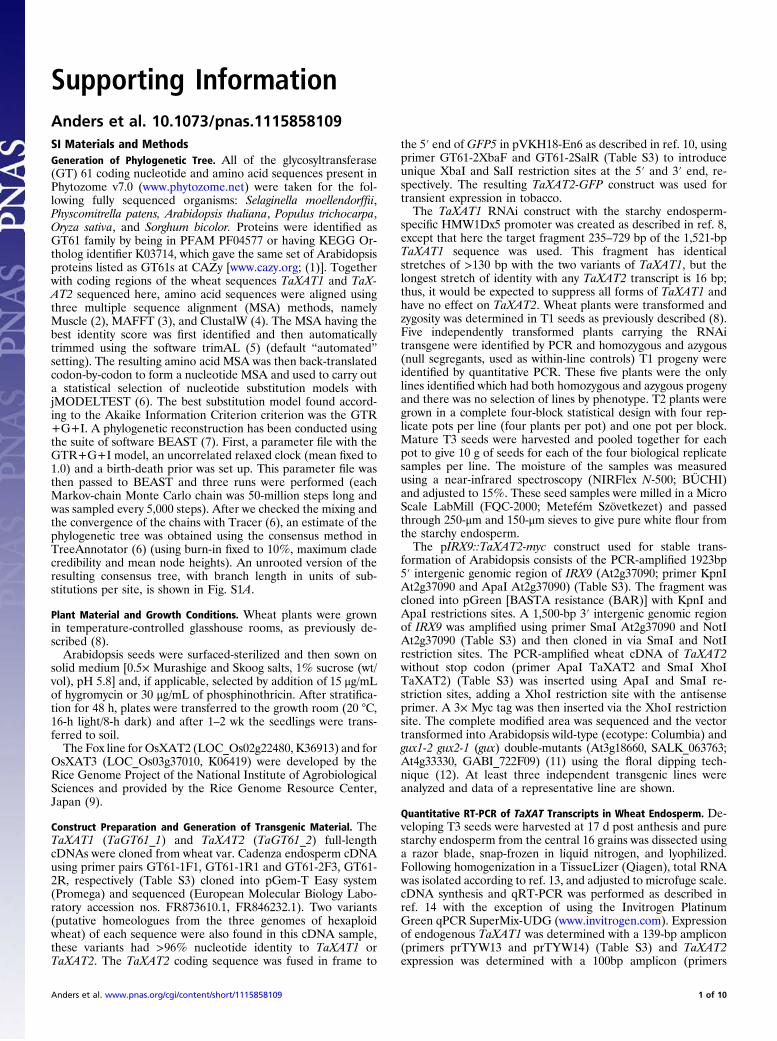
Fig. S1. Phylogenetic tree of GT61 family and subcellular localization of xylan arabinosyltransferases (XAT) protein. (A) Phlyogenetic tree. Lower plants arerepresented by S. moellendorffii (dark red) and P. patens (orange); monocots by O. sativa (dark green), S. bicolor (light green), and the two wheat genesTaXAT1 and TaXAT2 (black); and dicots by A. thaliana (dark blue) and P. trichocarpa (light blue). Asterisks mark proteins studied in this report. Note: Proteins ofClade A and B contain the DUF563 domain (PFAM family PF04577), which is not present in proteins of Clade C. (B) Confocal analysis of TaXAT2-GFP (green),Golgi-marker GONST-YFP (red) in tobacco epidermal cells, and overlay of both (yellow).
0.4
0.5
0.6TaXAT1TaXAT2
0.6
0.8
1
1.5
2
geni
c/co
ntro
l Expressiontrsio
nin
cont
rols
TaXAT1
BTaXAT2
CA
0.1
0.2
0.3
0.2
0.4
0.6
0.5
1
Expr
essio
ntr
ansg
ransgenic/controive
Gene
Expr
es
0
Line 1 Line 2 Line 3 Line 4 Line 50
Line 1 Line 2 Line 3 Line 4 Line 50
Line 1 Line 2 Line 3 Line 4 Line 5
E
olRe
lat
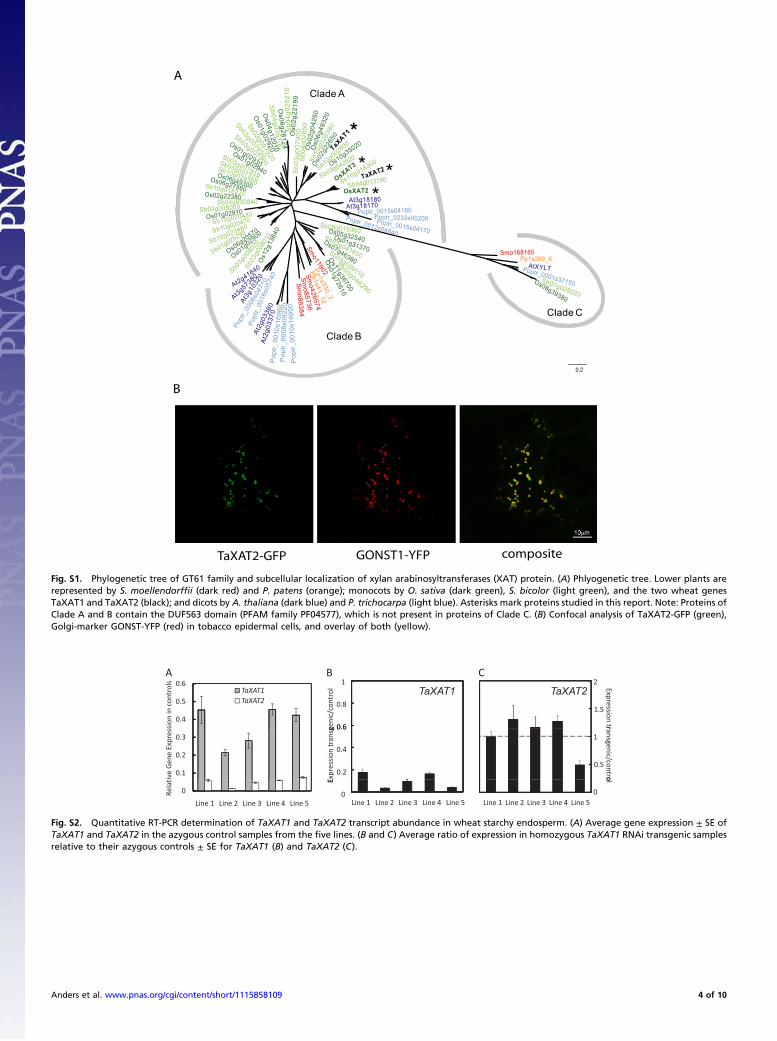
Fig. S2. Quantitative RT-PCR determination of TaXAT1 and TaXAT2 transcript abundance in wheat starchy endosperm. (A) Average gene expression ± SE ofTaXAT1 and TaXAT2 in the azygous control samples from the five lines. (B and C) Average ratio of expression in homozygous TaXAT1 RNAi transgenic samplesrelative to their azygous controls ± SE for TaXAT1 (B) and TaXAT2 (C).
Anders et al. www.pnas.org/cgi/content/short/1115858109 4 of 10

XA3XXDP5
XA2+3XXDP6
XA3A3XXDP7
XA3XA3XXDP8
XA3A2+3XXDP8
XA3XA2+3XXDP9
XU4m2XXA3XXDP9
XU(4m)2XXDP5
O
OH
OH
OOOHO
OH
OOOH
O
OH
OH OH
OOH3CO/HO
OH
OH
COOH
OH
OOOO
OH
OH
OH
OOOH
OH
O
OH
OH
HO
HO OH
O
HOCH2
O
HO
OOOO
OH
OH
OH
OOOH
O
O
OH
OHHO OH
HOCH2O
HO
HO
O
HOCH2
O
HO
HO
OOOO
OH
OH
OH
OOOH
OH
O
OH
OHO
OH
OOH
OH
O
HOCH2
O
HO
O
HOCH2
O
HO
HO HO
OOOO
OH
OH
OH
OOOH
OH
O
OH
OH
OO
OH
OOOH
OHOOOO
OH
OH
OH
OOOH
OH
O
OH
OH
OO
OH
OOOH
OH
OHOH
HO
O
HOCH2
O
HO
HO O
HOCH2
O
HO
HO
OOO
OH
OH
OH
OOOH
O
O
HO
OH
HOCH2O
HO
HO
O
OH
OHO
OH
OOH
O
HOCH2
O
HO
HO O
HOCH2
O
HO
HO
OOOO
OH
OH
OH
OOOH
O
O
OH
OHOH
HOCH2
O
HO
HO
O
OH
OHO
OH
OOH
O
O
HOCH2
O
HO
HO O
HOCH2
O
HO
HO
OOOO
OH
OH
OH
OOOH
OH
O
OH
OH
OOOHO
OH
OOOH
O
OH
OH OH
OOH3CO
OH
OH
COOH
OHOOOO
OH
OH
OH
OOOH
OH
O
OH
OH
OOOHO
OH
OOOH
O
OH
OH OH
OOH3CO
OH
OH
COOH
OH
O
HOCH2
O
HO
HO
Fig. S3. Nomenclature and structure of substituted xylan oligosaccharides described in this article. The nomenclature used is the one-letter code systemproposed by Faure et al. (1), in which the side chains Araf (A) or (4-O-methyl-) glucuronic acid [U(4m)] replace the Xylp (X) of the backbone. Superscript numbersfollowing the letter of a side chain indicate the linkage position. The degree of polymerization (DP) is given.
1. Faure R, et al. (2009) A brief and informationally rich naming system for oligosaccharide motifs of heteroxylans found in plant cell walls. Aust J Chem 62:533–537.
Anders et al. www.pnas.org/cgi/content/short/1115858109 5 of 10

TaXAT2C 1 2 3
68kDa
3xmyc
TaXAT2
A
B
5.205.255.305.355.401H (ppm)
4.05
4.10
4.15
108.0
109.0
110.0
1 H (p
pm)
13C
(ppm
)
*
TOCSY
13C HSQC
A3-Xmono A3-Xdi
A2-Xdi
A3-Xmono
A3-Xdi
A2-Xdi
A3-XmonoA3-XdiA2-Xdi
C
Fig. S4. Expression of wheat TaXAT2-myc in Arabidopsis and NMR analyses of resulting xylan. (A) Overview of the pIRX9::TaXAT2-myc construct. The blackbox indicates the translated region with a 3× Myc tag translationally fused to the 3′ end of the ORF of TaXAT2. Light gray boxes (UTRs) and white boxes(intergenic regions) are genomic up- and downstream regions of IRX9 (At2g37090), arrow indicates the promoter. (B) Western blot analysis using a Myc-antibody of three independent TaXAT2 transgenic lines in wild-type (1 and 3) and gux background (2). Molecular size of TaXAT2-Myc is 68 kDa. C, Control,nontransgenic Arabidopsis material. (C) NMR spectra of xylan oligosaccharides. Digested xylan derived from the 1 M KOH AIR fraction of Arabidopsis ex-pressing TaXAT2 in a gux background (red) showing the presence of xylan monosubstituted with α-Araf (A3-Xmono); a peak at 5.39 ppm (marked with anasterisk) was identified and assigned as the H1 resonance of α-Araf (A3-Xmono). The assignment was confirmed by 2D TOCSY and 13C HSQC experiments thatcorrelate the H1 with the H2 and C1 resonances, respectively, at their known positions. α-Araf substitution is absent in gux Arabidopsis xylan prepared by thesame method (blue). Wheat arabinoxylan (black) is also shown for reference.
Anders et al. www.pnas.org/cgi/content/short/1115858109 6 of 10

Mass (m/z)150 405 660 915 1170 1425
1408.2
954.
1
1218
.0
1137
.0
294.
2
822.
2
1275
.9
690.
2
1005
.0
426.
3
741.
2
524.
347
7.2
609.
2
322.
227
1.2
454.
3
653.
2
1121
.1
920.
3
1049
.1
Y2
Y3Y4
Y5
Y6α
Y6β
1,5X6β
E2
B5
B6
H1
Y1
B2 B3B4
W3
3,5A4
3,5A5
3,5A6G5E6
D5
Β
405 660 915 1170 1425
1408
.4
1218
.0
954.
2
1137
.0
271.
3
822.
2
294.
3
690.
3
426.
3
1276
.0
1005
.1
718.
374
1.2
1246
.3
524.
3
609.
2
850.
3
477.
3
982.
2
454.
3
551.
3
322.
3
1304
.0
1086
.1
625.
3
873.
2
1121
.1
788.
3
231.
2
150
Y1 Y2
Y4
Y5
Y6α
Y3
1,5X1
1,5X2
1,5X3
1,5X4
1,5X5
1,5X6β
1,4X6α
E2
E3
B2B3
B4B5
B6
E6
G3
G5
C1
C2
C-2
C5-2 H1
G4
E5
B1
B1α
B1β
Mass (m/z)
Y6Y6α
Y6β
1,5X6
[M + Na]+
O O O O O OHO
O
O
O O O O OHO
HO OH HO
O
HO OH OH
O
OH HO OH
O
HO OH
HO OH
HO
HOH2C
HO
COOH
HN
HO O
OH
H3CO
H3CO
Y1Y2Y3
Y6α
Y4Y5Y6
Y6β
1,5X11,5X2
1,5X31,5X4
1,5X51,5X6
B1B2
B3 B4 B5 B6
B1α
B1β
G3
D5
XU4m2XXA3XX-2-AA
[M + Na]+
O O O O O OHO
O
O
O O O O OHO
HO OH HO
O
HO OH OH
O
OH HO OH
O
HO OH
HO OH
HO
HOH2C
HO
COOH
HN
HO O
OH Y1Y2Y3
Y6α
Y4Y5Y6
Y6β
1,5X11,5X2
1,5X31,5X4
1,5X51,5X6
B1B2
B3 B4 B5 B6
G3
D5
XU4m2XXA3XX-2-AA
1,5X11,5X2
G3
718.
31,5X3
850.
31,5X4
873.
1D5
982.
1
1,5X5 Y6Y6α
1304
.0
1,4X6α1,5X6
C
*+Arafase
TaXAT2 wt
B
A
D
*OsXAT2 wt
*OsXAT3 wt
+Arafase +Arafase
A
Fig. S5. Characterization of the XAT-dependent arabinofuranosidase-sensitive xylan oligosaccharide derived from XAT transgenic plants in wildtype back-ground. (A) PACE analysis of arabinofuranosidase-sensitivity of XAT-dependent xylan oligosaccharides after xylanase digest. Xylan fingerprint of transgenicsexpressing TaXAT2, OsXAT2, or OsXAT3 is shown in comparison with the arabinofuranosidase digested material (+Arafase). Boxed area shows six-timeslonger exposure of identical gel. Asterisks mark the oligosaccharide specific for the transgenic lines. Oligosaccharide assignment is as follows. A: X, B: XX, D:XU(4m)2XX. (B and C) Structural characterization of the XAT-dependent arabinofuranosidase-sensitive xylan oligosaccharide. NP-LC–MALDI-ToF/ToF-MS/MS ofthe Pent8MeHexA XU4m2XXA3XX labeled with 2-aminobenzoic acid (2-AA) derived from (B) TaXAT2 transgenics (m/z 1408.4 [M + Na]+) and (C) OsXAT3transgenics (m/z 1408.2 [M + Na]+).
Anders et al. www.pnas.org/cgi/content/short/1115858109 7 of 10

sperm cellperipheral endospermmicropyral endospermendospermnoderoot xylem cellroot cellreplumxylemhypocotylsiliquestemstemgeneral seed coattesta (seed coat)pericyclehypocotylsteleroot hair zonestameninflorescencecell culture / primary cellseedleaf primordiaflowerpetiolepetaldeveloping meristemoid (stomatal precursor) zonepedicelcotyledonsshoot apexsepalshoot apical meristemjuvenile leafpistilcauline leafseedlingrosetteroot culturecallusstigmaradiclecorkaxillary budshoot apexadult leafsenescent leafaxillary shootimbibed seedroot phloem cellepid. atrichoblastsendodermis + cortexlateral root capendodermisroot tiprootschalazal endospermroot cortex cellabscission zonechalazal seed coatmeristematic zonesuspensorelongation zoneembryoovuleovaryguard cell protoplastprotoplastlateral rootpollen mesophyll cell protoplast
At3g18170
At3g18180
IRX3
GUX1
IRX9
IRX10
GUX2
IRX14
Fig. S6. Coexpression analysis of Arabidopsis GT61s. Hierarchical cluster of expression profiles of At3g18170 and At3g18180 along with profiles of knownsecondary cell wall genes including genes involved in glucuronoxylan (GX) biosynthesis using the Genevestigator tool (www.genevestigator.com).
Anders et al. www.pnas.org/cgi/content/short/1115858109 8 of 10
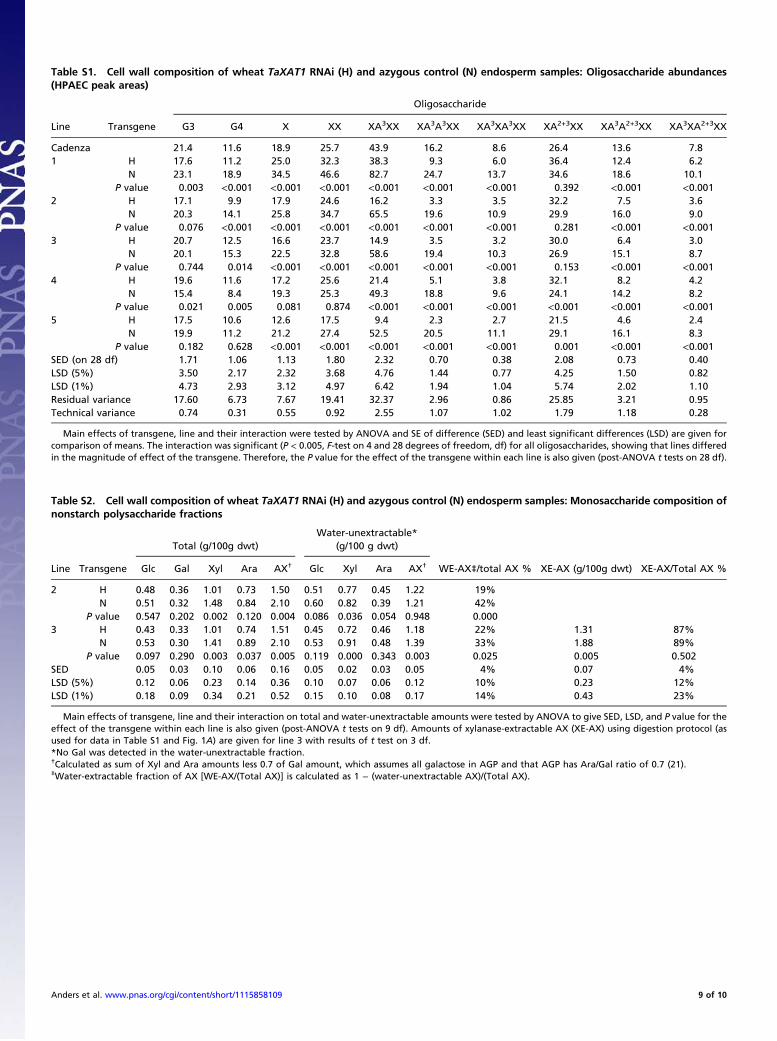
Table S1. Cell wall composition of wheat TaXAT1 RNAi (H) and azygous control (N) endosperm samples: Oligosaccharide abundances(HPAEC peak areas)
Oligosaccharide
Line Transgene G3 G4 X XX XA3XX XA3A3XX XA3XA3XX XA2+3XX XA3A2+3XX XA3XA2+3XX
Cadenza 21.4 11.6 18.9 25.7 43.9 16.2 8.6 26.4 13.6 7.81 H 17.6 11.2 25.0 32.3 38.3 9.3 6.0 36.4 12.4 6.2
N 23.1 18.9 34.5 46.6 82.7 24.7 13.7 34.6 18.6 10.1P value 0.003 <0.001 <0.001 <0.001 <0.001 <0.001 <0.001 0.392 <0.001 <0.001
2 H 17.1 9.9 17.9 24.6 16.2 3.3 3.5 32.2 7.5 3.6N 20.3 14.1 25.8 34.7 65.5 19.6 10.9 29.9 16.0 9.0
P value 0.076 <0.001 <0.001 <0.001 <0.001 <0.001 <0.001 0.281 <0.001 <0.0013 H 20.7 12.5 16.6 23.7 14.9 3.5 3.2 30.0 6.4 3.0
N 20.1 15.3 22.5 32.8 58.6 19.4 10.3 26.9 15.1 8.7P value 0.744 0.014 <0.001 <0.001 <0.001 <0.001 <0.001 0.153 <0.001 <0.001
4 H 19.6 11.6 17.2 25.6 21.4 5.1 3.8 32.1 8.2 4.2N 15.4 8.4 19.3 25.3 49.3 18.8 9.6 24.1 14.2 8.2
P value 0.021 0.005 0.081 0.874 <0.001 <0.001 <0.001 <0.001 <0.001 <0.0015 H 17.5 10.6 12.6 17.5 9.4 2.3 2.7 21.5 4.6 2.4
N 19.9 11.2 21.2 27.4 52.5 20.5 11.1 29.1 16.1 8.3P value 0.182 0.628 <0.001 <0.001 <0.001 <0.001 <0.001 0.001 <0.001 <0.001
SED (on 28 df) 1.71 1.06 1.13 1.80 2.32 0.70 0.38 2.08 0.73 0.40LSD (5%) 3.50 2.17 2.32 3.68 4.76 1.44 0.77 4.25 1.50 0.82LSD (1%) 4.73 2.93 3.12 4.97 6.42 1.94 1.04 5.74 2.02 1.10Residual variance 17.60 6.73 7.67 19.41 32.37 2.96 0.86 25.85 3.21 0.95Technical variance 0.74 0.31 0.55 0.92 2.55 1.07 1.02 1.79 1.18 0.28
Main effects of transgene, line and their interaction were tested by ANOVA and SE of difference (SED) and least significant differences (LSD) are given forcomparison of means. The interaction was significant (P < 0.005, F-test on 4 and 28 degrees of freedom, df) for all oligosaccharides, showing that lines differedin the magnitude of effect of the transgene. Therefore, the P value for the effect of the transgene within each line is also given (post-ANOVA t tests on 28 df).
Table S2. Cell wall composition of wheat TaXAT1 RNAi (H) and azygous control (N) endosperm samples: Monosaccharide composition ofnonstarch polysaccharide fractions
Total (g/100g dwt)Water-unextractable*
(g/100 g dwt)
Line Transgene Glc Gal Xyl Ara AX† Glc Xyl Ara AX† WE-AX‡/total AX % XE-AX (g/100g dwt) XE-AX/Total AX %
2 H 0.48 0.36 1.01 0.73 1.50 0.51 0.77 0.45 1.22 19%N 0.51 0.32 1.48 0.84 2.10 0.60 0.82 0.39 1.21 42%
P value 0.547 0.202 0.002 0.120 0.004 0.086 0.036 0.054 0.948 0.0003 H 0.43 0.33 1.01 0.74 1.51 0.45 0.72 0.46 1.18 22% 1.31 87%
N 0.53 0.30 1.41 0.89 2.10 0.53 0.91 0.48 1.39 33% 1.88 89%P value 0.097 0.290 0.003 0.037 0.005 0.119 0.000 0.343 0.003 0.025 0.005 0.502
SED 0.05 0.03 0.10 0.06 0.16 0.05 0.02 0.03 0.05 4% 0.07 4%LSD (5%) 0.12 0.06 0.23 0.14 0.36 0.10 0.07 0.06 0.12 10% 0.23 12%LSD (1%) 0.18 0.09 0.34 0.21 0.52 0.15 0.10 0.08 0.17 14% 0.43 23%
Main effects of transgene, line and their interaction on total and water-unextractable amounts were tested by ANOVA to give SED, LSD, and P value for theeffect of the transgene within each line is also given (post-ANOVA t tests on 9 df). Amounts of xylanase-extractable AX (XE-AX) using digestion protocol (asused for data in Table S1 and Fig. 1A) are given for line 3 with results of t test on 3 df.*No Gal was detected in the water-unextractable fraction.†Calculated as sum of Xyl and Ara amounts less 0.7 of Gal amount, which assumes all galactose in AGP and that AGP has Ara/Gal ratio of 0.7 (21).‡Water-extractable fraction of AX [WE-AX/(Total AX)] is calculated as 1 − (water-unextractable AX)/(Total AX).
Anders et al. www.pnas.org/cgi/content/short/1115858109 9 of 10

Table S3. List of PCR primers
Oligo name Orientation Sequence (5′ to 3′) Target
prTYW13 Sense GCTACAAGATCCAGCTCGACG qRT PCR amplicon TaXAT1prTYW14 Antisense CTCACGTTCTGCTTCTCCAGG qRT PCR amplicon TaXAT1prTYW412 Sense AGCCTCACCGACCAGTACC qRT PCR amplicon TaXAT2prTYW413 Antisense GCTTGTCCATGAAGGTCTCC qRT PCR amplicon TaXAT2prTYW19 Sense CGAGATCGACCAAGAATGG qRT PCR reference gene Ta2526prTYW20 Antisense TGAGTGTTGCCTCCCTCC qRT PCR reference gene Ta2526prTYW424 Sense GCTGCCATCATATCCATTCC qRT PCR reference gene SDHprTYW425 Antisense AGCAATGTTACCCCTCATCG qRT PCR reference gene SDHprTYW422 Sense ACTTCCAGGGTGACAACAGG qRT PCR reference gene GAPDHprTYW423 Antisense GTGCTGTATCCCCACTCGTT qRT PCR reference gene GAPDHGT61-2F3 Sense GGAGGAGGGGGGGAAGGAGG TaXAT2 cDNAGT61-2R Antisense GGCCAATGGCGGATCAGTAGTTC TaXAT2 cDNAGT61-2XbaF Sense GGTCTAGATGAAGGCGGTGGAGCGGG TaXAT2 ORFGT61-2SalR Antisense TCGTCGACTTTTGGTTTAGCAGATCAAGG TaXAT2 ORFGT61-1F1 Sense AGAGGCAGGCCATGAAGTCGG TaXAT1 cDNAGT61-1R1 Antisense TCGACCGCGCGCAATGTACACAT TaXAT1 cDNAKpnI At2g37090 Sense GTCGGTACCCTCTTTTTGTGTCTAAGG IRX9 5′ genomic regionApaI At2g37090 Antisense GTCGGGCCCAACCCTCTCTTCAAGGAA IRX9 5′ genomic regionSmaI At2g37090 Sense GTCCCCGGGTTTGCTTTATTTCATTCT IRX9 3′ genomic regionNotI At2g37090 Antisense GTCGCGGCCGCAAAACGAGAGGATCCTTG IRX9 3′ genomic regionApaI TaXAT2 Sense GTCGGGCCCATGAAGGCGGTGGAGCGG TaXAT2 ORF
Anders et al. www.pnas.org/cgi/content/short/1115858109 10 of 10