supporting information - pnas · supporting information ... w. lu), recombinant nef (bioclone), and...
TRANSCRIPT

Supporting InformationCarroll et al. 10.1073/pnas.1615258113SI Materials and MethodsWestern Blot Analysis. Spleen or pooled lymph nodes from Tg26mice were analyzed for protein expression as described previously(25). For positive controls, 20 ng of the following viral proteins,derived from HIV-1 IIIB, were used: synthetic p17 (provided byW. Lu), recombinant Nef (Bioclone), and recombinant gp120(CHO; National Institutes of Health AIDS Reagent Program).Human B cells were probed with anti-RAG1 antibody (SantaCruz Biotechnology) and anti–β-actin (Thermo Fisher Scientific).
IHC.Mouse lymph nodes and femurs were fixed in formalin. Boneswere decalcified in 14% EDTA, pH 7.1 for 5–7 d. Paraffin-embedded sections were incubated at 55 °C under vacuum for 1 h,allowed to cool, deparaffinized in xylene, and then rehydrated ingraded ethanol. For p17 staining, sections were blocked with 5%goat serum, followed by blocking for endogenous biotin with theAvidin/Biotin Blocking Kit (Invitrogen) and blocking for endog-enous mouse IgG with 0.1 mg/mL Fab goat anti-mouse IgG(Rockland Immunochemicals). Mouse IgG anti-p17 mAb (clone32/5.8.42; ZeptoMetrix) was used at 1 μg/mL in 1% BSA andincubated overnight at 4 °C. Endogenous peroxidase was blockedwith 3% hydrogen peroxide, followed by biotin-Fab goat anti-mouse IgG (Jackson ImmunoResearch) and HRP-streptavidin(Life Technologies). Signals were visualized with a DAB Kit(Vector Laboratories). Slides were counterstained with hematox-ylin and dehydrated for mounting.
Flow Cytometry. Single-cell suspensions of mouse spleen, pe-ripheral blood, and BM cells were analyzed after RBC lysis.Antibodies for mouse antigens included CD3 (145-2C11), CD19(1D3), and CXCR4 (2B11) (eBioscience); IgD (11-26c.2a),IgM (RMM-1), CD21 (7E9), CD23 (B3B4), and VpreB (R3)(Biolegend); mouse Ig λ1, λ2, and λ3 light chain (R26–46) andmouse Ig κ light chain (187.1) (BD Biosciences); mCXCR1rabbit polyclonal (Biorbyt); and mCXCR2 (R&D Systems).Antibodies for human antigens included CD3 (OKT3), CD19(HIB19), CD14 (61D3), and CD56 (MEM188) (Ebioscience);CD86 (IT2.2) (Biolegend); and hCXCR1 and hCXCR2 (R&DSystems). Synthetic p17-Alexa Fluor 430 reagent was kindlyprovided by W. Lu and used at a concentration of 20 μg/mL.Fixable viability dye eFluor520 (eBioscience) or Live/Dead Fix-able Aqua (Molecular Probes) was used to gate live cells.
Microarray Analysis. All analytical procedures described belowwere performed using state-of-the-art methods implemented inthe oligo, affy, frma, limma, and sva packages available though theR/Bioconductor project (47). Raw data preprocessing wasmonitored using standard diagnostic plots (i.e., 2D image plots,
RNA degradation plots, MA plots, and boxplots). Affymetrixmicroarray data were normalized at probe level using the frozenrobust multiarray analysis method (48). A generalized linearmodel approach, coupled with empirical Bayes SEs (49), was usedto identify differentially expressed genes between animal groups.Correction for multiple testing was performed using the Benja-mini–Hochberg method (50). Classical multidimensional scaling(i.e., principal component analysis) (51) was used to display therelationship between the analyzed animal groups in a multidi-mensional space using the top 10% most variant genes.Finally, we identified the differentially expressed pathways and
biological processes using GSEA (36) and Analysis of FunctionalAnnotation, as described previously (52–55). To this end, werelied on the Broad Institute’s Molecular Signature Database(36), a well-established initiative funded by the NIH, the NationalCancer Institute, and the National Institute of General MedicalSciences, to assemble curated collections of functional gene sets(FGS) for data mining and GSEA. In the present study, we fo-cused on (i) signaling pathways from the Kyoto Encyclopedia ofGenes and Genomes (56), Reactome (57), and Biocarta (www.genecarta.com); (ii) biological processes from Gene Ontology(58); (iii) FGS containing genes that share cis-regulatory motifs,corresponding to microRNA seed sequences or transcriptionfactor binding sites, that are conserved across the human, mouse,rat, and dog genomes (59); and (iv) manually curated FGS cor-responding to fundamental biological processes (hallmark FGS),immunologic expression profiles, and oncogenic signatures de-rived from peer-reviewed papers. Raw expression data and therequired minimum information about a microarray experiment(MIAME) are available from the Gene Expression Omnibus(GEO) database (accession no. GSE87546).
Real-Time qPCR. Activated human B cells were treated with me-dium, IL-8 (100 ng/mL), or p17 (100 ng/mL) for 24 h. RNA wasextracted using the RNeasy Kit with On-ColumnDNase digestion(Qiagen). First-strand cDNAwas synthesized from 500 ng of totalRNA using the iScript cDNA Synthesis Kit (Bio-Rad). cDNAwasanalyzed by real-time qPCR with iQSYBRGreen Supermix (Bio-Rad) with the following primers: RAG1: forward, 5′-GTGCT-GAATTTCATCTGGGG-3′; reverse, 5′-ATCTCAACACTTT-GGCCAGG-3′; RAG2: forward, 5′-TGACTGTTACCATCTG-CAGAGAC-3′; reverse, 5′-TGGTTTAGCGGCAAAGATTC-3′;and 18S: forward, 5′-ATCAACTTTCGATGGTAGTCG-3′; re-verse, 5′-TCCTTGGATGTGGTAGCCG-3′. The ΔΔCt methodwas used to calculate fold changes between untreated and treatedcells normalized to 18S ribosomal RNA.
Carroll et al. www.pnas.org/cgi/content/short/1615258113 1 of 6

WT Tg26
CD19+
IgM
IgD
CD21
CD19
Fig. S1. Asymptomatic Tg26 mice exhibit alterations in the BM B-cell compartment. BM cells were collected from age- and sex-matched Tg26 mice and WTcontrol mice and stained for surface markers. The frequency of CD19+ among total live cells was similar in the WT and Tg26 mice (Top). Among CD19+ cells,IgM+IgD+ (mature) and CD21+ cells were increased in Tg26 mice compared with WT mice. Data are representative of four pairs of mice examined. The increasein CD21+CD19+ cells in Tg26 BM was significant (P < 0.05, Mann–Whitney U test).
Carroll et al. www.pnas.org/cgi/content/short/1615258113 2 of 6

Fig. S2. Phenotype of Tg26 lymphoma cells. CD19+ cells from spleen, lymph node, and peripheral blood from a Tg26 mouse with lymphoma were evaluatedfor κ light chain and VpreB receptor expression.
Fig. S3. Human PBMC subsets express receptors for p17. PBMCs were isolated from leukopaks from healthy donors (New York Blood Center) withLymphoprep. After RBC lysis, cells were stained with p17-Alexa Fluor 430 and surface markers. Live cells were gated as follows: B cells, CD19+CD3−; T cells,CD19−CD3+; NK cells, CD56+CD3−; and monocytes, CD14+. The percent positive (Left) and median fluorescence intensity (MFI; Right) for p17 staining amongeach subset is plotted (n = 6). The majority of B cells and monocytes bound p17, as expected.
Carroll et al. www.pnas.org/cgi/content/short/1615258113 3 of 6
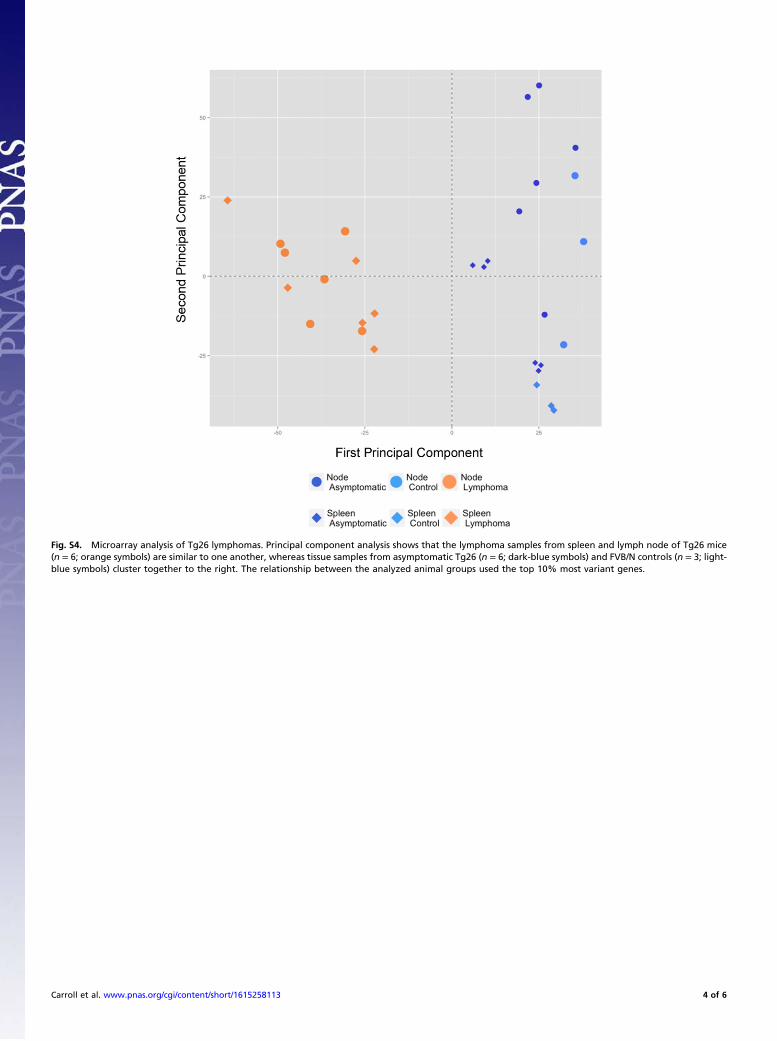
Fig. S4. Microarray analysis of Tg26 lymphomas. Principal component analysis shows that the lymphoma samples from spleen and lymph node of Tg26 mice(n = 6; orange symbols) are similar to one another, whereas tissue samples from asymptomatic Tg26 (n = 6; dark-blue symbols) and FVB/N controls (n = 3; light-blue symbols) cluster together to the right. The relationship between the analyzed animal groups used the top 10% most variant genes.
Carroll et al. www.pnas.org/cgi/content/short/1615258113 4 of 6

Fig. S5. Down-regulated genes in lymphoma tissues. The first 20 most down-regulated genes in Tg26 lymphoma lymph nodes and spleen (green) vs. Tg26asymptomatic lymph nodes and spleen (healthy, blue) are shown. There were more than 1,000 significant genes with an FDR <1% and an absolute log twofold-change >1; however, all 20 genes reported had an FDR <1e-10. The top 5% most differentially expressed genes are listed in Dataset S1.
Carroll et al. www.pnas.org/cgi/content/short/1615258113 5 of 6
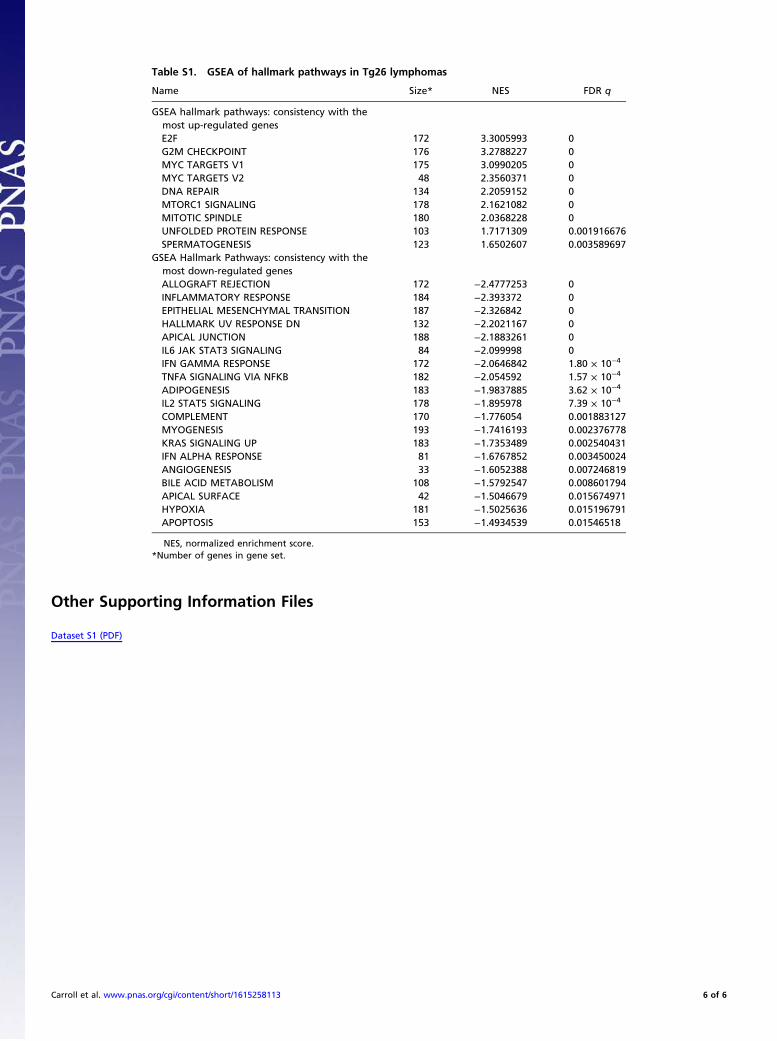
Table S1. GSEA of hallmark pathways in Tg26 lymphomas
Name Size* NES FDR q
GSEA hallmark pathways: consistency with themost up-regulated genesE2F 172 3.3005993 0G2M CHECKPOINT 176 3.2788227 0MYC TARGETS V1 175 3.0990205 0MYC TARGETS V2 48 2.3560371 0DNA REPAIR 134 2.2059152 0MTORC1 SIGNALING 178 2.1621082 0MITOTIC SPINDLE 180 2.0368228 0UNFOLDED PROTEIN RESPONSE 103 1.7171309 0.001916676SPERMATOGENESIS 123 1.6502607 0.003589697
GSEA Hallmark Pathways: consistency with themost down-regulated genesALLOGRAFT REJECTION 172 −2.4777253 0INFLAMMATORY RESPONSE 184 −2.393372 0EPITHELIAL MESENCHYMAL TRANSITION 187 −2.326842 0HALLMARK UV RESPONSE DN 132 −2.2021167 0APICAL JUNCTION 188 −2.1883261 0IL6 JAK STAT3 SIGNALING 84 −2.099998 0IFN GAMMA RESPONSE 172 −2.0646842 1.80 × 10⁻⁴
TNFA SIGNALING VIA NFKB 182 −2.054592 1.57 × 10⁻⁴
ADIPOGENESIS 183 −1.9837885 3.62 × 10⁻⁴
IL2 STAT5 SIGNALING 178 −1.895978 7.39 × 10⁻⁴
COMPLEMENT 170 −1.776054 0.001883127MYOGENESIS 193 −1.7416193 0.002376778KRAS SIGNALING UP 183 −1.7353489 0.002540431IFN ALPHA RESPONSE 81 −1.6767852 0.003450024ANGIOGENESIS 33 −1.6052388 0.007246819BILE ACID METABOLISM 108 −1.5792547 0.008601794APICAL SURFACE 42 −1.5046679 0.015674971HYPOXIA 181 −1.5025636 0.015196791APOPTOSIS 153 −1.4934539 0.01546518
NES, normalized enrichment score.*Number of genes in gene set.
Other Supporting Information Files
Dataset S1 (PDF)
Carroll et al. www.pnas.org/cgi/content/short/1615258113 6 of 6