supporting material for discussion of ‘performance pay and wage flexibility in the great...
TRANSCRIPT
Supporting material for discussion of ‘Performance pay and wage flexibility in the Great Recession’ by Alex Bryson, John Forth, Lucy Stokes and Martin Weale
Mark BeatsonChief Economist
CIPD

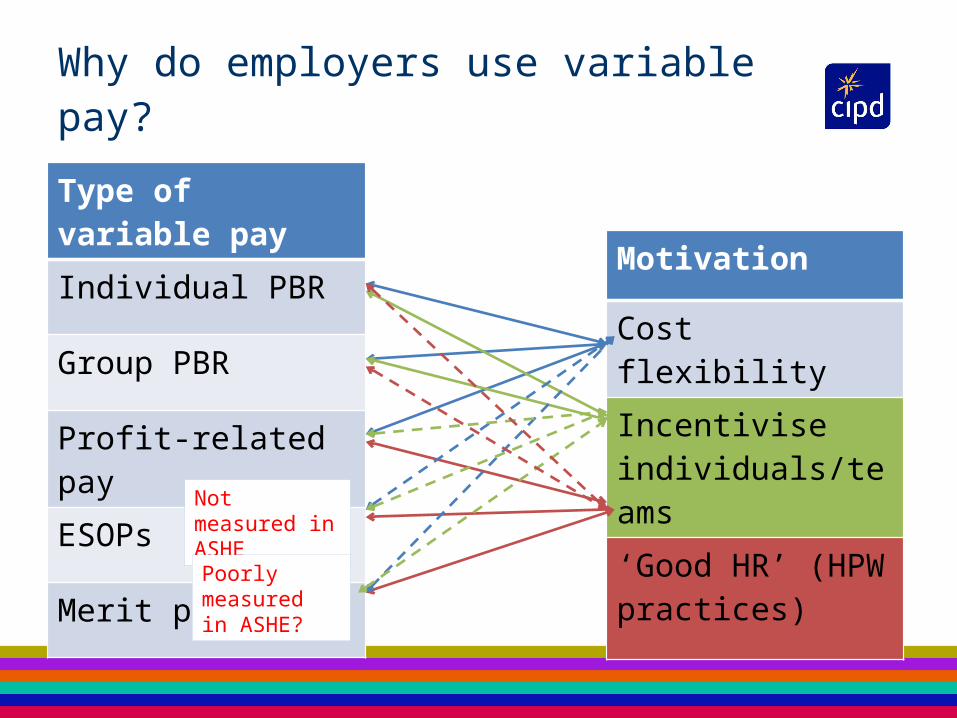
Why do employers use variable pay?
Type of variable pay
Individual PBR
Group PBR
Profit-related pay
ESOPs
Merit pay
Motivation
Cost flexibility
Incentivise individuals/teams
‘Good HR’ (HPW practices)
Why do employers use variable pay?
Type of variable pay
Individual PBR
Group PBR
Profit-related pay
ESOPs
Merit pay
Motivation
Cost flexibility
Incentivise individuals/teams
‘Good HR’ (HPW practices)Not measured
in ASHE
Poorly measured in ASHE?

Payment b
y re
sults
Merit
pay
Profit-
rela
ted p
ay
share
owners
hip s
chem
es
Any of t
hese in
centiv
e sch
emes
31
15
30
18
54
2820
29
9
542004 2011
Source: Workplace Employment Relations Study, 2004 and 2011.
Prevalence of variable and performance-related incentive schemes, 2004-2011(% of workplaces with 5 or more employees where some use was made of these schemes)
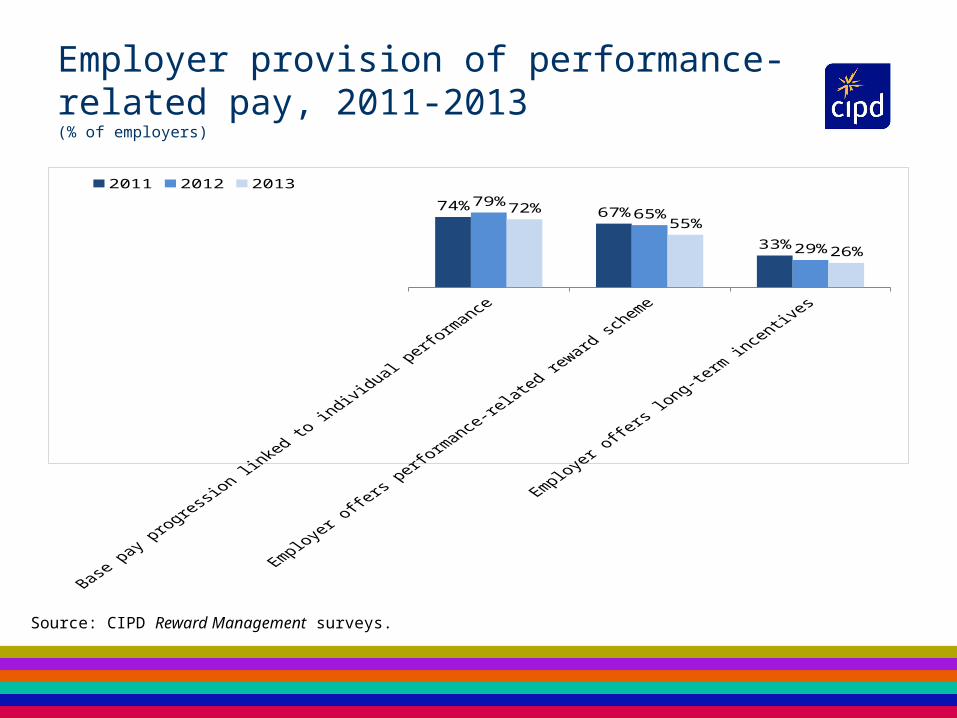
Employer provision of performance-related pay, 2011-2013(% of employers)
74% 67%
33%
79%65%
29%
72%55%
26%
2011 2012 2013
Source: CIPD Reward Management surveys.
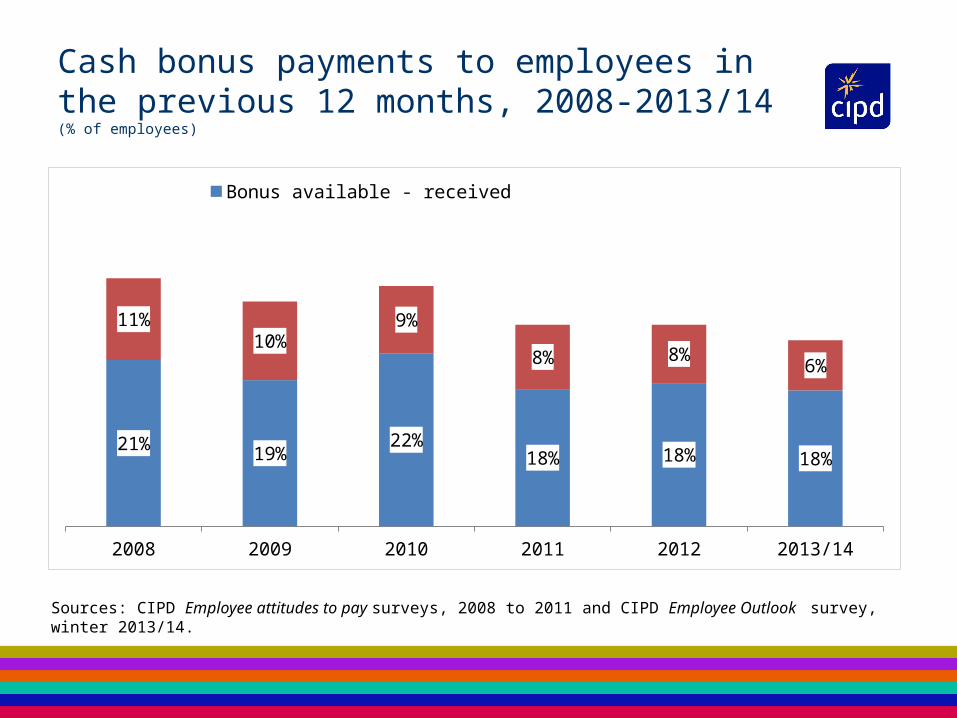
Cash bonus payments to employees in the previous 12 months, 2008-2013/14(% of employees)
2008 2009 2010 2011 2012 2013/14
21% 19%22%
18% 18% 18%
11%10%
9%
8% 8%6%
Bonus available - received Bonus available - not received
Sources: CIPD Employee attitudes to pay surveys, 2008 to 2011 and CIPD Employee Outlook survey, winter 2013/14.
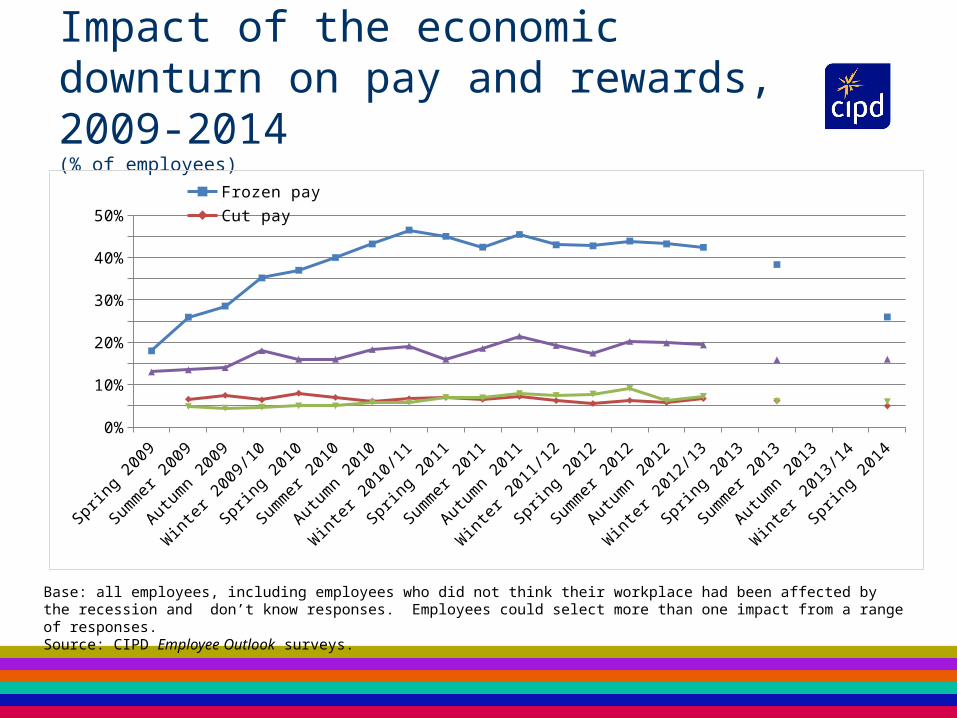
Impact of the economic downturn on pay and rewards, 2009-2014(% of employees)
Sprin
g 20
09
Summ
er 2
009
Autum
n 20
09
Win
ter 2
009/
10
Sprin
g 20
10
Summ
er 2
010
Autum
n 20
10
Win
ter 2
010/
11
Sprin
g 20
11
Summ
er 2
011
Autum
n 20
11
Win
ter 2
011/
12
Sprin
g 20
12
Summ
er 2
012
Autum
n 20
12
Win
ter 2
012/
13
Sprin
g 20
13
Summ
er 2
013
Autum
n 20
13
Win
ter 2
013/
14
Sprin
g 20
140%
5%
10%
15%
20%
25%
30%
35%
40%
45%
50%
Frozen pay Cut payReduced employer pension contributions Reduced employee benefits/perks
Base: all employees, including employees who did not think their workplace had been affected by the recession and don’t know responses. Employees could select more than one impact from a range of responses.Source: CIPD Employee Outlook surveys.

Changes in the nominal pay of employees in the previous 12 months, 2008-2013/14(% of employees)
2008 2009 2010 2011 2012 2013/14
2642 45 49
41
7051 50 46
51
-3 -5 -4 -5 -3
Pay freeze Pay increase Pay cut
Excluding don’t know/can’t remember responses.Respondents were instructed to exclude promotions, demotions, regrading and new jobs.Sources: CIPD Employee attitudes to pay surveys, 2008 to 2011 and CIPD Employee Outlook survey, winter 2013/14.
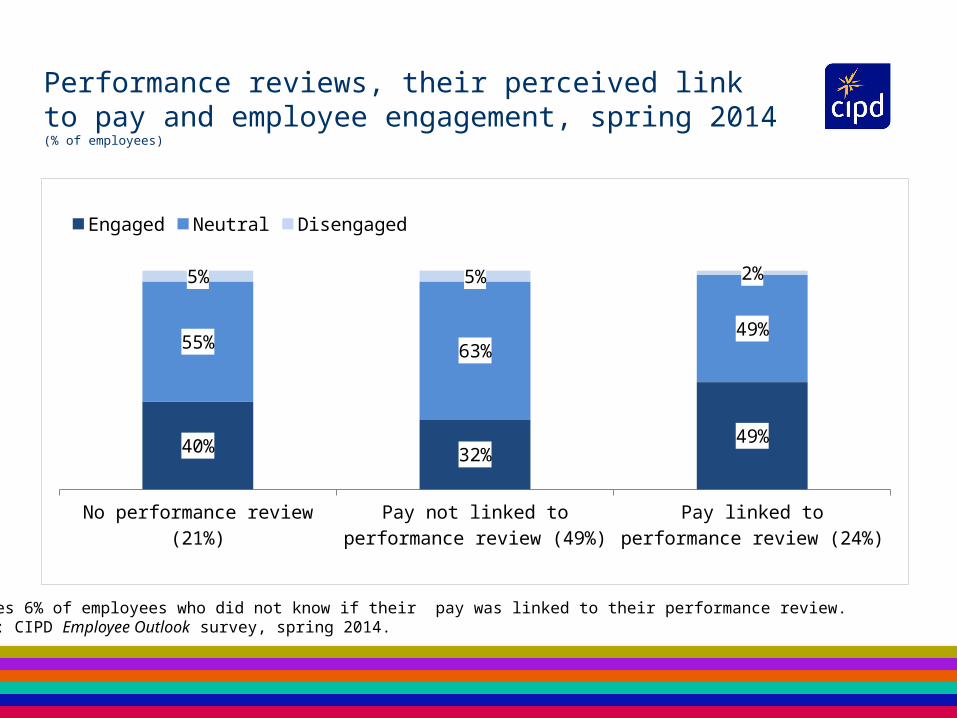
Performance reviews, their perceived link to pay and employee engagement, spring 2014(% of employees)
40% 32% 49%
55% 63% 49%5% 5% 2%
Engaged Neutral Disengaged
Excludes 6% of employees who did not know if their pay was linked to their performance review.Source: CIPD Employee Outlook survey, spring 2014.

• Analysis of 2010 MOPS survey of 37,000 US manufacturing establishments [Bloom, Brynjolsson, Foster, Jarmin, Patnail, Saporta-Eksten and Van Reenen (2014), IT and management in America ]:– Management practice scores positively associated with productivity and other
business outcomes (profits, growth, R&D, patenting)– Management scores positively associated with IT investment– Mean management score increased 2005-2010 (based on recall)– Increased use of incentives and targets (based on recall)– Biggest increase in use of data-driven performance monitoring (based on recall)
• If data makes it easier to measure individual and group performance, will employers still need to rely on performance-related pay?
What about technology?
Thank you