supporting renewables while saving taxpayers money · uday varadarajan brendan pierpont andrew...
TRANSCRIPT

Supporting Renewables while Saving Taxpayers Money
CPI Report
Climate Policy Initiative
Uday VaradarajanBrendan PierpontAndrew HobbsKath Rowley
September 2012

About CPIClimate Policy Initiative (CPI) is a policy effectiveness analysis and advisory organization whose mission is to assess, diagnose, and support the efforts of key governments around the world to achieve low-carbon growth.
CPI is headquartered in San Francisco and has offices around the world, which are affiliated with distinguished research institutions. Offices include: CPI Beijing, affiliated with the School of Pub-lic Policy and Management at Tsinghua University; CPI Berlin, affiliated with the Department for Energy, Transportation, and the Environment at DIW Berlin; CPI Rio, affiliated with Pontifical Catholic University of Rio (PUC-Rio); and CPI Venice, affiliated with Fondazione Eni Enrico Mat-tei (FEEM). CPI is an independent, not-for-profit organization that receives long-term funding from George Soros.
DescriptorsSector Power
Region United States
Keywords Renewable Energy, Finance, Solar, Wind, Tax Incentives
Related CPI reports Renewable Energy Financing and Climate Policy Effectiveness, The Impacts of Policy on the Financing of Renewable Projects: A Case Study Analysis
Contact Uday Varadarajan, San Francisco [email protected]
Copyright © 2012 Climate Policy Initiative www.climatepolicyinitiative.orgAll rights reserved. CPI welcomes the use of its material for noncommercial purposes, such as policy discussions or educational activities, under a Creative Commons Attribution-NonCommercial-ShareA-like 3.0 Unported License. For commercial use, please contact [email protected].
AcknowledgementsThe authors thank the following organizations and professionals for their collaboration and input: Phil Blix of Industry Capital, Ben Paulos of the Energy Foundation, Dan Adler of CalCEF, Todd Foley and Jeramy Shays of ACORE, Eric Gimon of the Vote Solar Initiative, Audrey Lee of CPUC, Michael Mendelsohn of NREL, Jane Flegal of the Bipartisan Policy Center, and Gavin Pur-chas of ClimateWorks. The perspectives expressed here are CPI’s own. Finally the authors would like to acknowledge inputs, comments and internal review from CPI staff: David Nelson, Elysha Rom-Povolo, Tim Varga, Ruby Barcklay, and Morgan Hervé-Mignucci.

3A CPI Report
Supporting Renewables while Saving Taxpayers MoneySeptember 2012
Executive SummaryRenewable energy deployment in the United States is booming. Renewable electricity generation has more than doubled since 2005,1 bringing reductions in air pollu-tion and greenhouse gas emissions. The doubling was financed largely through private investment mobilized by state and federal incentives and other policies, leading to substantial expansion of the renewable energy industry.
While solar and wind costs have fallen, rising deployment has increased the cost to government of providing the incentives. Key federal policy incentives are now begin-ning to expire, just as federal lawmakers are looking for opportunities to reduce the deficit. It is therefore impor-tant and timely to review the performance of federal renewable energy incentives.
In this paper, we address three specific questions:
1. How important are federal incentives for encouraging renewable energy deployment?
1 Net Generation by Energy Source: Total (All Sectors), June 27, 2012, Electric Power Monthly, Growth refers to non-hydro renewables.
2. How cost-effective are these incentives as currently structured?
3. How could they be improved?
Incentive design influences how renewable energy projects are financed; project finance in turn affects the overall cost of electricity generation. Using detailed finan-cial modeling, we have evaluated the impact of current federal incentives on the cost of three typical grid-con-nected utility-scale renewable energy projects—a large wind, a small solar photovoltaic (PV), and a large solar PV facility.
Under current law, a wind facility operating by the end of 2012 receives a production tax credit (PTC) of $22/MWh for electricity generated in its first 10 years while a solar PV facility operating by the end of 2016 receives an invest-ment tax credit (ITC) equal to 30% of eligible project investment costs.
This analysis demonstrates how the federal government can modify these incentives to save money, while sustain-ing strong support for U.S. renewable energy deployment.
Figure ES-1: Federal incentives are critical to the viability of wind and solar PV projects.
96
4
34
39
26
67
3
25
40
6
Cost to Utility without Incentives
Project Financing Costs
Federal Incentives
Market Price for Electricity
Cost Gap
Cost to Utility without Incentives
Project Financing Costs
Federal Incentives
Market Price for Electricity
Cost Gap
Cost of Electricity (USD / MWh)
155
43
73
50
75
404
47
174
50
228
116
10
43
50
33
218
12
92
50
89
0 100 0 100 200 300 400 0 100 200
20102013
Large Wind Small PV Large PV

4A CPI Report
Supporting Renewables while Saving Taxpayers MoneySeptember 2012
Key Findings1. Federal incentives have been critical to the viability
of most renewable energy projects.
• The federal incentives available to projects financed in 20102 bridged roughly half the gap between the costs of renewable electric-ity generation and expected market prices for electricity.
• To bridge the remaining gap, projects have largely been deployed in areas that meet one or more of the following requirements: complementary state policies apply, there are significantly higher than average wholesale electricity prices, or develop-ment of conventional electricity generation is constrained.
• The recession and resulting state fiscal con-straints mean that in the absence of federal incentives, it is unlikely that states and ratepayers alone would have filled the gap.
2. Wind is now almost viable based on federal incentives alone. The gap for solar PV is narrowing.
• Recent cost reductions and performance improve-ments mean that if current federal incentives are sustained, a large wind project built in 2013 will be nearly cost-competitive.
2 These were the 30% 1603 Cash Grant, accelerated depreciation, and 50% bonus depreciation.
• Steep reductions in solar PV costs over the last two years mean solar PV projects will be more cost-competitive in 2013, but will still need some state or ratepayer support to be viable.
3. Tax incentives leak money.
• A stand-alone large wind project has limited tax liabilities. As a result, project developers can only use tax benefits many years after they are received, and realize just one-third of their potential value (Figure ES-2).
• Project developers therefore enter into financial arrangements with outside investors with tax liabilities—tax-equity financing—to use the tax incentives as they are received.
• However, these arrangements are costly and only enable developers to realize two-thirds of the value of the incentive—an inefficient use of government money (Figure ES-2).
4. Government can save money while providing the same support for projects by using taxable cash incentives rather than tax incentives.
• A 1603 Cash Grant half the size of the current investment tax credit could deliver the same benefit to a solar PV project in 2013 at half the cost to government (Figure ES-3).
• Taxable cash incentives can be even more
0
5
10
15
20
0
20%
60%
80%
100%
40%
Valu
e of
tax
ben
efit
s to
la
rge
win
d pr
ojec
ts (
$/M
Wh)
Value of tax benefits as a percentage of
cost to government
Project owners without outside
tax liabilities
Tax equity financing
Project owners with outside tax liabilities
Project owners without outside
tax liabilities
Tax equity financing
Project owners with outside tax liabilities
Figure ES-2: Tax incentives have less value to projects with limited tax liabilities.

5A CPI Report
Supporting Renewables while Saving Taxpayers MoneySeptember 2012
cost-effective for governments than non-taxable cash incentives such as the 1603 Cash Grant.3
• If the wind production tax credit was delivered as a taxable cash incentive, it would almost halve the cost to government while delivering the same benefit to wind projects (Figure ES-3).
5. But we must mindful of how different incentives impact the risks borne by government.
• Investment-based incentives shift some project performance risks to the government, as the government pays a fixed fraction of the project’s cost regardless of project performance.
• Production-based incentives reward performance equally across all projects, but carry greater price-setting risks. This is particularly acute when technology prices are hard to predict.
3 Since the incentive is taxable, it results in additional project tax liabilities which can both help the project make better use of up-front tax benefits such as ac-celerated depreciation and increase tax revenues later in the life of the project to offset some of the cost of providing the incentive.
Policy RecommendationsOur work identifies two clear steps policymakers can take to improve the cost-effectiveness of federal renewable energy incentives:
1. Extend the PTC as a taxable cash incentive for production (TCP) – In the near term extend the $22/MWh PTC for wind, but deliver it as a $21/MWh TCP. This would:
• Maintain the same effective level of support for wind projects.
• Reduce the cost of the incentive to federal and state government by around 40% for every unit of clean electricity generated.
• Avert a bust in the wind industry, and stimulate deployment even in states or regions with no local or state policy supports.
2. Give solar PV projects the option to take a 20% 1603 Cash Grant in lieu of a 30% ITC – This option could increase the value of the incentive to the project while reducing the cost to government of providing it.

6A CPI Report
Supporting Renewables while Saving Taxpayers MoneySeptember 2012
-10%
-27%
-20%
-42%
Incentive cost to federal and state governments ($ / MWh)
37% ITC
30% 1603 Cash GranT
$18/MWh non-Taxable Cash for ProduCTIon
$21/MWh TCP
$56/MWh PTC
14% 1603 Cash GranT
$24/MWh non-Taxable Cash for ProduCTIon
$30/MWh TCP
$36/MWh PTC
15% 1603 Cash GranT
$18/MWh non-Taxable Cash for ProduCTIon
$22/MWh TCP
-50%
-44%
-60%
+13%
Alternative incentives with identical benefits
LARGE WIND
SMALL PV
LARGE PV
RELATIVE RISK
Low High
Ince
ntive
pr
ice ri
sk
Proj
ect r
isk
Current policy: $22/MWh PTC
100 5
Ince
ntive
pr
ice ri
sk
Proj
ect r
isk
Current policy: 30% ITC
30 35
Figure ES-3: Policy alternatives and the costs and risks to federal and state governments.
Current policy: 30% ITC
Ince
ntive
pr
ice ri
sk
Proj
ect r
isk
+13%
-51%
-64%
-57%
15
2510 200 5 15
10 200 5 15

7A CPI Report
Supporting Renewables while Saving Taxpayers MoneySeptember 2012
ContentsExecutive Summary 3
Key Findings 4Policy Recommendations 5
1 Why Look at Federal Tax Incentives? 8
2 Prior Work on the Impact and Cost-Effectiveness of Federal Incentives 1 12.1 Impact of Financial Structures 1 12.2 Relative Cost-Effectiveness of Federal Incentives 1 1
3 How are We Assessing Federal Policy Impact and Cost-Effectiveness? 1 33.1 Getting Cases from Actual Project Statistics 1 33.2 From Case Data to Impact and Cost-Effectiveness 1 43.3 Limitations and Opportunities 1 6
4 Importance of Federal Incentives 1 84.1 Federal Incentives and Project Viability in 2010 1 84.2 Were Federal Incentives Necessary? 194.3 Federal Incentives and Project Viability in 2013 2 0
5 Cost-Effectiveness of Federal Incentives 2 15.1 Small Solar PV in 2013 and 1603 Cash Grant 2 25.2 Large Wind in 2013 and a Taxable Cash Incentive for Production (TCP) 2 35.3 Large Solar PV in 2013 and Incentive Price Risk 2 5
6 Conclusion and Recommendations 2 7
References 28
Appendix A - Summary of Project Input Data, Assumptions, and Results 3 0
Appendix B - Modifications to CPI Financial Model for this analysis 3 5
8A CPI Report
Supporting Renewables while Saving Taxpayers MoneySeptember 2012
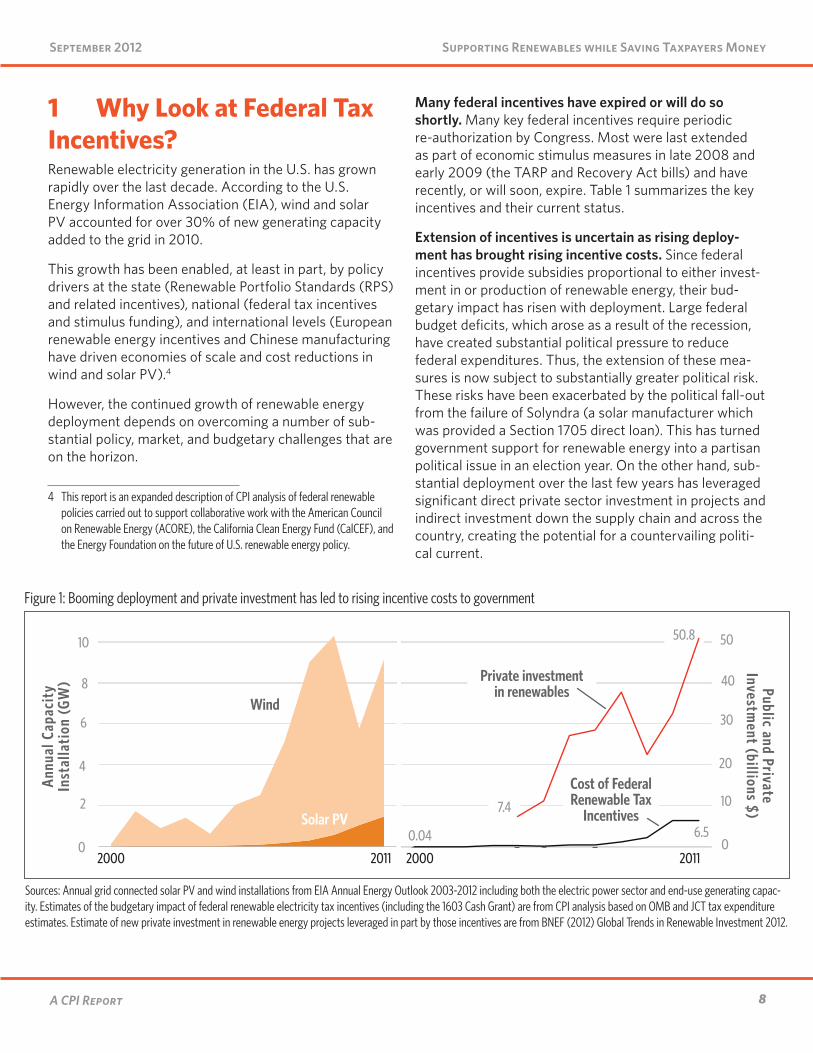
1 Why Look at Federal Tax Incentives?Renewable electricity generation in the U.S. has grown rapidly over the last decade. According to the U.S. Energy Information Association (EIA), wind and solar PV accounted for over 30% of new generating capacity added to the grid in 2010.
This growth has been enabled, at least in part, by policy drivers at the state (Renewable Portfolio Standards (RPS) and related incentives), national (federal tax incentives and stimulus funding), and international levels (European renewable energy incentives and Chinese manufacturing have driven economies of scale and cost reductions in wind and solar PV).4
However, the continued growth of renewable energy deployment depends on overcoming a number of sub-stantial policy, market, and budgetary challenges that are on the horizon.
4 This report is an expanded description of CPI analysis of federal renewable policies carried out to support collaborative work with the American Council on Renewable Energy (ACORE), the California Clean Energy Fund (CalCEF), and the Energy Foundation on the future of U.S. renewable energy policy.
Many federal incentives have expired or will do so shortly. Many key federal incentives require periodic re-authorization by Congress. Most were last extended as part of economic stimulus measures in late 2008 and early 2009 (the TARP and Recovery Act bills) and have recently, or will soon, expire. Table 1 summarizes the key incentives and their current status.
Extension of incentives is uncertain as rising deploy-ment has brought rising incentive costs. Since federal incentives provide subsidies proportional to either invest-ment in or production of renewable energy, their bud-getary impact has risen with deployment. Large federal budget deficits, which arose as a result of the recession, have created substantial political pressure to reduce federal expenditures. Thus, the extension of these mea-sures is now subject to substantially greater political risk. These risks have been exacerbated by the political fall-out from the failure of Solyndra (a solar manufacturer which was provided a Section 1705 direct loan). This has turned government support for renewable energy into a partisan political issue in an election year. On the other hand, sub-stantial deployment over the last few years has leveraged significant direct private sector investment in projects and indirect investment down the supply chain and across the country, creating the potential for a countervailing politi-cal current.
6.5
Figure 1: Booming deployment and private investment has led to rising incentive costs to government
Sources: Annual grid connected solar PV and wind installations from EIA Annual Energy Outlook 2003-2012 including both the electric power sector and end-use generating capac-ity. Estimates of the budgetary impact of federal renewable electricity tax incentives (including the 1603 Cash Grant) are from CPI analysis based on OMB and JCT tax expenditure estimates. Estimate of new private investment in renewable energy projects leveraged in part by those incentives are from BNEF (2012) Global Trends in Renewable Investment 2012.
0.04
50.8
2000
7.4
2011
Solar PV
Wind
Annu
al C
apac
ity
Inst
alla
tion
(GW
) Public and Private Investm
ent (billions $)
Private investment in renewables
Cost of Federal Renewable Tax
Incentives
2000 2011
6
4
10
8
2
0
30
20
50
40
10
0

9A CPI Report
Supporting Renewables while Saving Taxpayers MoneySeptember 2012
State policy appears to be saturated. Contracts to meet state RPS requirements for the near future are already in place, leaving little room for additional growth. The U.S. Partnership for Renewable Energy Finance (US PREF, 2012) projects that RPS-driven demand can be met by deploying a little over 3 GW of new renewable electricity generation per year until 2030, significantly below recent annual deployment of around 10 GW per year.
Cheap natural gas and lower demand puts price pres-sure on renewable energy. The boom in domestic pro-duction of natural gas from shale formations has driven
nominal gas prices down to levels last seen in the 1990s, transforming the outlook for the electricity sector. Gas generation now boasts lower marginal costs than coal generation in many states, and it delivers significant local air pollution reductions relative to coal.5 Sustained lower electricity prices would diminish the economic viability of renewable technologies.
5 However, note that the long-term implications of shale gas are far from clear due to uncertain groundwater impacts, lifecycle CO2 emissions, and long term production profiles.
Incentive Origin Expiration Description Risk to Government
Production Tax Credit (PTC) for Wind
Energy Policy Act of 1992
Placed in Service by End of 2012
$22/MWh tax credit for electricity generated
Incentive level may not be appropriate
Investment Tax Credit (ITC) for Solar
Energy Policy Act of 2005 (at 30%)
Placed in Service by End of 2016
Tax credit for 30% of eligible project costs
Project performance and cost risk
Investment Tax Credit (ITC) for Wind
Recovery Act of 2009
Placed in Service by End of 2012
Tax credit for 30% of eligible project costs in lieu of PTC
Project performance and cost risk
Section 1603 Cash Grant for Wind & Solar
Recovery Act of 2009
Start Construction by End of 2011
Option of a 30% cash grant in lieu of ITC or PTC
Project performance and cost risk
MACRS – Accelerated Depreciation
Economic Recovery Tax Act of 1981
-5-Year depreciation for tax purposes
-
Bonus DepreciationEconomic Stimulus Act of 2008
100% by End of 2011, 50% by End of 2012
50% or 100% depreciation for tax purposes in first year
-
Section 1705 Loan Guarantee for Wind & Solar
Recovery Act of 2009
Closed Financing by 9/30/2011
Government guarantee of up to 80% of project debt
Risk of project failure project performance and cost risk
Table 1: Federal renewable energy incentives

10A CPI Report
Supporting Renewables while Saving Taxpayers MoneySeptember 2012
In this work, we use project financial modeling and data on renewable energy project costs and performance to assess three aspects of the performance of current federal renewable energy incentives:
1. How important are federal incentives for encouraging renewable energy deployment?
2. How cost-effective are these incentives as currently structured?
3. How could they be improved?
For the first question, we provide an estimate of the impact of federal incentives—the extent to which federal incentives help bring the cost of electricity from solar and wind projects down towards market prices for electric-ity. We address the second question by comparing the cost to federal and state governments of providing the same level of benefit to a project using various currently employed incentives. Finally, we use insights gained from
the first two analyses to propose an alternative incen-tive mechanism for wind—a Taxable Cash for Production (TCP) incentive—which can provide the same benefits as the current production tax credit (PTC), but at lower cost to federal and state governments.
In the next section, we discuss prior work on these topics. In section three, we provide an overview of the project data and financial modeling techniques used to address these questions, and discuss the strengths and weak-nesses of our approach. In section four, we address the impact of federal incentives on the economic viability of renewable energy projects. In the fifth section, we discuss results regarding the relative cost-effectiveness of these incentives and a proposal for how the incentives might be modified to improve their cost-effectiveness. We con-clude with recommendations to policymakers regarding near-term modifications to federal incentives which can improve their cost-effectiveness.
Given these challenges, federal policymakers are looking to balance support for renewable energy with fiscal pressures. Improving the cost-effectiveness of federal renewable energy incentives could help.

11A CPI Report
Supporting Renewables while Saving Taxpayers MoneySeptember 2012
2 Prior Work on the Impact and Cost-Effectiveness of Federal IncentivesOur analysis builds upon a number of recent studies focused on the impact and cost-effectiveness of federal incentives. In this section we highlight some key findings from these studies in two important areas for our work—the nature and impact of the various financial structures used by renewable energy projects to monetize tax incen-tives, and the relative cost of various federal incentives.
2.1 Impact of Financial Structures The Electricity Markets and Policy Group at Lawrence Berkeley National Labs (LBNL) have studied the financing structures used by the wind industry to utilize federal tax incentives since the mid-1990s. The key results from this work and related efforts relevant to this work are:
Recent evidence suggests that tax equity market conditions are improving - Some of these constraints should loosen as capital markets for renewable energy projects grow and become more efficient. More recent publications focused on current state of play in wind project financing—for example, Mintz Levin (2012) and Chadbourne & Parke (2012)—suggest that the pool of tax equity investors has widened (to over 20) and that recent transactions have largely utilized the more efficient structures such as institutional investor flips. As a result, we focus our work on some variants of the more efficient structures described in these reports.
2.2 Relative Cost-Effectiveness of Federal IncentivesThe American Recovery and Reinvestment Act gave wind developers a choice between the ITC, PTC, and 1603 Cash Grant for projects which began construction by the end of 2010. This motivated a number of groups to study the relative cost-effectiveness of these federal incentives. Key conclusions from these studies relevant to our work are:
The choice of tax equity financing structure can impact electricity costs by as much as 30% - Harper et al. (2007) and Bolinger et al. (2010) outlined in detail the rationale, structures, and terms for tax equity financ-ing—the arrangements used by wind project developers without tax liabilities outside of the project to monetize tax incentives. They estimated that the variation in cost of electricity due to the choice of financing structure using the same tax incentive could be as high as 30%. This work significantly informed and motivated our focus on detailed modeling of tax equity financing structures.
The variation is tied to inefficiencies in tax equity capital markets - The choice of structure is often constrained by the specific risk and tax appetites of project stakeholders. In particular, the complexity of tax equity financing and the relatively small number of tax equity investors with significant, predictable, long-term tax liabilities and the capacity to structure these deals has resulted in a rela-tively thin market.
Cost and performance dictates the choice between the PTC and the 1603 Cash Grant for any given wind project. However, overall, the 1603 Cash Grant has spurred greater deploy-ment, reduced financial transaction costs, and halved the unit cost to government relative to the PTC.
The details of the financing arrangements made by a project developer to utilize tax incentives—tax equity financing—can impact the cost of electricity by as much as 30%.
Project cost and performance dictate the choice between the PTC and 1603 Cash Grant – Bolinger et al. (2009) found that the relative value of the PTC and the 1603 Cash Grant varied with costs and capacity factors across wind facilities. Lower cost, higher capacity factor facilities were likely to get more value from a PTC than the 1603 Cash Grant. This was confirmed by Bolinger et al. (2010) who noted that a quarter of all large wind proj-ects in 2009 and early 2010 chose the PTC over the cash grant in spite of the poor tax equity market conditions.
The 1603 Cash Grant resulted in additional deployment relative to the PTC it replaced – Bolinger et al. (2010) also assessed the extent to which the choice of a 1603 Cash Grant enabled additional deployment relative to the

12A CPI Report
Supporting Renewables while Saving Taxpayers MoneySeptember 2012
PTC alone. To assess if the project could have been built under a PTC, they analyzed the finances of wind proj-ects deployed using the 1603 Cash Grant and found that roughly 2.4 GW out of the nearly 10 GW of wind projects built in 2009 would not have gone forward under a PTC.
High transaction costs for tax equity – The U.S. Partnership for Renewable Energy Finance’s (US PREF) 2011 report on tax equity and tax credits estimated the difference in transaction costs between financing a solar project using the ITC and tax equity relative to a 1603 Cash Grant and debt financing. Their results are used as financial inputs to our models (see Table A.2 in Appendix A). Further, they noted that tax equity structures are diffi-cult to leverage. This is because many tax equity investors are institutional investors with constrained risk profiles, so they are often loath to allow their tax equity investment to be subordinated to project-level senior-term debt.
The 1603 Cash Grant can cut government costs per MWh in half relative to the PTC – The Bipartisan Policy Center’s (BPC) 2011 report cited analysis by Bloomberg New Energy Finance (BNEF) in 2010 that found the 1603 Cash Grant could have provided the same benefit to investors as a PTC for roughly half the total budgetary cost for projects deployed between 2004 and 2008.
The 1603 Cash Grant had much higher overall costs to government than initial expectations – The Majority Staff of the House Committee on Energy and Commerce, Subcommittee on Oversight and Investigations released a report assessing the impact of the 1603 Cash Grant. They note that the program is costing the government much more than initially anticipated. From the work of Bolinger et al., this appears to be the result of the 1603 Cash Grant leading to additional deployment relative to the PTC.
The ITC pays for itself and provides the government with a 10% return – US PREF (2012) teamed up with SolarCity and performed a tax analysis of a residential solar system and found that over the life of the project, the tax revenue from electricity sales significantly exceeds the cost to government of providing the ITC, in fact pro-viding a 10% annual return above the amount provided.
Feed-in-Tariffs are more cost-effective than tax incen-tives – BNEF (2011) examined the relative cost-effec-tiveness of various types of incentives used globally. In particular, they compared the impact of a feed-in-tariff and a production tax incentive of the same level on the cost of electricity of a wind project. They found that feed-in-tariffs could deliver greater reductions to the cost of electricity for the same level of incentive.
We will discuss the implications of our work on these claims in the concluding section of this report.

13A CPI Report
Supporting Renewables while Saving Taxpayers MoneySeptember 2012
3 How are We Assessing Federal Policy Impact and Cost-Effectiveness?We use project financial modeling to evaluate the impact of current federal incentives on the cost of electricity generated by three typical utility-scale renewable energy projects—a large wind, a small solar PV, and a large solar PV facility. We focused on utility-scale projects because they represent the bulk of renewable energy generation. These three cases represent the majority of currently installed capacity (large wind), the majority of installed projects (small solar PV) and account for the largest share of recent deployment growth (large solar PV). Assumptions are based on the actual costs, financing, and operation of renewable energy projects financed over the last few years.
In this section, we begin by describing the project data that we analyzed, the model used for the analysis, and the outputs of the model relevant to addressing federal policy impact. We end the section with a discussion of some key strengths and limitations of using project financial model-ing to address federal renewable energy policy impact and cost-effectiveness.
3.1 Getting Cases from Actual Project StatisticsTo address the impact and cost-effectiveness of federal incentives, we began by collecting data on the timing, cost, performance, and financing structures and condi-tions of utility-scale renewable energy projects which were either financed or deployed in the U.S. between 2008 and mid-2012. The data is summarized in greater detail in Appendix A, but the key project data needed to faithfully capture the cost of electricity and the most important sources used to obtain them were:
• Project costs and timelines – We used cost and timelines from Bloomberg New Energy Finance’s
proprietary database of projects either financed or deployed from 2009-12.
• Project performance – We used the historical performance of most large renewable generators from the Energy Information Administration’s project database operating from 2008-11, along with electricity market and time of use data from various sources.
• Financial structures – We used published ranges of expected after-tax returns to investors, debt conditions, and examples of financial structures and requirements from a number of sources (LBNL, US PREF, Mintz-Levin, S&P, Moody’s).
We used the distribution of project sizes to identify clus-ters of projects which could be reasonably modeled by single representative cases. Based on the size and total generating capacity of those clusters, we chose three of particular importance. We used the median values for key technical characteristics of each of those three clusters to define generic project cases—a large wind farm, a small utility-scale solar PV facility, and a large solar PV facility. All cases were assumed to have been financed in mid-2010 for our policy impact analysis, roughly the mid-point of the range of project financing dates we studied.
Table 2 summarizes the basic characteristics of the three 2010 cases.
Looking forward to potential policy impacts and cost-effectiveness in 2013, we use modified assumptions based upon recent market conditions (Table 3).6 The key changes relative to 2010 are: updated costs for wind and solar PV; improved performance for wind; increased size for large PV; slightly lower tax equity costs for solar PV; and revised policy settings (ITC for solar, and we assume the PTC for wind is extended to 2013).7
6 Key sources are US PREF (2012), Wiser et al. (2012) and Chadbourne & Parke (2012).
7 Our assumptions for cost and performance are based on work by LBNL and NREL on recent trends in wind turbine costs - http://eetd.lbl.gov/ea/ems/
CASE SIZE(MW)
CAPACITY FACTOR (%)
COST($/W) RATIONALE
Small Solar PV 1.2 18 6.0 Majority of deployed projects
Large Solar PV 15 24 4.2 Greatest deployment growth
Large Wind 131.5 31 2.1 Majority of deployed capacity
Table 2: Basic details of the three representative 2010 cases
CASE SIZE(MW)
CAPACITY FACTOR (%)
COST($/W)
Small Solar PV 1.2 18 2.2
Large Solar PV 60 24 2.2
Large Wind 131.5 39 1.8
Table 3: Basic details of the three 2013 cases

14A CPI Report
Supporting Renewables while Saving Taxpayers MoneySeptember 2012
Full technical and financial inputs for all 2010 and 2013 cases are provided in Appendix A.
3.2 From Case Data to Impact and Cost-EffectivenessWe developed a levelized cost of electricity (LCOE) cal-culator and financial model to take the available technical and financial characteristics of a case in a given policy scenario and calculate:8
1. The impact of federal incentives and financing costs on the cost of electricity to ratepayers
2. The total cost to state and federal government to achieve a given cost of electricity to ratepayers
Here, we will describe the methods used to arrive at the two metrics and discuss the interpretation of the results.
3.2.1 Determine the financing structure used for each case and policy scenarioFor each case and policy scenario, we first used the LCOE calculator to determine the lowest cost of electricity that could be achieved while meeting all financing require-ments. Specifically, we:
• Determined possible financial structures – We used published data and studies to manually define a list of potential financing structure scenarios (e.g. with or without debt, tax equity, construction financing), each accompanied by specific required investor returns. We relied heavily on the recent work of Mark Bolinger and collaborators at LBNL and NREL regarding the specific tax equity structures used (see, for example - http://eetd.lbl.gov/ea/ems/reports/lbnl-2909e.pdf).9
reports/wind-energy-costs-2-2012.pdf. Specifically, we use the average of the projected 2013 capacity factors and costs of all technology options expected to be available for a wind regime corresponding to our 2010 large wind case (roughly 6.5 m/s – see Table A-2).
8 The cash flow model is based on a financial model previously developed by CPI; see Appendix A.1 of http://climatepolicyinitiative.org/publication/the-impacts-of-policy-on-the-financing-of-renewable-projects-a-case-study-analysis/. The additional capabilities of the LCOE calculator and cash-flow model used to perform this calculation are described in Appendix B.
9 We do not include leveraged tax equity structures in this analysis as very few projects have employed these structures to date, due to concerns with subordi-nation of tax equity structures to project-level debt (see discussion in US PREF (2011)).
• Calculated the cost of electricity for each financial structure - For each financing structure, we used the LCOE calculator to compute the additional revenue above market prices needed to simultaneously:
» Maximize debt volume – This is determined by the requirement that the cash flow available to pay debt in each period exceeds the required payment by a certain Debt Service Coverage Ratio (DSCR).
» Meet all investor return requirements – This is determined by the requirement that the cash flows for each equity or tax equity investor reach their required internal rate of return (IRR) at the appropriate time while optimizing the tax equity financing arrangement (within the constraints of IRS rules) to minimize the cost of electricity.10 The financial model of the project is used to verify that the additional revenue for each financing structure does indeed allow the project to meet the relevant IRR and DSCR requirements.
• Picked the financial structure with lowest final cost of electricity – We manually selected the financial structure that resulted in the lowest final cost of electricity, and modeled the cash and tax flows assuming the use of that structure for further calculations.
3.2.2 Calculate the impact of federal incentives on the cost of electricityWe used the model of the cash and tax flows of the lowest cost structure to assess the impact of federal pro-visions on the cost of electricity in each case and policy scenario. Specifically, we:
• Calculated a counterfactual cost of electric-ity without incentives – We used the cash flow model to calculate levelized cost of electricity for each project, assuming that it was financed by a regulated utility as an investment on its balance sheet without any incentives—that is, using a discount rate equal to the utility cost of capital.11
10 We do not, however, model capital adequacy requirements.11 The regulated utility cost of capital is often used as a benchmark for appropri-
ate capital costs for generation assets, due to the prevalence of rate of return regulation. In this case, we used the cost of capital calculated by the California

15A CPI Report
Supporting Renewables while Saving Taxpayers MoneySeptember 2012
We believe that this provides a realistic baseline cost of electricity without policy support.
• Compared the counterfactual and the actual cases to capture the impact of incentives - We then calculated the contribution of incentive and financing cash and tax flows to the difference in levelized cost between the utility financed coun-terfactual case and the actual financing.
For example, consider the large wind case in 2010 assum-ing the use of a 1603 Cash Grant and debt. Figure 2 sum-marizes the results of our analysis where the terms are defined as follows:
• Cost to utility without incentives – The cost of electricity ($96/MWh for wind) in the absence of federal incentives, assuming on-balance sheet financing by a utility with roughly 8% weighted average cost of capital in the middle of 2010.
• Project financing costs – The costs or savings associated with using project-level equity and debt financing as compared to balance sheet financing by a utility. This includes the relative cost of capital (for wind, a $5/MWh saving), financing fees ($1/MWh cost for wind), and costs associated with carrying tax benefits forward ($9/MWh cost for wind).
• Federal incentives – The reduction in the cost of electricity due to federal incentives (roughly 34% of total costs for wind, including $24/MWh from the 1603 Cash Grant and $11/MWh from acceler-ated depreciation and 50% bonus depreciation).
Public Utilities Commission for the 2009 Market Price Referent, 8.25%.
• Market price for electricity – The expected after-tax revenue from electricity sales at projected future national average wholesale market prices (taken from EIA’s 2010 Annual Energy Outlook) adjusted for the time of use (about $39/MWh for wind).
• Cost gap – The difference between the final cost of electricity and expected market prices for the electricity generated ($26/MWh for wind). This gap must be covered by additional project revenues from ratepayer or state/local government funds.
Note that the final cost of electricity—the after-tax revenue needed per MWh of electricity generated to meet investor return requirements after federal incen-tives—is the sum of the market price for electricity and the cost gap ($65/MWh for wind).
3.2.3 Calculate the cost of the federal incentive to all levels of governmentWe then calculated the cost to all levels of govern-ment (either in the form of direct payments or foregone tax revenues) of policy supports utilized by the project (such as grants, tax credits, accelerated depreciation, or deductions of interest expenses). This cost was calcu-lated as the present value of all flows to government discounted using zero-coupon treasury security yields of the appropriate maturity.12 That is, we are assuming that any impact on government cash flows is marginal and therefore must be financed through a government debt transaction (either the purchase or sale of a trea-sury security). Note that since we are computing costs to all levels of government, this is implicitly assuming that marginal shifts in state government finances are enabled by transfers from the federal government.13
The cost to government of an incentive isn’t just captured by the direct cash flows associated with, for example,
12 These are bills, notes, or bonds depending on the maturity—we refer to them just as treasuries.
13 The focus on combined cost to all levels of government arises from a modeling limitation—our model currently uses a blended state and federal tax rate for calculations. Another consequence of this is that we cannot separately distinguish state and federal tax benefit carry-forward. This could, therefore, underestimate the cost to government of carrying forward federal tax credits (but not deductions). However, as all the financial structures we consider in policy scenarios with tax credits involve the use of tax equity, this issue does not affect our current analysis.
Figure 2: The impact of federal incentives on the large wind case in 2010 with a 1603 Cash Grant
96
4
34
Cost to Utility without Incentives
Project Financing Costs
Federal Incentives
Market Price for Electricity
Cost Gap 26
39
0 100755025Cost of Electricity (USD / MWh)

16A CPI Report
Supporting Renewables while Saving Taxpayers MoneySeptember 2012
foregone tax revenues due to the tax incentive. The choice of incentive may affect the extent to which the project utilizes other federal tax provisions—such as accelerated depreciation or business interest deduction tax benefits. For example:
• The use of an investment tax credit reduces the depreciable basis of the facility by 50% of the value of the investment tax credit, thereby reducing the cost to government of the acceler-ated depreciation benefit.
• A production-based cash incentive in lieu of a PTC provides additional project cash flow that may allow the project to take on a larger loan than it would have without the incentive. As the interest on the larger loan is tax deductible, this increases the cost to government of the interest deduction.
However, accelerated depreciation and interest deduc-tion tax benefits are broadly provided across industries in order to correct for the distortion of economic activ-ity associated with corporate income taxation.14 Further, when a legislative proposal for an incentive is scored (that is, assigned a cost either by the Congressional Budget Office or the White House Office of Management and Budget) interactions of this form are not included, as those broader investment tax provisions are treated at a macroeconomic level and scored using relations to expec-tations of investment growth. So, we separately report the incentive cost—the cost to state and federal government that results directly from the incentive alone and is rel-evant to scoring—and the change to the cost of acceler-ated depreciation and interest deduction tax expenditures resulting from the interaction. The sum of these two costs is the total cost to state and local governments of provid-ing the incentive at a project level.
Take, for example, the large wind case. We calculate the cost of a 1603 Cash Grant to state and federal govern-ment by calculating cash flows to and from government associated with the provision of the cash grant alone, discounted at treasury rates. This yields an incentive cost of $18 / MWh. The loss in tax revenues associated with accelerated depreciation is $5 / MWh, and the loss in tax revenues associated with the provision that enables busi-nesses to deduct interest payments on debt as expenses for tax purposes is $5 / MWh. This comes to a total cost to federal and state government of $28 / MWh.
14 See, for example Zee et al. (2002)
Even more broadly, you could consider how sales of power from the project impact tax revenue (e.g., see US PREF, 2012 undertaken in collaboration with SolarCity on the tax revenue impact of the ITC). However, such rev-enues are part of the base tax code; if the incentive had not redirected investment and consumption to the renew-able energy facility, greater investment and consumption would likely have occurred elsewhere, with associated tax revenue. So, we exclude those tax collections from our analysis.15
3.3 Limitations and OpportunitiesProject-level analysis like this can provide precise answers to questions regarding the costs and benefits of policies at a micro-level. However, it can leave out many criti-cal costs or benefits which are often only visible when looking across project portfolios, at the broader economy, or over longer time periods. For example, this analysis doesn’t capture policy impacts on innovation and tech-nology costs. The analysis also does not address in detail how the impact and cost-effectiveness of federal poli-cies may vary across the country due to the interaction of federal policies with the multitude of different state policies (such as Renewable Portfolio Standards). System-wide issues which can be affected by the nature of the incentive provided, such as grid reliability and stability, are also beyond the scope of this analysis.
We do not address macro-economic impacts of polices—on energy markets, prices, demand, and on the supply and cost of capital. So we cannot estimate the overall magnitude of the impact of policies on likely deployment rates, and therefore only provide estimates for the impact of policies per unit of electricity generated. However, our analysis of cost-effectiveness only compares policy scenarios which deliver the same benefits to the project as current policies. Therefore, we can (and do) reasonably assume that the scenarios would result in similar levels of deployment.
In spite of these limitations, careful accounting of costs and benefits at the project level can help evaluate policy impact and cost-effectiveness. This careful accounting captures the direct financial impacts of the incentives,
15 We note that this argument fails if such counterfactual private activity is significantly less likely—for example, in the case of a depressed economy, where fiscal policy may stimulate truly additional economic activity. However, in that case, the more appropriate question may be if the incentive has a higher economic multiplier than other forms of fiscal spending.

17A CPI Report
Supporting Renewables while Saving Taxpayers MoneySeptember 2012
provides a reasonable first approximation to understand-ing their impacts, and can deliver insights robust and simple enough to help build consensus for policy change.

18A CPI Report
Supporting Renewables while Saving Taxpayers MoneySeptember 2012
4.1 Federal Incentives and Project Viability in 2010
Figure 3: Impact of federal incentives on projects financed in 2010
Cost of Electricity (USD / MWh)
0 100 0 100 200 300 400 0 100 200
Federal incentives available to projects financed in 2010—specifically the 1603 Cash Grant and accelerated depreciation—bridged roughly half the gap between the costs of renewable electricity generation and expected market prices for electricity.
Project finance structures with project level debt and sponsor equity had the lowest cost for all cases. While project costs varied across technologies and sizes, federal incentives were not enough to bridge the gap between electricity generation costs and market prices for elec-tricity for the vast majority of projects financed in 2010. Therefore, deployment of wind and solar has proceeded largely in areas where complementary state, local, or ratepayer policies apply (e.g. an RPS requirement), in regions with significantly higher than average wholesale electricity prices, and/or in places where conventional electricity generation development is constrained.
4 Importance of Federal IncentivesAbsent incentives, the cost of electricity from wind and solar PV still exceeds current market prices in much of the U.S. Policy supports are employed to bridge the gap between the cost of renewable electricity and the price at which that electricity can be sold on wholesale electric-ity markets. These supports are provided for a number of reasons – for example, to correct for the fact that some of the benefits of renewable energy generation, such as avoided carbon emissions, are not yet reflected in market prices. These supports can also come from a number of sources: ratepayers (through requirements imposed by state or federal regulators), state and local governments, or federal incentives. To explore the relative importance of federal incentives, for each of the three project types, we:
• Modeled the most widely used incentive and financial structures for projects financed in mid-2010 and those expected in 2013 assuming extension of current policy,
• Computed the impact of the incentive on the cost of electricity, and
• Compared it to the remaining gap to wholesale market prices.
96
4
34
39
26
Cost to Utility without Incentives
Project Financing Costs
Federal Incentives
Market Price for Electricity
Cost Gap
404
47
174
50
228
218
12
92
50
89
Large Wind Small PV Large PV

19A CPI Report
Supporting Renewables while Saving Taxpayers MoneySeptember 2012
4.2 Were Federal Incentives Necessary? spending if federal renewable energy incentives had been removed.
• The recession’s impact on electricity demand made additional ratepayer support unlikely. The impact of the recession on ratepayers was similarly stark. Unemployment reached nearly 10%. According to FERC, electricity demand in the U.S. fell by 4.2% in 2009 due to decreased economic activity (the steepest drop in 60 years). As a result, utilities and the relevant regulators would have faced an exceptionally difficult business and political environment for making a case to increase retail rates to cover additional costs of new renewable electricity generation.
• European states facing fiscal constraints pulled back renewable energy policies but U.S. states did not. Nevertheless, renewable energy deployment in the U.S. continued to grow during the recession, and most state renewable energy targets prior to the recession were either maintained or strengthened. This is in marked contrast, for example, to the impact of the downturn on renewable energy deployment in Europe. E.U. Member States facing significant fiscal constraints—such as Spain and Italy—abruptly curtailed their renewable energy policy ambitions in the absence of E.U.-wide fiscal support analogous to the support provided by federal incentives to U.S. states.
Thus, we believe that additional state or ratepayer support was not likely and that federal policies were criti-cal to the recent growth in renewable energy deployment. Due to the continued weakness of the global economy, it does not appear that the budget and demand constraints noted above are likely to ease in the near term. Further, as we noted in the introduction, current state policies alone do not appear to be strong enough to sustain the level of growth in renewable energy deployment seen over the last four years. The PTC was allowed to expire at the end of 2001 and 2003 when wind faced similar market condi-tions, leading to booms just prior to expiration followed by substantially lower deployment in the year after. As a result, it is likely that the expiration of federal incentives, in particular, the PTC for wind, could lead to significantly reduced levels of annual renewable energy deployment in the near future, another boom and bust cycle for renewables.
Over the last decade, a number of states have imple-mented renewable energy policies such as binding targets for renewable energy generation or state tax concessions. These policies often include mechanisms to cover the gap between the cost of renewable electricity generation and market prices for electricity. These may involve explicit funding or subsidies such as tax concessions, rebates, or separate state funds for renewable energy. Others may involve implicit support—for example, regulators may be empowered to authorize increases in retail electricity prices to cover a utility’s incremental costs for compliance with renewable energy targets.
In theory, states with such policies in place could have covered the cost gap in the absence of federal support through the increased use of such mechanisms. However:
• State budget constraints from the recession made increasing support from states unlikely. The global economic downturn, which began with the financial crisis of 2008, was particularly difficult on state budgets. Significant tax revenue losses associated with economic contrac-tion along with increased mandatory spending to provide services to those impacted by the downturn (such as through Medicaid insurance) created significant fiscal pressures in nearly every state.16 While the American Reinvestment and Recovery Act provided $145 billion to state and local governments to help them cope with the downturn, this covered only about 40% of state deficits and states were nevertheless forced to make severe cuts to essential services. The cuts were particularly severe in states with balanced budget requirements. These constraints made it unlikely that states would have increased
16 See for example - http://www.brookings.edu/research/reports/2011/10/27-state-budgets-gordon
In theory, states or ratepayers could have increased their support to bridge the cost gap in the absence of federal support. In prac-tice, the global recession and the resulting state fiscal constraints made such additional support unlikely.

20A CPI Report
Supporting Renewables while Saving Taxpayers MoneySeptember 2012
could be viable in some regions without complementary state policies. As existing state policies can only drive limited growth, this could encourage significant additional deployment and avert a significant contraction of the renewable energy industry.
Solar PV has seen even steeper cost reductions but still requires some support beyond federal incentives. Nevertheless, the cost gap is closing. If U.S. utility-scale installations in 2013 can match Germany’s average installed costs for small ground-mounted solar PV instal-lations in mid-2012 (about $2.20/W—a conservative assumption, given smaller installations are generally more expensive than larger ones) large solar PV would face a market price gap after federal subsidies of about $33/MWh, about a third of the gap seen in 2010. This sug-gests that solar PV could soon be cost-competitive in states with particularly good solar resources, higher than average electricity prices, or even modest complementary policies.
Despite these gains, a number of challenges could significantly diminish the competitiveness of renewable technologies in the near term. These include a significant fall in expected electricity prices due to falling natural gas prices and softer economic growth, the risk of cur-tailment, and international renewable technology trade disputes.
4.3 Federal Incentives and Project Viability in 2013
Unlevered tax equity financing leads to the lowest cost of electricity for all three cases in 2013.
Turbine performance improvements and lower turbine contract prices mean the unsubsidized cost of wind electricity coming on-line could drop by nearly 30% from $96 in 2010 to $67/MWh in 2013. If the PTC were extended through 2013, federal incentives alone (the PTC and accelerated depreciation, with tax equity financing at current costs) could cover nearly the entire gap for an average wind project, leading to a final cost of electric-ity of $46/MWh, within $6 of expected average market prices for the electricity generated. At these prices, wind
Rapid reductions in generation costs for both solar PV and wind over the past two years have substantially narrowed the cost gap. If these trends continue and the PTC is sus-tained, wind could be almost viable in 2013 based on federal incentives alone, leading to wind deployment in states without other support policies.
Cost of Electricity (USD / MWh)
Figure 4: Impact of federal incentives on projects built in 2013
67
3
25
40
6
Cost to Utility without Incentives
Project Financing Costs
Federal Incentives
Market Price for Electricity
Cost Gap
155
43
73
50
75
116
10
43
50
33
0 100 0 100 200 300 400 0 100 200
Large Wind Small PV Large PV

21A CPI Report
Supporting Renewables while Saving Taxpayers MoneySeptember 2012
5 Cost-Effectiveness of Federal IncentivesThe form of the incentive provided can significantly impact the cost of financing a project. This issue is par-ticularly acute with tax incentives:
the tax benefits have only a third of their potential value to the project.
This motivates project developers to bring in an outside investor with such tax liabilities—a tax equity investor—to monetize the tax incentive and finance the project. However, the high cost of tax equity financing only allows project developers to realize two-thirds of the full value of the tax benefits ($15/MWh, at a cost to governments of $21/MWh). Thus, the costs associated with tax equity finance substantially reduce the impact and cost-effec-tiveness of the incentive.
To quantify how these issues impact the relative cost-effectiveness of current federal policies, we:
• Calculated the cost of electricity for each 2013 case assuming current policy, the use of project-level debt, and project owners without outside tax liabilities. Assuming current policy (ITC for solar PV, PTC for wind), we calculated the cost of electricity in the lowest-cost project finance structure. We assumed that project owners and investors did not have any tax liabilities from other businesses they expected to use to offset the tax benefits generated by the project.
• Determined the level of alternative incentives which achieve the same cost of electricity. For each alternative policy (a 1603 Cash Grant, PTC, ITC, non-taxable cash incentive for production, or a taxable cash incentive for production) we used the levelized cost of electricity (LCOE) calculator
Project stakeholders must have significant, predictable tax liabilities to make use of federal tax incentives. In prin-ciple, this promotes renewable energy business models which are more profitable and more likely to be sustain-able. Unfortunately, project owners do not typically have sufficient tax liabilities—whether from the project itself or other business activities—to use the tax benefits as they are generated.
For a large wind project with debt in 2010, the PTC and accelerated depreciation benefits reduce the cost of electricity by $24/MWh (at a cost to governments of $21/MWh) if the investor has enough tax liabilities from other business activities to use all the tax benefits as they are generated by the project. However, the value of these incentives is just $8/MWh (at a cost to governments of $11/MWh) if the investor does not have tax liabilities from other business activities. So, without outside tax liabilities,
Cash incentives are a more cost-effective way to support projects than tax incentives.
0
5
10
15
20
0
20%
60%
80%
100%
40%
Valu
e of
tax
ben
efit
s to
la
rge
win
d pr
ojec
ts (
$/M
Wh)
Value of tax benefits as a percentage of
cost to government
Project owners without outside
tax liabilities
Tax equity financing
Project owners with outside tax liabilities
Project owners without outside
tax liabilities
Tax equity financing
Project owners with outside tax liabilities
Figure 5: The value of tax incentives to projects (reduction in cost of electricity) relative to their cost to government

22A CPI Report
Supporting Renewables while Saving Taxpayers MoneySeptember 2012
to determine the level of incentive required to achieve the same cost of electricity. This is not consistent with current policy, as the ITC is fixed at 10% or 30% of project costs, while the PTC is fixed at either $11/MWh or $22/MWh—however, it is necessary to make a meaningful comparison of their relative cost-effectiveness. We choose the project finance structure which leads to the lowest level of incentive for each policy scenario (unlevered tax equity for the ITC and PTC; debt and equity for the other three), again, assuming that project owners do not have outside tax liabilities.
• Calculated the cost to the state and federal government. We then determined the total cost to state and federal government for providing the incentive for each case and policy scenario.
5.1 Small Solar PV in 2013 and 1603 Cash Grant
The current 30% investment tax credit (ITC) for an
average small PV project in 2013 would cost federal and state governments $31/MWh. A 14% 1603 Cash Grant would provide the same benefit to the project and its investors for a 57% lower cost to government. It would take a $56/MWh production tax credit (PTC) to get the same benefit; this would cost governments 13% more than the ITC. Thus, the federal government could provide greater benefits to small solar PV projects at lower unit cost by offering a 1603 Cash Grant for between 14 and 30% of eligible project costs, in lieu of the ITC (Figure 6). As shown in Figure 9 below, the same would be true for large solar PV.
The differences in cost to government reflect the impact of differing levels of risks associated with the timing and nature of the benefits delivered to project stakeholders:
• The timing of the incentive – Up-front investment incentives reduce the overall need for and cost of financing. Thus they deliver greater benefits to the project for every dollar of government spending.
• The ability of investors to use the tax benefits – Cash incentives can be used by any investor, whereas tax benefits require tax liabilities. Tax equity investors take the risk that they may not have enough tax liabilities to use the tax credits, so they demand a higher return. This accounts for the difference between the cost to government of the ITC and the 1603 Cash Grant. The PTC is further impacted by the timing and variability
For small solar PV in 2013, a 14% 1603 Cash Grant could provide the same benefit to the project as the current ITC at half the cost to state and federal governments.
Figure 6: Small PV policy options – costs and risks to federal and state governments
SMALL PV
RELATIVE RISK
Low High
Alternative incentives with identical benefits
$56/MWh PTC
14% 1603 Cash GranT
$24/MWh non-Taxable Cash for ProduCTIon
$30/MWh TCP
Current policy: 30% ITC
Ince
ntive
pr
ice ri
sk
Proj
ect r
isk
30 35
+13%
-51%
-64%
-57%
2510 200 5 15
Incentive cost to federal and state governments ($ / MWh)

23A CPI Report
Supporting Renewables while Saving Taxpayers MoneySeptember 2012
of the tax benefits, which are tied to the level of annual production from the facilities. Investors need to be sure that they have tax liabilities every year over ten years with enough of a cushion to account for varying levels of annual production to make full use of PTC benefits.
The PTC fixes the cost to the federal government for every MWh of renewable electricity produced. In con-trast, investment-based incentives (ITC or 1603 Cash Grant) provide the same subsidy for any given investment independent of the quality of the renewable resource or the performance of the project: This leads to variable rewards per MWh. Our analysis suggests that this varia-tion is significant across existing solar PV power plants; comparable investment-based incentives translate to a nearly 70% variation in the per MWh cost of the subsidy to government.
Investment-based support enables government to share the burden of technology cost risks with investors. This makes sense for the scale-up of innovative technologies. However, it is less justified for mature technologies such as wind and solar PV, where developers and investors can manage cost risks through market measures such as con-tractor cost guarantees and competitive sourcing. Further, as investment-based support allows investors to realize targeted returns very early, it provides a weaker incen-tive to invest in the best resource or maintain or improve ongoing production. While it is too early to conclusively judge the effect on U.S. solar PV development, we can see some hints of this weakness in the variation in capacity factors observed in EIA solar PV power plant operations data.
While the ITC and the 1603 Cash Grant are less expensive than the PTC for the average project, they allocate some project cost risks to the government.
The 1603 Cash Grant is particularly valuable for smaller projects where the fixed transac-tion costs of tax equity financing can exceed the value of those benefits.
Cash incentives for production could reduce costs to government and, at the same time, allocate project cost risks to developers and investors (Figure 6). However, these increase the incentive price risk to government, as discussed in section 5.3 below.
For the small solar PV facilities, a 1603 Cash Grant led to a cost of electricity at least $15/MWh lower than any financing structure with a tax credit. This is largely due to the fixed financial fees associated with obtaining tax equity financing for small projects, equivalent to $29-38/MWh generated. On the other hand, the large solar PV case yielded essentially equivalent cost of electricity with the ITC and 1603 Cash Grant (see Figure 9 and the subse-quent discussion).
5.2 Large Wind in 2013 and a Taxable Cash Incentive for Production (TCP)
As we saw in the last section, a good federal incentive for renewable energy:
1. Delivers benefits efficiently to the investor by minimizing timing and liquidity risks, and
2. Allocates project risks to the parties best able to manage the risks (i.e., for emerging technologies, risks are shared between the private sector and government; for mature technologies, risks are managed by the private sector).
Unfortunately, none of the current federal incentives can do both of these things, at least for wind. Here, we explore a new option—a taxable cash incentive for production (TCP)—which could fulfill both these requirements. Under a TCP, the federal government would provide projects with periodic cash payments based upon actual renewable production. These cash payments would be treated as taxable income.
Replacing the $22/MWh PTC for a wind project in 2013 with a TCP of $21/MWh can provide the same benefits
A $21/MWh TCP in lieu of the $22/MWh PTC could provide the same support to wind proj-ects at about half the cost federal and state governments, without shifting project risks to government.

24A CPI Report
Supporting Renewables while Saving Taxpayers MoneySeptember 2012
to the project (the same cost of electricity while meeting all financing requirements) but at just above half the cost to state and federal government. It provides many of the benefits of the 1603 Cash Grant, without shifting project risks which can be better managed by the private sector to the government (Figure 7).
As we noted in the last section, extension of the PTC could see accelerated deployment as wind becomes viable in some states without complementary policies. A move to a TCP could substantially reduce the associated impact on federal budgets or enable a longer-term exten-sion at similar total cost.
The TCP incentive is essentially equivalent to a Feed-in-Premium (FiP), but is paid directly by the federal govern-ment rather than through ratepayer funds. The greater cost-effectiveness of a Feed-in-Premium relative to tax incentives was noted in BNEF (2011), and is consistent with our results. Hudson Clean Energy Partners proposed a similar—but not taxable—cash production incentive in 2009 (see BPC (2011)). The non-taxable cash produc-tion incentive is less expensive than the PTC because it eliminates the risks and costs associated with monetizing tax benefits. The taxable cash incentive saves even more for the following reasons:
• Greater cash available for debt service enables higher leverage, reducing financing costs - While an up-front subsidy can reduce the requirement for expensive tax equity, the additional cash flow available for debt-service provided by a TCP can
support greater project-level debt. As debt is generally significantly less expensive than equity, this reduces financing costs.
• Greater debt increases interest tax benefits - As the interest on debt is tax deductible, the TCP allows developers to take advantage of this existing tax benefit.
• Greater taxable revenue monetizes acceler-ated depreciation benefits - Further, as the cash incentive is taxable, it provides the project with additional tax liability early in the project life. This allows developers to monetize accelerated depre-ciation tax benefits without the use of tax equity, thereby further lowering financing costs.
As a result, reductions in total cost to government are not quite as large as reductions in incentive costs. Specifically, the cost to government of the interest tax deduction pro-vided to the project for a TCP is roughly $1/MWh higher than that of the non-taxable cash production incentive due to the greater use of debt. Further, as the ITC and 1603 Cash Grant reduce the depreciable basis of a facil-ity, while production-based incentives do not, the cost of depreciation benefits using a production-based incentive are about $2/MWh higher. Thus, the reduced cost to government of the TCP is in part offset by the increased use of existing investment tax benefits. For large wind, the total cost to federal and state governments of a $21/MWh TCP including accelerated depreciation and interest tax benefits is 21% lower than the total cost of the $22/MWh PTC (Figure 8).
Figure 7: Large wind policy options – costs and risks to federal and state governments
Incentive cost to federal and state governments ($ / MWh)Alternative incentives with identical benefits
LARGE WIND
RELATIVE RISK
Low High
37% ITC
30% 1603 Cash GranT
$18/MWh non-Taxable Cash for ProduCTIon
$21/MWh TCP
Current policy: $22/MWh PTC
Ince
ntive
pr
ice ri
sk
Proj
ect r
isk
-10%
-27%
-20%
-42%
100 5 15

25A CPI Report
Supporting Renewables while Saving Taxpayers MoneySeptember 2012
Like BPC (2011) and BNEF (2010), we also found that the 1603 Cash Grant could be significantly more cost-effective than the PTC. Our estimated reduction in cost to government is roughly 25%, lower than BNEF’s estimate of 50% per project. We believe that this difference is likely explained by:
• Our use of discounting by treasury interest rates to calculate costs to government rather than an undiscounted sum of nominal costs over multiple years.
• The difference in tax equity spreads from 2009-2011 relative to BNEF’s calculation which considered tax equity market conditions for projects from 2004-2008.
5.3 Large Solar PV in 2013 and Incentive Price Risk
The current 30% investment tax credit (ITC) for a large solar PV project in 2013 would cost federal and state governments $20/MWh. It would take a $36/MWh pro-duction tax credit (PTC) to deliver the same benefit; this would cost governments 13% more than the ITC. A 15% 1603 Cash Grant could provide the same benefit to the project and its investors for half the cost to governments of the ITC.
Cash incentives for production could reduce costs to government and, at the same time, allocate project cost risks to developers and investors. The TCP reduces costs to government across the range of projects analyzed, although the price level that provides equivalent benefits to the existing ITC varies depending on the project size and other characteristics. For example, a $22/MWh taxable cash incentive for production (TCP) could provide the same benefit to a large solar PV project in 2013 as the ITC, at 60% lower costs to government; while a $30/MWh TCP could provide the same benefit to a small solar PV project as the ITC, at 64% lower costs to government. Thus, the federal government could provide the same benefits to solar PV projects as the current 30% ITC, at lower unit cost, by offering a TCP in lieu of the ITC. The government would also benefit by shifting project perfor-mance risks back to the private sector.
A TCP incentive could reduce government costs by 60% for a large solar PV facility, but the move to a fixed-price production incentive brings new risks to government.
Figure 8: Cost of accelerated depreciation and interest deduction benefits to federal and state governments: Large wind facility in 2013. All scenarios deliver equal benefits to the large wind facility.
Current Policy: $22/MWh PTC
37% ITC 30% 1603 Cash Grant
$18/MWh Non-taxable Cash
for Production
$21/MWh TCP
14
12
10
8
6
4
2
0
Cost
to
Fede
ral a
nd S
tate
Go
vern
men
ts (
$/M
Wh)
Incentive cost to Federal and State Governments
Accelerated Depreciation
Cost
Interest Deduction
Cost
LARGE WIND
Note: The ITC and PTC case do not include project level debt and therefore have no government cost associated with the interest tax deduction at the project level.

26A CPI Report
Supporting Renewables while Saving Taxpayers MoneySeptember 2012
However, this move would increase the incentive price risk borne by government. In general, when government sets the level of an incentive, it bears the risk that the level it sets may not be appropriate. This is particularly acute for production-based incentives, where govern-ment directly sets a price level. It is less problematic for the investment-based incentives because they scale with costs (though not directly with prices).
In both cases, if the government sets the incentive too low, it may not be enough to drive significant deployment. To the extent that state and ratepayer funds are able to make up the difference, this risk is somewhat mitigated in the U.S. However, as discussed in section 4, additional support for renewables from states and ratepayers is not likely in the near future.
If the incentive level is set too high, deployment may boom very quickly. This would result in ballooning costs that may be difficult to predict or control. This risk has been particularly problematic in the case of production-based incentives for solar PV due to rapidly evolving tech-nology costs and performance (as well as the small lead times for deployment). This has been borne out by experi-ence in Europe: Costs for solar PV feed-in-tariffs (FiT) and feed-in-premia (FiP) in Spain and Italy exploded due to much-higher-than-expected deployment driven by plum-meting solar PV costs over the last few years, resulting in unexpected policy shifts which created subsequent indus-try busts. Solar PV costs have now fallen far below any historical nominal benchmarks. There is great uncertainty
about the future cost trajectory and even significant varia-tion in solar PV costs across geographies.
This risk is mitigated with current U.S. policy: a stable ITC in place until the end of 2016. Additional analysis would be needed to determine whether the savings associated with the TCP are sufficient to outweigh the increased risk associated with setting an appropriate price level. Absent this analysis, we cannot be sure the TCP would deliver net benefits to the government, relative to a 1603 Cash Grant.
For wind projects, the federal government already bears incentive price risks through the current PTC. Thus, a switch to the TCP involves no additional risk to govern-ment. Further, the price risk is less intense for wind than solar. While wind costs have come down substantially in the last two years, on balance, they have been rela-tively stable over the last decade. This has been borne out by recent experience: FiTs and FiPs for onshore wind in Europe have led to steady, cost-effective deployment over the last decade (see BNEF (2011) and Ragwitz et al. (2012)), and the PTC itself has supported steady deploy-ment of wind in the U.S. since 2008. Note, however, that the European incentives all include mechanisms to reduce the subsidy level over time to account for and to incentiv-ize cost reductions. Similar mechanisms could be applied to address this risk with a TCP.
Figure 9: Large solar PV policy options – costs and risks to federal and state governments
LARGE PV
Alternative incentives with identical benefits
RELATIVE RISK
Low High
Ince
ntive
pr
ice ri
sk
Proj
ect r
isk
$36/MWh PTC
15% 1603 Cash GranT
$18/MWh non-Taxable Cash for ProduCTIon
$22/MWh TCP
Current policy: 30% ITC
-50%
-44%
-60%
+13%
10 200 5 15
Incentive cost to federal and state governments ($ / MWh)

27A CPI Report
Supporting Renewables while Saving Taxpayers MoneySeptember 2012
6 Conclusion and RecommendationsWe used financial modeling of three representative project cases based upon cost, performance, and financ-ing data for projects financed or deployed over the last three years to assess the impact and cost-effectiveness of federal policies. We found that:
Impact – Federal policies have played a crucial role in helping enable the recent boom in the deployment of wind and solar. They covered about half the gap between renewable energy costs and electricity market prices, enabling a six-fold increase in wind and solar generation in spite of a deep global recession. Recent reductions in the cost of electricity from wind and solar mean that the PTC alone (if extended) could fully bridge that gap for new large wind projects, and that the gap for solar has been significantly narrowed.
Cost-Effectiveness – Tax incentives are not the most cost-effective way to support renewable energy projects. Projects can only realize their full value if they can offset them with tax liabilities external to the project—a risk for investors which increases financing costs. Investment incentives can provide the same benefits to projects as production incentives at a lower cost to government. However, investment incentives shift some project risks to government. With both types of incentives, govern-ment bears some risk in setting the right level for the incentive. This risk is greater for technologies with rapidly shifting costs but can be better managed by investment-based incentives because they adjust with changing costs.
Potential Improvements – We find that a taxable cash incentive for production (TCP) would be more cost-effec-tive than the PTC. Cash sidesteps the illiquid tax equity market. The production-based incentive allocates project cost and performance risks to private sector actors who are willing and able to bear them. In the event that the PTC is extended into 2013, our analysis suggests that the government could save more than 40% on incentive costs per MWh by delivering it as a TCP of $21/MWh over 10 years rather than a tax credit of $22/MWh.
Our work identifies two clear steps policymakers can take to improve the cost-effectiveness of federal renewable energy incentives:
1. Extend the PTC as a taxable cash incentive for production (TCP) – In the near term extend the $22 / MWh PTC for wind but deliver it as a $21 / MWh TCP. This would:
» Maintain the same effective level of support for wind projects.
» Reduce the cost of the incentive to federal and state government by around 40% for every unit of clean electricity generated.
» Avert a bust in the wind industry, and stimulate deployment even in states or regions with no local or state policy supports.
2. Give solar PV projects the option to take a 20% 1603 Cash Grant in lieu of a 30% ITC – This option could increase the value of the incentive to the project while reducing the cost to government of providing it.
This analysis has important limitations which we hope to address in future work. We have not considered policy measures such as national renewable portfolio standards, reverse auctions, or cap and trade systems which rely on market mechanisms to set price levels. These mecha-nisms could be much more cost-effective in the long term if the gains in the economic efficiency of using markets to determine price levels are not offset by expense of incen-tive price volatility. As our previous work (CPI, 2011) sug-gested that incentive price volatility could lead to higher financing costs, it is an open question as to which policy option would be most cost-effective. We have also not considered options to eliminate the stop/start problems of temporary tax provisions (BPC, 2011).
Finally, a number of policy options have been proposed as alternatives or complements to current policy, such as the use of Master Limited Partnership or generalizations of Real-Estate Investment Trusts for renewable energy. The comparative cost-effectiveness of these proposals, and their interaction with the federal policy alternatives considered here, is another area for potential future work.

28A CPI Report
Supporting Renewables while Saving Taxpayers MoneySeptember 2012
ReferencesBPC (Bipartisan Policy Center). 2011. Reassessing Renew-
able Energy Subsidies.
BNEF (Bloomberg New Energy Finance). 2010. Cash is king: shortcomings of US tax credits in subsidizing renewables.
BNEF. 2011. Assessing the effectiveness of clean energy policy.
BNEF, UNEP, Frankfurt School. 2012. Global Trends in Renewable Energy Investment 2012.
Bolinger, M.; Wiser, R.; Cory, K.; James, T. 2009. PTC, ITC, or Cash Grant? LBNL, NREL.
Bolinger, M.; Wiser, R., Darghouth, N. 2010. Preliminary Evaluation of the Impact of the Section 1603 Trea-sury Grant Program on Renewable Energy Deploy-ment in 2009. LBNL.
Bolinger, M. 2010. Revealing the Hidden Value that the Federal Investment Tax Credit and Treasury Cash Grant Provide to Community Wind Projects. LBNL.
Bolinger, M. and R. Wiser. 2011. Understanding Trends in Wind Turbine Prices Over the Past Decade. LBNL.
Borenstein, S. 2012. “The Private and Public Economics of Renewable Electricity Generation.” Journal of Eco-nomic Perspectives 27(1):67-92.
CPUC (California Public Utilities Commission). 2012. Renewables Portfolio Standard Quarterly Report 4th Quarter 2011.
Chadbourne & Parke LLP. 2012. Project Finance News-Wire, May 2012, State of the Tax Equity Market.
CPI (Climate Policy Initiative). 2011. Renewable Energy Financing and Climate Policy Effectiveness. CPI Analysis Framework Working Paper.
CPI (Climate Policy Initiative). 2011. The Impacts of Policy on the Financing of Renewable Projects: A Case Study Analysis. CPI Report.
Committee on Energy and Commerce, Subcommittee on oversight and Investigations Majority Staff, House of Representatives. 2012. Where Are the Jobs? – The Elusiveness of Job Creation under the Section 1603 Grant Program for Renewable Energy.
DBCCA (Deutche Bank Climate Change Advisors). 2009. Paying for Renewable Energy: TLC at the Right Price
– Achieving Scale through Efficient Policy Design. Green Policy Paper.
De Jager, D.; Rathmann, M. 2008. Policy instrument design to reduce financing costs in renewable energy technology projects. Utrecht, The Netherlands: Ecofys International, IEA Implementing Agreement on Renewable Energy Technology Deployment.
EIA (Energy Information Administration). 2003-2012. Annual Energy Outlook
Hamilton, K. 2006. Investment: Risk, Return and the Role of Policy. Working Paper. UKERC.
Hamilton, K. 2009. Unlocking Finance for Clean Energy: The Need for ‘Investment Grade’ Policy. Chatham House Energy, Environment and Development Programme Paper.
Harper, J. P., M. D. Karcher, M. Bolinger. 2007. Wind Project Financing Structures: A Review & Compara-tive Analysis. LBNL.
IEA (International Energy Agency). 2011. World Energy Outlook 2010. Paris, France: OECD/IEA.
JCT (Joint Committee on Taxation). 1996-2012. Estimated Budget Effects of Revenue Provisions in the Presi-dent’s Budget (FY 1997-2012)
Lüthi, S.; Wüstenhagen, R. 2010. The Price of Policy Risk – Empirical Insights from Choice Experiments with European Photovoltaic Project Developers.
Mintz Levin. 2012. Renewable Energy Project Finance in the U.S.: 2010-2013 Overview and Future Outlook. White Paper
Moody’s Investor Service. 2008. Power Generation Proj-ects. Moody’s Global Infrastructure Finance – Rating Methodology.
Moody’s Investors Service. 2010. PV Solar Power Genera-tion Projects. Special Comment.
OMB (Office of Management and Budget). 1996-2012. President’s Budget, Analytical Perspectives.
Ragwitz, M., J. Winkler, C. Klessmann, M. Gephart, G. Resch. Recent developments of feed-in systems in the EU – A research paper for the International Feed-In Cooperation. Fraunhofer ISI, Energy Eco-nomics Group, ECOFYS.
Standard & Poor’s Ratings Direct. 2007. Updated Project Finance Summary: Debt Rating Criteria.

29A CPI Report
Supporting Renewables while Saving Taxpayers MoneySeptember 2012
Standard & Poor’s Ratings Direct. 2009. Key Credit Factors: Methodology And Assumptions On Risks For Utility-Scale Solar Photovoltaic Projects.
Standard & Poor’s Ratings Direct. 2009. Key Credit Factors: Methodology And Assumptions On Risks For Concentrating Solar Thermal Power Projects.
Standard & Poor’s Ratings Direct. 2006. A Look At U.S. Wind Project Risks In A Time Of Growth. Credit FAQ.
UNEP SEFI, BNEF, Chatham House. 2009. Private Financ-ing of Renewable Energy: A Guide for Policymakers. Policymaker Handbook.
US PREF (U.S. Partnership for Renewable Energy Finance). 2011. Tax Credits, Tax Equity And Alternatives To Spur Clean Energy Financing.
US PREF. 2012. Ramping up Renewables: Leveraging State RPS Programs amid Uncertain Federal Support.
US PREF. 2012. Clean Energy and Tax Reform: How Tax Policy Can Help Renewable Energy Contribute to Economic Growth, Energy Security and a Balanced Budget.
US PREF. 2012. Paid in Full. (with SolarCity)
Wiser, R., E. Lantz, M. Bolinger, M. Hand. 2012. Recent Developments in the Levelized Cost of Energy from U.S. Wind Power Projects. LBNL and NREL.
Zee, H. H. J. G. Stotsky, E. Ley. 2002. “Tax Incentives for Business Investment: A Primer for Policy Makers in Developing Countries.” World Development 30(9):1497-1516.

30A CPI Report
Supporting Renewables while Saving Taxpayers MoneySeptember 2012
Appendix A - Summary of Project Input Data, Assumptions, and ResultsTo address the importance and cost-effectiveness of federal incentives, we began by collecting data on the utility-scale renewable energy projects either financed or deployed in the U.S. over the last few years. We were able to obtain the following information for utility-scale, grid-connected solar PV and wind projects:
Technical details, costs, and timelines for a large sample of renewable energy projects - We used the median costs, timelines, and size of the large U.S. wind, small solar PV, and large solar PV projects financed or com-missioned between 2009 and mid-2012 contained in Bloomberg New Energy Finance’s (BNEF) proprietary renewable energy project database.
Historical performance of most large renewable energy generators - We based expected project performance on the monthly electricity generation reported by produc-ers to the EIA for projects in operation for at least one full year between 2008 and 2011. We also used this data to estimate annual performance variation as well as variation in average capacity factor across facilities. We corrected the expected revenues based on time of use factors which we estimated using: the Eastern and Western Renewable Integration Studies for hourly resource variability, NREL’s System Advisor Model to model varying generation, Bloomberg Terminal data and data from ERCOT, MISO, and FERC on hourly electricity pricing.17
Published ranges or examples of financial structures and requirements - We used a mix of academic work and publications by law and financial firms to compile prevailing financial structures, costs, fees, required equity returns, terms and conditions for renewable energy project financings.18
17 Note that we could not systematically link the majority of projects in the BNEF database to their EIA performance data.
18 Key data sources for information regarding prevailing terms for renewable project financing include: Mintz-Levin (2012) - http://www.mintz.com/publica-tions/3055/, and NREL’s REFTI survey - https://financere.nrel.gov/finance/REFTI on investor return requirements, US PREF - http://uspref.org/white-papers on tax equity transaction costs and current market conditions, LBNL (Bolinger et al.) - http://eetd.lbl.gov/ea/ems/reports/lbnl-2909e.pdf on tax equity structures.
We were not able to obtain systematic, detailed informa-tion about the financing structure, revenues, or federal and state incentives used by specific projects. So we could not use statistical methods to assess differences across projects which may be attributable to policy.
Instead, we used the project cost and performance data-sets to determine median characteristics of renewable energy projects (summary statistics are provided in Table A-1 below), and compiled them into three representative, generic project cases with median values for key technical characteristics – a large 130 MW wind farm (which com-prised the majority of installed capacity), a small utility-scale 1 MW solar PV facility (majority of the installed projects), and a large 15 MW solar PV facility (the bulk of deployment growth). All projects were assumed to have achieved financial closure in mid-2010, roughly the mid-point of the range of project financing dates we studied. Key modeling assumptions for the three generic 2010 project cases are listed in Table A-2 below.
We assessed the impact of federal policy on these three cases in 2010 using financial modeling based on prevail-ing practice (as discussed in greater detail in Section 3), and present the results of that analysis in sections 4.1 and 4.2.
For the analysis of potential impact and cost-effectiveness in 2013 presented in section 4.3 and section 5, we modi-fied the price, performance, size, and financial assump-tions based upon reports on recent market conditions such as in US PREF (2012), Wiser et al. (2012), and Chadbourne & Parke (2012). The changes relative to the 2010 cases are:
• Updated costs and performance for wind – Our assumptions are based on work by LBNL and NREL on recent trends in wind turbine costs - http://eetd.lbl.gov/ea/ems/reports/wind-energy-costs-2-2012.pdf. Specifically, we use the average of the projected 2013 capacity factors and costs of all technology options expected to be available for a wind regime corresponding to our 2010 large wind case (roughly 6.5 m/s).
• Updated size for large PV, and costs for small and large PV – Large solar PV projects are getting even larger. We assumed a 60MW project size based on BNEF project data trends. We assume that U.S. utility-scale installations in 2013 can match Germany’s average installed costs for

31A CPI Report
Supporting Renewables while Saving Taxpayers MoneySeptember 2012
small ground-mounted solar PV installations in mid-2012, about $2.20/W.
• Lower tax equity costs for solar PV – Due to reports of increasing volumes of solar PV tax equity financings (nearly $2.5 billion in 2011 according to Chadbourne & Parke, 2012), we have assumed that tax equity IRRs for solar PV will fall to roughly 50bp above those for wind by 2013.
• Revised policy settings – As the 1603 Cash Grant has expired, we assume that the ITC is the only option for solar PV in 2013. We assume the PTC for wind is extended at least to 2013.
• Updated market price assumptions – We use EIA projections for average wholesale market prices from EIA’s Annual Energy Outlook 2012 reference case scenario.
The modified assumptions for the 2013 cases are also noted in Table A-2. Detailed results of the comparative cost-effectiveness analysis for 2013 scenarios discussed in section 5 are provided in Table A-3.

Key Project Features PV Small PV
Large PV Wind Small
WindMedium
WindLarge Wind
Project Size, Cost, and Timeline (BNEF)1
Number of Projects in BNEF Data 332 267 65 326 54 116 156
Total Capacity in BNEF Data 1,774 MW 455 MW 1,318 MW 28,916 MW 288 MW 4,922 MW 23,706 MW
Size of Projects
Low (P90) 0.8 MW 0.7 MW 6.0 MW 5.0 MW 1.5 MW 19.7 MW 99.0 MW
Mid (Median) 1.5 MW 1.2 MW 15.0 MW 78.2 MW 3.3 MW 42.0 MW 131.5 MW
High (P10) 14.9 MW 3.5 MW 38.8 MW 198.8 MW 10.5 MW 71.0 MW 207.8 MW
Overnight Costs
Low (P10) $3.6 / W $4.3 / W $3.2 / W $1.5 / W $1.5 / W $1.8 / W $1.6 / W
Mid (Median) $5.7 / W $6.0 / W $4.2 / W $2.2 / W $2.1 / W $2.3 / W $2.1 / W
High (P90) $8.3 / W $8.5 / W $5.4 / W $3.0 / W $3.1 / W $3.5 / W $2.6 / W
Duration of Construction (Median) 2Q 1Q 3Q 3Q 2Q 3Q 3Q
Duration of Development (Median) 2Q 2Q 3Q 6Q 6Q 4Q 7Q
Project Performance (EIA)2
Number of Projects in EIA Data 53 43 10 548 173 183 192
Size of Projects
Min 0.1 MW 0.1 MW 8.2 MW 0.8 MW 0.8 MW 13.0 MW 87.5 MW
Max 48.0 MW 5.0 MW 48.0 MW 735.5 MW 12.5 MW 85.5 MW 735.5 MW
Percentile Cutoff for Category 85% 100% 33% 67% 100%
Total Capacity in EIA Data 244 MW 60 MW 185 MW 39,265 MW 806 MW 8,026 MW 30,434 MW
Median Capacity Factor
Low (P90 Median CF) 10.4% 10.8% 14.7% 19.7% 16.7% 19.2% 23.5%
Mid (P50 Median CF) 18.8% 18.0% 23.8% 30.0% 29.6% 29.1% 31.0%
High (P10 Median CF) 25.1% 24.6% 25.1% 37.8% 34.7% 39.8% 38.3%
P90/P50 Factor
Low (P90 P90/P50 Factor) 75.2% 73.3% 93.2% 76.5% 74.0% 79.8% 76.9%
Mid (Median P90/P50 Factor) 95.0% 95.3% 94.8% 90.8% 90.4% 91.6% 90.6%
High (P10 P90/P50 Factor) 97.4% 97.4% 97.1% 96.0% 96.0% 96.5% 94.8%
P90 Capacity Factor
Low 7.9% 7.9% 13.7% 15.1% 12.4% 15.3% 18.0%
Mid 17.9% 17.2% 22.6% 27.2% 26.7% 26.7% 28.1%
High 24.4% 23.9% 24.3% 36.3% 33.3% 38.5% 36.3%
TOU Adjustment3 121% 121% 121% 95% 95% 95% 95%1 BNEF data are summary statistics of estimates for overnight costs and project development and construction durations based on projects financed or commissioned from 2009 to mid-2012 where data was available. As BNEF data depend on publicly available information sources (such as regulatory fil-ings, press releases, etc.), these estimates may be biased due to selection effects. We have not attempted to correct for such biases.2 EIA data are based on monthly generator data collected in EIA forms 923 and 860 and include only PV and wind projects which were operating for at least one year between 2008 and 2011.3 We estimated Time of Use (TOU) factors using: the Eastern and Western Renewable Integration Studies for hourly resource variability, NREL’s System Advisor Model to model varying generation, Bloomberg Terminal data and data from ERCOT, MISO, and FERC on hourly electricity pricing.
Table A-1: Summary Statistics of U.S. Renewable Project Data

33A CPI Report
Supporting Renewables while Saving Taxpayers MoneySeptember 2012Sm
all PVLarge PV
Large W
ind
ProjeCT C
osT & PerforM
anCe
Project Size (2010)1.2 M
W15.0 M
W131.5 M
W
Project Size (2013) 11.2 M
W60.0 M
W131.5 M
W
Project Cost (2010)$6.0m
/ MW
$4.2m / M
W$2.1m
/ MW
Project Cost (2013)$2.2m
/ MW
$2.2m / M
W$1.8m
/ MW
Construction Duration1Q
3Q3Q
Development Duration
2Q3Q
7Q
Fixed Operations & Maintenance
(O&M)
$26 / kW
-Year$17 /
kW-Year
$60 / kW
-Year
Median Capacity Factor (2010)
18.0%23.8%
31.0%
P90 Capacity Factor (2010) 217.2%
22.6%28.1%
Median Capacity Factor (2013)
18.0%23.8%
38.7%
P90 Capacity Factor (2013) 217.2%
22.6%35.0%
First-Year Market Price Corrected for
Time of Use (2010) 3
$68/ MW
h$68 / M
Wh
$53 / MW
h
First-Year Market Price Corrected for
Time of Use (2013) 4
$75 / MW
h$75 / M
Wh
$58 / MW
h
Project Life20 Years
20 Years20 Years
Accelerated Depreciation5-Year
MACRS
5-Year M
ACRS5-Year
MACRS
Bonus Depreciation (2010 - none in 2013)
50%50%
50%
Utility Discount Rate8.25%
8.25%8.25%
1 Due to increasing PV project size for large solar PV projects expected to be built in 2013 observed in BNEF project data, we have chosen to consider a significantly larger project size for large PV in 2013.2 The P90 Capacity Factor is a m
ore conservative estimate of capacity factor used by debt
providers. The project should exceed it in nine out of 10 years it operates.3 Our expected w
holesale electricity market prices for the 2010 cases are taken from
EIA’s Annual Energy Outlook 2010 reference case m
arket price projections. Assuming 2%
baseline inflation, these projections are consistent w
ith 0.99% real m
arket price escalation over the life of the project. Further, based on historical annual m
arket price volatility, we assume that
the P90 market prices used by debt providers are roughly 32%
lower than expected market
prices for both the 2010 and 2013 cases.4 EIA Annual Energy Outlook 2012 reference case m
arket price projections are used for 2013 cases, corresponding to -0.14%
real escalation relative to 2% baseline inflation.
Small PV
Large PVLarge W
ind
fInanCInG assuM
PTIons 4
Required Min Debt-Service
Coverage Ratio (DSCR)1.4x
1.4x1.3x
Debt Term10 Years
15 Years15 Years
Term Debt Interest Rate
7.5%7.0%
6.5%
Term Debt Closing Costs
2.4%2.0%
2.0%
Construction Debt Closing Costs$0.1m
$0.1m$0.1m
Tax Equity Closing Costs$0.5m
$0.5m$0.5m
Tax Equity Syndication Fee0.5%
0.5%0.5%
Tax Equity Contribution (Unlevered)60%
60%60%
Tax Equity Contribution (Levered)95%
95%95%
Tax Equity Internal Rate of Return (IRR, 2010)
9.8%9.8%
8.5%
Tax Equity IRR (2013)9.0%
9.0%8.5%
Sponsor IRR10%
10%9.3%
Lowest Cost Financing Structure (2010, Cash Grant)
Sponsor, Debt
Sponsor, Debt
Sponsor, Debt
Lowest Cost Financing Structure (2013, ITC for PV, PTC for W
ind)Unlevered Tax Equity
Unlevered Tax Equity
Unlevered Tax Equity
4 Financing assumptions were draw
n from M
intz-Levin (2012), NREL’s REFTI Survey, US PREF (2011), Harper et al. (2007), Bolinger (2010), M
oody’s (2010), S&P (2009). Note that due to reports of increasing volum
es of solar PV tax equity financings (nearly $2.5 billion in 2011 ac-cording to Chadbourne & Parke, 2012), we have assum
ed that tax equity IRRs for solar PV will
have fallen to roughly 50bp above those for wind by 2013.
Table A-2: Final Modeling Assum
ptions

Table A-3: Results of analysis of costs to federal and state governments: Current policy, and alternatives that deliver the sam
e benefit to renewable projects
Large Wind
DebtEquity
Tax Equity
Equity IRR
Tax Equity
IRRFlip Year
Final LCOE ($/
MW
h)Incentive
Level
Incentive Cost ($/M
Wh)
Change
Accelerated Depreciation
Cost ($/MW
h)
Interest Deduction Cost ($/M
Wh)
Total Costs ($/
MW
h)
Change in Total Costs
Current Policy: $22/MW
h PTC, No Debt40%
60%9.3%
8.5%11
46$22/M
Wh
13.60%
2.50.0
16.20%
37% ITC, No Debt
40%60%
9.3%8.5%
1146
37%12.3
-10%0.1
0.012.3
-24%
30% 1603 Cash Grant
31%69%
9.3%46
30%10.0
-27%0.5
1.311.7
-27%
$18/MW
h Non-Taxable Cash for Production48%
52%9.3%
46$18/M
Wh
10.9-20%
2.01.9
14.8-8%
$21/MW
h TCP52%
48%9.3%
46$21/M
Wh
7.9-42%
2.52.5
12.8-21%
Small PV
DebtEquity
Tax Equity
Equity IRR
Tax Equity
IRRFlip Year
Final LCOE ($/
MW
h)Incentive
Level
Incentive Cost ($/M
Wh)
Change
Accelerated Depreciation
Cost ($/MW
h)
Interest Deduction Cost ($/M
Wh)
Total Costs ($/
MW
h)
Change in Total Costs
Current Policy: 30% ITC, No Debt
40%60%
10.0%9.0%
11125
30%31.3
0%6.5
0.037.8
0%
$56/MW
h PTC, No Debt40%
60%10.0%
9.0%11
125$56/M
Wh
35.4+13%
12.70.0
48.1+27%
14% 1603 Cash Grant
45%55%
10.0%125
14%13.6
-57%4.8
5.323.7
-37%
$24/MW
h Non-Taxable Cash for Production53%
47%10.0%
125$24/M
Wh
15.2-51%
7.26.3
28.7-24%
$30/MW
h TCP55%
45%10.0%
125$30/M
Wh
11.4-64%
7.76.9
26.0-31%
Large PVDebt
EquityTax
EquityEquity
IRR
Tax Equity
IRRFlip Year
Final LCOE ($/
MW
h)Incentive
Level
Incentive Cost ($/M
Wh)
Change
Accelerated Depreciation
Cost ($/MW
h)
Interest Deduction Cost ($/M
Wh)
Total Costs ($/
MW
h)
Change in Total Costs
Current Policy: 30% ITC, No Debt
40%60%
10.0%9.0%
1183
30%20.3
0%1.1
0.021.3
0%
$36/MW
h PTC, No Debt40%
60%10.0%
9.0%11
83$36/M
Wh
22.9+13%
5.20.0
28.1+32%
15% 1603 Cash Grant
50%50%
10.0%83
15%10.2
-50%3.0
5.518.7
-12%
$18/MW
h Non-Taxable Cash for Production58%
42%10.0%
83$18/M
Wh
11.4-44%
4.76.1
22.2+4%
$22/MW
h TCP60%
40%10.0%
83$22/M
Wh
8.2-60%
5.16.7
20.0-6%

35A CPI Report
Supporting Renewables while Saving Taxpayers MoneySeptember 2012
Appendix B - Modifications to CPI Financial Model for this analysisThe model used in this this analysis is a modified version of the financial model previously developed by CPI to support case study analysis of the impact of policy on the financing of renewable energy projects.19 That model took as input the technical, financial, and policy charac-teristics of a project and calculated all cash and tax flows to and from the project over its useful life. The model was used to address two questions closely related to those we are considering here:
How did policy contribute to the actual costs and returns of a specific project? Given a specific project, the rel-evant policy supports, details of the actual financing structure used, and estimates of the revenues expected, the modeled cash flows were used to calculate finan-cial metrics such as the project’s internal rate of return (IRR), debt service coverage ratio, the returns to equity investors, and the contribution of policies to the cost of electricity.
How would project costs vary under different policy scenarios? For a specific project in a given policy envi-ronment, the cash flow model could also be used to numerically calculate the revenue required to meet the combined return requirements for all equity investors while simultaneously maximizing the leverage (the level of project debt) – a slight variant of the usual levelized cost of electricity for the project. By varying only the policy environment and computing the change in levelized costs, we can assess the impact of policy on the cost of financ-ing the project.
The previous model did not have the tax equity financ-ing detail needed to perform comparative analysis of U.S. federal incentives, nor did it have the capacity to address the cost of government of providing financial support to projects. We modified the model in several ways to address these issues:
Direct calculation of a variant of the usual levelized cost of electricity. The levelized cost of electricity is usually
19 Described in Appendix A.1 of http://climatepolicyinitiative.org/publication/the-impacts-of-policy-on-the-financing-of-renewable-projects-a-case-study-analysis/.
defined as the revenue per unit of electricity generated needed to achieve a project IRR equal to the weighted average cost of capital for the project. The weighted average cost of capital is generally provided as an input and depends on the required equity return and the lever-age (along with the cost of debt). For this analysis, we have data on required after-tax returns for various inves-tors, but rather than leverage, we have general informa-tion about the terms, conditions, and costs of debt and tax equity financing. We built a levelized cost calculator that determines the minimum revenue needed to meet the equity return requirements of both the developer and a potential tax equity investor. However, it does so while adjusting certain tax equity financing parameters and optimizing the leverage to meet a required minimum debt service coverage ratio. So our levelized cost is a function of required equity return, debt-service coverage ratio, and certain tax equity and debt costs and fees rather than equity return and leverage.
Added tax equity details. We added options to model the tax equity project financing structures used by project developers to bring in outside tax investors to help them monetize the tax benefits provided by federal incentives. These options are the parameters and conditions describ-ing the allocation of tax and cash benefits among tax equity investors and sponsors over the life of the project, and are constrained by IRS rules as well as industry practice.20
Optimized tax equity structure for levelized cost calcula-tion. We modified the levelized cost calculation to adjust the tax equity structure to minimize the revenue required to simultaneously meet the return requirements of both tax equity investors and sponsors while maximizing the leverage.
Added calculation of cost to government of various policy supports. We added the capacity to calculate the cost to government (either in the form of direct payments or foregone tax revenues) of policy supports utilized by the project (such as grants, tax credits, acceler-ated depreciation, or deductions of interest expenses). Specifically, this cost is calculated as the present value of all flows to government discounted using zero-coupon treasury yields of the appropriate tenor. That is, we are assuming that any impact on government cash flows
20 We relied heavily on the recent work of Mark Bolinger and collaborators at LBNL and NREL regarding the specific tax equity structures used (see, for example - http://eetd.lbl.gov/ea/ems/reports/lbnl-2909e.pdf).

36A CPI Report
Supporting Renewables while Saving Taxpayers MoneySeptember 2012
is marginal and therefore must be financed through a government debt transaction (either the purchase or sale of a treasury). Note that since we are computing costs to all levels of government, this is implicitly assuming that marginal shifts in state government finances are enabled by transfers from the federal government.
Generalized levelized cost to allow variation of policy supports. In order to compare the cost to government of different federal incentives which deliver the same cost of electricity to ratepayers, we modified levelized cost calculation to allow the revenues needed to meet financial requirements to arise (at least in part) from specific policy sources such as investment or production tax credits.