supporting students with ieps: they can and are making progress! january 2013 jennifer ross, pvaas...
TRANSCRIPT

Supporting Studentswith IEPs: They CAN and AREMaking Progress!
January 2013
Jennifer Ross, PVAAS Statewide Team for PDE
Bonnie Dyer, AIU3 Curriculum & Instruction Coordinator

Keystones
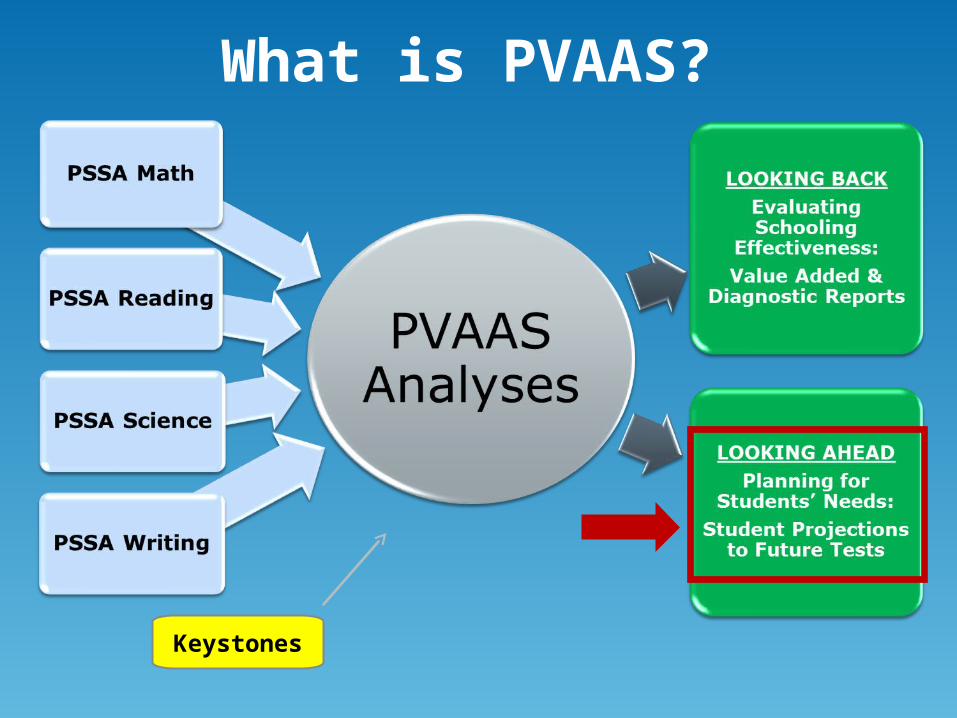
What is PVAAS?

Who has access to PVAAS reporting?
LEAS that receive PDE PVAAS reportingo PA public districts/schools
o Full-time CTCs
o Charter schools
o Cyber charter schools
Examples of LEAs that do NOT receive PDE PVAAS reporting
o Part-time CTCs
o Non-public schools
District and School Admin account holders determine access for ALL staff within their LEA!
Keystones
What is PVAAS?

How Are Projections Used?
Weather Forecasts
Population Growth
Demand for Electricity
Inventory Management
Investment Strategies

What Are Projections?
Given a specific set of circumstances…
…what is the most likely outcome?

Setting Expectations
How do teachers set expectations for their students?
•Informationo What do they know about this student?
•Experienceo How have students like this one performed in the past?
•Beliefso How are beliefs affecting our expectations of students?
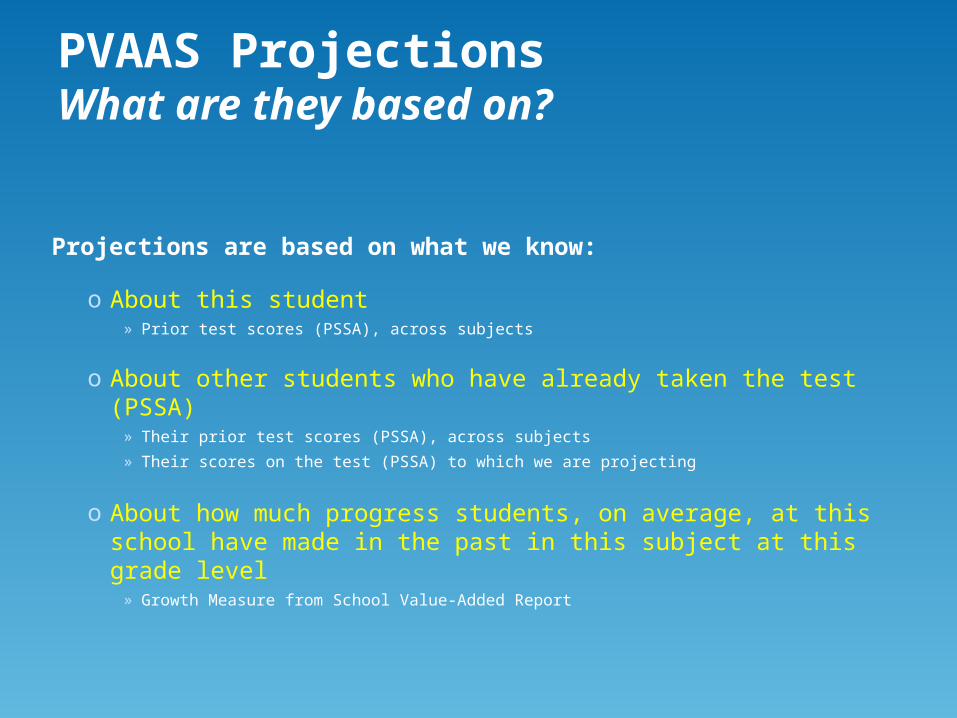
PVAAS ProjectionsWhat are they based on?
Projections are based on what we know:
o About this student» Prior test scores (PSSA), across subjects
o About other students who have already taken the test (PSSA)» Their prior test scores (PSSA), across subjects
» Their scores on the test (PSSA) to which we are projecting
o About how much progress students, on average, at this school have made in the past in this subject at this grade level
» Growth Measure from School Value-Added Report
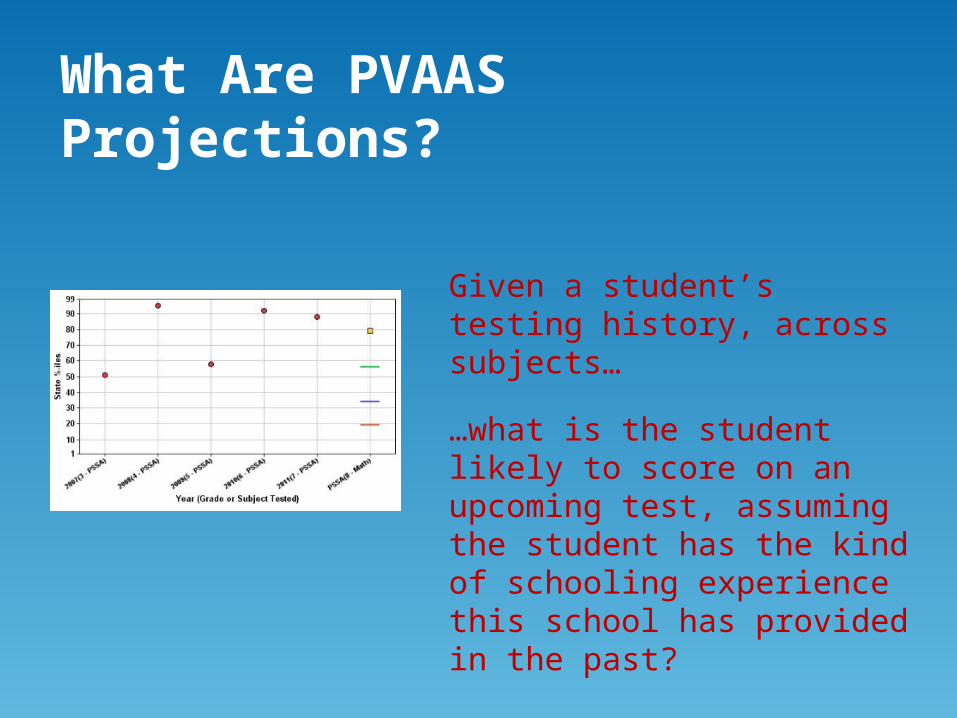
Given a student’s testing history, across subjects…
…what is the student likely to score on an upcoming test, assuming the student has the kind of schooling experience this school has provided in the past?
What Are PVAAS Projections?

PVAAS Student Projection Report

What’s the Value of the Projections?
Projections are NOT about predicting the future.
They ARE about assessing students’
academic needs TODAY!
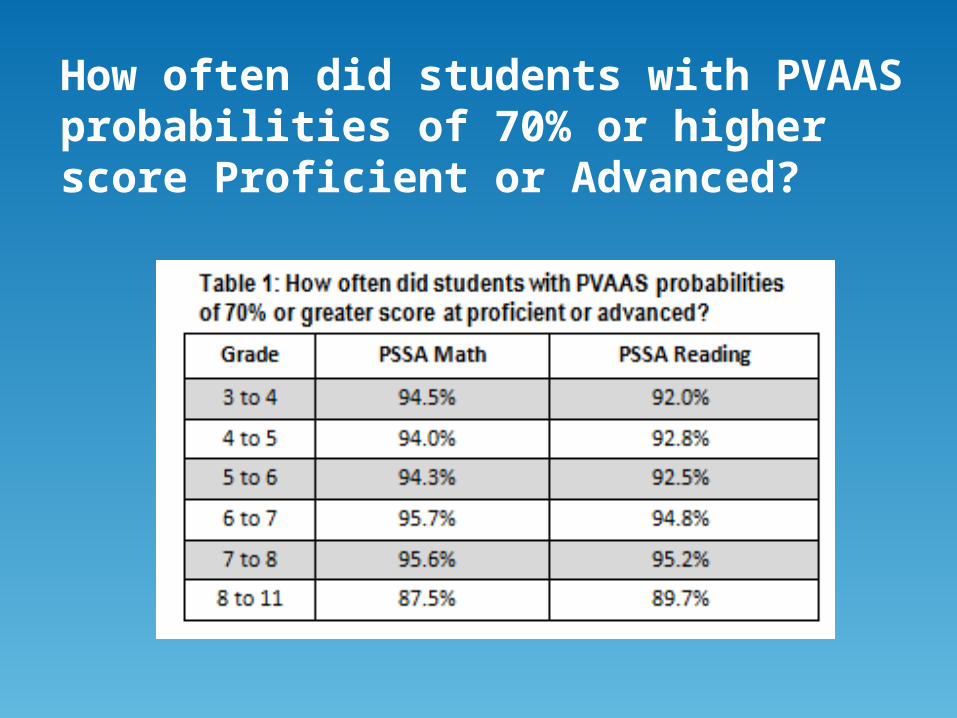
How often did students with PVAAS probabilities of 70% or higher score Proficient or Advanced?

What Should Educators Know About PVAAS Projections?
Found on the PVAAS login page under the link,
What should educators know about PVAAS student
probabilities?

Why are there no Student Projection Report for some students?
Student has insufficient testing history• Need a minimum of three prior data points
• Exception are projections to grade 4
Student was assessed with the PASA
Student was retained in last grade level
For additional info:

Assessing Students’ Needs
What are this student’s chances for success?What goals are appropriate for this student
this year? In future years?
What can the school do to help this student get there?
What can I (the teacher) do to help this student get there?
What can the student do to get there?
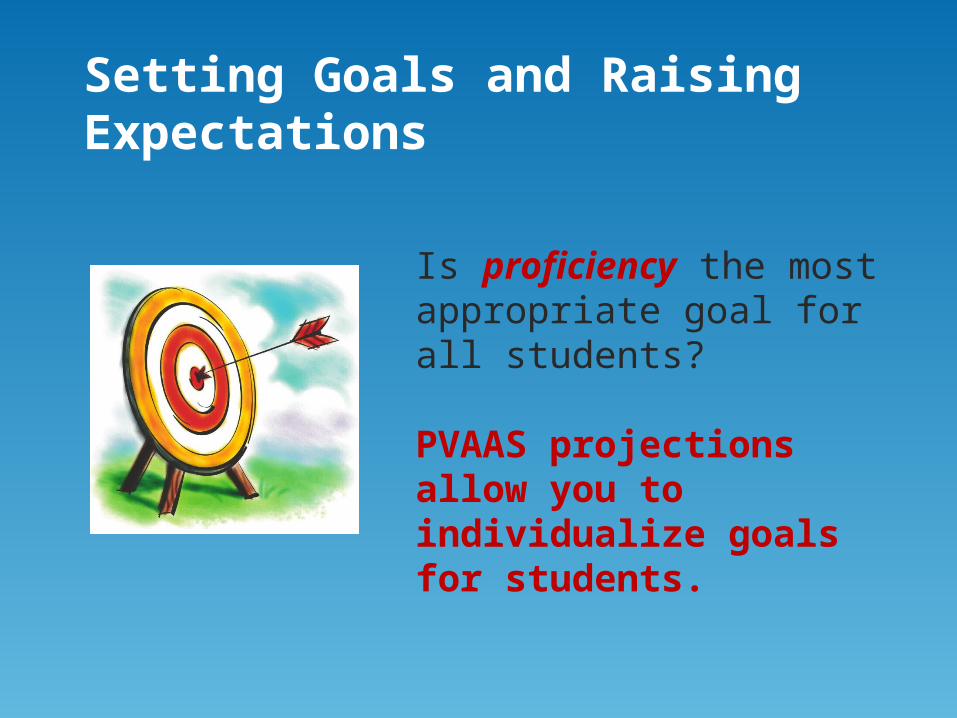
Setting Goals and Raising Expectations
Is proficiency the most appropriate goal for all students?
PVAAS projections allow you to individualize goals for students.

What Are Your Goals and Expectations for This Student?
Student A

Student B
What Are Your Goals and Expectations for This Student?
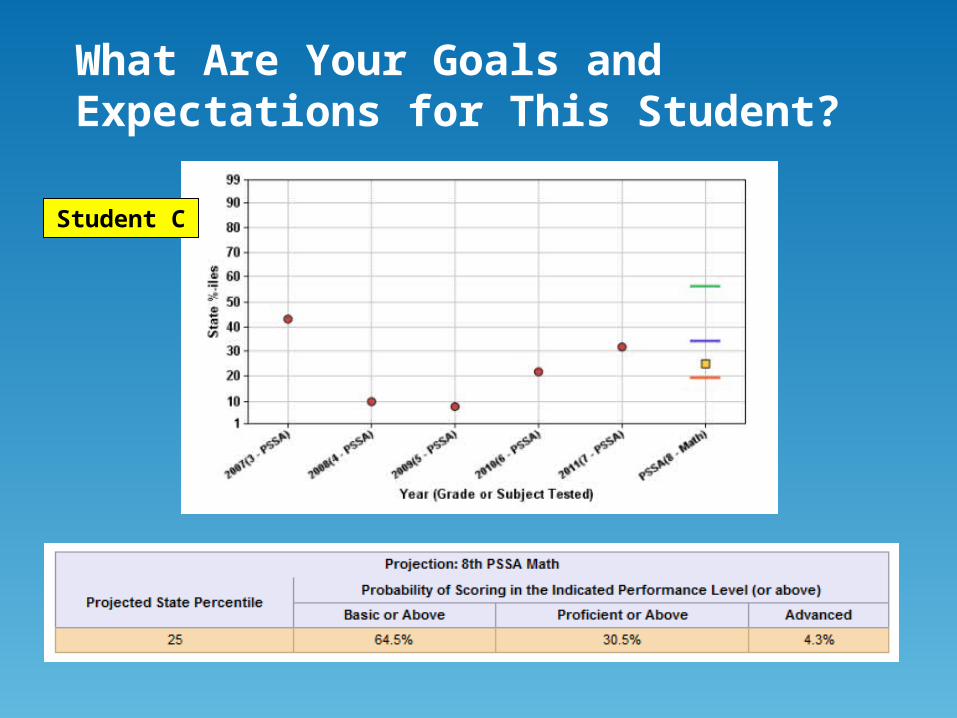
Student C
What Are Your Goals and Expectations for This Student?

Questions?

Projection Summary Reports
What are they?o This is a report that summarizes the numbers
and percentages of students in various likelihood ranges of performing at a proficient level or higher on a future PSSA exam.
Cautionso This report provides ONE indicator about
likelihood of future performance.
o Additional data should be used with the projection for better decision-making.

District/School (Single Grade) Projection Summary Report
Use the Projection tab in the blue menu bar to select projections to different grade levels and subjects.

Accessing Individual Students
Sort the list of students by clicking on a column header.
Access a Student Projection Report for a student by clicking on the probability for a selected student.

How Might Educators Use Projection Summary Reports?
Administrators can use for program planning:o Intervention Planningo Resource Allocationo Course Availability & Placement Decisionso School Improvement Planningo Strategic Planning
Teachers can use to facilitate instructional planning:o Proportion of students on a path to success (proficiency or
higher)o Proportion of students at risk for reaching proficient or
advanced levels of performanceo Plan for instructional strategies and classroom practices based
on students’ needs

Activity
Access a Projection Summary Report (Single Tested Grade) for a grade-level group of students
Identify students who have: A higher probability than expected of reaching a
Proficient level A lower probability than expected of reaching a
Proficient level
For each student, ask: What additional data are needed? Who do we need to engage in the conversation about
a course of action for this student? What is the current academic program for this
student? What changes might be needed for this student’s
academic program?• Courses, interventions, enrichment opportunities, etc.

Questions?

Keystones
What is PVAAS?

Achievement vs. Progress
Student Achievement: Where are we?
oHighly correlated with demographic factors
Student Progress: How far have we come?
oHighly dependent on what happens as a result of schooling rather than on demographic factors
By concentrating on the progress students make, PVAAS puts the emphasis on something educators can influence!

Demographics and Growth
As long as you can sufficiently account for the prior achievement of the student,……there is NO significant relationship
between demographics and student progress, or growth!
Demographics are NOT destiny!
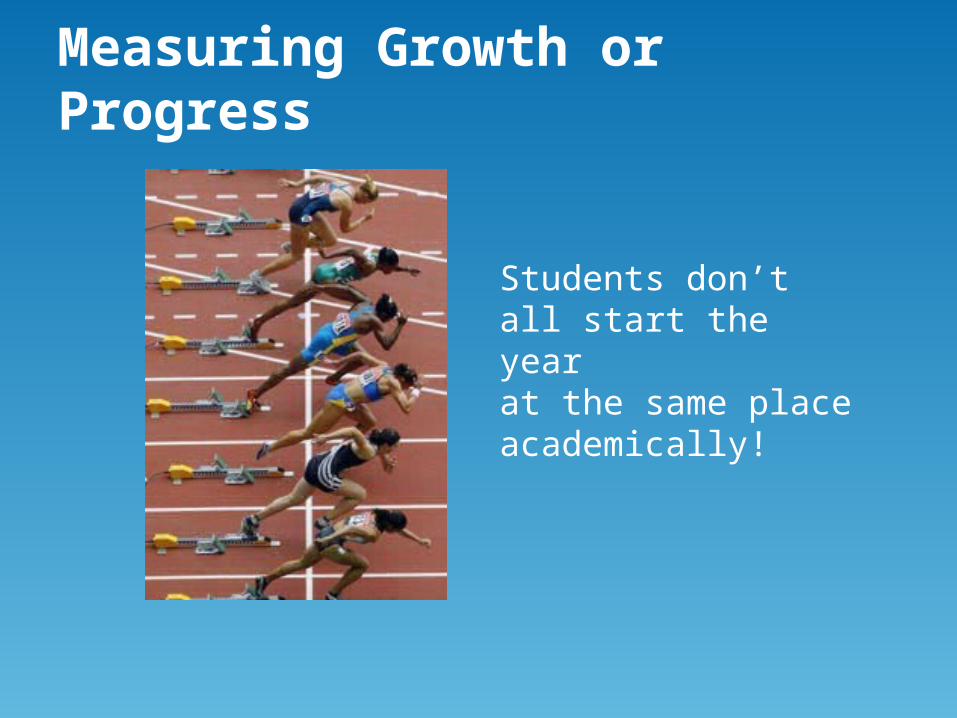
Measuring Growth or Progress
Students don’t all start the year at the same place academically!

Measuring Growth or Progress
o Standard for PA Academic Growth• Regardless of their entering achievement level, students
should not lose ground academically.
o Is it not a reasonable goal to at least maintain the achievement level of a group of students?• Not necessarily increase their achievement level, but at
least maintain their achievement level.

PVAAS Growth Measure &Color Indicators
oThe Growth Measure represents the amount of growth a group of students has made.
oThe Growth Color Indicator represents the level of evidence we have in the data to say whether or not the group of students increased, decreased, or maintained their achievement levels on average.
PVAAS yields a Growth Measure ANDA Growth Color Indicator

PVAAS Value-AddedGrowth Indicators
DB Significant evidence that the district/school exceeded the standard for PA Academic Growth
LB Moderate evidence that the district/school exceeded the standard for PA Academic Growth
G Evidence that the district/school met the standard for PA Academic Growth
Y Moderate evidence that the district/school did not meet the standard for PA Academic Growth
R Significant evidence that the district/school did not meet the standard for PA Academic Growth
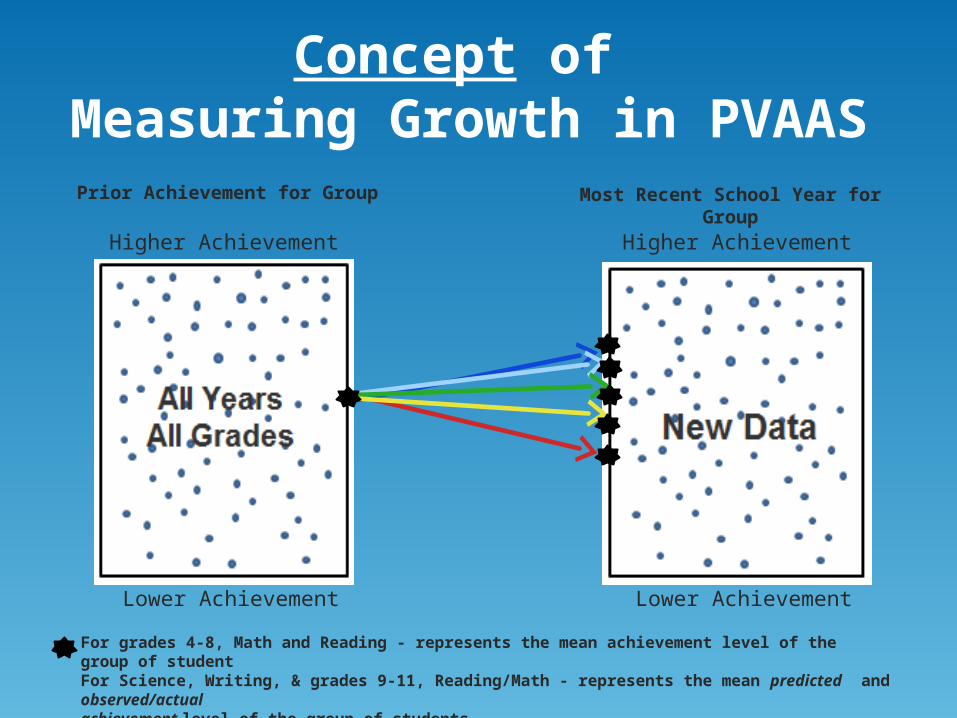
Prior Achievement for Group Most Recent School Year for Group
Higher Achievement
Concept of Measuring Growth in PVAAS
Lower Achievement
Higher Achievement
Lower Achievement
For grades 4-8, Math and Reading - represents the mean achievement level of the group of studentFor Science, Writing, & grades 9-11, Reading/Math - represents the mean predicted and observed/actualachievement level of the group of students

Can BOTH high-achieving and low-achieving groups of students make growth?

Groups of Students with Lower Achievement
Is a “green” in PVAAS sufficient in this scenario?
Higher Achievement
Lower Achievement
Prior Achievement for Group Most Recent School Year for Group
Higher Achievement
Lower Achievement
For grades 4-8, Math and Reading - represents the mean achievement level of the group of studentFor Science, Writing, & grades 9-11, Reading/Math - represents the mean predicted and observed/actualachievement level of the group of students

(100% Advanced)
Groups of Students with Higher Achievement
Higher Achievement Higher Achievement
Lower Achievement Lower Achievement
Prior Achievement for GroupMost Recent School Year for Group
(100% Advanced)
For grades 4-8, Math and Reading - represents the mean achievement level of the group of studentFor Science, Writing, & grades 9-11, Reading/Math - represents the mean predicted and observed/actualachievement level of the group of students
Is a “green” in PVAAS sufficient in this scenario?

Regardless of the entering achievement level of the group…
Students should NOT lose ground academically
A reasonable goal would be to AT LEAST MAINTAIN the achievement level of the group
All groups of students CAN make progress, or growth

Performance Diagnostic Summary ReportLooking Deeper into Growth

PVAAS Performance Diagnostic Summary Report
Color Interpretation
Light Blue
Group of students exceeded the standard for PA Academic Growth
Light Green
Group of students has met the standard for PA Academic Growth
PinkGroup of students did not meet the standard for PA Academic Growth
White Too few students to estimate growth

Questions?

Overview ofGrowth Table
Longitudinal View Of
Progress!

Value-Added ReportsMath, Reading, Writing, Science
Math & Reading,Grades 4-8
Science & Writing,All Grades TestedMath & Reading,
Grades 9-11

Performance Diagnostic Summary Reports
All Subjects TestedAll Grades Tested
Whole Grade & Subgroups

Overview of Growth TableSample
Analyzing Patterns & TrendsValue-Added Data

Does the organization of the data matter when looking for patterns and trends?
By Subject
By Grade

Value-Added PatternsBy Subject
o Is the curriculum aligned to the state standards?
o Is there consistent implementation of the curriculum across all grade levels in each school?
vs
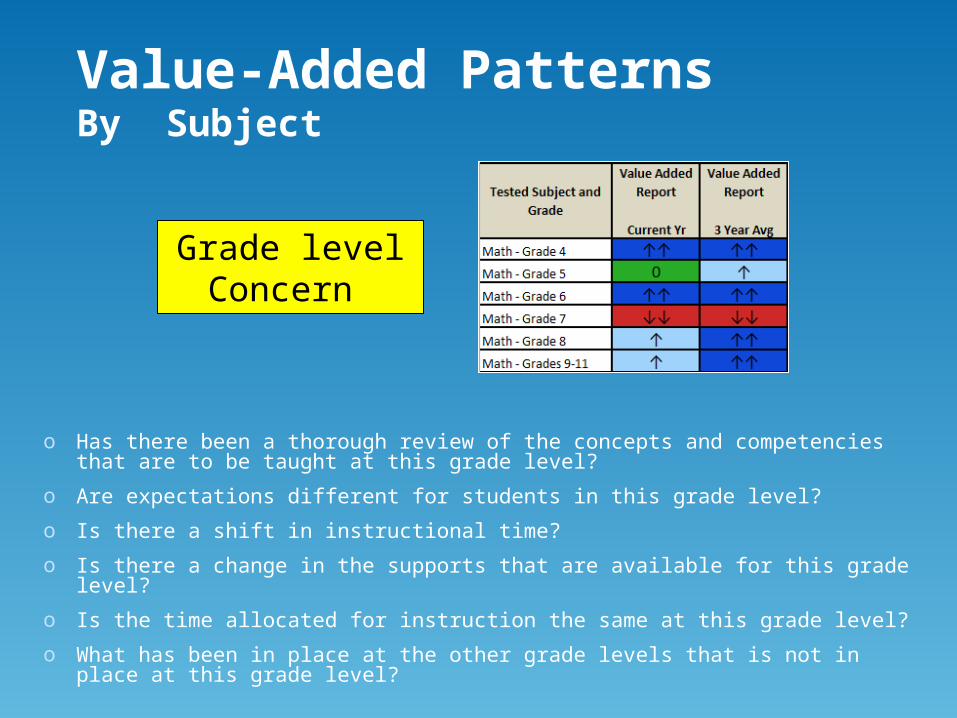
Value-Added PatternsBy Subject
Grade level Concern
o Has there been a thorough review of the concepts and competencies that are to be taught at this grade level?
o Are expectations different for students in this grade level?
o Is there a shift in instructional time?
o Is there a change in the supports that are available for this grade level?
o Is the time allocated for instruction the same at this grade level?
o What has been in place at the other grade levels that is not in place at this grade level?

Value-Added PatternsBy Subject
Consistency Over Time
o What changes have been made to account for the change in growth results?
o Has a new curriculum been implemented?
o Has there been a year-long focus of professional development for Reading in the district?
o Are Literacy Coaches supporting classroom teachers in all grades?
o Has intervention time been scheduled in all grades in the master schedule?

Value-Added Patternsby Grade Level
o Are effective instructional practices implemented across all grade levels? Across classroom? Across all schools?
vs

Value-Added Patternsby Grade Level
o Is the Reading curriculum aligned to the standards?o Are effective instructional practices implemented
across all subject areas? o Has comprehensive professional development been
provided in the area of Reading? How long ago?
Subject Area Concern
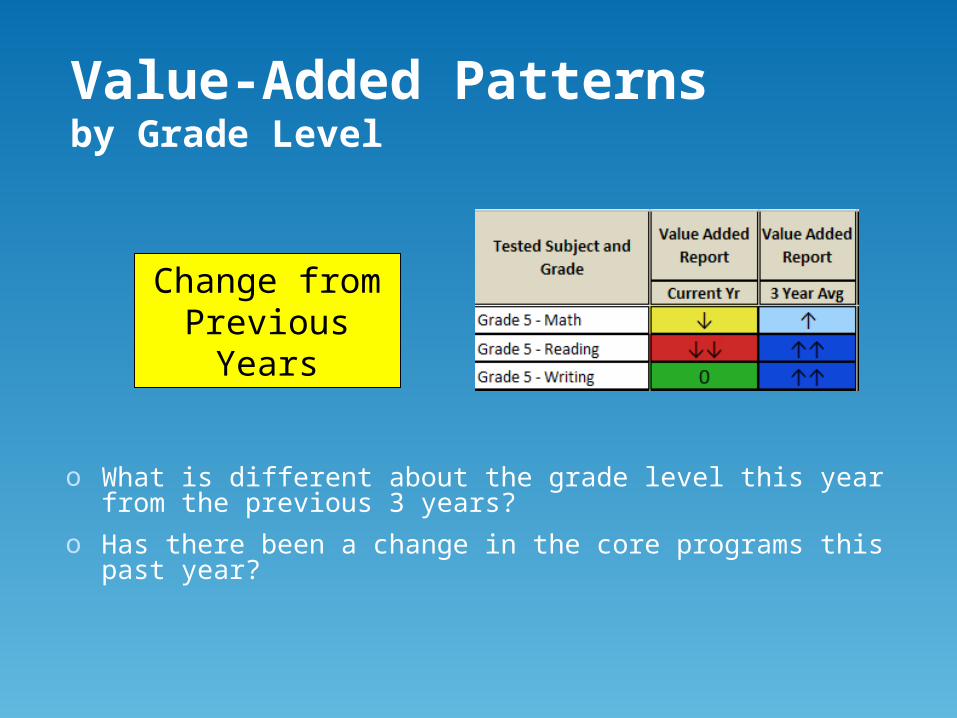
Value-Added Patternsby Grade Level
o What is different about the grade level this year from the previous 3 years?
o Has there been a change in the core programs this past year?
Change from Previous Years
Analyzing Patterns & TrendsPerformance Diagnostic Reports
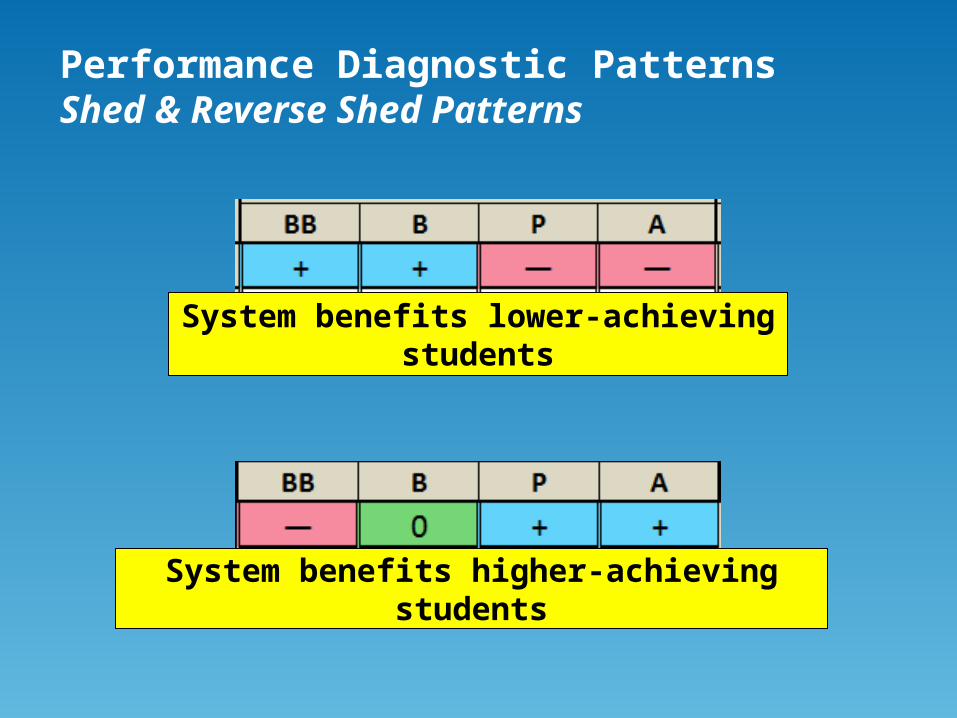
Performance Diagnostic PatternsShed & Reverse Shed Patterns
System benefits lower-achieving students
System benefits higher-achieving students

Performance Diagnostic PatternsTent & V Patterns
System benefits middle level learners
System benefits higher-and lower-achieving students only

Performance Diagnostic PatternsOpportunity Gap Pattern
System benefits all types of learners except those right below proficiency
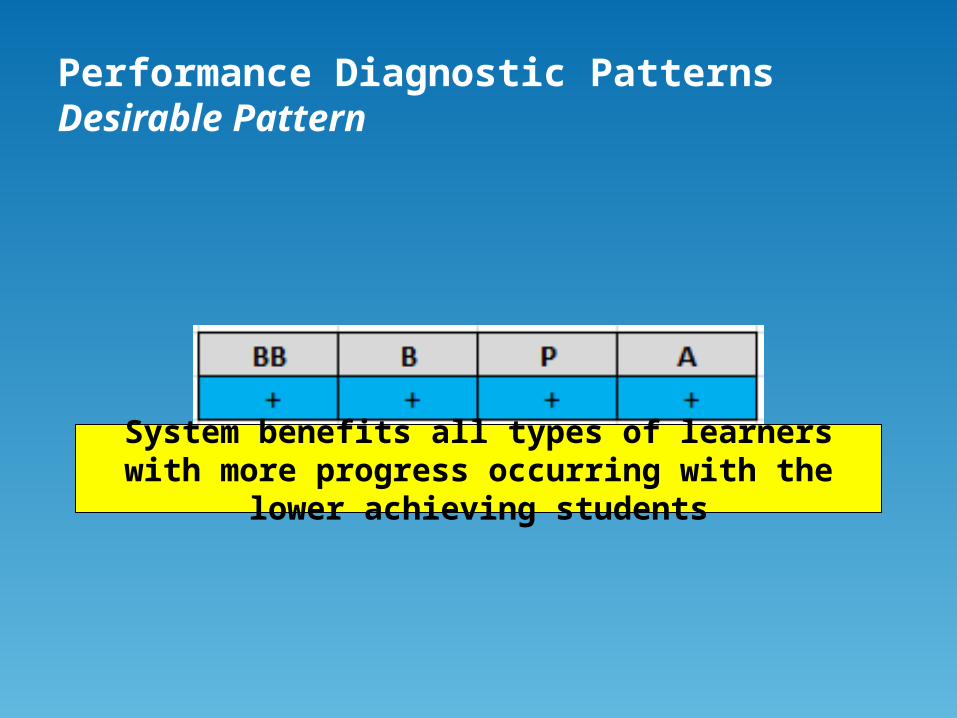
Performance Diagnostic PatternsDesirable Pattern
System benefits all types of learners with more progress occurring with the lower achieving students
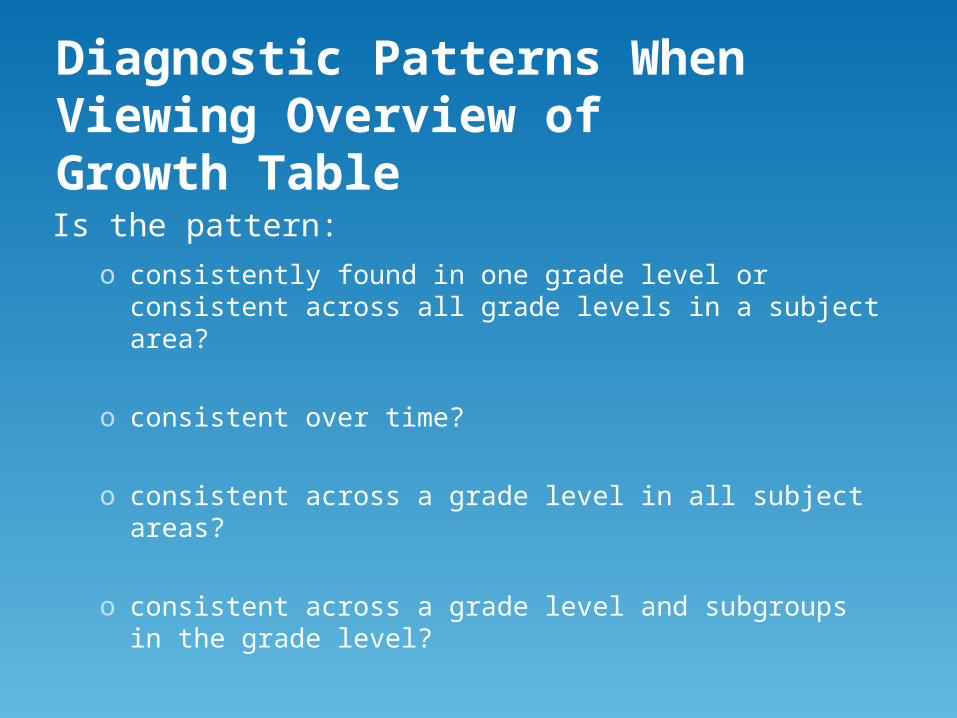
Diagnostic Patterns When Viewing Overview of Growth Table
Is the pattern:o consistently found in one grade level or consistent
across all grade levels in a subject area?
o consistent over time?
o consistent across a grade level in all subject areas?
o consistent across a grade level and subgroups in the grade level?

Consistent Patterns
One Grade More Systemic Pattern
vs

Consistent Over Time

Consistent Across a Grade LevelIn All Subject Areas

Consistent Across Grade Level and Subgroups in Grade Level
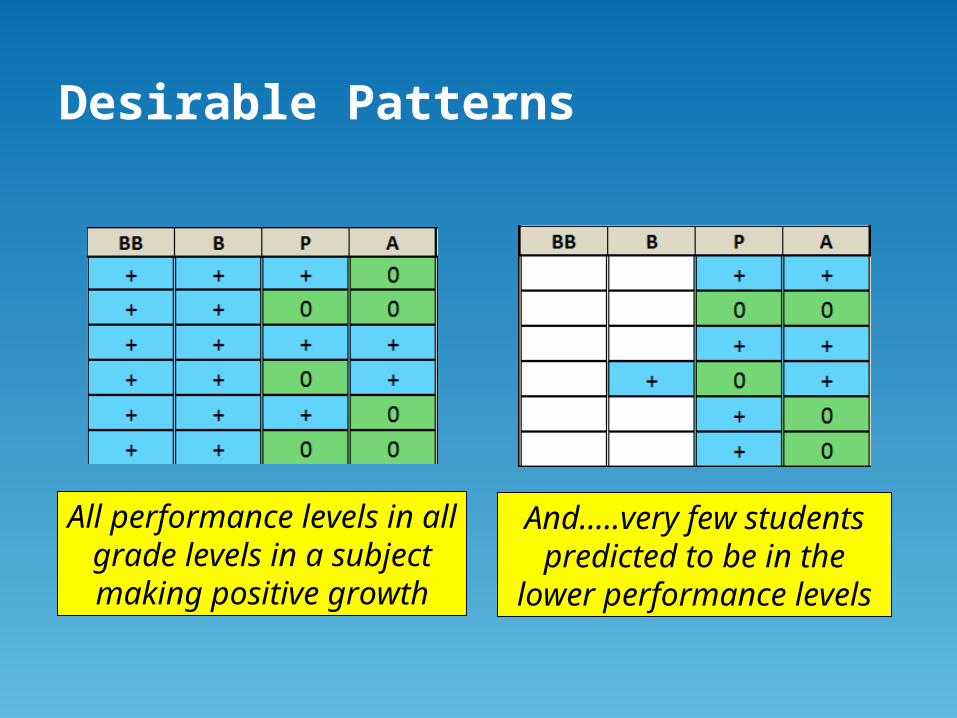
Desirable Patterns
All performance levels in all grade levels in a subject making positive growth
And…..very few students predicted to be in the lower
performance levels

Questions?
What patterns and trends do you see in your data?

What questions should you ask when viewing these data?

Discussion Points: Why might we be seeing these patterns and trends?
PVAAS Resources
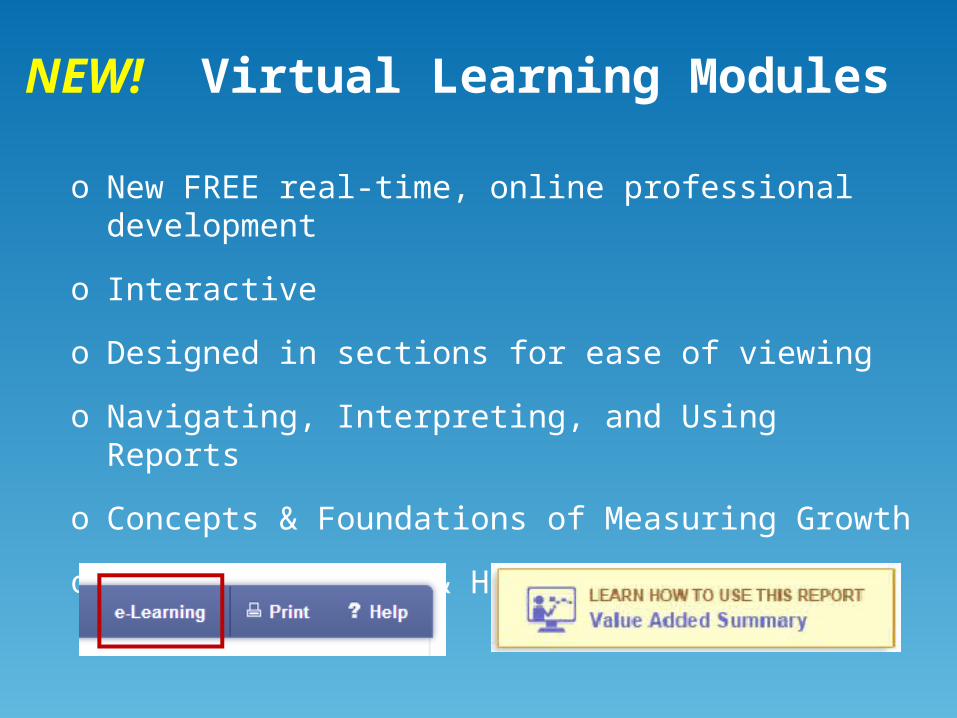
NEW! Virtual Learning Modules
o New FREE real-time, online professional development
o Interactive
o Designed in sections for ease of viewing
o Navigating, Interpreting, and Using Reports
o Concepts & Foundations of Measuring Growth
o High Achievement & High Growth

PVAAS Help Menus
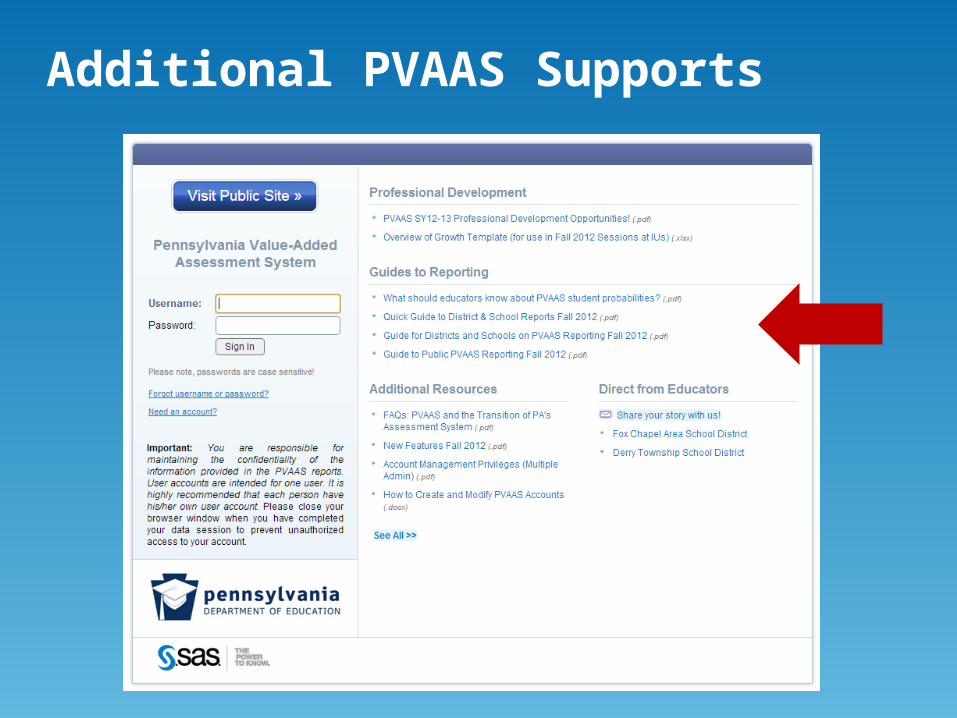
Additional PVAAS Supports
PVAAS Materials or Statewide Implementation
717-606-1911
PVAAS Report Web Site
https://pvaas.sas.com

www.pde.state.pa.us
333 Market Street Harrisburg, PA 17126