suprabh prakash, sushant k. raut, and s. uma sankar tata
TRANSCRIPT

TIFR/TH/12-03
Getting the best out of T2K and NOνA
Suprabh Prakash,1, ∗ Sushant K. Raut,1, † and S. Uma Sankar ‡1, 2, §
1 Department of Physics, Indian Institute of Technology Bombay, Mumbai 400076, India
2 Department of Theoretical Physics,
Tata Institute of Fundamental Research, Mumbai 400005, India
(Dated: October 30, 2018)
Abstract
We explore the combined physics potential of T2K and NOνA in light of the moderately large
measured value of θ13. For sin2 2θ13 = 0.1, which is close to the best fit value, a 90 % C.L. evidence
for the hierarchy can be obtained only for the combinations (Normal hierarchy, −170◦ ≤ δCP ≤ 0◦)
and (Inverted hierarchy, 0◦ ≤ δCP ≤ 170◦), with the currently planned runs of NOνA and T2K.
However, the hierarchy can essentially be determined for any value of δCP , if the statistics of NOνA
are increased by 50% and those of T2K are doubled. Such an increase will also give an allowed
region of δCP around the its true value, except for the CP conserving cases δCP = 0 or± 180◦. We
demonstrate that any measurement of δCP is not possible without first determining the hierarchy.
We find that comparable data from a shorter baseline (L ∼ 130 km) experiment will not lead to
any significant improvement.
PACS numbers: 14.60.Pq,14.60.Lm,13.15.+g
Keywords: Neutrino Mass Hierarchy, Long Baseline Experiments
‡ Corresponding author∗Email Address: [email protected]†Email Address: [email protected]§Email Address: [email protected]
1
arX
iv:1
201.
6485
v3 [
hep-
ph]
11
Sep
2012

I. INTRODUCTION
Neutrino physics has entered a phase of precision measurements. During the past few
years, the following precise measurements of neutrino parameters have been made with high
intensity sources:
• The smaller mass-squared difference ∆21 = m22 − m2
1 is measured by KamLAND [1]
while the precision on θ12 is controlled by the solar experiments [2]. Global analysis of
all the data, in the three flavour oscillation framework, gives ∆21 = (7.6± 0.2)× 10−5
eV2 and sin2 θ12 = 0.312± 0.016 [3].
• MINOS [4] experiment has measured the magnitude of the mass-squared difference in
the νµ survival probability. The precision on θ23 is controlled by atmospheric neutrino
data [5]. Global analysis gives two distinct values of ∆31 depending on whether it is
positive [which is the case for normal hierarchy (NH)] or negative [which is the case
for inverted hierarchy (IH)]. The ranges are ∆31(NH) = (2.45± 0.09)× 10−3 eV2 and
∆31(IH) = (−2.31± 0.09)× 10−3 eV2 with sin2 θ23 = 0.51± 0.06 for both cases [3].
• The global fits to data from the accelerator experiments T2K [6] and MINOS [7] and
the reactor experiments DChooz [8], Daya Bay [9] and RENO [10] have determined
θ13 to be non-zero at 5σ level, with the best fit very close to sin2 2θ13 ' 0.1 [11, 12].
We expect the following improvements in precision during the next few years.
• Very high statistics data from T2K [13] and MINOS [4] experiments will improve the
precision on |∆31| and sin2 2θ23 to a few percent level.
• Reactor experiments are taking further data [14–17]. The survival probability at
these reactor experiments is sensitive only to the mixing angle θ13 and hence they can
measure this angle unambiguously. By the time they finish running (around 2016), we
estimate that they should be able to measure sin2 2θ13 to a precision of about 0.005.
In light of these current and expected near future measurements, the next goals of neutrino
oscillation experiments are the determination of neutrino mass hierarchy, detection of CP
violation in the leptonic sector and measurement of δCP . These goals can be achieved by high
statistics accelerator experiments measuring νµ → νe and νµ → νe oscillation probabilities.
2

Among such experiments, T2K is presently taking data and NOνA is under construction
and is expected to start taking data around 2014. All other experiments, capable of making
these measurements, are far off in future. In this paper, we study the combined ability of
T2K and NOνA to achieve the above goals.
In the above discussion, we have two different magnitudes for ∆31 for the two hierarchies
because the mass-squared difference measured in νµ survival probability is not ∆31 but is an
effective one defined by [18, 19]
∆m2µµ = ∆31 −
(cos2 θ12 − cos δCP sin θ13 sin 2θ12 tan θ23
)∆21. (1)
Accelerator experiments, such as MINOS and T2K, measure the magnitude of the above
quantity. But the magnitudes of ∆31 will turn out to be different for ∆31 positive (NH) and
∆31 negative (IH).
II. SIMULATION DETAILS
Before discussing various physics issues, we discuss the details of our simulation. We do
this because we will illustrate various points through the means of simulation.
We use the software GLoBES [20, 21] for simulating the data of T2K, NOνA and an
envisaged short baseline experiment from CERN to Frejus (C2F), which is a scaled down
version of MEMPHYS [13, 22–32]. Various details of these experiments and their charac-
teristics, especially the signal and background acceptances, are given in Table I. The basic
properties of NOνA are taken from Ref. [24] and of T2K are taken from Ref. [13]. The
efficiencies for each of the experiments are taken from GLoBES [20, 21]. The background
errors consist of errors in flux normalization (norm) and in spectrum (tilt).
We have kept the solar parameters ∆21 and θ12 fixed at their best fit values throughout
the calculation. We have taken the central values of |∆31| and θ23 to be their best fit values.
We took σ(sin2 2θ23
)= 0.02 and σ (|∆31|) = 0.03×(|∆31|), because of the precision expected
from T2K. We have done computations for various different values of sin2 2θ13 in the range
0.05 − 0.2 [11, 12]. We took σ(sin2 2θ13
)= 0.005 which is the final precision we can hope
for from the reactor experiments. The value of the CP-violating phase δCP is varied over its
entire range −180◦ to 180◦.
3

Characteristic NOνA T2K C2F (assumed)
Baseline 812 km 295 km 130 km
Location Fermilab - Ash River J-PARC - Kamioka CERN - Frejus
Beam NuMI beam 0.8◦ off -
axis
JHF beam 2.5◦ off -
axis
SPL superbeam
Beam power 0.7 MW 0.75 MW 0.75 MW
Flux peaks at 2 GeV 0.6 GeV 0.35 GeV
Pµe 1st Osc. Maximum 1.5 GeV 0.55 GeV 0.25 GeV
Detector TASD, 15 kton Water Cerenkov, 22.5
kton
Water Cerenkov, 22.5
kton
Runtime (years) 3 in ν + 3 in ν 5 in ν 3 in ν + 3 in ν
Signal 1 (acceptance) νe appearance(26%) νe appearance(87%) νe appearance(71%)
Signal 1 error 5%, 2.5% 2%, 1% 2%, 0.01%
(norm.,tilt)
Background 1 (acceptance) mis - id muons/anti
- muons(0.13%), NC
events(0.28%), Beam
νe/νe(16%)
mis - id muons/anti
- muons, NC events,
Beam νe/νe(binned
events from GLoBES
[20, 21])
mis - id muons/anti
- muons(0.054%), NC
events(0.065%), Beam
νe/νe(70%)
Background 1 error 10%, 2.5% 20%, 5% 2%, 0.01%
(norm.,tilt)
Signal 2 (acceptance) νe appearance(41%) νe appearance(87%) νe appearance(68%)
Signal 2 error 5%, 2.5% 2%, 1% 2%, 0.01%
(norm.,tilt)
Background 2 (acceptance) mis - id muons/anti
- muons(0.13%), NC
events(0.88%), Beam
νe/νe(33.6%)
mis - id muons/anti
- muons, NC events,
Beam νe/νe(binned
events from GLoBES
[20, 21])
mis - id muons/anti
- muons(0.054%), NC
events(0.25%), Beam
νe/νe(70%)
Background 2 error 10%, 2.5% 20%, 5% 2%, 0.01%
(norm.,tilt)
TABLE I: Properties of various long baseline experiments considered in this paper.4
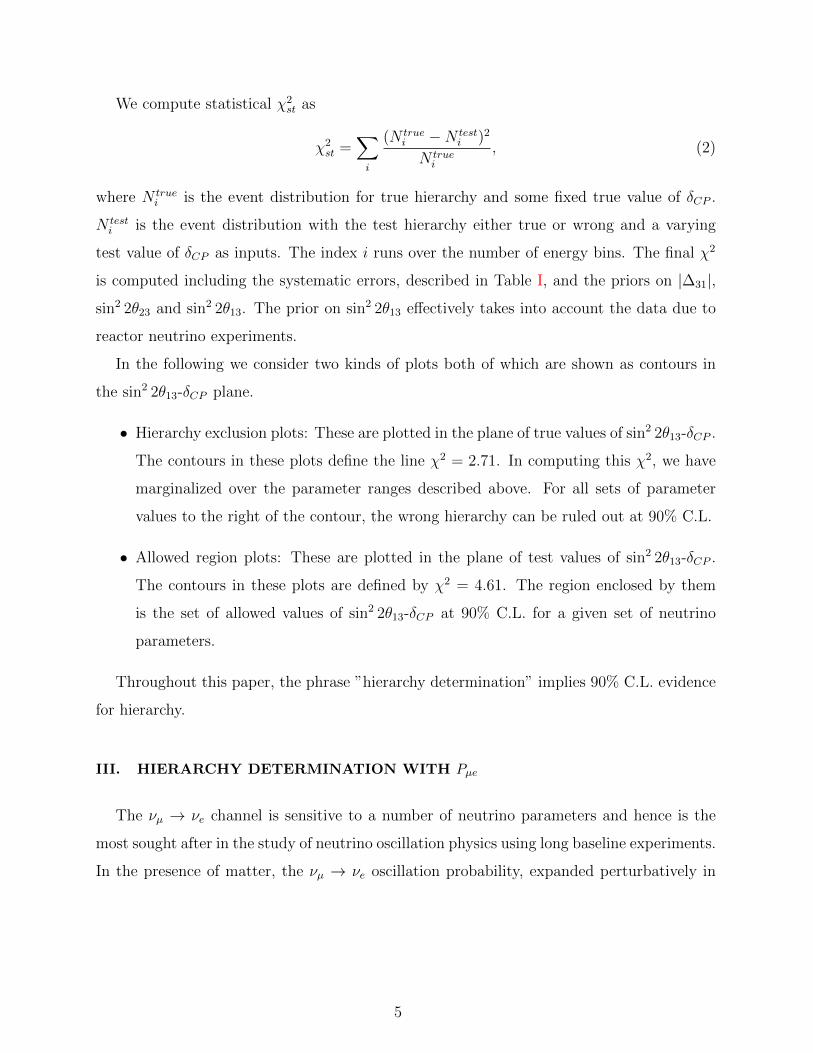
We compute statistical χ2st as
χ2st =
∑i
(N truei −N test
i )2
N truei
, (2)
where N truei is the event distribution for true hierarchy and some fixed true value of δCP .
N testi is the event distribution with the test hierarchy either true or wrong and a varying
test value of δCP as inputs. The index i runs over the number of energy bins. The final χ2
is computed including the systematic errors, described in Table I, and the priors on |∆31|,
sin2 2θ23 and sin2 2θ13. The prior on sin2 2θ13 effectively takes into account the data due to
reactor neutrino experiments.
In the following we consider two kinds of plots both of which are shown as contours in
the sin2 2θ13-δCP plane.
• Hierarchy exclusion plots: These are plotted in the plane of true values of sin2 2θ13-δCP .
The contours in these plots define the line χ2 = 2.71. In computing this χ2, we have
marginalized over the parameter ranges described above. For all sets of parameter
values to the right of the contour, the wrong hierarchy can be ruled out at 90% C.L.
• Allowed region plots: These are plotted in the plane of test values of sin2 2θ13-δCP .
The contours in these plots are defined by χ2 = 4.61. The region enclosed by them
is the set of allowed values of sin2 2θ13-δCP at 90% C.L. for a given set of neutrino
parameters.
Throughout this paper, the phrase ”hierarchy determination” implies 90% C.L. evidence
for hierarchy.
III. HIERARCHY DETERMINATION WITH Pµe
The νµ → νe channel is sensitive to a number of neutrino parameters and hence is the
most sought after in the study of neutrino oscillation physics using long baseline experiments.
In the presence of matter, the νµ → νe oscillation probability, expanded perturbatively in
5

the small mass-squared difference, ∆21 is given by [33–35]
P (νµ → νe) = Pµe = sin2 2θ13 sin2 θ23sin2 ∆(1− A)
(1− A)2
+α cos θ13 sin 2θ12 sin 2θ13 sin 2θ23 cos(∆ + δCP )sin ∆A
A
sin ∆(1− A)
1− A
+α2 sin2 2θ12 cos2 θ13 cos2 θ23sin2 ∆A
A2(3)
where ∆ = ∆31L/4E, A = A/∆31, α = ∆21/∆31. A is the Wolfenstein matter term [36] and
is given by A(eV2) = 0.76× 10⁻⁴ρ (gm/cc)E(GeV).
For NH ∆31 is positive and for IH ∆31 is negative. The matter term A is positive for
neutrinos and is negative for anti-neutrinos. Hence, in neutrino oscillation probability, A is
positive for NH and is negative for IH. For anti-neutrinos, A is negative for NH and positive
for IH and the sign of δCP is reversed. The presence of the term A in Pµe and in Pµe makes
them sensitive to hierarchy. The longer the baseline of an experiment, the greater is the
sensitivity to hierarchy because, Pµe peaks at a higher energy for longer baseline and the
matter term is larger for higher energies.
As can be seen from Eq. (3), Pµe is dependent on θ13, hierarchy amd δCP in addition to
other well determined parameters. A measurement of this quantity will not give us a unique
solution of neutrino parameters but instead will lead to a number of degenerate solutions
[37–40]. Since θ13 is measured unambiguously and precisely [8–10], degeneracies involving
this parameter are no longer relevant. Only hierarchy-δCP degeneracy has to be considered.
This degeneracy prevents any one experiment from determining hierarchy and δCP , leading
to the need for data from two or more long baseline experiments [22, 41–44].
A. Hierarchy-δCP degeneracy for NOνA
First we consider the hierarchy determination capacity of NOνA alone because the matter
term and the hierarchy dependence is the largest for this experiment, due to the flux peaking
at higher energy. In Fig. 1 (left panel), we have plotted Pµe vs E for both NH and for IH
for NOνA baseline of 812 km. The bands correspond to the variation of δCP from −180◦
to +180◦. The values of Pµe are, in general, higher for NH and lower for IH. This is a
straightforward consequence of the A dependence of Pµe. Further, we note that for both
NH and IH, the value of δCP = +90◦ gives the lowest curve in the band and the value
6

of δCP = −90◦ gives the highest curve in the band. This behaviour can also be easily
understood from Eq. (3). At the oscillation maximum, ∆ ' 90◦. Hence cos(∆ + δCP ) is
+1 for δCP = −90◦ and is −1 for δCP = +90◦. As can be seen from the figure, there is an
overlap of the bands for (NH, δCP ' +90◦) and (IH, δCP ' −90◦). Hence, if the measured
probability comes to be these values, then we have two degenerate solutions. In Fig. 1 (right
panel), we have plotted the corresponding anti-neutrino probabilities. Pµe is higher for IH
and lower for NH as a consequence of the reversal of A sign. Since δCP sign is reversed for
anti-neutrinos, here δCP = +90◦ defines the upper curves and δCP = −90◦ defines the lower
curves. Here again there is an overlap between (NH, δCP ' +90◦) and (IH, δCP ' −90◦) so
we get the same degenerate solutions as the neutrino case.
0
0.03
0.06
0.09
0.12
0.15
1 2 3 4 5
Pro
bab
ilit
y(n
eutr
inos)
E(GeV)
sin22θ13 = 0.1
812 km
NHIH
δCP = +90o
δCP= -90o
0
0.03
0.06
0.09
0.12
0.15
1 2 3 4 5
Pro
bab
ilit
y(a
nti
-neu
trin
os)
E(GeV)
sin22θ13 = 0.1
812 km
NHIH
δCP = +90o
δCP= -90o
FIG. 1: (colour online) Pµe (left panel) and Pµe (right panel) bands for NOνA for sin2 2θ13 = 0.1
From Fig. 1, we can define the concept of favourable half plane for each hierarchy. Suppose
NH is the true hierarchy. If δCP is in the lower half plane (−180◦ ≤ δCP ≤ 0◦, LHP) then
all the curves for Pµe(NH, δCP ) lie much above the set of curves for Pµe(IH, δCP ). In the
case of anti-neutrinos, Pµe(NH, δCP ) will be much below Pµe(IH, δCP ). In such a situation,
the data from NOνA alone can determine the hierarchy. Therefore we call the LHP to be
the favourable half-plane for NH. Similar arguments hold if IH is true hierarchy and δCP is
in the upper half plane (UHP). So UHP is the favourable half plane for IH. Thus, if nature
chooses one of the following two combinations (NH, LHP) or (IH, UHP), then NOνA , by
itself, can determine the hierarchy.
7

The separation between the set of curves Pµe(NH, δCP ) and Pµe(IH, δCP ) also depends
on θ13. The two sets have more overlap for smaller values of θ13 but become more separated
for larger values of θ13. This is illustrated in Fig. 2, showing Pµe vs E, for a lower and higher
value of sin2 2θ13. It is easier to determine the hierarchy if the separation between the curves
is larger, that is if θ13 is larger.
0
0.03
0.06
0.09
0.12
0.15
1 2 3 4 5
Pro
bab
ilit
y(n
eutr
inos)
E(GeV)
sin22θ13 = 0.05
812 km
NHIH
δCP = +90o
δCP= -90o
0
0.03
0.06
0.09
0.12
0.15
1 2 3 4 5
Pro
bab
ilit
y(n
eutr
inos)
E(GeV)
sin22θ13 = 0.15
812 km
NHIH
δCP = +90o
δCP= -90o
FIG. 2: (colour online) Pµe bands for NOνA for sin2 2θ13 = 0.05 (left panel) and 0.15 (right panel)
The favourable and unfavourable half planes for a particular hierarchy can also be defined
from Eq. (3), where the δCP dependence occurs purely in the form cos(∆ + δCP ). If NH is
the true hierarchy, ∆ ≈ 90◦ around the probability maximum. Then, the δCP dependent
term increases Pµe if δCP is in the LHP and decreases it if δCP is in the UHP. Hence a
cleaner separation from Pµe(IH, δCP ) can be obtained only if δCP is in the LHP. If IH is
the true hierarchy, ∆ ≈ −90◦. Then Pµe is reduced, and moved away from Pµe(NH, δCP ) if
δCP is in the UHP. Thus UHP forms the favourable half plane for IH, whereas LHP is the
favourable half plane for NH. Even if we use the anti-neutrino oscillation probabilities, the
same considerations will hold. Therefore, the same relation between hierarchy and half-plane
holds for both neutrino and anti-neutrino data.
We plot the hierarchy discrimination ability of NOνA in Fig. 3. We see that, for
sin2 2θ13 = 0.1, the hierarchy can be determined at 90 % C.L. for the following two com-
binations: (NH, −170◦ ≤ δCP ≤ −10◦) or (IH, 10◦ ≤ δCP ≤ 170◦). The statistics for the
experiment are not quite enough to determine the hierarchy for the whole favourable half
8

plane for this value of θ13. If sin2 2θ13 = 0.12, then the hierarchy can be determined for the
whole favoured half plane. It was shown in Ref. [45] that NOνA can determine the hierarchy
for 45 % of the δCP range for sin2 2θ13 = 0.1.
-180
-120
-60
0
60
120
180
0 0.05 0.1 0.15 0.2
δC
P(t
rue)
sin2 2θ13(true)
NOνA[3+3], 90% C.L.
True:NH / Test:IH
-180
-120
-60
0
60
120
180
0 0.05 0.1 0.15 0.2
δC
P(t
rue)
sin2 2θ13(true)
NOνA[3+3], 90% C.L.
True:IH / Test:NH
FIG. 3: (colour online) Hierarchy exclusion plots for NOνA for 3ν+3ν running when NH is true (left panel)
and when IH is true (right panel)
For smaller values of sin2 2θ13, one needs larger statistics to determine the hierarchy for
the whole favourable half plane. This is illustrated in Fig. 4. With 1.5 times the presently
projected statistics of NOνA , one can determine the hierarchy for the whole of the respective
favourable half planes, for both NH and IH, for sin2 2θ13 = 0.1. Similar conclusions were
obtained earlier in Ref. [46]. If δCP happens to be in the unfavourable half plane, even
tripling of statistics leads to hierarchy determination only for a very small range of δCP .
9

-180
-120
-60
0
60
120
180
0 0.05 0.1 0.15 0.2
δC
P(t
rue)
sin2 2θ13(true)
True:NH / Test:IH, 90% C.L.
NOνA1.5*NOνA
3*NOνA
-180
-120
-60
0
60
120
180
0 0.05 0.1 0.15 0.2
δC
P(t
rue)
sin2 2θ13(true)
True:IH / Test:NH, 90% C.L.
NOνA1.5*NOνA
3*NOνA
FIG. 4: (colour online) Hierarchy exclusion plots for NOνA with boosted statistics for 3ν+3ν running
when NH is true (left panel) and when IH is true (right panel).
B. Resolving the hierarchy-δCP degeneracy with T2K
As we demonstrated in the previous subsection, NOνA alone can’t determine the hier-
archy if nature chooses one of the unfavourable combinations (NH, UHP) or (IH, LHP). In
this subsection, we explore how data from T2K can help in resolving this problem. Since
the baseline of T2K is smaller, the probability peaks at a lower energy and hence the flux is
designed to peak at a lower energy. Therefore the matter term A is much smaller for T2K.
10

-180
-120
-60
0
60
120
180
0 0.05 0.1 0.15 0.2
δC
P(t
rue)
sin2 2θ13(true)
True:NH / Test:IH, 90% C.L.
NOνA+T2K
-180
-120
-60
0
60
120
180
0 0.05 0.1 0.15 0.2
δC
P(t
rue)
sin2 2θ13(true)
True:IH / Test:NH, 90% C.L.
NOνA+T2K
FIG. 5: (colour online) Hierarchy exclusion plots for NOνA + T2K with nominal statistics when NH is
true (left panel) and when IH is true (right panel).
In Fig. 5, we plot the combined hierarchy exclusion capability of NOνA and T2K. From
this figure we see that, for sin2 2θ13 ≤ 0.1, hierarchy determination is not possible for any
δCP in the unfavourable half-plane, Hence, in our example, we assume that the statistics of
NOνA are 50 % more than the nominal value and those of T2K are twice the nominal value.
We illustrate the effect of T2K data on hierarchy determination by a set of examples.
First we assume that NH is the true hierarchy and the true value of δCP = 90◦, i.e. in the
unfavourable half plane. In such a situation, NOνA data gives two degenerate solutions in
the form of (NH, δCP ≈ 90◦) and (IH, δCP in LHP), as shown in Fig. 6 (left panel).
11

-180
-120
-60
0
60
120
180
0.05 0.07 0.09 0.11 0.13 0.15
δC
P (
test
)
sin2 2θ13 (test)
1.5*NOνA, 90% C.L.
true pointTrue:NH / Test:NHTrue:NH / Test:IH
-180
-120
-60
0
60
120
180
0.05 0.07 0.09 0.11 0.13 0.15
δC
P (
test
)
sin2 2θ13 (test)
1.5*NOνA+2*T2K, 90% C.L.
true pointTrue:NH / Test:NHTrue:NH / Test:IH
FIG. 6: (colour online) Allowed sin2 2θ13-δCP plots for 1.5*NOνA (left panel) and 1.5*NOνA + 2*T2K
(right panel) with true sin2 2θ13 = 0.1 and true δCP = 90◦.
-180
-120
-60
0
60
120
180
0.05 0.07 0.09 0.11 0.13 0.15
δC
P (
test
)
sin2 2θ13 (test)
1.5*NOνA, 90% C.L.
true pointTrue:IH / Test:NHTrue:IH / Test:IH
-180
-120
-60
0
60
120
180
0.05 0.07 0.09 0.11 0.13 0.15
δC
P (
test
)
sin2 2θ13 (test)
1.5*NOνA+2*T2K, 90% C.L.
true pointTrue:IH / Test:NHTrue:IH / Test:IH
FIG. 7: (colour online) Allowed sin2 2θ13-δCP plots for 1.5*NOνA (left panel) and 1.5*NOνA + 2*T2K
(right panel) with true sin2 2θ13 = 0.1 and true δCP = −90◦.
But, the addition of T2K data almost rules out the (IH,LHP) solution, seen in the right
panel of Fig. 6. It is true that a very small part of the allowed region is left behind. But,
comparing the two panels of Fig. 6, we see that the addition of T2K data reduces the
allowed NH region only by a small amount whereas the allowed IH region is drastically
12

reduced. This gives a very strong indication of which hierarchy is correct. Thus the data
of NOνA in conjunction with that of T2K can effectively discriminate against the wrong
hierarchy. This holds true for the case of IH being the true hierarchy with δCP in LHP,
illustrated in Fig. 7. Figs. 6 and 7 are similar to figures 2 and 3 of Ref. [45], which are done
for the same δCP values. Those figures also show the large shrinkage of the wrong hierarchy
solution, with the addition of T2K data. In the following, we will demonstrate that this
feature occurs for all values of δCP (true) in the unfavourable half-plane.
A theoretical analysis of the hierarchy-δCP degeneracy resolution, with data from NOνA
and T2K, was done in Ref. [47]. To keep the arguments simple, first it was assumed that
θ23 is maximal and that sin2 2θ13 is measured accurately by the reactor experiments. In such
a situation, given a probability measurement, there exist two degenerate solutions: (correct
hierarchy, correct δCP ) and (wrong hierarchy, wrong δCP ). In Ref. [47], it was shown that,
for a given experiment, [sin(correct δCP )−sin(wrong δCP )] is proportional to the matter term
A for that experiment. For T2K, this difference is small and is about 0.7 for sin2 2θ13 = 0.1.
For NOνA it is three times larger. Therefore, the wrong δCP values for T2K data and for
NOνA data are widely different. A combined analysis of data from T2K and NOνA will
pick out the correct hierarchy and a range of δCP around the correct value, provided the
statistics from each experiment are large enough
The above idea is illustrated below in Figs. 8 and 9. In Fig. 8, we have plotted χ2 vs
δCP (test) for various true values of δCP for NOνA experiment. In the left panel, the true
values of δCP are all in LHP which is the favourable half-plane for NH. We find that, except
for the CP conserving case of δCP = −180◦, all the χ2 are above 9. Hence the wrong
hierarchy can be excluded for most of the values of δCP in the favourable half-plane. In
the right panel, the true values of δCP are all in UHP, which is the unfavourable half-plane
for NH. And we find that in all cases, the χ2 becomes nearly zero (except for δCP = 0)
for −120◦ ≤ δCP (test) ≤ −60◦. These are the degenerate (wrong hierarchy, wrong δCP )
solutions mentioned above. Hence it is impossible to rule out the wrong hierarchy if true
δCP is in the unfavourable half-plane.
13

0
10
20
30
40
50
60
70
-180 -120 -60 0 60 120 180
χ2
δCP(test)
1.5*NOνA True sin22θ13 : 0.1
True:NH / Test:IH
True δCP = -180o
True δCP = -135o
True δCP = -90o
True δCP = -45o
0
10
20
30
40
50
60
70
-180 -120 -60 0 60 120 180
χ2
δCP(test)
1.5*NOνA True sin22θ13 : 0.1
True:NH / Test:IH
True δCP = 0
True δCP = 45o
True δCP = 90o
True δCP = 135o
FIG. 8: (colour online) χ2 vs. test δCP for 1.5*NOνA . Here true and test sin2 2θ13 = 0.1. NH is true and
IH is test. Different curves correspond to various true δCP in lower half plane (left panel) and upper half
plane (right panel).
In Fig. 9, we have plotted χ2 vs δCP (test) for various true values of δCP for T2K exper-
iment. Once again, the left panel contains plots for δCP in LHP and the right panel the
plots for δCP in UHP. From the left panel, we see that T2K can’t rule the wrong hierarchy.
This is to be contrasted with NOνA case, where the wrong hierarchy is ruled out by NOνA
alone, if δCP is in the favourable half-plane. But, as we see below, T2K data is crucial for
hierarchy discrimination, if δCP is in the unfavourable half-plane.
14

0
5
10
15
20
25
30
-180 -120 -60 0 60 120 180
χ2
δCP(test)
2*T2K True sin22θ13 : 0.1
True:NH / Test:IH
True δCP = -180o
True δCP = -135o
True δCP = -90o
True δCP = -45o
0
5
10
15
20
25
30
-180 -120 -60 0 60 120 180
χ2
δCP(test)
2*T2K True sin22θ13 : 0.1
True:NH / Test:IH
True δCP = 0
True δCP = 45o
True δCP = 90o
True δCP = 135o
FIG. 9: (colour online) χ2 vs. test δCP for 2*T2K. Here true and test sin2 2θ13 = 0.1. NH is true and IH
is test. Different curves correspond to various true δCP in lower half plane (left panel) and upper half plane
(right panel).
From the right panel, we see that the degenerate (wrong hierarchy, wrong δCP ) solution for
T2K occurs for δCP (test) around 0 or ±180◦. And in the range −120◦ ≤ δCP (test) ≤ −60◦,
where the degenerate wrong hierarchy solution for NOνA occured, the χ2 for T2K is quite
large. Because of this wide difference between the δCP values of the degenerate (wrong
hierarchy, wrong δCP ) solutions of NOνA data and T2K data, together they rule out the
wrong hierarchy.
We illustrate this hierarchy discriminating power for a few cases where true value of δCP is
in the unfavourable half plane. Figs. 10, 11 and 12 show the χ2 plots for δCP = 90◦, 45◦ and 0
respectively, with NH as the true hierarchy. The left panel shows χ2 for 1.5*NOνA alone
whereas the right panel shows the χ2 for 1.5*NOνA +2*T2K. These plots show χ2 for the
two cases where the true and test hierarchies are the same and are opposite. In these plots,
we have marginalised over sin2 2θ13. In the left panel of Fig. 10, there is a large allowed
region of δCP (test) in the wrong half-plane, if the test hierarchy is the wrong hierarchy. In
the right panel, this region is almost completely ruled out, with the addition of T2K data.
There is a just a small region, centered around δCP (test) ≈ 180◦, where the χ2 dips just
below 2.71, the cut-off for 90% C.L. We see very similar features for true δCP = 45◦ in
Fig. 11 and for true δCP = 0 in Fig. 12. Essentially identical features are seen for the case
15

where IH is true hierarchy in Fig. 13 with true δCP = −90◦, Fig. 14 with true δCP = −45◦
and Fig. 15 with true δCP = 0.
0
5
10
15
20
25
30
35
40
-180 -120 -60 0 60 120 180
χ2
δCP(test)
True (sin22θ13, δCP) = (0.1, 90
o)
1.5*NOνA
χ2 = 2.71, 90% C.L.
True:NH / Test:NHTrue:NH / Test:IH
0
5
10
15
20
25
30
35
40
-180 -120 -60 0 60 120 180
χ2
δCP(test)
True (sin22θ13, δCP) = (0.1, 90
o)
1.5*NOνA+2*T2K
χ2 = 2.71, 90% C.L.
True:NH / Test:NHTrue:NH / Test:IH
FIG. 10: (colour online) χ2 vs δCP (test) plots for 1.5*NOνA (left panel) and 1.5*NOνA + 2*T2K (right
panel) with true sin2 2θ13 = 0.1 and true δCP = 90◦.
0
5
10
15
20
25
30
35
40
-180 -120 -60 0 60 120 180
χ2
δCP(test)
True (sin22θ13, δCP) = (0.1, 45
o)
1.5*NOνA
χ2 = 2.71, 90% C.L.
True:NH / Test:NHTrue:NH / Test:IH
0
5
10
15
20
25
30
35
40
-180 -120 -60 0 60 120 180
χ2
δCP(test)
True (sin22θ13, δCP) = (0.1, 45
o)
1.5*NOνA+2*T2K
χ2 = 2.71, 90% C.L.
True:NH / Test:NHTrue:NH / Test:IH
FIG. 11: (colour online) χ2 vs δCP (test) plots for 1.5*NOνA (left panel) and 1.5*NOνA + 2*T2K (right
panel) with true sin2 2θ13 = 0.1 and true δCP = 45◦.
16

0
5
10
15
20
25
30
35
40
-180 -120 -60 0 60 120 180
χ2
δCP(test)
True (sin22θ13, δCP) = (0.1, 0)
1.5*NOνA
χ2 = 2.71, 90% C.L.
True:NH / Test:NHTrue:NH / Test:IH
0
5
10
15
20
25
30
35
40
-180 -120 -60 0 60 120 180
χ2
δCP(test)
True (sin22θ13, δCP) = (0.1, 0)
1.5*NOνA+2*T2K
χ2 = 2.71, 90% C.L.
True:NH / Test:NHTrue:NH / Test:IH
FIG. 12: (colour online) χ2 vs δCP (test) plots for 1.5*NOνA (left panel) and 1.5*NOνA + 2*T2K (right
panel) with true sin2 2θ13 = 0.08 and true δCP = 0 (systematics included).
0
5
10
15
20
25
30
35
40
-180 -120 -60 0 60 120 180
χ2
δCP(test)
True (sin22θ13, δCP) = (0.1, -90
o)
1.5*NOνA
χ2 = 2.71, 90% C.L.
True:IH / Test:NHTrue:IH / Test:IH
0
5
10
15
20
25
30
35
40
-180 -120 -60 0 60 120 180
χ2
δCP(test)
True (sin22θ13, δCP) = (0.1, -90
o)
1.5*NOνA+2*T2K
χ2 = 2.71, 90% C.L.
True:IH / Test:NHTrue:IH / Test:IH
FIG. 13: (colour online) χ2 vs δCP (test) plots for 1.5*NOνA (left panel) and 1.5*NOνA + 2*T2K (right
panel) with true sin2 2θ13 = 0.1 and true δCP = −90◦.
17

0
5
10
15
20
25
30
35
40
-180 -120 -60 0 60 120 180
χ2
δCP(test)
True (sin22θ13, δCP) = (0.1, -45
o)
1.5*NOνA
χ2 = 2.71, 90% C.L.
True:IH / Test:NHTrue:IH / Test:IH
0
5
10
15
20
25
30
35
40
-180 -120 -60 0 60 120 180
χ2
δCP(test)
True (sin22θ13, δCP) = (0.1, -45
o)
1.5*NOνA+2*T2K
χ2 = 2.71, 90% C.L.
True:IH / Test:NHTrue:IH / Test:IH
FIG. 14: (colour online) χ2 vs δCP (test) plots for 1.5*NOνA (left panel) and 1.5*NOνA + 2*T2K (right
panel) with true sin2 2θ13 = 0.1 and true δCP = −45◦.
0
5
10
15
20
25
30
35
40
-180 -120 -60 0 60 120 180
χ2
δCP(test)
True (sin22θ13, δCP) = (0.1, 0)
1.5*NOνA
χ2 = 2.71, 90% C.L.
True:IH / Test:NHTrue:IH / Test:IH
0
5
10
15
20
25
30
35
40
-180 -120 -60 0 60 120 180
χ2
δCP(test)
True (sin22θ13, δCP) = (0.1, 0)
1.5*NOνA+2*T2K
χ2 = 2.71, 90% C.L.
True:IH / Test:NHTrue:IH / Test:IH
FIG. 15: (colour online) χ2 vs δCP (test) plots for 1.5*NOνA (left panel) and 1.5*NOνA + 2*T2K (right
panel) with true sin2 2θ13 = 0.1 and true δCP = 0.
Finally we consider how hierarchy sensitivity improves with increasing statistics. We
consider three scenarios:
• T2K will have a 5 year neutrino run with its design luminosity and NOνA will run
according to its present plan.
18

• T2K will have twice the above statistics and NOνA will have 1.5 times its designed
statistics.
• T2K will have four times the above statistics and NOνA will have thrice its designed
statistics.
The exclusion plots are given in Fig. 16. For all points to the right of the contours, the
wrong hierarchy can be ruled out.
-180
-120
-60
0
60
120
180
0 0.05 0.1 0.15 0.2
δC
P(t
rue)
sin2 2θ13(true)
True:NH / Test:IH, 90% C.L.
NOνA+T2K1.5*NOνA+2*T2K
3*NOνA+4*T2K
-180
-120
-60
0
60
120
180
0 0.05 0.1 0.15 0.2
δC
P(t
rue)
sin2 2θ13(true)
True:IH / Test:NH, 90% C.L.
NOνA+T2K1.5*NOνA+2*T2K
3*NOνA+4*T2K
FIG. 16: (colour online) Hierarchy exclusion plots for combined data from NOνA and T2K with various
boosts in statistics when NH is true (left panel) and when IH is true (right panel).
In the left panel we assumed NH is the true hierarchy and in the right panel we assumed IH
is the true hierarchy. We see that increasing the statistics from nominal values to 1.5*NOνA
+ 2*T2K dramatically improves the ability to rule out the wrong hierarchy, if δCP (true) is in
the unfavourable half-plane. Further improvement occurs if the statistics are increased even
more. In particular, if sin2 2θ13 = 0.1 [11, 12] the hierarchy can be essentially established
at 90% C.L., for any true value of δCP , with 1.5 times the designed statistics of NOνA and
twice the designed statistics of T2K. This point was noted previously in Ref. [46].
It is evident now that an experiment that can exclude the wrong δCP plane effectively can
be of great help in determining hierarchy when run in conjunction with NOνA. We saw that
T2K, with a short baseline and smaller matter effects, has such properties. We now inquire
whether having an experiment with a baseline shorter than T2K, such as C2F, which is 130
19

km long, can help. For such a short baseline, Pµe is maximum at E = 0.25 GeV. At such
energies, the matter term A is very small.
To make a just comparison in terms of cost, we assume C2F to have the same beam
power and detector size as that of T2K and 3 years each of ν and ν running. We consider
two scenarios. NOνA with 1.5 times its designed statistics and T2K with twice its designed
statistics (scenario A) against NOνA with 1.5 times its designed statistics and T2K and C2F
with their nominal designed statistics (scenario B). In Fig. 17, we compare the ability of
scenario A (left panel) and scenario B (right panel) to exclude the wrong hierarchy - wrong
δCP region. The two panels are essentially identical. We found that scenarios A and B give
the same allowed regions for all true values of δCP in the unfavourable half plane. Therefore,
a shorter baseline experiment (L ∼ 130 km) will not help in hierarchy determination.
-180
-120
-60
0
60
120
180
0.05 0.07 0.09 0.11 0.13 0.15
δC
P (
test
)
sin2 2θ13 (test)
1.5*NOνA+2*T2K, 90% C.L.
true pointTrue:NH / Test:NHTrue:NH / Test:IH
-180
-120
-60
0
60
120
180
0.05 0.07 0.09 0.11 0.13 0.15
δC
P (
test
)
sin2 2θ13 (test)
1.5*NOνA+T2K+C2F, 90% C.L.
true pointTrue:NH / Test:NHTrue:NH / Test:IH
FIG. 17: (colour online) Allowed sin2 2θ13-δCP plots for 1.5*NOνA + 2*T2K (left panel) and 1.5*NOνA
+ T2K + C2F (right panel) with true sin2 2θ13 = 0.1 and true δCP = 90◦.
IV. MEASURING δCP WITH Pµe
A. δCP measurement with T2K alone
In the previous section, we discussed the capability of NOνA and T2K to determine
the mass hierarchy. We now turn our attention to the measurement of δCP . Because of
the hierarchy-δCP degeneracy, the determination of these two quantities go hand in hand.
20

Matter effects, which are hierarchy-dependent, induce a CP-like change in the oscillation
probabilities. Therefore, it is expected that the effects of these two parameters can be
disentangled by choosing baselines and energies where matter effects are small. Thus, a
natural choice for accurate measurement of δCP seems to be an experiment with a short
baseline and low energy, like T2K or C2F. But, here we demonstrate that δCP can not be
measured in such experiments without first determining the hierarchy. For the purpose of
this demonstration, in this subsection alone, we will assume that T2K will have equal three
year runs in neutrino and anti-neutrino modes. This is done because such runs have the
best capability to determine δCP . However, even in such a case, δCP can’t be determined
without first determining the hierarchy.
In the following, we present ‘allowed δCP ’ graphs. In generating these, we have kept
sin2 2θ13 fixed at 0.1. The graphs are plotted in the true δCP -test δCP plane. For every
true value of δCP , we indicate the range in test δCP that can be excluded at 90% C.L. The
plots have been shown for both true and wrong hierarchies. The dotted range, defined by
χ2 ≤ 2.71, shows the values of test δCP that are compatible with the data, generated with
δCP (true) as input. For a given true value of δCP , the error in measuring δCP is indicated
by the spread of the dotted range along that δCP (true) vertical line.
-180
-120
-60
0
60
120
180
-180 -120 -60 0 60 120 180
δC
P (
test
)
δCP (true)
True:NH/Test:NH, 90% C.L.
-180
-120
-60
0
60
120
180
-180 -120 -60 0 60 120 180
δC
P (
test
)
δCP (true)
True:NH/Test:IH, 90% C.L.
FIG. 18: (colour online) Allowed δCP plots for T2K. Here NH is true. True and test sin2 2θ13 = 0.1. Test
hierarchy is normal (left panel) and inverted (right panel).
Figure (18) shows the allowed δCP plot for T2K. The points on the thick dashed line
21

in this figure correspond to the values of δCP (test) for which χ2 is minimum. If the test
hierarchy is the same as the true hierarchy, then the χ2 minimum occurs for δCP (test) =
δCP (true) and the allowed range of test δCP is around true δCP . But, if the test hierarchy
is the wrong hierarchy, then the minimum of χ2 occurs for δCP (test) 6= δCP (true) and, in
general, these two points are widely separated. This already gives a hint that an accurate
measurement of δCP is not possible without first determining the hierarchy. This point is
made more dramatic, when we consider the situation with more data from T2K. Fig. 19
shows the allowed δCP plot for 10 times the statistics of T2K. For δCP (true) in the middle
of the favourable half plane (−140◦ ≤ δCP ≤ −40◦), the wrong hierarchy solution is ruled
out. Thus both the hierarchy and the correct range of δCP are simultaneously determined.
For all other values of δCP (true), we get a wrong value of δCP , if we assume the wrong
hierarchy. For example, we see from the right panel of Fig. 19, for true δCP = −30◦, we find
that −130◦ ≤ δCP (test) ≤ −70◦, when the test hierarchy is the wrong hierarchy. Similarly
for true δCP = +60◦, we find 140◦ ≤ δCP (test) ≤ 200◦(= −160◦). In particular, if true δCP is
−10◦, close to the CP conserving value 0, we have −150◦ ≤ δCP (test) ≤ −50◦, encompassing
maximal CP violation. The situation is similar for true δCP = −170◦. Conversely, for true
δCP = 90◦, we have two allowed regions between 0 to 40◦ and 140◦ to 180◦, both of which
are close to CP conservation. This figure makes it clear that it is impossible to have a
measurement of δCP if we do not know the correct hierarchy. In fact, we are likely to get a
completely misleading estimate of δCP if we assume the wrong hierarchy. The corresponding
figures for C2F experiment show similar features.
22

-180
-120
-60
0
60
120
180
-180 -120 -60 0 60 120 180
δC
P (
test
)
δCP (true)
True:NH/Test:NH, 90% C.L.
-180
-120
-60
0
60
120
180
-180 -120 -60 0 60 120 180
δC
P (
test
)
δCP (true)
True:NH/Test:IH, 90% C.L.
FIG. 19: (colour online) Allowed δCP plots for 10*T2K. Here NH is true. True and test sin2 2θ13 = 0.1.
Test hierarchy is normal (left panel) and inverted (right panel).
B. δCP measurement with T2K and NOνA
In this subsection, we consider the δCP measuring capability of NOνA and T2K together.
Here we revert back to the original assumption that T2K will run in neutrino mode only
for 5 years. Fig. 20, shows the allowed δCP plot of NOνA , assuming NH is true. If the test
hierarchy is the true hierarchy, the allowed range of δCP will surround true δCP . If the test
hierarchy is the wrong hierarchy we obtain a large allowed range with δCP far from the true
value.
23

-180
-120
-60
0
60
120
180
-180 -120 -60 0 60 120 180
δC
P (
test
)
δCP (true)
True:NH/Test:NH, 90% C.L.
-180
-120
-60
0
60
120
180
-180 -120 -60 0 60 120 180
δC
P (
test
)
δCP (true)
True:NH/Test:IH, 90% C.L.
FIG. 20: (colour online) Allowed δCP plots for NOνA . Here NH is true. True and test sin2 2θ13 = 0.1.
Test hierarchy is normal (left panel) and inverted (right panel).
Fig. 21 shows the allowed δCP plot for NOνA and T2K together. In the left panel, the
allowed range δCP for the true hierarchy is shown. We see that this range is mostly in the
correct half-plane. For wrong hierarchy, shown in the right panel, the large allowed region
in wrong half plane is reduced, but a substantial region is still allowed. For the case where
IH is the true hierarchy, similar features occur.
24

-180
-120
-60
0
60
120
180
-180 -120 -60 0 60 120 180
δC
P (
test
)
δCP (true)
True:NH/Test:NH, 90% C.L.
-180
-120
-60
0
60
120
180
-180 -120 -60 0 60 120 180
δC
P (
test
)
δCP (true)
True:NH/Test:IH, 90% C.L.
FIG. 21: (colour online) Allowed δCP plots for NOνA + T2K. Here NH is true. True and test sin2 2θ13 is
0.1. Test hierarchy is normal (left panel) and inverted (right panel).
If the statistics are increased to 1.5*NOνA + 2*T2K, as seen in Fig. 22 then most of
the wrong hierarchy allowed region is ruled out as already noted in section 3. For the true
hierarchy, the allowed region is centered around true δCP and is mostly in the correct half-
plane. For the CP conserving case δCP = 0 (δCP = ±180◦), there is a small additional
allowed region around δCP = ±180◦ (δCP = 0) but for which χ2 is higher. If we limit our
attention to the regions around χ2min, then 1.5*NOνA + 2*T2K can measure δCP with an
accuracy of ±40◦ for true δCP = 0 and ±60◦ for true δCP = ±90◦.
It is curious that the CP conserving values of δCP can be measured with better accuracy
than large CP violating values. However, this point can be understood very simply in terms
of Eq. (3). δCP occurs in this equation as cos(∆ + δCP ). Any experiment is designed such
that the flux peaks at the energy where ∆ ≈ 90◦. Thus the δCP term is approximately
− sin δCP . The slope of sin x is large at x ≈ 0 or 180◦ and is very small at x ≈ ±90◦.
Therefore the uncertainty in δCP is small near 0 or 180◦ and is large when δCP is close to
±90◦.
Thus we are led to the following important conclusion: 1.5*NOνA + 2*T2K can essen-
tially determine the hierarchy and also give an allowed region of δCP centered around its
true value. Doubling of statistics will not lead to too much improvement in the allowed
range of δCP . Further strategies are needed to measure δCP to a good accuracy.
25

A recent paper [48] envisaged some future very long baseline superbeam experiments.
They found that the early data from these will determine hierarchy, and additional data is
needed to measure δCP . We find that in the current scenario also, these considerations hold
true.
-180
-120
-60
0
60
120
180
-180 -120 -60 0 60 120 180
δC
P (
test
)
δCP (true)
True:NH/Test:NH, 90% C.L.
-180
-120
-60
0
60
120
180
-180 -120 -60 0 60 120 180
δC
P (
test
)
δCP (true)
True:NH/Test:IH, 90% C.L.
FIG. 22: (colour online) Allowed δCP plots for 1.5*NOνA + 2*T2K. Here NH is true. True and test
sin2 2θ13 = 0.1. Test hierarchy is normal (left panel) and inverted (right panel).
V. SUMMARY
In this paper we explored the hierarchy - δCP degeneracy of Pµe of medium long
baseline experiments. This degeneracy severely limits the ability of any single experiment
to determine these quantities. The observed moderately large value of θ13 is certainly
a very good news for the upcoming NOνA, as it will lie in the region where NOνA has
appreciable reach for hierarchy determination if the value of δCP happens to be favourable.
We define the concept of favourable half-plane of δCP and show that the LHP(UHP) is
the favourable(unfavourable) half-plane for NH and vice-verse for IH. We also show that
NOνA by itself can determine the hierarchy if δCP is in the favourable half-plane and
sin2 2θ13 ≥ 0.12. When δCP is in the unfavourable half-plane, the data from NOνA and
T2K beautifully complement each other to rule out the wrong hierarchy. We explore the
underlying physics in detail and deduce the statistics needed for hierarchy determination.
Given the current best fit of sin2 2θ13 ' 0.1, the combined data from NOνA and T2K can
26

essentially resolve mass hierarchy for the entire δCP range if the statistics for NOνA and
T2K are boosted by factors 1.5 and 2 respectively. A baseline of ∼ 130 km will not be a
bonus, over and above T2K, unless supplemented by huge statistics.
In the last section we estimate the δCP reach of NOνA and T2K. We demonstrate that
without knowing the hierarchy, measuring δCP would be impossible. With 1.5*NOνA +
2*T2K, the allowed region of δCP is centered around its true value and is mostly in the correct
half-plane. Here also, a short baseline of ∼ 130 km will not provide better information than
T2K with the same statistics.
Acknowledgments
We thank Thomas Schwetz-Mangold for a comment on an earlier version, which led to
an improvement of the manuscript.
[1] K. Eguchi et al. (KamLAND), Phys. Rev. Lett. 92, 071301 (2004), hep-ex/0310047.
[2] Q. R. Ahmad et al. (SNO), Phys. Rev. Lett. 87, 071301 (2001), nucl-ex/0106015.
[3] T. Schwetz, M. Tortola, and J. Valle, New J.Phys. 13, 109401 (2011), arXiv:1108.1376.
[4] D. G. Michael et al. (MINOS), Phys. Rev. Lett. 97, 191801 (2006), hep-ex/0607088.
[5] R. Wendell et al. (Super-Kamiokande Collaboration), Phys.Rev. D81, 092004 (2010),
arXiv:1002.3471.
[6] K. Abe et al. (T2K), Phys. Rev. Lett. 107, 041801 (2011), arXiv:1106.2822.
[7] P. Adamson et al. (MINOS Collaboration), Phys. Rev. Lett. 107, 181802 (2011),
arXiv:1108.0015.
[8] Y. Abe et al. (Double Chooz), Phys. Rev. Lett. 108, 131801 (2012), arXiv:1112.6353.
[9] F. An et al. (Daya-Bay Collaboration), Phys.Rev.Lett. 108, 171803 (2012), arXiv:1203.1669.
[10] J. Ahn et al. (RENO collaboration), Phys. Rev. Lett. 108, 191802 (2012), arXiv:1204.0626.
[11] P. Machado, H. Minakata, H. Nunokawa, and R. Zukanovich Funchal, JHEP 1205, 023 (2012),
arXiv:1111.3330.
[12] G. Fogli, E. Lisi, A. Marrone, D. Montanino, A. Palazzo, et al. (2012), arXiv:1205.5254.
27

[13] Y. Itow et al. (T2K) (2001), hep-ex/0106019.
[14] F. Ardellier et al. (Double Chooz) (2004), hep-ex/0405032.
[15] F. Ardellier et al. (Double Chooz) (2006), hep-ex/0606025.
[16] X. Guo et al. (Daya-Bay) (2007), hep-ex/0701029.
[17] S.-B. Kim (RENO), AIP Conf. Proc. 981, 205 (2008).
[18] H. Nunokawa, S. J. Parke, and R. Zukanovich Funchal, Phys.Rev. D72, 013009 (2005), hep-
ph/0503283.
[19] A. de Gouvea, J. Jenkins, and B. Kayser, Phys.Rev. D71, 113009 (2005), hep-ph/0503079.
[20] P. Huber, M. Lindner, and W. Winter, Comput. Phys. Commun. 167, 195 (2005), hep-
ph/0407333.
[21] P. Huber, J. Kopp, M. Lindner, M. Rolinec, and W. Winter, Comput. Phys. Commun. 177,
432 (2007), hep-ph/0701187.
[22] M. Ishitsuka, T. Kajita, H. Minakata, and H. Nunokawa, Phys. Rev. D72, 033003 (2005),
hep-ph/0504026.
[23] P. Huber, M. Lindner, and W. Winter, Nucl.Phys. B645, 3 (2002), hep-ph/0204352.
[24] D. Ayres et al. (NOvA Collaboration) (2004), hep-ex/0503053.
[25] T. Yang and S. Wojcicki (NOvA) (2004), Off-Axis-Note-SIM-30.
[26] J.-E. Campagne, M. Maltoni, M. Mezzetto, and T. Schwetz, JHEP 04, 003 (2007), hep-
ph/0603172.
[27] J. E. Campagne and A. Cazes, Eur.Phys.J. C45, 643 (2006), hep-ex/0411062.
[28] M. Mezzetto, J.Phys.G G29, 1781 (2003), hep-ex/0302005.
[29] M. D. Messier (1999), Ph.D. Thesis (Advisor: James L. Stone), UMI-99-23965.
[30] E. Paschos and J. Yu, Phys.Rev. D65, 033002 (2002), hep-ph/0107261.
[31] M. Fechner, DAPNIA-2006-01-T (May 2006).
[32] I. Kato (T2K Collaboration), J.Phys.Conf.Ser. 136, 022018 (2008).
[33] A. Cervera et al., Nucl. Phys. B579, 17 (2000), hep-ph/0002108.
[34] E. K. Akhmedov, R. Johansson, M. Lindner, T. Ohlsson, and T. Schwetz, JHEP 04, 078
(2004), hep-ph/0402175.
[35] M. Freund, Phys. Rev. D64, 053003 (2001), hep-ph/0103300.
[36] L. Wolfenstein, Phys. Rev. D17, 2369 (1978).
[37] V. Barger, D. Marfatia, and K. Whisnant, Phys. Rev. D66, 053007 (2002), hep-ph/0206038.
28

[38] H. Minakata and H. Nunokawa, JHEP 0110, 001 (2001), hep-ph/0108085.
[39] J. Burguet-Castell, M. Gavela, J. Gomez-Cadenas, P. Hernandez, and O. Mena, Nucl.Phys.
B646, 301 (2002), hep-ph/0207080.
[40] H. Minakata, H. Nunokawa, and S. J. Parke, Phys.Rev. D66, 093012 (2002), hep-ph/0208163.
[41] T. Kajita, H. Minakata, S. Nakayama, and H. Nunokawa, Phys.Rev. D75, 013006 (2007),
hep-ph/0609286.
[42] K. Hagiwara, N. Okamura, and K. ichi Senda, Phys.Lett. B637, 266 (2006), hep-ph/0504061.
[43] O. Mena Requejo, S. Palomares-Ruiz, and S. Pascoli, Phys.Rev. D72, 053002 (2005), hep-
ph/0504015.
[44] O. Mena, S. Palomares-Ruiz, and S. Pascoli, Phys.Rev. D73, 073007 (2006), hep-ph/0510182.
[45] P. Huber, M. Lindner, T. Schwetz, and W. Winter, JHEP 11, 044 (2009), arXiv:0907.1896.
[46] D. Ayres et al. (NOvA Collaboration) (2007), fERMILAB-DESIGN-2007-01.
[47] O. Mena and S. J. Parke, Phys.Rev. D70, 093011 (2004), hep-ph/0408070.
[48] S. K. Agarwalla, T. Li, and A. Rubbia, JHEP 1205, 154 (2011), arXiv:1109.6526.
29