supreme court of virginia august/september …representatives from the supreme court of virginia’s...
TRANSCRIPT

Continental Research ! 4500 Colley Avenue ! Norfolk, VA 23508
SUPREME COURT OF VIRGINIA
Telephone Survey of Virginia Residents
August/September 2005
Prepared for: Office of the Executive Secretary
Supreme Court of Virginia
Prepared by: Jeannine B. Perry
and
Nanci A. Glassman
757.489.4887

TABLE OF CONTENTS
Procedural Information
Background . . . . . . . . . . . . . . . . . . . . . . . . . . . . . . . . . . . . . . . . . . . . . . . . . . . . . . 1
Methodology . . . . . . . . . . . . . . . . . . . . . . . . . . . . . . . . . . . . . . . . . . . . . . . . . . . . . 2-5
Margin of Error . . . . . . . . . . . . . . . . . . . . . . . . . . . . . . . . . . . . . . . . . . . . . . . . . . . 6
Margin of Error Chart . . . . . . . . . . . . . . . . . . . . . . . . . . . . . . . . . . . . . . . . . . . . . . 7
Executive Summary . . . . . . . . . . . . . . . . . . . . . . . . . . . . . . . . . . . . . . . . . . . . . . . 8-18
Survey Results
Overall Impression of Virginia’s Court System . . . . . . . . . . . . . . . . . . . . . . . . . . 19
Frequency of Fair Outcomes . . . . . . . . . . . . . . . . . . . . . . . . . . . . . . . . . . . . . . . . . 20
Frequency of Fair Procedures . . . . . . . . . . . . . . . . . . . . . . . . . . . . . . . . . . . . . . . . 21
Percentage Who Agreed With Nineteen Statements . . . . . . . . . . . . . . . . . . . . . . 22-40
Summary Table: 2005 Percent Agree/Average Agreement Scores . . . . . . . . . . . 41
Summary Table: Average Agreement Scores . . . . . . . . . . . . . . . . . . . . . . . . . . . 42-43
Rating of Court System Treatment of Various Groups . . . . . . . . . . . . . . . . . . . . 44-47
How Much Do You Know About the Courts . . . . . . . . . . . . . . . . . . . . . . . . . . . . 48
Recent Experience With the Courts . . . . . . . . . . . . . . . . . . . . . . . . . . . . . . . . . . . 49
Type of Experience With the Courts . . . . . . . . . . . . . . . . . . . . . . . . . . . . . . . . . . 50
Type of Case . . . . . . . . . . . . . . . . . . . . . . . . . . . . . . . . . . . . . . . . . . . . . . . . . . . . . 51
Was the Court Process Fair . . . . . . . . . . . . . . . . . . . . . . . . . . . . . . . . . . . . . . . . . . 52
Satisfied With the Case Outcome . . . . . . . . . . . . . . . . . . . . . . . . . . . . . . . . . . . . . 53
How the Court System Could be Improved . . . . . . . . . . . . . . . . . . . . . . . . . . . . . 54-56
How Prefers to Learn About Court System . . . . . . . . . . . . . . . . . . . . . . . . . . . . . 57
Usefulness of Using the Internet to Conduct Business With the Courts . . . . . . . 58-60
Best Way to Educate the Public About the Courts . . . . . . . . . . . . . . . . . . . . . . . . 61
What Influences Your Overall Impression of the Courts . . . . . . . . . . . . . . . . . . . 62
Demographics
Age of Respondent . . . . . . . . . . . . . . . . . . . . . . . . . . . . . . . . . . . . . . . . . . . . . . . . 63
Educational Attainment . . . . . . . . . . . . . . . . . . . . . . . . . . . . . . . . . . . . . . . . . . . . 64
(continued)

TABLE OF CONTENTS (cont’d)
Demographics (cont’d)
Ethnic Origin of Respondent . . . . . . . . . . . . . . . . . . . . . . . . . . . . . . . . . . . . . . . . 65
City/County of Residence . . . . . . . . . . . . . . . . . . . . . . . . . . . . . . . . . . . . . . . . . . . 66-68
Annual Household Income . . . . . . . . . . . . . . . . . . . . . . . . . . . . . . . . . . . . . . . . . . 69
Gender of Respondent . . . . . . . . . . . . . . . . . . . . . . . . . . . . . . . . . . . . . . . . . . . . . . 70
Comparative T-Test Analysis . . . . . . . . . . . . . . . . . . . . . . . . . . . . . . . . . . . . . . . . 71
Appendices
T-Test Analysis by Demographic Groups . . . . . . . . . . . . . . . . . . . . . . . . . . . . . . A1-A2
2005 Survey Questionnaire . . . . . . . . . . . . . . . . . . . . . . . . . . . . . . . . . . . . . . . . . . A3-A8

Continental Research ! 4500 Colley Avenue ! Norfolk, VA 23508
PROCEDURAL INFORMATION

1
BACKGROUND
Since 1992, the Virginia court system has been studying the application of traditional survey
research techniques to the public sector. A telephone survey designed to measure 1) public
perceptions of the judicial system, 2) issues that concern the public, and 3) their level of
confidence in the courts was conducted with 1,600 adult Virginians. The results of that
survey, along with other data, have been used in educational programs and the court’s
planning processes.
The Office of the Executive Secretary (OES) of the Supreme Court of Virginia contracted
for similar studies in 1998, 2000, and 2003. Although the 2005 survey included several new
questions, the survey was constructed to track significant changes in public perception and
explore recent issues relevant to the courts. While most of the questions were closed-ended
in nature (e.g., had pre-determined response choices), each participant was also given an
opportunity to offer suggestions for improving the judicial system in Virginia. As with the
previous surveys, the primary goal of the survey process was to improve the quality of court
services along with public confidence in and satisfaction with the courts.

2
METHODOLOGY
A telephone survey of Virginia residents was conducted between August 22 and Septembernd
13 of 2005 by Continental Research Associates, Inc. The purpose of the study was toth
measure residents’ perceptions of and attitudes toward the judicial system in Virginia.
The 2005 survey questionnaire was based on earlier instruments. After consultation with
representatives from the Supreme Court of Virginia’s Office of the Executive Secretary,
Department of Judicial Planning, several revisions and wording changes were made, and a
number of new items were added. To remain respectful of each participant’s time, the goal
was not to exceed 47 questions which resulted in a 12-minute survey. To avoid a high
refusal rate due to the nature of the survey (i.e., not everyone would be interested in talking
about the courts), a buffer question was placed at the beginning to reduce topic-specific
refusals.
After the survey draft was approved, the questionnaire was pre-tested by senior staff
members on a small random sample of Virginia residents. This process identifies any
technical problems with question wording or sequencing and helps improve the overall flow
of the questionnaire. The pre-test consisted of 37 interviews of people scattered throughout
the state. While the survey was rather long, no changes to the design were recommended.
The questionnaire is found in the Appendix of this report.
The sample frame list of Virginia phone numbers was electronically secured from a well-
known sample provider, Survey Sampling International. A total of 35 replicates were
generated to ensure that any “replacement” phone numbers issued to the interviewers would
be demographically similar to the initial numbers. (The phone numbers provided by this
vendor were protected from re-use for 9 months, which helps to reduce respondent refusals.)
The sample frame list was stratified to represent each county and independent city in Virginia
(using year 2000 census projections). The sampling interval was calculated by dividing the
number of possible random phone numbers for the county/city (the total number of working

3
METHODOLOGY (cont’d)
blocks times 100) by the proportion allocated to that county/city. Each telephone exchange
(i.e., the 3 digits following the area code) had a probability of selection equal to its share of
all listed telephone numbers. (FYI: Unlisted numbers are evenly scattered among working
blocks, as the phone number is assigned before a resident requests that the number be
unlisted.) Each phone number’s eligibility was then verified and any non-working blocks
(i.e., the first two digits following the three-digit exchange) eliminated. The phone number
823-6310, for example, falls in block 63 of exchange 823.
A working block is a block that contains at least three listed residential phone numbers. All
blocks with fewer than three households were purged from the list and were replaced by
other working blocks in the same exchange. To ensure sample representation, very strict
sample list controls were used. New phone numbers were given to interviewers only after
six attempts were made on the initial set of phone numbers.
The data collection process is very important. Professional, staff interviewers conducted the
surveys. Each of the seven data collectors had extensive training and several years of
experience, and a few of them had worked on prior Supreme Court studies. The interviewing
process began with a lengthy briefing session. Very detailed instructions for using the
questionnaire were discussed, and each data collector participated in a role-playing exercise.
This provided an opportunity to discuss challenges to the interviewing process (e.g., refusals
due to the nature of the survey) and techniques that should be used for probing. Each
interviewer then practiced the proper timing and pace for the survey before the team began
the data collection phase.
All initial phone calls were made between 5:15 and 9:15 p.m. (Mon. - Thurs.) and from 4 to
9 p.m. on Sundays. Computer-Assisted Telephone Interviewing (CATI) technology was
used to allow for the random rotation of survey items within a grid-style question. This
technology eliminates any sequence bias or primacy/recency effects.
4
METHODOLOGY (cont’d)
The survey text appeared on the interviewer’s computer screen and was read verbatim. Other
than neutral chit chat, each respondent was exposed to an identical survey script. The
interviewers encouraged each person to share his or her views even if that respondent had
no recent experience with the courts.
Realizing that proper sampling is critical to a representative survey, the interviewers reported
when people were hesitant to participate in the survey because they felt unqualified to rate
the courts. To counteract this problem, techniques for encouraging higher levels of
participation were reviewed each evening. With encouragement, most people who were
contacted agreed to fully participate.
The data collection team attempted to reach each randomly selected household on several
different days. The computer maintained outcome records for each attempt, and only after
six unsuccessful attempts was a substitute household contacted. The respondents’ answers
were recorded verbatim and directly entered into the computer.
A Field Supervisor observed the interviewers at all times. To affirm consistency in the entry
of responses, the supervisor visually monitored the input on the computer network while
listening to both sides of the conversation. Thirty-eight percent of all calls were fully
monitored, and another 25% were partially monitored. This is over ten times the industry
validation standard of 5%.
At the end of each evening’s shift, a de-briefing session was held to discuss the survey’s
progress. While these meetings provide only anecdotal information, they are useful when
interpreting the tabulated findings.
5
METHODOLOGY (cont’d)
The “Margin of Error” chart included in this report details the accuracy levels of the data.
A total of 600 interviews were completed. The open-ended survey responses were
categorized and assigned a numeric computer code. A very detailed SPSS (i.e., Statistical
Package for the Social Sciences) computer program was written to tabulate the findings and
compare the 2005 data to prior studies.
The data were analyzed using statistical tests that can detect trends in the data. If a
respondent said “I don’t know,” his response was not included in the respective table, and
the sample size (n= ) was adjusted. Where possible, comparable data from earlier surveys
are included in this report.
All of the survey samples were sufficiently large for comparison purposes. Because they do
vary, the results are presented as percentages for comparability. Generally speaking, the
percentages in this report total vertically to 100%, and the sample size indicated beneath each
column (n = ) shows the number of people who responded to the question.
When averages (means) are compared between groups or over time, the significance of those
means has been tested by using a T-Test statistic. The T-Test uses a complex computer
calculation to identify whether two averages and their distributions are significantly different
from one another. Whenever T-test results were found to be significant, the outcomes are
indicated.
A separate cross-tabulation report has been prepared to analyze these data by various
demographic categories and to cross-tabulate certain questions by others. Questions about
how to read any of the tables or charts should be directed to Jeannine Perry at 757-489-4887.

6
MARGIN OF ERROR
This survey of 600 randomly-selected Virginia residents was conducted with a sample of
Virginia households (i.e., as opposed to contacting everyone). Any percentage in the report
may vary somewhat from what a complete census of all Virginia households would have
produced. The term “Margin of Error” refers to the difference between the survey results
and such a census, and it is expressed as the maximum percentage the figure might vary. As
such, we are 95% certain that any percentages in this report would be within ± 4.0 percentage
points. The chart on the next page summarizes the “Margin of Error” for the 2005 data.
Although there are many ways to introduce error in survey research, properly managing the
telephone number list is critical. To reduce bias, the interviewers tried to reach each person
originally selected for inclusion in the study on various days and at different times. By
making six (or more) attempts to reach each person, we can ensure that people who travel,
work different shifts, or are simply very busy have a chance to participate. Also, to eliminate
self-selection bias, the interviewers worked very hard to encourage all randomly-selected
adults to participate, regardless of their level of involvement with the courts.

7
CALCULATING THE MARGIN OF ERROR FOR
SURVEY PERCENTAGES
When random household selection is used, the results represent Virginia’s adult population
well. The previously quoted maximum “Margin of Error” (±4.0%) assumes a typical survey
result of 50%. Therefore, if 50% of those surveyed gave a particular response, the “actual
census” percentage would range from 46.0% to 54.0%.
When we see smaller or larger percentages in the report, the survey results are even more
accurate (i.e., have a smaller Margin of Error). The table below displays the Margin of Error
for various percentages in this report. Notice that the margin is the same for 90% and 10%,
80% and 20%, etc.
If the reported The “adjusted”
percentage = 99% Margin of Error = ±0.80%
95% ±1.74%
90% ±2.40%
85% ±2.86%
80% ±3.20%
75% ±3.46%
70% ±3.67%
65% ±3.82%
60% ±3.92%
55% ±3.98%
- - - - - - - - 50% -- the greatest error -- ±4.00% - - - - - - - -
45% ±3.98%
40% ±3.92%
35% ±3.82%
30% ±3.67%
25% ±3.46%
20% ±3.20%
15% ±2.86%
10% ±2.40%
5% ±1.74%
1% ±0.80%

8
EXECUTIVE SUMMARY
This survey of Virginia residents was conducted by Continental Research Associates, Inc.,
a full-service marketing research company in Virginia. Six hundred randomly-selected
Virginia residents were included in this study. The interviews were conducted by telephone
between August 22 and September 13 of 2005.nd th
Each person was asked to rate various aspects of the Virginia court system and offer
suggestions for improvement. Participants were asked about their own experience with the
courts and how they perceive the courts with regard to the treatment and outcomes people
experience. They were also asked how they would prefer to learn about the Virginia court
system, the usefulness of using the Internet to conduct court business, and the best strategy
for educating the public about how the courts and legal system function. Demographic
information was also obtained.
Impression of Virginia’s Court System
After a brief warm-up question, respondents were asked if they had a Very Positive, Positive,
Negative, or Very Negative overall impression of the court system in Virginia. Over three-
fourths (79.0%) of those surveyed in 2005 reported having a positive impression, a
proportion that has remained relatively constant over time. Using a numeric scale where
4=Very Positive, 3=Positive, 2=Negative, and 1=Very Negative, an average rating was
calculated, yielding an average of 2.83 (well above the scale midpoint of 2.5).
In 2005, nearly half (48.3%) of those surveyed reported having an experience with the court
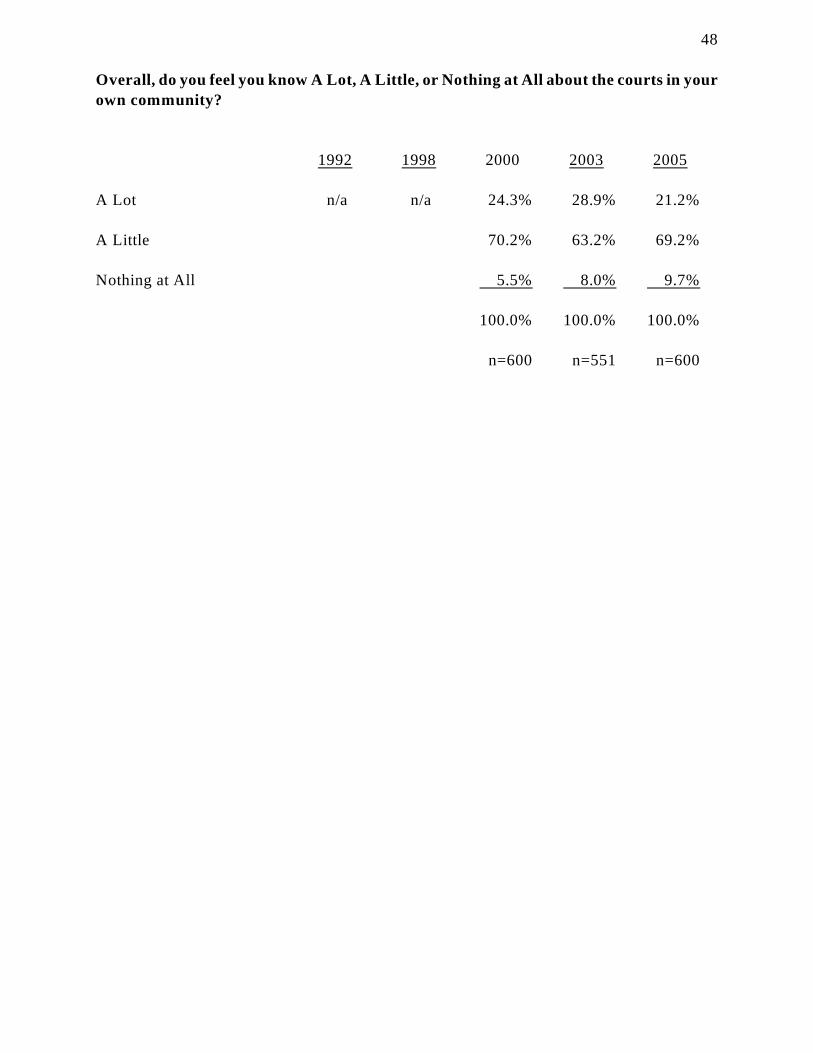
system in Virginia in the past five years. When asked to describe how much they knew about
the courts in their communities, though, only 21.2% felt that they knew “a lot.” About 70%
said they knew “a little,” while 9.7% said they knew “nothing at all.” This may represent

9
EXECUTIVE SUMMARY (cont’d)
Impression of Virginia’s Court System (cont’d)
an educational opportunity. Regardless of whether or not the respondent had direct
experience with the courts, 59.5% think people “Always” or “Usually” receive fair outcomes
in Virginia’s courts. And, 68.8% believe the courts “Always” or “Usually” use fair
procedures in handling cases.
Agreement With 19 Statements About Virginia’s Court System
Next, 19 positively-phrased statements about various characteristics of the court system were
read. Respondents were asked if they “Strongly Agreed,” “Agreed,” “Disagreed,” or
“Strongly Disagreed” with each statement. To summarize those results, the “Strongly
Agree” and “Agree” responses were combined into a single “Percent Who Agree” category.
When analyzing such percentages, many organizations target a minimum threshold of 80%
for a favorable rating. Nine items rated above the 80% threshold:
Percent Who
“Agree”
“The courts treat people politely and respectfully.” 91.2%
“Courts try to meet the special needs of people with physical
or mental disabilities.” 86.6%
“The courts protect people’s constitutional rights.” 86.2%
“People who serve on juries come from all groups in the community.” 85.8%
“Court employees are dependable and accurate in their work.” 85.5%
“Judges are honest in performing their duties.” 84.0%
“The courts should develop better ways to assist people who do not
have a lawyer.” 82.0%
“The courts make decisions based on the facts.” 81.7%
“The behavior of judges in Virginia gives the public confidence in
in the courts.” 80.6%

10
EXECUTIVE SUMMARY (cont’d)
Agreement With 19 Statements About Virginia’s Court System (cont’d)
The ten statements rating below 80% were:
Percent Who
“Agree”
“Judges listen carefully to what people have to say.” 79.8%
“The courts should exercise more leadership in addressing societal
problems, such as drug abuse, treatment of the mentally ill, and
foster care.” 78.2%
“Judges are fair when deciding cases.” 77.5%
“The courts adequately protect victims’ interests.” 74.2%
“Court rulings and decisions are understood by the people involved
in cases.” 67.7%
“Minorities are adequately represented among Virginia’s judges.” 65.9%
“The courts effectively inform the public about court procedures
and services.” 63.3%
“The time that people must wait in the courthouse before their cases
are heard is reasonable.” 58.4%
“The entire process to complete a court case, from beginning to end,
occurs in a reasonable length of time.” 54.9%
“Judges’ decisions are free from political influence.” 53.3%
As an aside, an agreement scale often produces ratings that are less “favorable” than other
types of scales (e.g., Very Satisfied, Satisfied, Dissatisfied, or Very Dissatisfied).
A good way to analyze these data is by calculating an average agreement “score” for each
statement (using a 4-point scale where 4=Strongly Agree, 3=Agree, 2=Disagree, and
1=Strongly Disagree). Average ratings indicate the strength of agreement or disagreement
with the statement, and they are more sensitive to how many responses fall into each
category.

11
EXECUTIVE SUMMARY (cont’d)
Agreement With 19 Statements About Virginia’s Court System (cont’d)
The table below displays the 19 statements in descending order, based on the average scores.
Because some characteristics or services would be naturally expected to rate higher than
others, each phrase must be considered individually.
Avg. Rating
“The courts treat people politely and respectfully.” 3.02 (out of 4.00)
“The courts should develop better ways to assist people who do not
have a lawyer.” 2.98
“People who serve on juries come from all groups in the community.” 2.97
“Judges are honest in performing their duties.” 2.94
“Courts try to meet the special needs of people with physical
or mental disabilities.” 2.94
“The courts protect people’s constitutional rights.” 2.93
“The courts should exercise more leadership in addressing societal
problems, such as drug abuse, treatment of the mentally ill, and
foster care.” 2.90
“The courts make decisions based on the facts.” 2.89
“Court employees are dependable and accurate in their work.” 2.89
“The behavior of judges in Virginia gives the public confidence in
the courts.” 2.87
“Judges listen carefully to what people have to say.” 2.85
“Judges are fair when deciding cases.” 2.81
“The courts adequately protect victims’ interests.” 2.77
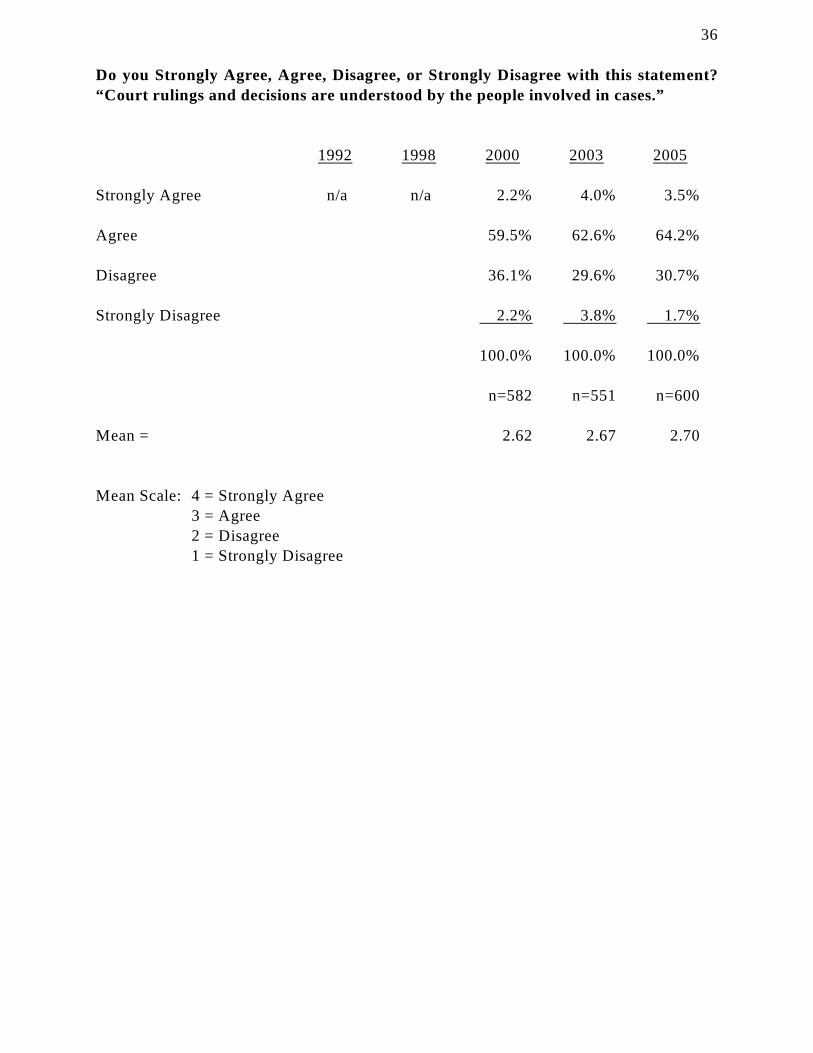
“Court rulings and decisions are understood by the people involved
in cases.” 2.70
“Minorities are adequately represented among Virginia’s judges.” 2.67
“The courts effectively inform the public about court procedures
and services.” 2.65
“The time that people must wait in the courthouse before their cases
are heard is reasonable.” 2.55
“The entire process to complete a court case, from beginning to end,
occurs in a reasonable length of time.” 2.53
“Judges’ decisions are free from political influence.” 2.51

12
EXECUTIVE SUMMARY (cont’d)
Agreement With 19 Statements About Virginia’s Court System (cont’d)
The mean scores that were present on earlier surveys were compared to the 2005 results. T-
Tests were performed to see if the scores have significantly improved or declined over time.
A T-Test is a statistical technique used to determine if any change in the responses over time
(or between two groups) is random or “statistically significant.”
The 2005 average ratings were relatively similar to those obtained in 2003, but several 2005
means were significantly higher than in 1992, 1998, and 2000 (see pg. 71). Only one item
in 2005 had a significantly higher agreement score than in 2003: “The courts should exercise
more leadership in addressing societal problems, such as drug abuse, treatment of the
mentally ill, and foster care.” Also, one item rated significantly lower in 2005 than in 2003:
“Judges are fair when deciding cases.”
Other T-tests were performed on each of the 19 statements to see if some groups of people
(i.e., younger vs. older, male vs. female, etc.) responded differently to the questions. The
results of that analysis are displayed in the Appendix of this document.
Treatment of Various “Groups” in Virginia’s Court System
With regard to the treatment and outcomes people experience in the courts, this survey asked
if people think Virginia’s court system treats people differently because of their language,
socioeconomic status, race or ethnicity, or whether the person has legal representation.
! 33.0% felt that non-English speaking people are not treated as fairly
! 59.7% felt that poorer people are not treated equally
! 39.8% felt that people are not treated equally (because of their race)
! 60.5% felt that people without an attorney are not treated as fairly

13
EXECUTIVE SUMMARY (cont’d)
Experience With Virginia’s Court System
Nearly half of those surveyed (48.3%) reported having an experience with the court system
in Virginia in the past 5 years. Just over one-quarter of the 290 people with recent court
experience (26.2%) had been a defendant, and 6.6% were plaintiffs. A few (5.2% of the 290)
said they were victims in a criminal case. Others (20.0%) had served as jurors or prospective
jurors, 22.8% were visitors/observers, and 16.2% were witnesses. Only 3.1% were either a
court employee, judge, police officer, or an attorney.
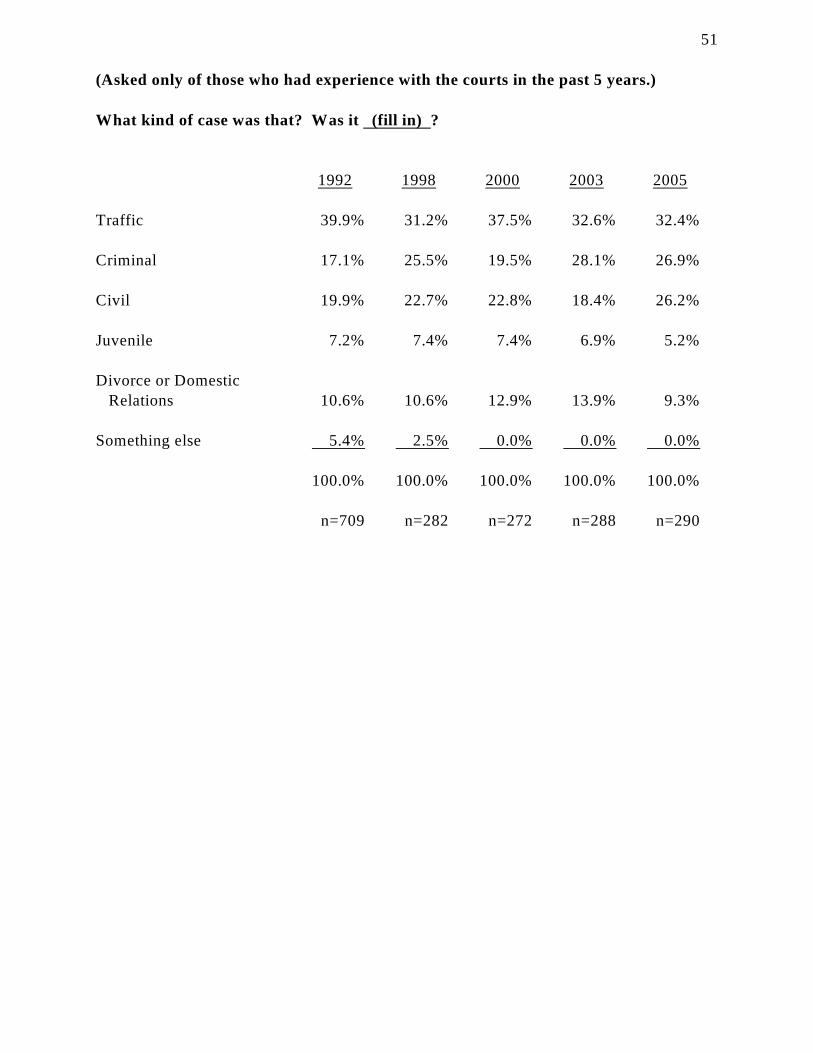
Their experiences were varied. Of the 290 people with recent court experience, about one-
third (32.4%) were involved in traffic cases, 26.9% in criminal cases, 26.2% in civil cases,
9.3% in divorce or domestic relations courtrooms, and 5.2% in juvenile cases.
The vast majority of the 290 people with court experience (83.4%) felt the process was fair,
and 77.6% were satisfied with the outcome. Of course, for those respondents who had
limited involvement (e.g., observers and prospective jurors), the case outcomes often had no
direct impact on them. (An analysis of the differences in perceptions between people with
peripheral involvement with the courts and those who were plaintiffs or defendants was
performed and is provided under separate cover.)
What Influences Overall Impressions of the Virginia Court System
Survey participants were read a list of six ways people’s opinions about the court system in
Virginia could be formed. One-third (33.5%) of the respondents relied primarily on their
own experience with the Virginia courts, and 4.7% used their experience with federal court
or courts in another state. Some said their opinions have been influenced primarily by word
of mouth (14.0%), while others (6.2%) relied on the Virginia court information taught in

14
EXECUTIVE SUMMARY (cont’d)
What Influences Overall Impressions of the Virginia Court System (cont’d)
school. Only 4.0% of those surveyed said they were influenced primarily by courtroom TV
shows like Judge Judy, but over one-third (37.3%) used other media (newspaper, other TV
shows, or the radio).
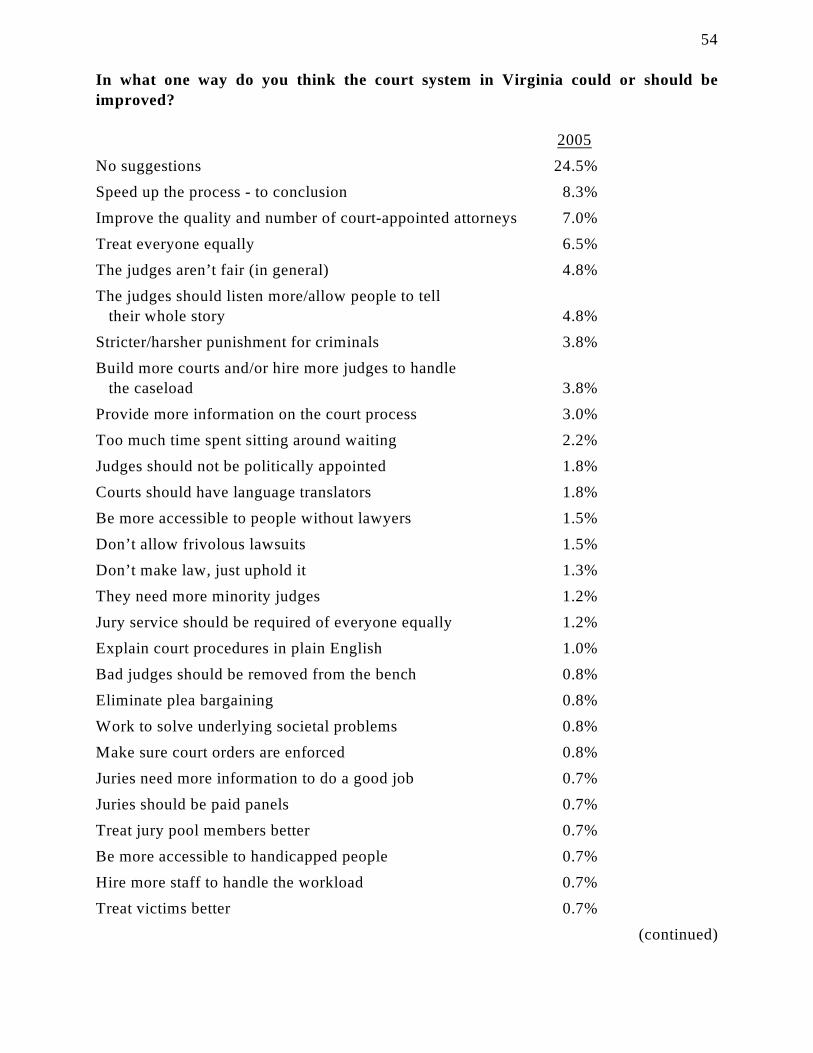
Suggestions for Improving the Court System in Virginia
All survey participants were given an opportunity to make a suggestion for improving the
court system in Virginia. After much thought, 24.5% of those surveyed were not able to
make a constructive suggestion. A wide variety of other answers were offered:
One Way the Court System Should be Improved: Percent
No suggestions 24.5%
Speed up the process - to conclusion 8.3%
Improve the quality and number of court-appointed attorneys 7.0%
Treat everyone equally 6.5%
The judges aren’t fair (in general) 4.8%
The judges should listen more/allow people to tell their whole story 4.8%
Stricter/harsher punishment for criminals 3.8%
Build more courts and/or hire more judges to handle the caseload 3.8%
Provide more information on the court process 3.0%
Too much time spent sitting around waiting 2.2%
Other miscellaneous suggestions 31.3%
100.0%
(n=600)
Preferred Source for Information About the Court System
Respondents were asked (in an open-ended format) how they would prefer to learn
information about the Virginia court system. While some people were not able to offer a
source suggestion (2.3%) or did not feel they needed any information (0.8%), the Internet

15
EXECUTIVE SUMMARY (cont’d)
Preferred Source for Information About the Court System (cont’d)
was mentioned as the most preferred source (by 36.8% of those surveyed). Others said they
would contact the Courthouse (16.7%) or an attorney (12.8%). Fewer people mentioned the
newspaper (7.5%), the library (6.3%), asking a friend/neighbor/family member (6.0%),
receiving the info by mail (5.8%), or other ways (4.9%).
Using the Internet to Conduct Court Business
The Internet has become a popular and convenient tool for reaching the public and
communicating instructions and information. A high percentage of Virginians have access
to the Internet either at home, work, school, or in a public library. Today, people use local
e-government services, conduct other business on-line, and use the Internet as a ready
reference tool.
Survey participants were asked about the utility of three court-related services that could be
made available over the Internet. The percentages who said “Very” or “Somewhat” useful
are displayed below.
Percent Who Said
Usefulness of Using the Internet to: This is “Useful”
Pay fines, fees, and other costs 65.0%
Complete and submit court documents 61.8%
Check to see if you were needed for jury duty that week 67.5%
As an aside, 133 of the 600 people surveyed (22.2%) said none of the three items would be
useful. Anecdotal information suggests that some people cannot fathom needing to pay a
fine or file a court document, while others remain uneasy about transacting business over the
Internet.

16
EXECUTIVE SUMMARY (cont’d)
Educating the Public About the Courts and Legal System
Lastly, four approaches for educating the public about how the courts and legal system work
were presented. Respondents were asked to choose the “best” strategy out of the four
approaches. The results are shown below.
“Best” Strategy for Educating the Public: Percent
In school grades K-12, they could teach more about Virginia
courts and the law 55.3%
There could be interactive educational programs on the Internet
and on DVD or CD-ROM 15.5%
Judges could make presentations in schools (K-12) and to organ-
izations throughout Virginia 15.2%
The courts could hear certain kinds of cases in schools and other
public places so people could see what happens in a court 14.0%
100.0%
(n=600)
As a point of reference, some people commented that having judges make presentations in
schools and organizations was not a good use of their time and not the best use of taxpayers’
money. And, although it may be interesting, moving live cases to schools or other public
places probably would not be seen as cost effective. A number of people did, however,
suggest using TV cameras in courtrooms to educate the public about how the courts really
work. Accessibility was seen as important, but not necessarily having “live” events in public
places.
Conclusions
This survey is a strong tool for tracking Virginia residents’ perceptions of the court system.
These results can be extremely useful for developing and implementing new strategies to
improve the quality of court services, change people’s perceptions of the courts, and provide
educational opportunities.

17
EXECUTIVE SUMMARY (cont’d)
Conclusions (cont’d)
In considering the 2005 results, keep in mind that some fluctuation from year to year is
normal as long as it is within the study’s Margin of Error of ± 4.0%. In addition, some
questions have been re-worded slightly from year to year, which may cause the results to
look a bit “different.”
Over 90% of those surveyed reported having some knowledge about the court system, and
nearly half said they had direct experience with the courts. Whether people’s attitudes about
the court system are influenced by actual experience, the media, or courtroom TV shows like
Judge Judy, their impressions become reality.
Clearly, there are areas the Virginia court system should continue to improve:
! Reduce the time it takes for the entire court process to occur
! Reduce the waiting time people must wait in the courthouse before a case is heard
! Manage perceptions that judges experience political influence
! Provide information to the public about procedures and services
! Have judges from various minority groups
! Use the Internet to disseminate more information about the courts
! Have a better way to assist those who do not have an attorney
! Manage perceptions that certain “types” of people get treated differentially
! Manage perceptions that judges do not always listen to everything people want to say
! Manage perceptions that court rulings are hard to understand
! Manage perceptions that money and legal representation may influence the courts
! Strengthen the K-12 educational curricula relating to the courts

18
EXECUTIVE SUMMARY (cont’d)
Conclusions (cont’d)
The Virginia court system has many strengths:
! Most Virginia residents have a positive impression of the courts
! Over 90% have some level of familiarity with the courts
! The courts treat people politely and respectfully
! The courts try to meet the needs of people with disabilities
! People’s constitutional rights are protected
! Juries are representative of the community
! Court employees are dependable and accurate
! The judges are honest
! Judges’ decisions are based on facts
! Judges’ behavior gives the public confidence in the courts
! Of those with court experience, the majority thought the court process was fair
! Of those with court experience, the majority were satisfied with the outcome

Continental Research ! 4500 Colley Avenue ! Norfolk, VA 23508
SURVEY RESULTS
Total Sample Sizes:
1992: 1,600
1998: 606
2000: 600
2003: 551
2005: 600
NOTE: If in any table there is a smaller number of responses than the sample size
stated above, it is because some people did not answer the question.

Continental Research ! 4500 Colley Avenue ! Norfolk, VA 23508
19
Is your overall impression of Virginia’s court system Very Positive, Positive, Negative,
or Very Negative?
1992 1998 2000 2003 2005
Very Positive 6.9% 4.0% 7.3% 5.6% 8.3%
Positive 67.2% 67.3% 72.2% 70.8% 70.7%
Negative 19.3% 21.3% 16.8% 18.5% 16.8%
Very Negative 6.6% 7.4% 3.7% 5.1% 4.2%
100.0% 100.0% 100.0% 100.0% 100.0%
n=1301 n=606 n=600 n=551 n=600
Mean = 2.74 2.68 2.83 2.77 2.83
Mean Scale: 4 = Very Positive
3 = Positive
2 = Negative
1 = Very Negative

Continental Research ! 4500 Colley Avenue ! Norfolk, VA 23508
20
How often do you think the people receive fair outcomes when they deal with Virginia’s
courts? Is that Always, Usually, Sometimes, or Never?
1992 1998 2000 2003 2005
Always n/a n/a n/a 10.7% 8.7%
Usually 50.8% 50.8%
Sometimes 36.7% 38.8%
Never 1.8% 1.7%
100.0% 100.0%
n=551 n=600
Mean = 2.70 2.67
Mean Scale: 4 = Always
3 = Usually
2 = Sometimes
1 = Never

Continental Research ! 4500 Colley Avenue ! Norfolk, VA 23508
21
How often do you think the courts use fair procedures in handling cases? Is that
Always, Usually, Sometimes, or Never?
1992 1998 2000 2003 2005
Always n/a n/a n/a 18.5% 18.0%
Usually 51.9% 50.8%
Sometimes 27.6% 29.8%
Never 2.0% 1.3%
100.0% 100.0%
n=551 n=600
Mean = 2.87 2.86
Mean Scale: 4 = Always
3 = Usually
2 = Sometimes
1 = Never

Continental Research ! 4500 Colley Avenue ! Norfolk, VA 23508
22
Now, I’d like to ask how you feel about some issues related to the courts in your
community. Do you Strongly Agree, Agree, Disagree, or Strongly Disagree with this
statement? “The courts treat people politely and respectfully.”
1992 1998 2000 2003 2005
Strongly Agree n/a n/a n/a 13.8% 11.7%
Agree 73.3% 79.5%
Disagree 11.6% 8.2%
Strongly Disagree 1.3% 0.7%
100.0% 100.0%
n=551 n=600
Mean = 3.00 3.02
Mean Scale: 4 = Strongly Agree
3 = Agree
2 = Disagree
1 = Strongly Disagree
NOTE: Prior to 2005, this question referred to “dignity and respect.”

Continental Research ! 4500 Colley Avenue ! Norfolk, VA 23508
23
Do you Strongly Agree, Agree, Disagree, or Strongly Disagree with this statement?
“The courts make decisions based on the facts.”
1992 1998 2000 2003 2005
Strongly Agree n/a n/a n/a 12.9% 8.5%
Agree 66.8% 73.2%
Disagree 18.3% 16.8%
Strongly Disagree 2.0% 1.5%
100.0% 100.0%
n=551 n=600
Mean = 2.91 2.89
Mean Scale: 4 = Strongly Agree
3 = Agree
2 = Disagree
1 = Strongly Disagree

Continental Research ! 4500 Colley Avenue ! Norfolk, VA 23508
24
Do you Strongly Agree, Agree, Disagree, or Strongly Disagree with this statement?
“Judges are honest in performing their duties.”
1992 1998 2000 2003 2005
Strongly Agree n/a n/a n/a 14.9% 10.5%
Agree 70.2% 73.5%
Disagree 12.9% 15.0%
Strongly Disagree 2.0% 1.0%
100.0% 100.0%
n=551 n=600
Mean = 2.98 2.94
Mean Scale: 4 = Strongly Agree
3 = Agree
2 = Disagree
1 = Strongly Disagree

Continental Research ! 4500 Colley Avenue ! Norfolk, VA 23508
25
Do you Strongly Agree, Agree, Disagree, or Strongly Disagree with this statement?
“Judges listen carefully to what people have to say.”
1992 1998 2000 2003 2005
Strongly Agree n/a n/a n/a 10.0% 7.5%
Agree 69.2% 72.3%
Disagree 18.0% 18.4%
Strongly Disagree 2.7% 1.8%
100.0% 100.0%
n=549 n=599
Mean = 2.87 2.85
Mean Scale: 4 = Strongly Agree
3 = Agree
2 = Disagree
1 = Strongly Disagree

Continental Research ! 4500 Colley Avenue ! Norfolk, VA 23508
26
Do you Strongly Agree, Agree, Disagree, or Strongly Disagree with this statement?
“People who serve on juries come from all groups in the community.”
1992 1998 2000 2003 2005
Strongly Agree n/a 5.5% 8.1% 13.1% 12.5%
Agree 73.6% 71.3% 71.0% 73.3%
Disagree 18.2% 18.1% 14.2% 12.9%
Strongly Disagree 2.7% 2.5% 1.6% 1.3%
100.0% 100.0% 100.0% 100.0%
n=599 n=596 n=548 n=599
Mean = 2.82 2.85 2.96 2.97
Mean Scale: 4 = Strongly Agree
3 = Agree
2 = Disagree
1 = Strongly Disagree
NOTE: Prior to 2005, this question said, “Juries are representative of the community.”

Continental Research ! 4500 Colley Avenue ! Norfolk, VA 23508
27
Do you Strongly Agree, Agree, Disagree, or Strongly Disagree with this statement?
“Court employees are dependable and accurate in their work.”
1992 1998 2000 2003 2005
Strongly Agree 13.7% 2.2% 3.9% 8.4% 5.5%
Agree 64.5% 82.6% 77.3% 78.4% 80.0%
Disagree 15.5% 12.6% 16.5% 11.7% 12.7%
Strongly Disagree 6.4% 2.6% 2.3% 1.5% 1.8%
100.0% 100.0% 100.0% 100.0% 100.0%
n=1255 n=580 n=564 n=547 n=599
Mean = 2.85 2.84 2.83 2.94 2.89
Mean Scale: 4 = Strongly Agree
3 = Agree
2 = Disagree
1 = Strongly Disagree

Continental Research ! 4500 Colley Avenue ! Norfolk, VA 23508
28
Do you Strongly Agree, Agree, Disagree, or Strongly Disagree with this statement?
“Judges are fair when deciding cases.”
1992 1998 2000 2003 2005
Strongly Agree n/a n/a 6.3% 8.7% 5.5%
Agree 73.9% 73.0% 72.0%
Disagree 17.5% 16.6% 20.5%
Strongly Disagree 2.4% 1.6% 2.0%
100.0% 100.0% 100.0%
n=590 n=549 n=599
Mean = 2.84 2.89 2.81
Mean Scale: 4 = Strongly Agree
3 = Agree
2 = Disagree
1 = Strongly Disagree

Continental Research ! 4500 Colley Avenue ! Norfolk, VA 23508
29
Do you Strongly Agree, Agree, Disagree, or Strongly Disagree with this statement?
“The behavior of judges in Virginia gives the public confidence in the courts.”
1992 1998 2000 2003 2005
Strongly Agree n/a 4.4% 7.6% 9.1% 6.7%
Agree 69.3% 73.1% 73.9% 74.0%
Disagree 22.6% 17.3% 14.9% 18.9%
Strongly Disagree 3.7% 2.0% 2.2% 0.5%
100.0% 100.0% 100.0% 100.0%
n=597 n=595 n=551 n=599
Mean = 2.74 2.86 2.90 2.87
Mean Scale: 4 = Strongly Agree
3 = Agree
2 = Disagree
1 = Strongly Disagree

Continental Research ! 4500 Colley Avenue ! Norfolk, VA 23508
30
Do you Strongly Agree, Agree, Disagree, or Strongly Disagree with this statement?
“Minorities are adequately represented among Virginia’s judges.”
1992 1998 2000 2003 2005
Strongly Agree n/a 1.3% 2.6% 5.6% 5.0%
Agree 57.8% 51.9% 61.5% 60.8%
Disagree 36.7% 39.6% 28.3% 30.4%
Strongly Disagree 4.2% 5.9% 4.5% 3.7%
100.0% 100.0% 100.0% 100.0%
n=548 n=538 n=533 n=595
Mean = 2.56 2.51 2.68 2.67
Mean Scale: 4 = Strongly Agree
3 = Agree
2 = Disagree
1 = Strongly Disagree

Continental Research ! 4500 Colley Avenue ! Norfolk, VA 23508
31
Do you Strongly Agree, Agree, Disagree, or Strongly Disagree with this statement?
“Judges’ decisions are free from political influence.”
1992 1998 2000 2003 2005
Strongly Agree n/a n/a 1.4% 4.4% 3.3%
Agree 42.9% 48.9% 50.0%
Disagree 47.7% 40.9% 41.0%
Strongly Disagree 8.0% 5.8% 5.7%
100.0% 100.0% 100.0%
n=585 n=548 n=600
Mean = 2.38 2.52 2.51
Mean Scale: 4 = Strongly Agree
3 = Agree
2 = Disagree
1 = Strongly Disagree

Continental Research ! 4500 Colley Avenue ! Norfolk, VA 23508
32
Do you Strongly Agree, Agree, Disagree, or Strongly Disagree with this statement?
“The courts effectively inform the public about court procedures and services.”
1992 1998 2000 2003 2005
Strongly Agree 8.7% 1.2% 2.4% 3.4% 3.3%
Agree 40.8% 37.1% 55.5% 61.0% 60.0%
Disagree 33.9% 51.7% 38.6% 31.8% 34.7%
Strongly Disagree 16.7% 10.1% 3.6% 3.8% 2.0%
100.0% 100.0% 100.0% 100.0% 100.0%
n=1302 n=604 n=586 n=551 n=600
Mean = 2.41 2.29 2.57 2.64 2.65
Mean Scale: 4 = Strongly Agree
3 = Agree
2 = Disagree
1 = Strongly Disagree
Continental Research ! 4500 Colley Avenue ! Norfolk, VA 23508
33
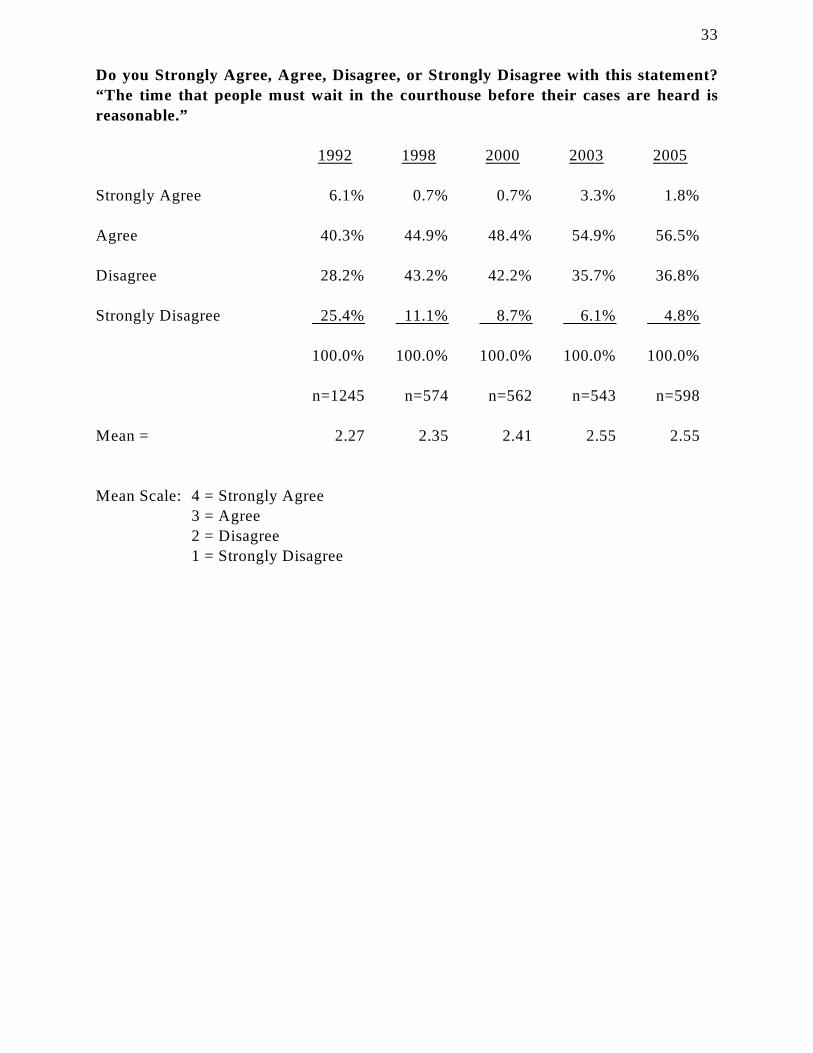
Do you Strongly Agree, Agree, Disagree, or Strongly Disagree with this statement?
“The time that people must wait in the courthouse before their cases are heard is
reasonable.”
1992 1998 2000 2003 2005
Strongly Agree 6.1% 0.7% 0.7% 3.3% 1.8%
Agree 40.3% 44.9% 48.4% 54.9% 56.5%
Disagree 28.2% 43.2% 42.2% 35.7% 36.8%
Strongly Disagree 25.4% 11.1% 8.7% 6.1% 4.8%
100.0% 100.0% 100.0% 100.0% 100.0%
n=1245 n=574 n=562 n=543 n=598
Mean = 2.27 2.35 2.41 2.55 2.55
Mean Scale: 4 = Strongly Agree
3 = Agree
2 = Disagree
1 = Strongly Disagree

Continental Research ! 4500 Colley Avenue ! Norfolk, VA 23508
34
Do you Strongly Agree, Agree, Disagree, or Strongly Disagree with this statement?
“The courts protect people’s constitutional rights.”
1992 1998 2000 2003 2005
Strongly Agree n/a n/a 3.6% 10.3% 8.5%
Agree 80.5% 77.3% 77.7%
Disagree 14.8% 11.1% 12.5%
Strongly Disagree 1.2% 1.3% 1.3%
100.0% 100.0% 100.0%
n=589 n=551 n=600
Mean = 2.86 2.97 2.93
Mean Scale: 4 = Strongly Agree
3 = Agree
2 = Disagree
1 = Strongly Disagree
NOTE: In 2000, the subject was “defendant” instead of “people.”
Continental Research ! 4500 Colley Avenue ! Norfolk, VA 23508
35
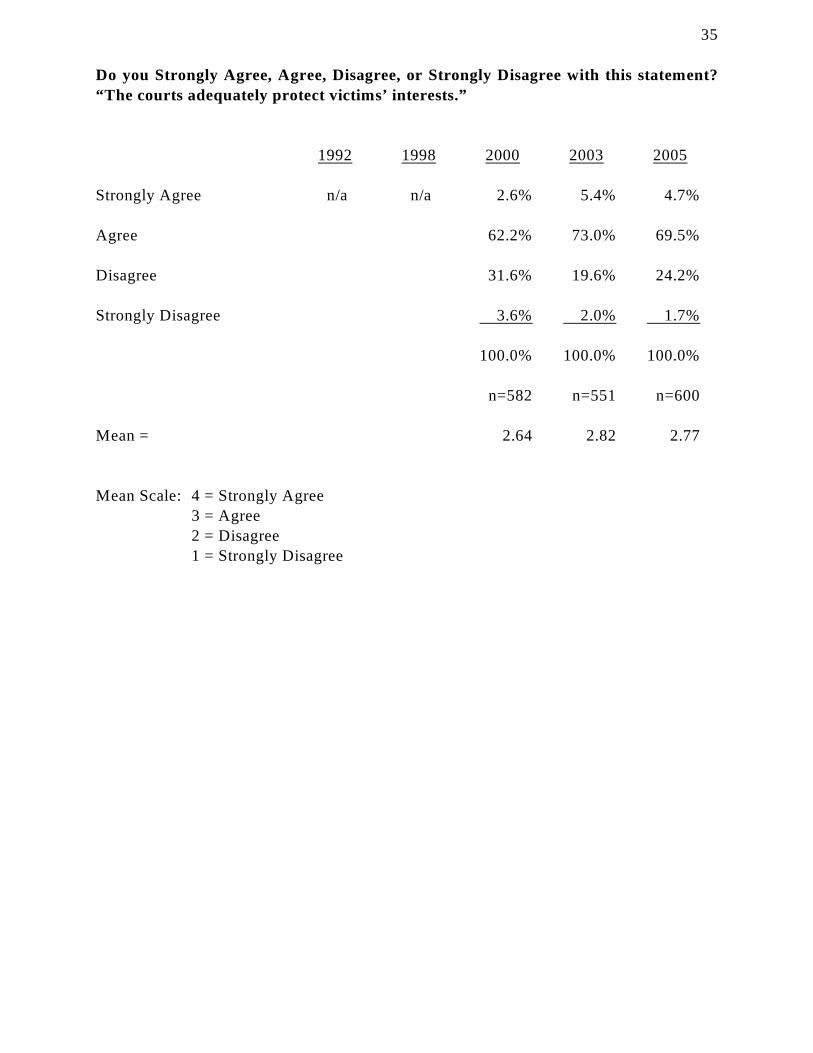
Do you Strongly Agree, Agree, Disagree, or Strongly Disagree with this statement?
“The courts adequately protect victims’ interests.”
1992 1998 2000 2003 2005
Strongly Agree n/a n/a 2.6% 5.4% 4.7%
Agree 62.2% 73.0% 69.5%
Disagree 31.6% 19.6% 24.2%
Strongly Disagree 3.6% 2.0% 1.7%
100.0% 100.0% 100.0%
n=582 n=551 n=600
Mean = 2.64 2.82 2.77
Mean Scale: 4 = Strongly Agree
3 = Agree
2 = Disagree
1 = Strongly Disagree
Continental Research ! 4500 Colley Avenue ! Norfolk, VA 23508
36
Do you Strongly Agree, Agree, Disagree, or Strongly Disagree with this statement?
“Court rulings and decisions are understood by the people involved in cases.”
1992 1998 2000 2003 2005
Strongly Agree n/a n/a 2.2% 4.0% 3.5%
Agree 59.5% 62.6% 64.2%
Disagree 36.1% 29.6% 30.7%
Strongly Disagree 2.2% 3.8% 1.7%
100.0% 100.0% 100.0%
n=582 n=551 n=600
Mean = 2.62 2.67 2.70
Mean Scale: 4 = Strongly Agree
3 = Agree
2 = Disagree
1 = Strongly Disagree

Continental Research ! 4500 Colley Avenue ! Norfolk, VA 23508
37
Do you Strongly Agree, Agree, Disagree, or Strongly Disagree with this statement?
“The entire process to complete a court case, from beginning to end, occurs in a
reasonable length of time.”
1992 1998 2000 2003 2005
Strongly Agree 7.8% 1.2% 1.2% 3.3% 2.3%
Agree 42.9% 42.4% 43.9% 57.1% 52.6%
Disagree 29.0% 43.9% 47.9% 34.9% 40.5%
Strongly Disagree 20.4% 12.5% 7.0% 4.8% 4.5%
100.0% 100.0% 100.0% 100.0% 100.0%
n=1302 n=599 n=583 n=545 n=597
Mean = 2.38 2.32 2.39 2.59 2.53
Mean Scale: 4 = Strongly Agree
3 = Agree
2 = Disagree
1 = Strongly Disagree

Continental Research ! 4500 Colley Avenue ! Norfolk, VA 23508
38
Do you Strongly Agree, Agree, Disagree, or Strongly Disagree with this statement?
“Courts try to meet the special needs of people with physical or mental disabilities.”
1992 1998 2000 2003 2005
Strongly Agree n/a 3.1% 3.2% 10.4% 8.9%
Agree 76.9% 78.1% 77.6% 77.7%
Disagree 17.5% 16.5% 10.7% 12.1%
Strongly Disagree 2.5% 2.2% 1.3% 1.3%
100.0% 100.0% 100.0% 100.0%
n=554 n=539 n=541 n=597
Mean = 2.81 2.82 2.97 2.94
Mean Scale: 4 = Strongly Agree
3 = Agree
2 = Disagree
1 = Strongly Disagree

Continental Research ! 4500 Colley Avenue ! Norfolk, VA 23508
39
Do you Strongly Agree, Agree, Disagree, or Strongly Disagree with this statement?
“The courts should exercise more leadership in addressing societal problems, such as
drug abuse, treatment of the mentally ill, and foster care.”
1992 1998 2000 2003 2005
Strongly Agree n/a n/a n/a 10.3% 14.2%
Agree 55.2% 64.0%
Disagree 28.7% 19.5%
Strongly Disagree 5.8% 2.3%
100.0% 100.0%
n=551 n=600
Mean = 2.70 2.90
Mean Scale: 4 = Strongly Agree
3 = Agree
2 = Disagree
1 = Strongly Disagree

Continental Research ! 4500 Colley Avenue ! Norfolk, VA 23508
40
Do you Strongly Agree, Agree, Disagree, or Strongly Disagree with this statement?
“The courts should develop better ways to assist people who do not have a lawyer.”
1992 1998 2000 2003 2005
Strongly Agree n/a n/a n/a 17.8% 16.8%
Agree 66.6% 65.2%
Disagree 14.5% 17.0%
Strongly Disagree 1.1% 1.0%
100.0% 100.0%
n=551 n=600
Mean = 3.01 2.98
Mean Scale: 4 = Strongly Agree
3 = Agree
2 = Disagree
1 = Strongly Disagree

PERCENT WHO AGREE WITH:
(Year 2005 Percentages)

Continental Research ! 4500 Colley Avenue ! Norfolk, VA 23508
41
SUMMARY TABLE
(In descending order based on “Percent Agree” column)
Do you Strongly Agree (4), Agree (3), Disagree (2), or Strongly Disagree (1) with the
following statements?2005 2005
Percent Avg.
Agree Rating
The courts treat people politely and respectfully. 91.2% 3.02
Courts try to meet the special needs of people with physical
or mental disabilities. 86.6% 2.94
The courts protect people’s constitutional rights. 86.2% 2.93
People who serve on juries come from all groups in the community. 85.8% 2.97
Court employees are dependable and accurate in their work. 85.5% 2.89
Judges are honest in performing their duties. 84.0% 2.94
The courts should develop better ways to assist people who
do not have a lawyer. 82.0% 2.98
The courts make decisions based on the facts. 81.7% 2.89
The behavior of judges in Virginia gives the public
confidence in the courts. 80.6% 2.87
Judges listen carefully to what people have to say. 79.8% 2.85
The courts should exercise more leadership in addressing
societal problems, such as drug abuse, treatment of the
mentally ill, and foster care. 78.2% 2.90
Judges are fair when deciding cases. 77.5% 2.81
The courts adequately protect victims’ interests. 74.2% 2.77
Court rulings and decisions are understood by the people
involved in cases. 67.7% 2.70
Minorities are adequately represented among Virginia’s
judges. 65.9% 2.67
The courts effectively inform the public about court
procedures and services. 63.3% 2.65
The time that people must wait in the courthouse before
their cases are heard is reasonable. 58.4% 2.55
The entire process to complete a court case, from beginning
to end, occurs in a reasonable length of time. 54.9% 2.53
Judges’ decisions are free from political influence. 53.3% 2.51

AVERAGE RATINGS:
(Year 2005 Averages)

Continental Research ! 4500 Colley Avenue ! Norfolk, VA 23508
42
SUMMARY TABLE
Average Ratings of Selected Statements
(In descending order based on the 2005 column)
Do you Strongly Agree (4), Agree (3), Disagree (2), or Strongly Disagree (1) with the
following statements?
1992 1998 2000 2003 2005
The courts treat people politely
and respectfully. n/a n/a n/a 3.00 3.02
The courts should develop
better ways to assist people
who do not have a lawyer. n/a n/a n/a 3.01 2.98
People who serve on juries
come from all groups in the
community. n/a 2.82 2.85 2.96 2.97
Judges are honest in performing
their duties. n/a n/a n/a 2.98 2.94
Courts try to meet the special
needs of people with physical
or mental disabilities. n/a 2.81 2.82 2.97 2.94
The courts protect people’s
constitutional rights. n/a n/a 2.86 2.97 2.93
The courts should exercise more
leadership in addressing societal
problems, such as drug abuse,
treatment of the mentally ill,
and foster care. n/a n/a n/a 2.70 2.90
The courts make decisions
based on the facts. n/a n/a n/a 2.91 2.89
Court employees are dependable
and accurate in their work. 2.85 2.84 2.83 2.94 2.89
The behavior of judges in Virginia
gives the public confidence in
the courts. n/a 2.74 2.86 2.90 2.87
Judges listen carefully to what
people have to say. n/a n/a n/a 2.87 2.85
Judges are fair when deciding
cases. n/a n/a 2.84 2.89 2.81
(continued)

Continental Research ! 4500 Colley Avenue ! Norfolk, VA 23508
43
SUMMARY TABLE
Average Ratings of Selected Statements
(In descending order based on the 2005 column)
Do you Strongly Agree (4), Agree (3), Disagree (2), or Strongly Disagree (1) with the
following statements?
1992 1998 2000 2003 2005
The courts adequately protect
victims’ interests. n/a n/a 2.64 2.82 2.77
Court rulings and decisions are
understood by the people
involved in cases. n/a n/a 2.62 2.67 2.70
Minorities are adequately
represented among Virginia’s
judges. n/a 2.56 2.51 2.68 2.67
The courts effectively inform
the public about court procedures
and services. 2.41 2.29 2.57 2.64 2.65
The time that people must wait
in the courthouse before their
cases are heard is reasonable. 2.27 2.35 2.41 2.55 2.55
The entire process to complete a
court case, from beginning to
end, occurs in a reasonable
length of time. 2.38 2.32 2.39 2.59 2.53
Judges’ decisions are free from
political influence. n/a n/a 2.38 2.52 2.51
(l=1302) (l=604) (l=598) (l=551) (l=600)
(s= 818) (s=548) (s=538) (s=533) (s=595)
Mean Scale: 4 = Strongly Agree
3 = Agree
2 = Disagree
1 = Strongly Disagree
NOTE: The (l= ) figure at the bottom of the columns indicates the largest number of people
responding to a particular question, while the (s= ) indicates the smallest.

Continental Research ! 4500 Colley Avenue ! Norfolk, VA 23508
44
In regard to the treatment and outcomes people experience in the courts...
In general, do you think the court system treats NON-ENGLISH SPEAKING people
as fairly as those who SPEAK ENGLISH?
1992 1998 2000 2003 2005
Yes n/a n/a n/a 74.2% 67.0%
No 25.8% 33.0%
100.0% 100.0%
n=551 n=600
NOTE: The 2003 wording for “No” indicated that they receive either worse or far worse
treatment.

Continental Research ! 4500 Colley Avenue ! Norfolk, VA 23508
45
In general, do you think the court system treats people equally, REGARDLESS OF
THEIR WEALTH?
1992 1998 2000 2003 2005
Yes 29.7% 31.0% n/a 43.6% 40.3%
No 70.3% 69.0% 56.4% 59.7%
100.0% 100.0% 100.0% 100.0%
n=1316 n=601 n=551 n=600
NOTE: The 2003 wording for “No” indicated that poor people receive either worse or far
worse treatment. The 1992 and 1998 wording for “Yes” indicates agreement that
“Courts treat poor and wealthy people the same.”

Continental Research ! 4500 Colley Avenue ! Norfolk, VA 23508
46
In general, do you think the court system treats people equally, REGARDLESS OF
THEIR RACE OR ETHNICITY?
1992 1998 2000 2003 2005
Yes 53.5% 61.0% n/a 67.7% 60.2%
No 46.5% 39.0% 32.3% 39.8%
100.0% 100.0% 100.0% 100.0%
n=1224 n=597 n=551 n=600
NOTE: The 2003 wording for “Yes” indicated agreement with, “The Courts treat all people
equally regardless of their race.” The 1992 and 1998 wording for “Yes” indicates
agreement that “Courts treat whites and minorities the same.”

Continental Research ! 4500 Colley Avenue ! Norfolk, VA 23508
47
In general, do you think the court system treats people WITHOUT AN ATTORNEY
as fairly as people who HAVE AN ATTORNEY?
1992 1998 2000 2003 2005
Yes n/a 26.9% 36.4% 26.8% 39.5%
No 73.1% 63.6% 73.2% 60.5%
100.0% 100.0% 100.0% 100.0%
n=599 n=572 n=551 n=600
NOTE: The 2003 wording for “No” indicated that people without an attorney receive either
worse or far worse treatment. The 1998 and 2000 wording for “Yes” indicates
agreement that “Courts treat people who have attorneys the same as people who do
not.”
Continental Research ! 4500 Colley Avenue ! Norfolk, VA 23508
48
Overall, do you feel you know A Lot, A Little, or Nothing at All about the courts in your
own community?
1992 1998 2000 2003 2005
A Lot n/a n/a 24.3% 28.9% 21.2%
A Little 70.2% 63.2% 69.2%
Nothing at All 5.5% 8.0% 9.7%
100.0% 100.0% 100.0%
n=600 n=551 n=600

Continental Research ! 4500 Colley Avenue ! Norfolk, VA 23508
49
In the past five years, have you had any experience at all with the court system in
Virginia?
1992 1998 2000 2003 2005
Yes 45.2% 46.5% 45.3% 52.3% 48.3%
No 54.8% 53.5% 54.7% 47.7% 51.7%
100.0% 100.0% 100.0% 100.0% 100.0%
n=1595 n=606 n=600 n=551 n=600

Continental Research ! 4500 Colley Avenue ! Norfolk, VA 23508
The following four questions were asked only of those who have
had experience with Virginia courts in the past 5 years.

Continental Research ! 4500 Colley Avenue ! Norfolk, VA 23508
50
(Asked only of those who had experience with the courts in the past 5 years.)
The last time you were in a courtroom, were you (fill in) ?
1992 1998 2000 2003 2005
A juror 11.5% 14.2% 16.5% 18.8% 20.0%
A visitor or observer 11.4% 14.9% 17.3% 23.3% 22.8%
A witness 19.0% 19.1% 19.1% 16.3% 16.2%
A victim in a criminal case 5.5% 3.9% 5.1% 2.8% 5.2%
The person being sued or
charged with an offense 28.7% 27.7% 27.6% 26.7% 26.2%
The person bringing the
lawsuit 16.9% 13.8% 10.7% 7.6% 6.6%
A court employee, judge,
police officer, or attorney 1.9% 4.6% 2.9% 4.5% 3.1%
Something else 5.0% 1.8% 0.7% 0.0% 0.0%
100.0% 100.0% 100.0% 100.0% 100.0%
n=721 n=282 n=272 n=288 n=290
Continental Research ! 4500 Colley Avenue ! Norfolk, VA 23508
51
(Asked only of those who had experience with the courts in the past 5 years.)
What kind of case was that? Was it (fill in) ?
1992 1998 2000 2003 2005
Traffic 39.9% 31.2% 37.5% 32.6% 32.4%
Criminal 17.1% 25.5% 19.5% 28.1% 26.9%
Civil 19.9% 22.7% 22.8% 18.4% 26.2%
Juvenile 7.2% 7.4% 7.4% 6.9% 5.2%
Divorce or Domestic
Relations 10.6% 10.6% 12.9% 13.9% 9.3%
Something else 5.4% 2.5% 0.0% 0.0% 0.0%
100.0% 100.0% 100.0% 100.0% 100.0%
n=709 n=282 n=272 n=288 n=290

Continental Research ! 4500 Colley Avenue ! Norfolk, VA 23508
52
(Asked only of those who had experience with the courts in the past 5 years.)
Regardless of the outcome of the case, was the court process Very Fair, Fair, Unfair,
or Very Unfair?
1992 1998 2000 2003 2005
Very Fair n/a 71.6% 81.3% 30.9% 33.4%
{ { Fair 50.0% 50.0%
Unfair 28.4% 18.8% 10.4% 11.7%
{ { Very Unfair 8.7% 4.8%
100.0% 100.0% 100.0% 100.0%
n=282 n=272 n=288 n=290
Mean = n/a n/a 3.03 3.12
Mean Scale: 4 = Very Fair
3 = Fair
2 = Unfair
1 = Very Unfair
NOTE: Prior to 2003, this question was a Yes/No question, indicating if the process was
fair.

Continental Research ! 4500 Colley Avenue ! Norfolk, VA 23508
53
(Asked only of those who had experience with the courts in the past 5 years.)
How satisfied were you with the outcome of that case? Were you Very Satisfied,
Satisfied, Dissatisfied, or Very Dissatisfied with the outcome?
1992 1998 2000 2003 2005
Very Satisfied 68.0% 70.6% 73.9% 28.5% 32.1%
{ { { Satisfied 47.2% 45.5%
Dissatisfied 32.0% 29.4% 26.1% 12.8% 14.1%
{ { { Very Dissatisfied 11.5% 8.3%
100.0% 100.0% 100.0% 100.0% 100.0%
n=699 n=282 n=272 n=288 n=290
Mean = n/a n/a n/a 2.93 3.01
Mean Scale: 4 = Very Satisfied
3 = Satisfied
2 = Dissatisfied
1 = Very Dissatisfied
NOTE: In 1998 and 2000, this question was a Yes/No question, indicating if the outcome
was satisfactory, whereas in 1992 it was an agreement scale.
Continental Research ! 4500 Colley Avenue ! Norfolk, VA 23508
54
In what one way do you think the court system in Virginia could or should be
improved?
2005
No suggestions 24.5%
Speed up the process - to conclusion 8.3%
Improve the quality and number of court-appointed attorneys 7.0%
Treat everyone equally 6.5%
The judges aren’t fair (in general) 4.8%
The judges should listen more/allow people to tell
their whole story 4.8%
Stricter/harsher punishment for criminals 3.8%
Build more courts and/or hire more judges to handle
the caseload 3.8%
Provide more information on the court process 3.0%
Too much time spent sitting around waiting 2.2%
Judges should not be politically appointed 1.8%
Courts should have language translators 1.8%
Be more accessible to people without lawyers 1.5%
Don’t allow frivolous lawsuits 1.5%
Don’t make law, just uphold it 1.3%
They need more minority judges 1.2%
Jury service should be required of everyone equally 1.2%
Explain court procedures in plain English 1.0%
Bad judges should be removed from the bench 0.8%
Eliminate plea bargaining 0.8%
Work to solve underlying societal problems 0.8%
Make sure court orders are enforced 0.8%
Juries need more information to do a good job 0.7%
Juries should be paid panels 0.7%
Treat jury pool members better 0.7%
Be more accessible to handicapped people 0.7%
Hire more staff to handle the workload 0.7%
Treat victims better 0.7%
(continued)

Continental Research ! 4500 Colley Avenue ! Norfolk, VA 23508
55
In what one way do you think the court system in Virginia could or should be
improved? (continued)
2005
Televise cases to educate the public 0.7%
Do more DNA testing 0.7%
Just improve everything 0.7%
Miscellaneous non-court remarks 0.7%
Judges should have term limits 0.5%
Prior criminal records should be admissible 0.5%
Attorneys shouldn’t charge so much 0.5%
Limit the number of continuances 0.5%
Decriminalize marijuana 0.5%
Stay out of social work, just punish people 0.5%
Don’t allow so many appeals 0.5%
Steer more cases towards mediation 0.3%
Offer more on-line/computer access 0.3%
Allow jurors to question witnesses 0.3%
The jury process is too time-consuming 0.3%
Eliminate court-appointed lawyers; make people pay 0.3%
Attorneys should not be heard first 0.3%
Lower court fees 0.3%
Eliminate the death penalty 0.3%
Don’t take bribes 0.3%
Stop police from fibbing 0.3%
More parking 0.3%
Speed up the security checkpoints 0.3%
Educate school children about the courts 0.2%
Simplify court procedures to save time 0.2%
Expand the hours the court is open 0.2%
Get rid of the bondsman system 0.2%
Too many conservative judges 0.2%
They need more female judges 0.2%
Judges need more latitude in sentencing 0.2%
(continued)

Continental Research ! 4500 Colley Avenue ! Norfolk, VA 23508
56
In what one way do you think the court system in Virginia could or should be
improved? (continued)
2005
Judges should decide all cases, not juries 0.2%
The loser should pay all court costs 0.2%
Separate civil and traffic cases 0.2%
Inform citizens when the laws change 0.2%
Let me just pay the fine and not have to appear in court 0.2%
The Commonwealth’s Attorney should be more fair 0.2%
Don’t allow multi-million dollar awards 0.2%
100.0%
n=600

Continental Research ! 4500 Colley Avenue ! Norfolk, VA 23508
57
If you needed or wanted some information, how would you prefer to learn about the
Virginia court system? (Responses were not read.)
1992 1998 2000 2003 2005
Internet/The Web n/a n/a n/a n/a 36.8%
Phone or go to the Courthouse 16.7%
Contact an attorney 12.8%
Read the newspaper 7.5%
Go to the library 6.3%
Ask a friend, neighbor, or family member
(incl. those affiliated with the courts) 6.0%
Receive pamphlets or brochures by direct mail 5.8%
Watch TV 3.2%
Various media sources (not specific) 1.0%
Listen to the radio 0.7%
I really don’t need any information 0.8%
Not able to offer a source suggestion 2.3%
100.0%
n=600

Continental Research ! 4500 Colley Avenue ! Norfolk, VA 23508
58
If you were involved with the courts, would it be Very Useful, Somewhat Useful, or Not
Useful for you to be able to pay fines, fees, and other costs over the Internet?
1992 1998 2000 2003 2005
Very Useful n/a n/a n/a n/a 41.8%
Somewhat Useful 23.2%
Not Useful 35.0%
100.0%
n=600

Continental Research ! 4500 Colley Avenue ! Norfolk, VA 23508
59
If you were involved with the courts, would it be Very Useful, Somewhat Useful, or Not
Useful for you to be able to complete and submit court documents electronically over
the Internet?
1992 1998 2000 2003 2005
Very Useful n/a n/a n/a n/a 41.5%
Somewhat Useful 20.3%
Not Useful 38.2%
100.0%
n=600

Continental Research ! 4500 Colley Avenue ! Norfolk, VA 23508
60
If you were assigned to jury duty, would you find it Very Useful, Somewhat Useful, or
Not Useful to use the Internet to see if you were actually needed for jury duty that
week?
1992 1998 2000 2003 2005
Very Useful n/a n/a n/a n/a 52.8%
Somewhat Useful 14.7%
Not Useful 32.5%
100.0%
n=600

Continental Research ! 4500 Colley Avenue ! Norfolk, VA 23508
61
In order to educate the public about how the courts and legal system function, which
of these four approaches would be the best strategy?
1992 1998 2000 2003 2005
In school grades K-12, they
could teach more about
Virginia courts and the law n/a n/a n/a n/a 55.3%
There could be interactive
educational programs on the
Internet and on DVD or CD-ROM 15.5%
Judges could make presentations
in schools (K-12) and to
organizations throughout
Virginia 15.2%
The courts could hear certain
kinds of cases in schools and other
public places so people could see
what happens in a court 14.0%
100.0%
n=600

Continental Research ! 4500 Colley Avenue ! Norfolk, VA 23508
62
What do you think most influences your overall impression of the courts? Is it
(fill in) ?
1992 1998 2000 2003 2005
Actual experience with
Virginia courts* n/a 44.1% 39.8% 41.9% 33.5%
Actual experience with
federal courts or courts
in another state** n/a n/a n/a 4.7%
What you have heard from
others 13.7% 17.3% 17.8% 14.0%
Courtroom TV shows like
Judge Judy*** n/a 5.2% 2.4% 4.0%
Information in the newspaper,
other TV shows, or on the radio 38.1% 29.7% 34.5% 37.3%
What you learned in school 4.1% 8.0% 3.3% 6.2%
Something else 0.0% 0.0% 0.2% 0.3%
100.0% 100.0% 100.0% 100.0%
n=606 n=600 n=551 n=600
*Prior to 2005, Virginia was not specified.
**This choice was not mentioned prior to 2005.
***This choice was not mentioned in 1998.

Continental Research ! 4500 Colley Avenue ! Norfolk, VA 23508
DEMOGRAPHICS

Continental Research ! 4500 Colley Avenue ! Norfolk, VA 23508
63
Age of Respondent
1992 1998 2000 2003 2005
18 to 24 9.6% 6.6% 7.8% 7.4% 5.7%
25 to 34 24.0% 18.0% 13.0% 14.3% 17.3%
35 to 44 26.1% 23.6% 23.2% 21.8% 21.0%
45 to 54 16.1% 22.9% 26.3% 23.6% 22.3%
55 to 64 11.5% 14.9% 16.7% 18.9% 17.2%
65 or over 12.7% 14.0% 13.0% 14.0% 16.5%
100.0% 100.0% 100.0% 100.0% 100.0%
n=1596 n=606 n=600 n=551 n=600
Mean* = 43.5 46.5 47.1 46.8 47.1
*Based on category mid-point interpolation.

Continental Research ! 4500 Colley Avenue ! Norfolk, VA 23508
64
Educational Attainment of Respondent
1992 1998 2000 2003 2005
Some high school or less 9.8% 9.2% 8.3% 13.6% 14.3%
High school diploma or G.E.D. 26.3% 27.4% 27.0% 25.0% 24.0%
1 to 3 years of college 30.8% 27.2% 27.0% 26.3% 30.0%
Finished 4-year college degree 16.4% 21.5% 19.0% 21.2% 17.5%
Graduate school or degree 16.6% 14.7% 18.7% 13.8% 14.2%
100.0% 100.0% 100.0% 100.0% 100.0%
n=1594 n=606 n=600 n=551 n=600

Continental Research ! 4500 Colley Avenue ! Norfolk, VA 23508
65
Ethnic Origin of Respondent
1992 1998 2000 2003 2005
White, not Hispanic 83.0% 81.4% 79.7% 75.7% 71.8%
African American 14.3% 12.7% 13.7% 17.1% 20.0%
Hispanic/Latino 0.8% 2.0% 2.5% 4.0% 3.5%
Asian 1.3% 1.8% 2.2% 1.3% 2.5%
Native American/Alaskan
Native* n/a n/a 0.2% 0.7% 1.0%
Other 0.6% 2.1% 1.8% 1.3% 1.2%
100.0% 100.0% 100.0% 100.0% 100.0%
n=1581 n=606 n=600 n=551 n=600
*NOTE: This category was not found on the 1992 or 1998 survey form.

Continental Research ! 4500 Colley Avenue ! Norfolk, VA 23508
66
In what city or county do you live?2005
Albemarle County 0.8%
Alleghany County 0.3%
Amelia County 0.3%
Amherst County 0.7%
Appomattox County 0.3%
Arlington County 3.0%
Augusta County 1.0%
Bedford County 1.2%
Botetourt County 0.5%
Brunswick County 0.3%
Buchanan County 0.2%
Campbell County 0.7%
Caroline County 0.2%
Carroll County 0.2%
Charles City County 0.5%
Charlotte County 0.5%
Chesterfield County 3.0%
Culpeper County 0.7%
Essex County 0.5%
Fairfax County 13.5%
Fauquier County 0.5%
Floyd County 0.3%
Fluvanna County 0.2%
Franklin County 0.8%
Frederick County 0.2%
Giles County 0.3%
Gloucester County 0.7%
Goochland County 0.5%
Greensville County 0.2%
Hanover County 0.8%
Henrico County 4.7%
Henry County 0.8%
Isle of Wight County 0.5%
James City County 0.7%
King George County 0.5%
King William County 0.5%
Lee County 0.5%
(continued)

Continental Research ! 4500 Colley Avenue ! Norfolk, VA 23508
67
In what city or county do you live? (continued)2005
Loudoun County 2.5%
Louisa County 1.2%
Lunenburg County 0.5%
Madison County 0.3%
Mathews County 0.5%
Mecklenburg County 0.3%
Montgomery County 0.8%
Nelson County 0.3%
Northumberland County 0.2%
Nottoway County 0.2%
Orange County 0.7%
Page County 0.7%
Patrick County 0.2%
Pittsylvania County 0.7%
Prince Edward County 0.5%
Prince George County 1.0%
Prince William County 3.5%
Pulaski County 0.7%
Richmond County 0.2%
Roanoke County 1.2%
Rockbridge County 0.7%
Rockingham County 1.8%
Scott County 0.3%
Shenandoah County 0.2%
Smyth County 0.5%
Southampton County 0.2%
Spotsylvania County 1.2%
Stafford County 0.8%
Sussex County 0.3%
Tazewell County 0.2%
Warren County 0.5%
Washington County 1.7%
Westmoreland County 0.3%
Wise County 0.2%
Wythe County 0.5%
York County 0.8%
Alexandria 2.2%
(continued)

Continental Research ! 4500 Colley Avenue ! Norfolk, VA 23508
68
In what city or county do you live? (continued)2005
Bristol 0.8%
Charlottesville 0.5%
Chesapeake 2.8%
Colonial Heights 0.2%
Danville 0.8%
Emporia 0.2%
Fairfax 0.3%
Franklin 0.2%
Galax 0.2%
Hampton 2.0%
Harrisonburg 0.2%
Hopewell 0.2%
Lexington 0.5%
Lynchburg 0.7%
Manassas 0.8%
Manassas Park 0.2%
Martinsville 0.7%
Newport News 2.5%
Norfolk 3.3%
Petersburg 0.5%
Poquoson 0.2%
Portsmouth 1.5%
Radford 0.2%
Richmond 1.8%
Roanoke 1.8%
Salem 0.2%
Staunton 0.2%
Suffolk 0.8%
Virginia Beach 6.0%
Williamsburg 0.2%
Winchester 0.3%
100.0%
n=600

Continental Research ! 4500 Colley Avenue ! Norfolk, VA 23508
69
Annual Household Income
1992 1998 2000 2003 2005
Under $25,000 30.5% 21.8% 17.0% 16.6% 20.7%
$25,000 to $49,999 38.9% 35.6% 34.9% 29.8% 27.5%
$50,000 to $74,999 17.5% 23.7% 23.3% 27.4% 20.3%
$75,000 to $99,999* 13.1% 9.9% 11.9% 13.1% 14.6%
{
$100,000 or more 9.0% 12.8% 13.1% 16.9%
100.0% 100.0% 100.0% 100.0% 100.0%
n=1493 n=587 n=587 n=541 n=581
*In 1992, this category was “$75,000 or more.”
NOTE: The year 2005 mean was $39,954, and the median was $51,334.

Continental Research ! 4500 Colley Avenue ! Norfolk, VA 23508
70
Gender of Respondent
1992 1998 2000 2003 2005
Male 42.1% 45.5% 48.3% 47.7% 46.5%
Female 57.9% 54.5% 51.7% 52.3% 53.5%
100.0% 100.0% 100.0% 100.0% 100.0%
n=1600 n=606 n=600 n=551 n=600

Continental Research ! 4500 Colley Avenue ! Norfolk, VA 23508
COMPARATIVE T-TEST ANALYSIS

Continental Research ! 4500 Colley Avenue ! Norfolk, VA 23508
71
T-TEST ANALYSIS (2005 vs. 1992, 1998, 2000 & 2003)
Avg.
Rating
Overall impression of Virginia’s court system* 2.83 w x
People receive fair outcomes when they deal with Virginia’s courts* 2.67
The courts use fair procedures in handling cases* 2.86
The courts treat people politely and respectfully 3.02
The courts make decisions based on the facts 2.89
Judges are honest in performing their duties 2.94
Judges listen carefully to what people have to say 2.85
People who serve on juries come from all groups in the community 2.97 x y
Court employees are dependable and accurate in their work 2.89 y
Judges are fair when deciding cases 2.81 d
The behavior of judges in Virginia gives the public confidence in the courts 2.87 x
Minorities are adequately represented among Virginia’s judges 2.67 x y
Judges’ decisions are free from political influence 2.51 y
The courts effectively inform the public about court procedures and services 2.65 w x y
The time that people must wait in the courthouse before their cases are
heard is reasonable 2.55 w x y
The courts protect people’s constitutional rights 2.93 y
The courts adequately protect victims’ interests 2.77 y
Court rulings and decisions are understood by the people involved in cases 2.70 y
The entire process to complete a court case, from beginning to end, occurs
in a reasonable length of time 2.53 w x y
Courts try to meet the special needs of people with physical or mental
disabilities 2.94 x y
The courts should exercise more leadership in addressing societal problems,
such as drug abuse, treatment of the mentally ill, and foster care 2.90 z
The courts should develop better ways to assist people who do not have a lawyer 2.98
The court process was fair (only those who have court experience)* 3.12
Satisfied with outcome of case (only those who have court experience)* 3.01
KEY: a- 1992 ratings were sig. higher than 2005
b- 1998 ratings were sig. higher than 2005
c- 2000 ratings were sig. higher than 2005
d- 2003 ratings were sig. higher than 2005
w- 2005 ratings were sig. higher than 1992
x- 2005 ratings were sig. higher than 1998
y- 2005 ratings were sig. higher than 2000
z- 2005 ratings were sig. higher than 2003
NOTE: Only questions common to prior surveys were included.
*These items used a different scale from the agreement scale.

Continental Research ! 4500 Colley Avenue ! Norfolk, VA 23508
APPENDICES

Continental Research ! 4500 Colley Avenue ! Norfolk, VA 23508
A1
DEMOGRAPHIC T-TEST ANALYSISAvg.
Rating
Overall impression of Virginia’s court system* 2.83 j
People receive fair outcomes when they deal with Virginia’s courts* 2.67 c g n
The courts use fair procedures in handling cases* 2.86 c g i n
The courts treat people politely and respectfully 3.02 c g
The courts make decisions based on the facts 2.89 c g j n
Judges are honest in performing their duties 2.94 c g
Judges listen carefully to what people have to say 2.85 c g j n
People who serve on juries come from all groups in the community 2.97
Court employees are dependable and accurate in their work 2.89 c g
Judges are fair when deciding cases 2.81 c g j n
The behavior of judges in Virginia gives the public confidence in the courts 2.87
Minorities are adequately represented among Virginia’s judges 2.67 c j m
Judges’ decisions are free from political influence 2.51 g j
The courts effectively inform the public about court procedures and services 2.65 a j
The time that people must wait in the courthouse before their cases are
heard is reasonable 2.55
The courts protect people’s constitutional rights 2.93 c e g n
The courts adequately protect victims’ interests 2.77 g n
Court rulings and decisions are understood by the people involved in cases 2.70 j
The entire process to complete a court case, from beginning to end, occurs
in a reasonable length of time 2.53 j l m
Courts try to meet the special needs of people with physical or mental
disabilities 2.94 c
The courts should exercise more leadership in addressing societal problems,
such as drug abuse, treatment of the mentally ill, and foster care 2.90 a h m
The courts should develop better ways to assist people who do not have a lawyer 2.98 a d h m
The court process was fair (only those who have court experience)* 3.12
Satisfied with outcome of case (only those who have court experience)* 3.01 g
a- Women rated it higher than men
b- Men rated it higher than women
c- Whites rated it higher than non-whites
d- Non-whites rated it higher than whites
e- Urban residents rated it higher than rural residents
f- Rural residents rated it higher than urban residents
g- Those with bachelor’s degrees rated it higher than those
without
h- Those without bachelor’s degrees rated it higher than those
with
i- Those with recent court experience rated it higher than those
without
j- Those without recent court experience rated it higher than
those with
k- Those younger than age 45 rated it higher than those age 45
or older
l- Those age 45 or older rated it higher than those who were
younger
m- Those earning under $50,000 rated it higher than those who
earn more
n- Those earning $50,000 or more rated it higher than those who
earn less
*These items used a different scale from the agreement scale.

Continental Research ! 4500 Colley Avenue ! Norfolk, VA 23508
A2
VIRGINIA JUDICIAL SYSTEM: 2005 STATEWIDE OPINION SURVEY
Standard Intro [_____]. To begin with, I’d like to ask about your impression of a few things.
1. How would you rate your overall impression of _________? Would you say your impression is:
9 Very Positive (Buffer warm-up question. Do not enter responses.)
9 Positive
9 Negative
9 Very Negative
2. Is your overall impression of Virginia’s court system:
4- Very Positive
3- Positive
2- Negative
1- Very Negative
7- Don’t Know
3. How often do you think the people receive fair outcomes when they deal with Virginia’s courts... is
that always, usually, sometimes, or never?
4- Always
3- Usually
2- Sometimes
1- Never
4. How often do you think the courts use fair procedures in handling cases.. is that always, usually,
sometimes, or never?
4- Always
3- Usually
2- Sometimes
1- Never

Continental Research ! 4500 Colley Avenue ! Norfolk, VA 23508
A3
Now, I’d like to ask how you feel about some issues related to the courts in your community. As
I read each statement, just tell me if you Strongly Agree, Agree, Disagree, or Strongly Disagree.
[Items randomized.]
Strongly Strongly
Agree Agree Disagree Disagree
5. The courts treat people politely and respectfully 4 3 2 1
6. The courts make decisions based on the facts 4 3 2 1
7. Judges are honest in performing their duties 4 3 2 1
8. Judges listen carefully to what people have to say 4 3 2 1
9. People who serve on juries come from all
groups in the community 4 3 2 1
10. Court employees are dependable and accurate
in their work 4 3 2 1
11. Judges are fair when deciding cases 4 3 2 1
12. The behavior of judges in Virginia gives
the public confidence in the courts 4 3 2 1
13. Minorities are adequately represented among
Virginia’s judges 4 3 2 1
14. Judges’ decisions are free from political influence 4 3 2 1
15. The courts effectively inform the public about
court procedures and services 4 3 2 1
16. The time that people must wait in the courthouse
before their cases are heard is reasonable 4 3 2 1
17. The courts protect people’s constitutional rights 4 3 2 1
18. The courts adequately protect victims’ interests 4 3 2 1
19. Court rulings and decisions are understood by
the people involved in cases 4 3 2 1
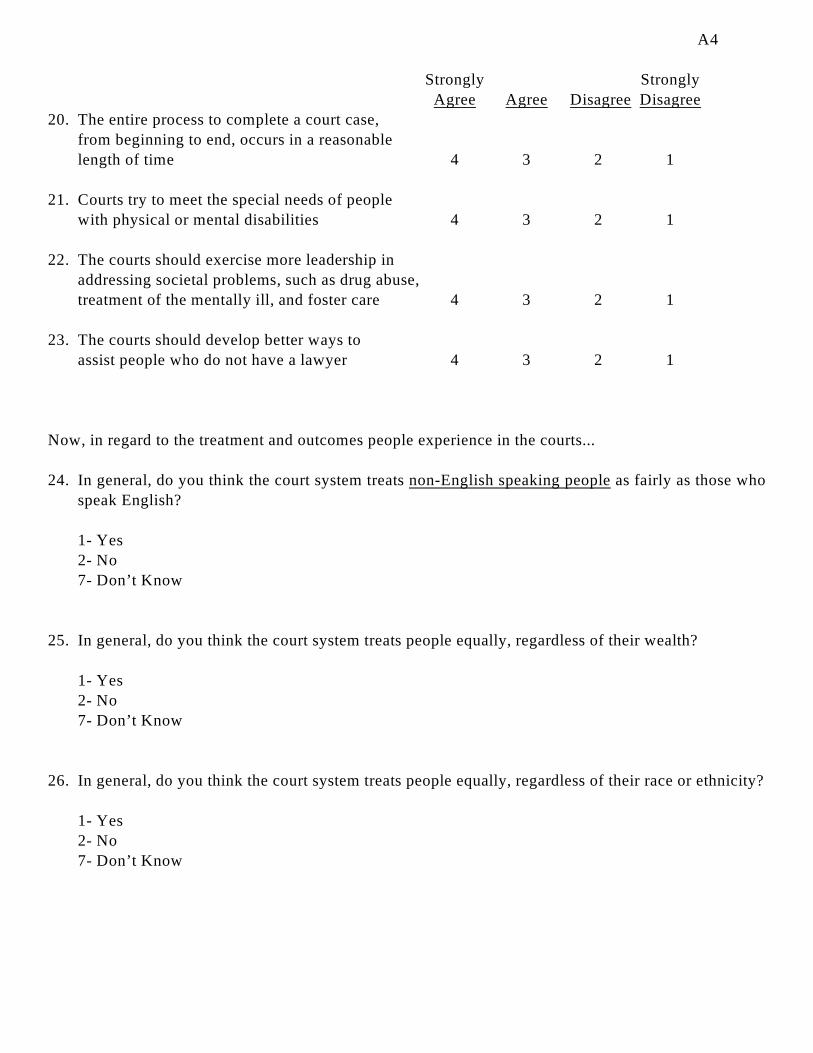
Continental Research ! 4500 Colley Avenue ! Norfolk, VA 23508
A4
Strongly Strongly
Agree Agree Disagree Disagree
20. The entire process to complete a court case,
from beginning to end, occurs in a reasonable
length of time 4 3 2 1
21. Courts try to meet the special needs of people
with physical or mental disabilities 4 3 2 1
22. The courts should exercise more leadership in
addressing societal problems, such as drug abuse,
treatment of the mentally ill, and foster care 4 3 2 1
23. The courts should develop better ways to
assist people who do not have a lawyer 4 3 2 1
Now, in regard to the treatment and outcomes people experience in the courts...
24. In general, do you think the court system treats non-English speaking people as fairly as those who
speak English?
1- Yes
2- No
7- Don’t Know
25. In general, do you think the court system treats people equally, regardless of their wealth?
1- Yes
2- No
7- Don’t Know
26. In general, do you think the court system treats people equally, regardless of their race or ethnicity?
1- Yes
2- No
7- Don’t Know

Continental Research ! 4500 Colley Avenue ! Norfolk, VA 23508
A5
27. In general, do you think the court system treats people without an attorney as fairly as people who have
an attorney?
1- Yes
2- No
7- Don’t Know
28. Overall, do you feel you know a lot, a little, or nothing at all about the courts in your own community?
3- A lot
2- A little
1- Nothing at all?
29. In the past 5 years, have you had ANY experience at all with the court system in Virginia?
1- Yes
2- No (Go to Q34)
30. The last time you were in a courtroom, were you: (Read Choices)
1- A juror,
2- A visitor or observer,
3- A witness,
4- A victim in a criminal case,
5- The person being sued or charged with an offense,
6- The person bringing the lawsuit,
7- A court employee, judge, police officer, attorney, or
Something else ________________________?
31. What kind of case was that? Was it: (Read Choices)
1- Traffic,
2- Criminal,
3- Civil,
4- Juvenile,
5- Divorce or Domestic Relations, or
x- Something else ___________________?

Continental Research ! 4500 Colley Avenue ! Norfolk, VA 23508
A6
32. Regardless of the outcome of the case, was the court process: (Read Choices)
4- Very Fair
3- Fair
2- Unfair, or
1- Very Unfair?
33. And, how satisfied were you with the outcome of that case? Were you: (Read Choices)
4- Very Satisfied
3- Satisfied
2- Dissatisfied, or
1- Very Dissatisfied with the outcome?
34. What do you think most influences your overall impression of the courts? Is it: (Read Choices)
1- Actual experience with Virginia courts,
2- Actual experience with federal courts or courts in another state,
3- What you’ve heard from others,
4- Courtroom TV shows like Judge Judy,
5- Information in the newspaper, other TV shows, or on the radio,
6- What you learned in school, or
Something else? _____________________________
35. Please take a moment to think... In what ONE way do you think the court system in Virginia could
or should be improved? 9 No suggestions
__________________________________________________________________________
__________________________________________________________________________
36. If you needed or wanted some information, how would you prefer to learn about the Virginia court
system? (Main way preferred.)
__________________________________________________________________

Continental Research ! 4500 Colley Avenue ! Norfolk, VA 23508
A7
If you were involved with the courts, would it be Very Useful, Somewhat Useful, or Not Useful for you
to be able to:
Very Somewhat Not
Useful Useful Useful
37. 3 2 1 Pay fines, fees, and other costs over the Internet?
38. 3 2 1 Complete and submit court documents electronically over the Internet?
39. 3 2 1 If you were assigned to jury duty, would you find it VU, SU, or NU
to use the Internet to see if you were actually needed for jury duty that
week?
40. In order to educate the public about how the courts and legal system function, which of these four
approaches would be the BEST strategy? [Rotate choices] (Check only one)
___ Judges could make presentations in schools (K-12) and to organizations throughout Virginia
___ The courts could hear certain kinds of cases in schools and other public places so people could
see what happens in a court
___ There could be interactive educational programs on the Internet and on DVD or CD-ROM
___ In school grades K-12, they could teach more about Virginia courts and the law
Now, I have just a few questions so we can group the survey responses. [I will not ask for or write your
name on this survey; everything is kept strictly confidential.]
41. Is your age between: (Read Choices)
1- 18 and 24
2- 25 to 34
3- 35 to 44
4- 45 to 54
5- 55 to 64, or
6- 65 and over?
9- Refused
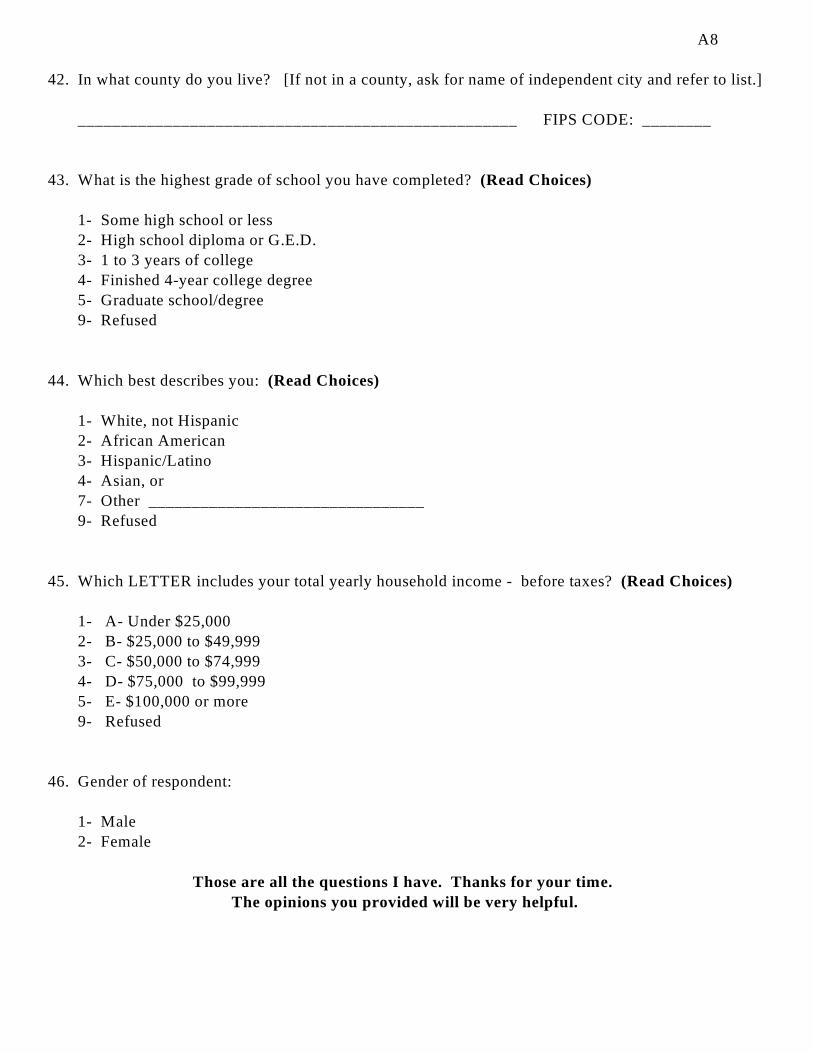
Continental Research ! 4500 Colley Avenue ! Norfolk, VA 23508
A8
42. In what county do you live? [If not in a county, ask for name of independent city and refer to list.]
___________________________________________________ FIPS CODE: ________
43. What is the highest grade of school you have completed? (Read Choices)
1- Some high school or less
2- High school diploma or G.E.D.
3- 1 to 3 years of college
4- Finished 4-year college degree
5- Graduate school/degree
9- Refused
44. Which best describes you: (Read Choices)
1- White, not Hispanic
2- African American
3- Hispanic/Latino
4- Asian, or
7- Other ________________________________
9- Refused
45. Which LETTER includes your total yearly household income - before taxes? (Read Choices)
1- A- Under $25,000
2- B- $25,000 to $49,999
3- C- $50,000 to $74,999
4- D- $75,000 to $99,999
5- E- $100,000 or more
9- Refused
46. Gender of respondent:
1- Male
2- Female
Those are all the questions I have. Thanks for your time.
The opinions you provided will be very helpful.