surface-electronic-state-modulated ... - ir.nsfc.gov.cn
TRANSCRIPT
Surface-Electronic-State-Modulated, Single-Crystalline (001) TiO2Nanosheets for Sensitive Electrochemical Sensing of Heavy-MetalIonsWen-Yi Zhou,†,‡,§ Jin-Yun Liu,†,§ Jie-Yao Song,‡ Jin-Jin Li,∥ Jin-Huai Liu,*,†,‡ and Xing-Jiu Huang*,†,‡
†Key Laboratory of Environmental Optics and Technology, Institute of Intelligent Machines, Chinese Academy of Sciences, Hefei,Anhui 230031, P.R. China‡Department of Chemistry, University of Science and Technology of China, Hefei, Anhui 230026, P.R. China∥Department of Micro/Nano Electronics, Shanghai Jiao Tong University, Shanghai 200240, P.R. China
*S Supporting Information
ABSTRACT: Intrinsically low conductivity and poor reactivity restrictmany semiconductors from electrochemical detection. Usually, metal- andcarbon-based modifications of semiconductors are necessary, making themcomplex, expensive, and unstable. Here, for the first time, we present asurface-electronic-state-modulation-based concept applied to semiconduc-tors. This concept enables pure semiconductors to be directly available forultrasensitive electrochemical detection of heavy-metal ions without anymodifications. As an example, a defective single-crystalline (001) TiO2nanosheet exhibits high electrochemical performance toward Hg(II),including a sensitivity of 270.83 μA μM−1 cm−2 and a detection limit of0.017 μM, which is lower than the safety standard (0.03 μM) of drinkingwater established by the World Health Organization (WHO). It has beenconfirmed that the surface oxygen vacancy adsorbs an O2 molecule while theTi3+ donates an electron, forming the O2
•− species that facilitate adsorptionof Hg(II) and serve as active sites for electron transfer. These findings not only extend the electrochemical sensing applications ofpure semiconductors but also stimulate new opportunities for investigating atom-level electrochemical behaviors ofsemiconductors by surface electronic-state modulation.
Nanomaterials have been widely used in the electro-chemical detection of heavy-metal ions because of their
high sensitivities, low detection limits, and rapid responses.1−6
However, electrochemical sensing nanomaterials are commonlylimited to conductive metal- and carbon-based systems.4 Fortransition-metal-oxide-based electrodes, modifications withother materials are usually required due to the poorconductivity and reactivity of such electrodes, which makethe sensing systems complex, expensive, and unstable.5,6 Inaddition, the improved electrochemical performance (includingthe sensitivity and the limits of detection) is commonlyascribed to the two-step process in which adsorption of analyteonto particles and subsequent desorption and diffusion to theelectrode is required.7 This has been experimentally andtheoretically demonstrated, while the electrochemical mecha-nism at an atomic level is still unclear.1,8
Among many transition-metal oxides, TiO2 possesses highpotential as an electrochemical sensing material because of itsabundance, low cost, and high stability.9−11 However, the wide-bandgap energy (3.2 eV) makes TiO2 more appropriate forphotocatalysis.9,12 Pure TiO2 has rarely been considered forelectrochemical detection of heavy-metal ions due to itsintrinsic low conductivity and poor reactivity,12 while modified
materials such as DNA/C/TiO213 and Ti/TiO2 nanotube/Au
14
composites show high electrochemical performance. Currently,the same as many other semiconductor electrodes, it is still verychallenging to directly apply a pure TiO2-based electrode forelectrochemical detection of heavy-metal ions.Recently, a defective TiO2 crystal exposed with a high-energy
(001) facet has been reported to be an efficient electrocatalystfor an oxygen reduction reaction.15 Defects are able tomodulate the surface-electron state and serve as active sitesfor redox reactions.16−19 The electrons produced by nativedefects can be trapped in crystal lattice defect centers,18,20
forming a small polaron,21 which has been confirmed by first-principle calculation22 and electron-paramagnetic-resonance(EPR) study.23 The polaron with an abundance of trappedelectrons is expected to serve as a preferentially active site foradsorption and chemical reactions.18,24,25
Here, we report a sensitive electrochemical sensing perform-ance of a defective single-crystalline (001) TiO2-nanosheettoward heavy-metal ions (e.g., Hg(II)). The defective TiO2
Received: October 12, 2016Accepted: February 21, 2017Published: February 21, 2017
Article
pubs.acs.org/ac
© 2017 American Chemical Society 3386 DOI: 10.1021/acs.analchem.6b04023Anal. Chem. 2017, 89, 3386−3394
nanosheets are modulated by a surface Ti3+ ion and an oxygenvacancy (OV). By using the defective TiO2 nanosheet-modifiedelectrodes, the modification of TiO2 with other materials forelectrochemical detection is no longer necessary. The presenceof surface Ti3+ ion and OVs is confirmed by X-rayphotoelectron spectroscopy (XPS), Raman spectroscopy,electron spin resonance (ESR), and Fourier-transform infrared(FT-IR) spectroscopy. The effect of surface Ti3+ ion and OVsfor enhancing the stripping signals is also investigated byadsorption experiments accompanying the XPS and extendedX-ray absorption fine structure (EXAFS) analysis.
■ EXPERIMENTAL DETAILSTiO2 Nanosheet Preparation. The defective TiO2 nano-
sheets were prepared via a modified hydrothermal method.26
Briefly, 25 mL of Ti(OBu)4, 3 mL of concentrated H2SO4, 0.5mL of HF (40 wt %), and 2.5 mL of ultrapure water wereadded into a Teflon autoclave and maintained at 180 °C for 24h. Here, since HF is a kind of contact poison that is extremelycorrosive, it should be handled carefully. After the reaction, theprecipitate was filtered and washed with ethanol and distilledwater to remove the residual organic solvent and dried in air at60 °C. Then, the products were annealed in air at differenttemperatures (25, 150, 300, 450, 600, and 800 °C) for 2 h at aramp rate of 5 °C min−1 (the samples were designated as T-1,TiO2-150, T-2, TiO2-450, T-3, and T-4, respectively). TiO2nanoparticles with the (101) facet enclosed were prepared via asimilar hydrothermal method without using HF and designatedas sample T-5. Standard anatase TiO2 nanoparticles (5−10 nm)were purchased from Aladdin (Shanghai, China).Characterization. Morphology and structure were charac-
terized by high-resolution transmission electron microscopy(HRTEM) measurements (Model No. JEM-2010, JEOL, Ltd.,Tokyo, Japan). X-ray diffraction (XRD) patterns were recordedon a Philips X’Pert Pro X-ray diffractometer with Cu Kαradiation (1.5418 Å). EXAFS measurements were performed toinvestigate bulk-phase information. XPS measurements wereperformed on a ESCALAB MKII spectrometer (VG Scientific,USA) with an Mg Kα X-ray source (1253.6 eV, 120 W) at aconstant analyzer. ESR was conducted to analyze the electronicstates of Ti and O atoms using a JES-FA 200 X-BandSpectrometer (JEOL, Ltd.). The infrared spectra were recordedbetween 4000 and 600 cm−1 on a FT-IR spectrometer (Magna-IR 750, Nicolet Instrument, Inc., USA). The surface area wasmeasured with a Brunauer-Emmet-Teller (BET) method on aBuilder 4200 instrument (Tristar II 3020M, MicromeriticsInstrument Corp., USA). Raman measurements were carriedout on a Lab RAM HR800 confocal microscope Raman system(Horiba Jobin Yvon, Inc., USA). Thermal analysis wasperformed by thermal gravimetric analysis-differential scanningcalorimetry (using a DTG-60H, TG/DTA SimultaneousMeasuring Instrument, SHIMADZU, Japan), at a ramp rateof 10 °C min−1 in air.Impedance Spectroscopy Measurements. The electro-
chemical tests were conducted on a CHI660D computer-controlled potentiostat (Chenhua Instruments Co., Shanghai,China), using a conventional three-electrode system, with themodified or bare glassy-carbon electrode (GCE, 3 mmdiameter) as a working electrode, Ag/AgCl as a referenceelectrode, and Pt wire as a counter electrode. Electrochemicalimpedance spectroscopy (EIS) measurements were taken withan AC voltage amplitude of 5 mV within the frequency range of105−1 Hz in a solution consisting of 5 mM K3Fe(CN)6 and 0.1
M KCl. Mott−Schottky plots were measured in 0.1 M Na2SO4solution at a fixed frequency of 1000 Hz in the applied voltagerange of 0−0.5 V.
TiO2 Electrode Fabrication. First, 5 mg of TiO2 sampleswas dispersed in 5 mL of water to form a suspension. Then, 7μL of the TiO2 nanocrystal suspension was pipetted onto thesurface of a freshly polished glassy-carbon electrode (GCE),and the solvent was evaporated under room temperatureconditions to obtain the TiO2-modified GCE.
Electrochemical Measurements. Square wave anodicstripping voltammetry (SWASV) was used for Hg(II) detectionunder optimal experimental conditions. A deposition potentialof −1.4 V was applied for 150 s to the working electrode withstirring. The SWASV responses were recorded between 0 and0.5 V with a step potential of 4 mV, amplitude of 25 mV, andfrequency of 25 Hz. A desorption potential of 0.8 V for 150 swas performed to remove the residual metals under stirring. Allexperiments were carried out at room temperature, with Ag/AgCl serving as a reference electrode.
Adsorption Measurements. Adsorption experiments wereperformed using a batch technique. Typically, 10 mg of TiO2samples and 10 mL of 8.5 μM Hg(II) aqueous solution wereadded into a vial at room temperature. The vial was thencontinuously stirred for 24 h, after which the adsorbents wereseparated by high-speed centrifugation and dried at 60 °C forfurther XPS and X-ray absorption fine structure (XAFS)analysis. The concentration of Hg(II) remaining in the solutionwas analyzed using inductively coupled plasma atomic emissionspectrophotometry (ICP-AES) (Model ICP 6300 spectrom-eter, Thermo Fisher Scientific, USA). The pH value of thesolution was adjusted to 6.0 by NaAc (0.1 M) and HAc (0.1 M)solutions.
XAFS Analysis. XAFS measurements were conducted at theBL14W1 beamline of the Shanghai Synchrotron RadiationFacility (SSRF). Ti K-edge EXAFS at 4966 eV and X-rayabsorption near-edge structure (XANES) measurements wererecorded in the transmission mode, while Hg L3-edge EXAFS at12 284 eV was recorded in the fluorescence mode. Theacquired EXAFS data were processed according to standardprocedures using the ATHENA module implemented in theIFEFFIT software packages. The EXAFS χ(k) spectra wereobtained by subtracting the postedge background from theoverall absorption and then normalized with respect to theedge-jump step. For Ti spectroscopy, k2-weighted χ(k) data inthe k space ranging from 2 to 10 Å−1 were Fourier-transformed.For Hg spectroscopy, k3-weighted χ(k) data in the k spaceranging from 3 to 11 Å−1 were Fourier-transformed to radialstructure functions (RSFs) using a Hanning window (dk = 1)to separate the EXAFS contributions from different coordina-tion shells. The experimental data was fitted in R space viaARTEMIS (another module implemented in the IFEFFITsoftware packages). For fitting the experiment data, N was fixedat the crystallographically expected value, and other parameters(ΔE0, S02, Δr, σ2) were free to be refined.
■ RESULTS AND DISCUSSIONMorphology and Structure of TiO2 Nanosheets. TiO2
nanosheets were prepared using a modified hydrothermalmethod in which 98% concentrated H2SO4 solution wasemployed as a solvent,26 followed by heat treatment at differenttemperatures (25, 300, 600, and 800 °C, designated as T-1, T-2,T-3, and T-4, respectively). The structure was investigated viaHRTEM (Figures 1a and S1) and XRD (Figure 1d). T-1, T-2,
Analytical Chemistry Article
DOI: 10.1021/acs.analchem.6b04023Anal. Chem. 2017, 89, 3386−3394
3387
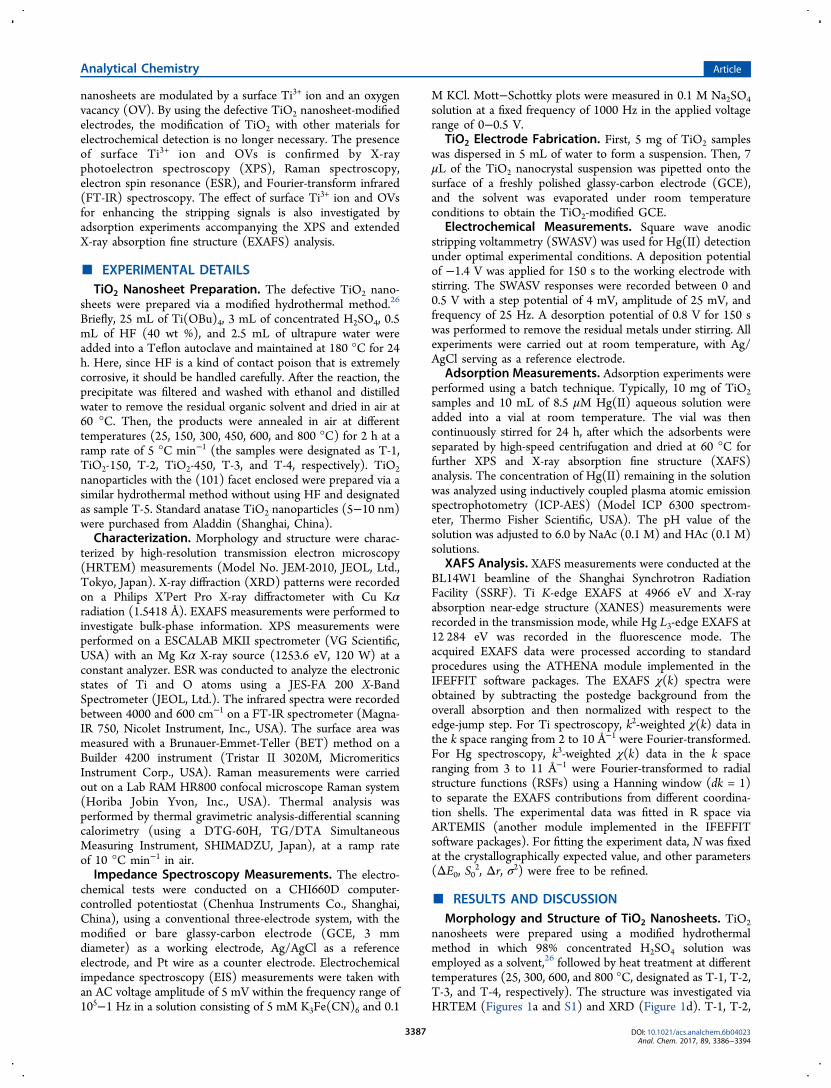
and T-3 exhibit a similar morphology. In contrast, heattreatment at 800 °C resulted in crystal transformation and amorphology change. Using a BET method, the surface area ofthe TiO2 nanosheets (T-1) was found to be approximately 58.9m2 g−1 (Figure S2).The (001) crystal facet with a lattice spacing of 0.232 nm can
be observed in the upper part of Figure 1b; in the lower part,the (101) crystal facet shows a lattice spacing of 0.353 nm,suggesting that the bottom/top surfaces are enclosed by the(001) facet. The percentage of (001) facet in the TiO2
nanosheets is estimated to be ∼68% based on the truncatedoctahedron structure.26 It is noted that the H2SO4 solutioncould induce rapid hydrolysis, resulting in abundant nativedefects in the TiO2 nanosheets.
27 A high concentration of H+ isexpected to release H2 to reduce Ti4+ to Ti3+ on the surface.28
F− has been widely used for TiO2 facet engineering because itcan stabilize the (001) facet energy which has been confirmedexperimentally and theoretically.29,30
Disordered lattice fringes induced by defects for T-1 and T-2are shown in Figure 1b. The (101) facet of T-4 shows a latticespacing of 0.353 nm. The fast Fourier transform patterns of T-1, T-2, T-3, and T-4 are shown in Figure S3. The defects inTiO2 nanosheets are confirmed by HRTEM images (Figure1c). For T-3 and T-4, the distances between adjacent latticefringes are consistent with the standard interplanar spacing,indicating a high crystallinity. In Figure 1d, the T-1, T-2, and T-3 peaks can be indexed to anatase TiO2 phase (JCPDS No. 21-1272), while T-4 annealed at 800 °C can be partially indexed torutile TiO2 (JCPDS No. 21-1276), suggesting that a rutilephase appears under heat treatment at 800 °C. This isconsistent with the results of thermal- and chemical-bondanalysis shown in Figures S4 and S5.
Electrochemical Performance of TiO2 Toward Hg(II).The SWASV method was employed for electrochemicaldetection of Hg(II). Optimized experimental conditions areshown in Figure S6. The effect on the differential electrodeactive areas is considered, and thus, the current density is
Figure 1. Morphology and structure of the TiO2 nanosheets thermally treated at different temperatures. (a) Overview TEM images. (b) HRTEMimages. Scale bar: 5 nm. The (001) and (101) facets are marked. (c) Compositional curves recorded along the yellow arrows shown in (b).Disordered lattice structures of T-1 and T-2 are highlighted by dashed lines. (d) XRD patterns.
Analytical Chemistry Article
DOI: 10.1021/acs.analchem.6b04023Anal. Chem. 2017, 89, 3386−3394
3388
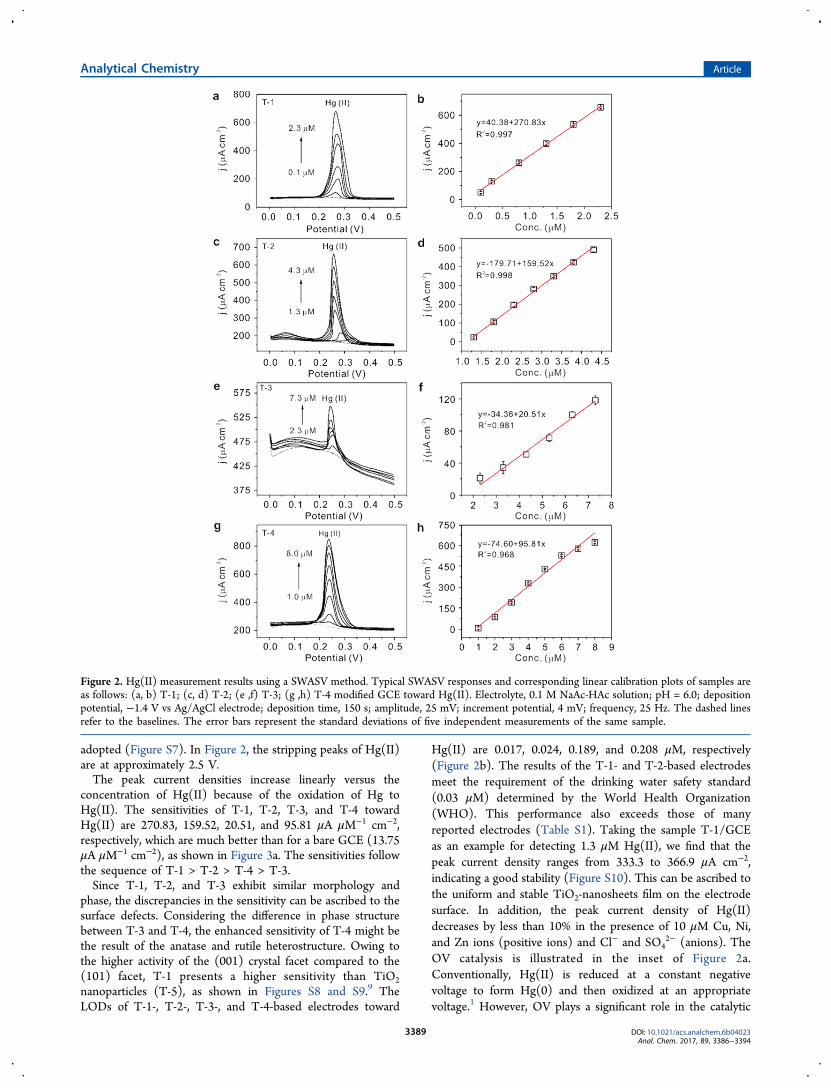
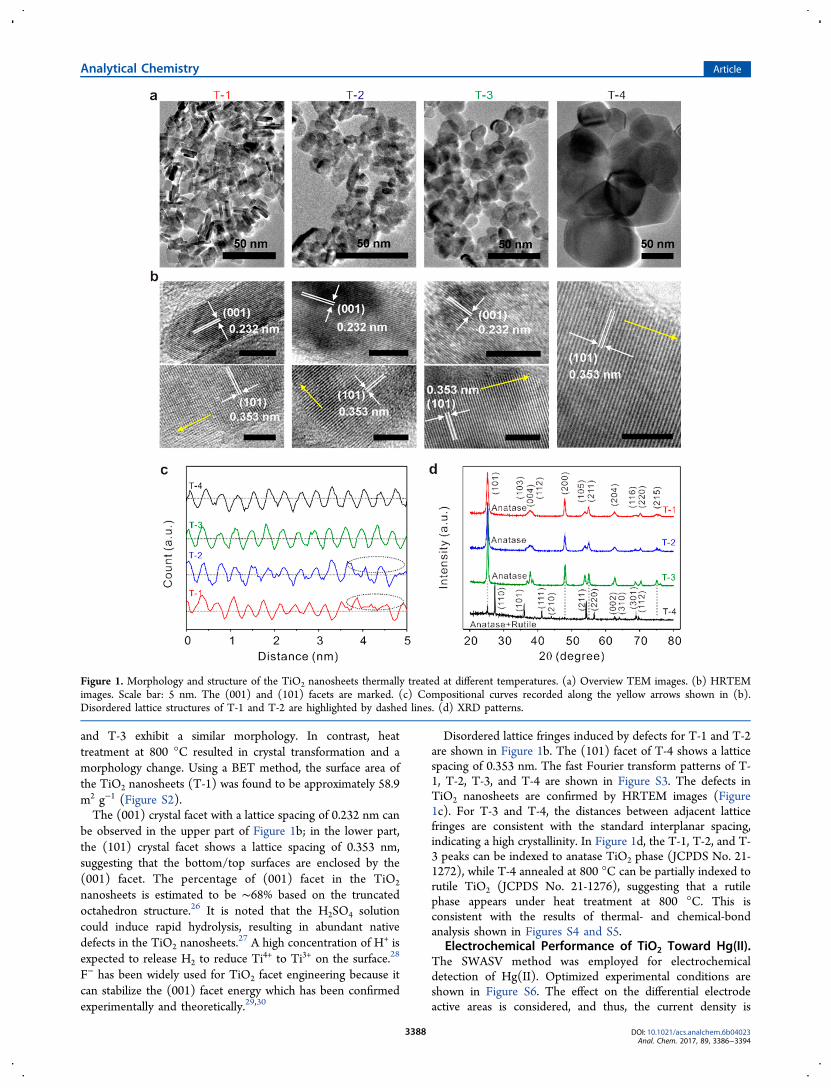
adopted (Figure S7). In Figure 2, the stripping peaks of Hg(II)are at approximately 2.5 V.The peak current densities increase linearly versus the
concentration of Hg(II) because of the oxidation of Hg toHg(II). The sensitivities of T-1, T-2, T-3, and T-4 towardHg(II) are 270.83, 159.52, 20.51, and 95.81 μA μM−1 cm−2,respectively, which are much better than for a bare GCE (13.75μA μM−1 cm−2), as shown in Figure 3a. The sensitivities followthe sequence of T-1 > T-2 > T-4 > T-3.Since T-1, T-2, and T-3 exhibit similar morphology and
phase, the discrepancies in the sensitivity can be ascribed to thesurface defects. Considering the difference in phase structurebetween T-3 and T-4, the enhanced sensitivity of T-4 might bethe result of the anatase and rutile heterostructure. Owing tothe higher activity of the (001) crystal facet compared to the(101) facet, T-1 presents a higher sensitivity than TiO2
nanoparticles (T-5), as shown in Figures S8 and S9.9 TheLODs of T-1-, T-2-, T-3-, and T-4-based electrodes toward
Hg(II) are 0.017, 0.024, 0.189, and 0.208 μM, respectively(Figure 2b). The results of the T-1- and T-2-based electrodesmeet the requirement of the drinking water safety standard(0.03 μM) determined by the World Health Organization(WHO). This performance also exceeds those of manyreported electrodes (Table S1). Taking the sample T-1/GCEas an example for detecting 1.3 μM Hg(II), we find that thepeak current density ranges from 333.3 to 366.9 μA cm−2,indicating a good stability (Figure S10). This can be ascribed tothe uniform and stable TiO2-nanosheets film on the electrodesurface. In addition, the peak current density of Hg(II)decreases by less than 10% in the presence of 10 μM Cu, Ni,and Zn ions (positive ions) and Cl− and SO4
2− (anions). TheOV catalysis is illustrated in the inset of Figure 2a.Conventionally, Hg(II) is reduced at a constant negativevoltage to form Hg(0) and then oxidized at an appropriatevoltage.1 However, OV plays a significant role in the catalytic
Figure 2. Hg(II) measurement results using a SWASV method. Typical SWASV responses and corresponding linear calibration plots of samples areas follows: (a, b) T-1; (c, d) T-2; (e ,f) T-3; (g ,h) T-4 modified GCE toward Hg(II). Electrolyte, 0.1 M NaAc-HAc solution; pH = 6.0; depositionpotential, −1.4 V vs Ag/AgCl electrode; deposition time, 150 s; amplitude, 25 mV; increment potential, 4 mV; frequency, 25 Hz. The dashed linesrefer to the baselines. The error bars represent the standard deviations of five independent measurements of the same sample.
Analytical Chemistry Article
DOI: 10.1021/acs.analchem.6b04023Anal. Chem. 2017, 89, 3386−3394
3389
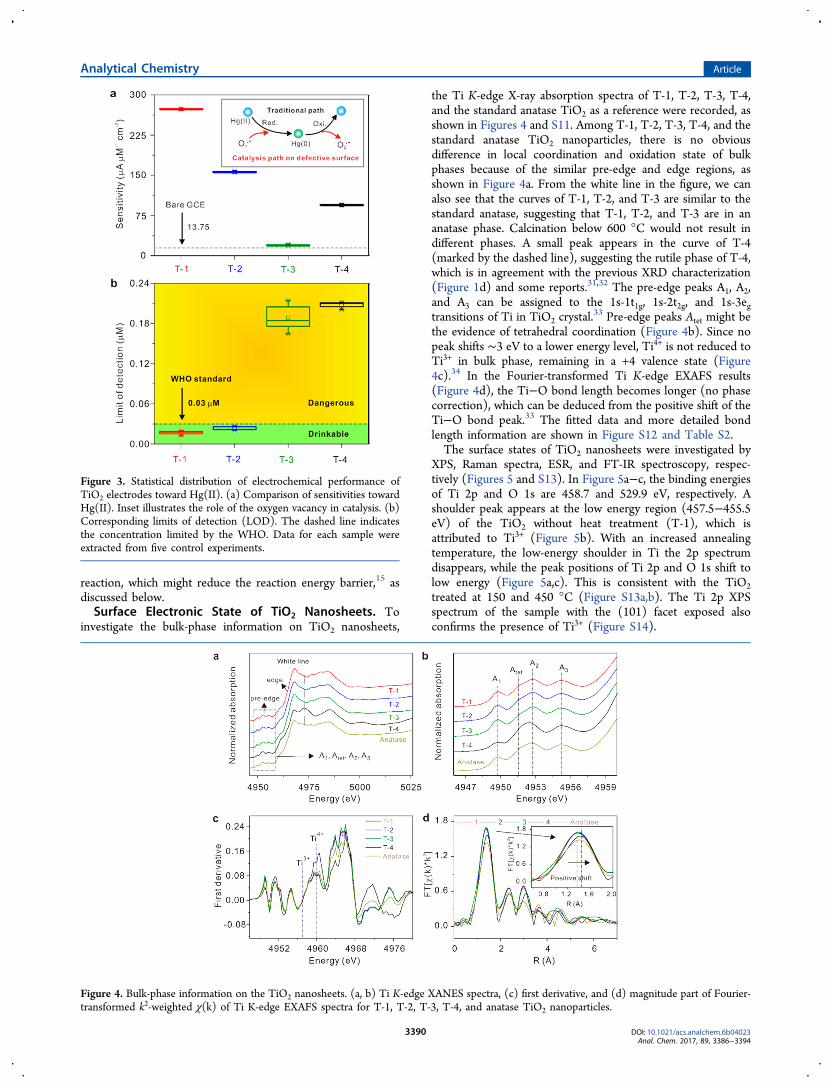
reaction, which might reduce the reaction energy barrier,15 asdiscussed below.Surface Electronic State of TiO2 Nanosheets. To
investigate the bulk-phase information on TiO2 nanosheets,
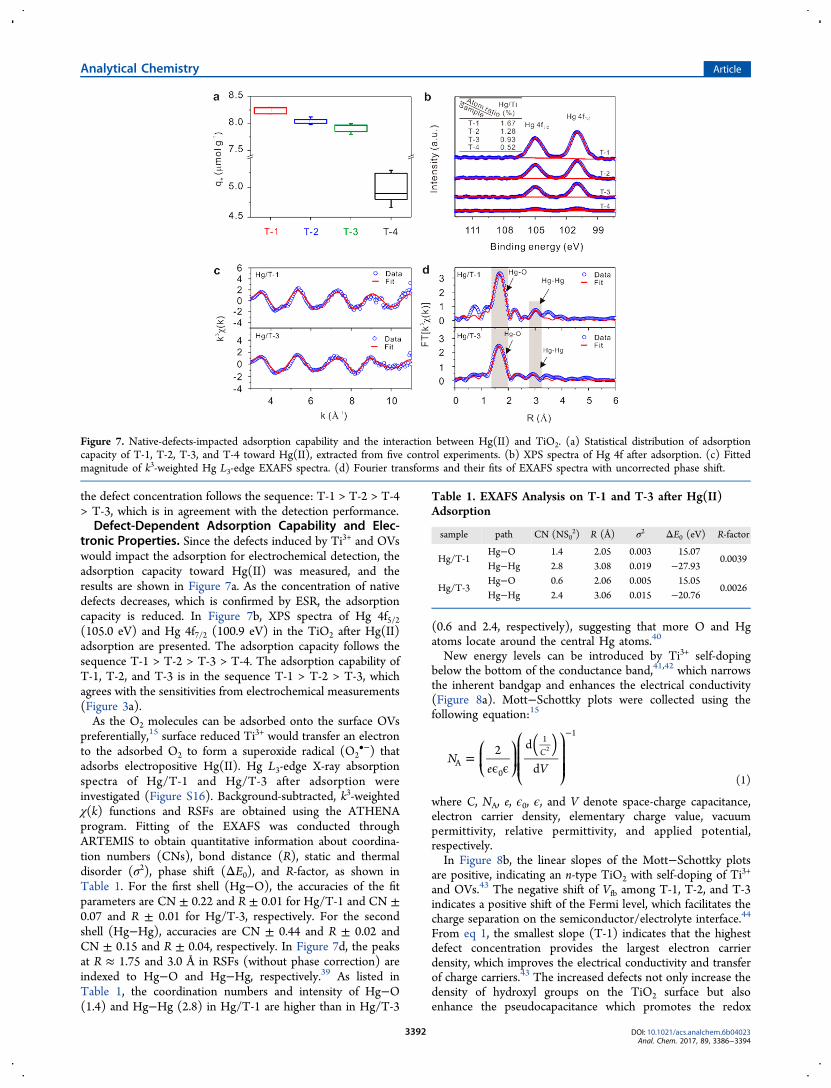
the Ti K-edge X-ray absorption spectra of T-1, T-2, T-3, T-4,and the standard anatase TiO2 as a reference were recorded, asshown in Figures 4 and S11. Among T-1, T-2, T-3, T-4, and thestandard anatase TiO2 nanoparticles, there is no obviousdifference in local coordination and oxidation state of bulkphases because of the similar pre-edge and edge regions, asshown in Figure 4a. From the white line in the figure, we canalso see that the curves of T-1, T-2, and T-3 are similar to thestandard anatase, suggesting that T-1, T-2, and T-3 are in ananatase phase. Calcination below 600 °C would not result indifferent phases. A small peak appears in the curve of T-4(marked by the dashed line), suggesting the rutile phase of T-4,which is in agreement with the previous XRD characterization(Figure 1d) and some reports.31,32 The pre-edge peaks A1, A2,and A3 can be assigned to the 1s-1t1g, 1s-2t2g, and 1s-3egtransitions of Ti in TiO2 crystal.
33 Pre-edge peaks Atet might bethe evidence of tetrahedral coordination (Figure 4b). Since nopeak shifts ∼3 eV to a lower energy level, Ti4+ is not reduced toTi3+ in bulk phase, remaining in a +4 valence state (Figure4c).34 In the Fourier-transformed Ti K-edge EXAFS results(Figure 4d), the Ti−O bond length becomes longer (no phasecorrection), which can be deduced from the positive shift of theTi−O bond peak.33 The fitted data and more detailed bondlength information are shown in Figure S12 and Table S2.The surface states of TiO2 nanosheets were investigated by
XPS, Raman spectra, ESR, and FT-IR spectroscopy, respec-tively (Figures 5 and S13). In Figure 5a−c, the binding energiesof Ti 2p and O 1s are 458.7 and 529.9 eV, respectively. Ashoulder peak appears at the low energy region (457.5−455.5eV) of the TiO2 without heat treatment (T-1), which isattributed to Ti3+ (Figure 5b). With an increased annealingtemperature, the low-energy shoulder in Ti the 2p spectrumdisappears, while the peak positions of Ti 2p and O 1s shift tolow energy (Figure 5a,c). This is consistent with the TiO2treated at 150 and 450 °C (Figure S13a,b). The Ti 2p XPSspectrum of the sample with the (101) facet exposed alsoconfirms the presence of Ti3+ (Figure S14).
Figure 3. Statistical distribution of electrochemical performance ofTiO2 electrodes toward Hg(II). (a) Comparison of sensitivities towardHg(II). Inset illustrates the role of the oxygen vacancy in catalysis. (b)Corresponding limits of detection (LOD). The dashed line indicatesthe concentration limited by the WHO. Data for each sample wereextracted from five control experiments.
Figure 4. Bulk-phase information on the TiO2 nanosheets. (a, b) Ti K-edge XANES spectra, (c) first derivative, and (d) magnitude part of Fourier-transformed k2-weighted χ(k) of Ti K-edge EXAFS spectra for T-1, T-2, T-3, T-4, and anatase TiO2 nanoparticles.
Analytical Chemistry Article
DOI: 10.1021/acs.analchem.6b04023Anal. Chem. 2017, 89, 3386−3394
3390

Raman spectra confirm the Ti3+ in TiO2 nanosheets in termsof the positive peak shift (Figure 5d).28 A crystal transformationis shown in a wide Raman spectrum (Figure S13c). In ESRspectra (Figure 5e), the signal at g = 2.003 is indexed to anOV.35 The signals of Ti3+ (g = 1.990 and 1.982)36 disappear asthe annealing temperature rises to 300 °C (T-2). However,ESR signals appear at g < 2.0 (T-4), which perhaps can possiblybe attributed to the crystal transformation. In Figure 5f, the FT-IR spectra show distinct −OH stretching vibrations at 3430 and1632 cm−1 and flexural vibrations at 1400 cm−1, indicating thepresence of OVs and reductive Ti3+.15 Similar findings areconfirmed by TiO2 treated at 150 and 450 °C (Figure S13d).Optical photographs are shown in Figure S15.In order to establish a quantitative relationship among
processing conditions, quantity of defects, and electrochemicaldetection performance, the defect concentration was quantifiedby numerical double integration of the ESR spectra, which hasbeen commonly used in some previous reports.37,38 Withincreased annealing temperature, the activated O2 moleculewould oxidize Ti3+ to Ti4+ and fill the OV, resulting in adecreased OV concentration, as shown in Figure 6. Bycomparing the double integration of the OV ESR signalamong T-1, T-2, and T-3, defect concentration follows thesequence: T-1 > T-2 > T-3, which is in accordance with theelectrochemical sensing performance. Because there is nodifference in the morphology and local coordination and
oxidation state in bulk for these three samples, it is reasonableto ascribe the electrochemical sensing performance to thecatalysis of surface OV concentration. When comparing doubleintegrations of all the defect ESR signals among four samples,
Figure 5. Surface-electronic-state characterizations. (a−c) XPS, (d) Raman spectra, (e) ESR, and (f) FT-IR spectra of the TiO2 nanosheets.
Figure 6. (a) Comparative plots of detection performance and (b)normalized double integration of the ESR signal of four samples.
Analytical Chemistry Article
DOI: 10.1021/acs.analchem.6b04023Anal. Chem. 2017, 89, 3386−3394
3391
the defect concentration follows the sequence: T-1 > T-2 > T-4> T-3, which is in agreement with the detection performance.Defect-Dependent Adsorption Capability and Elec-
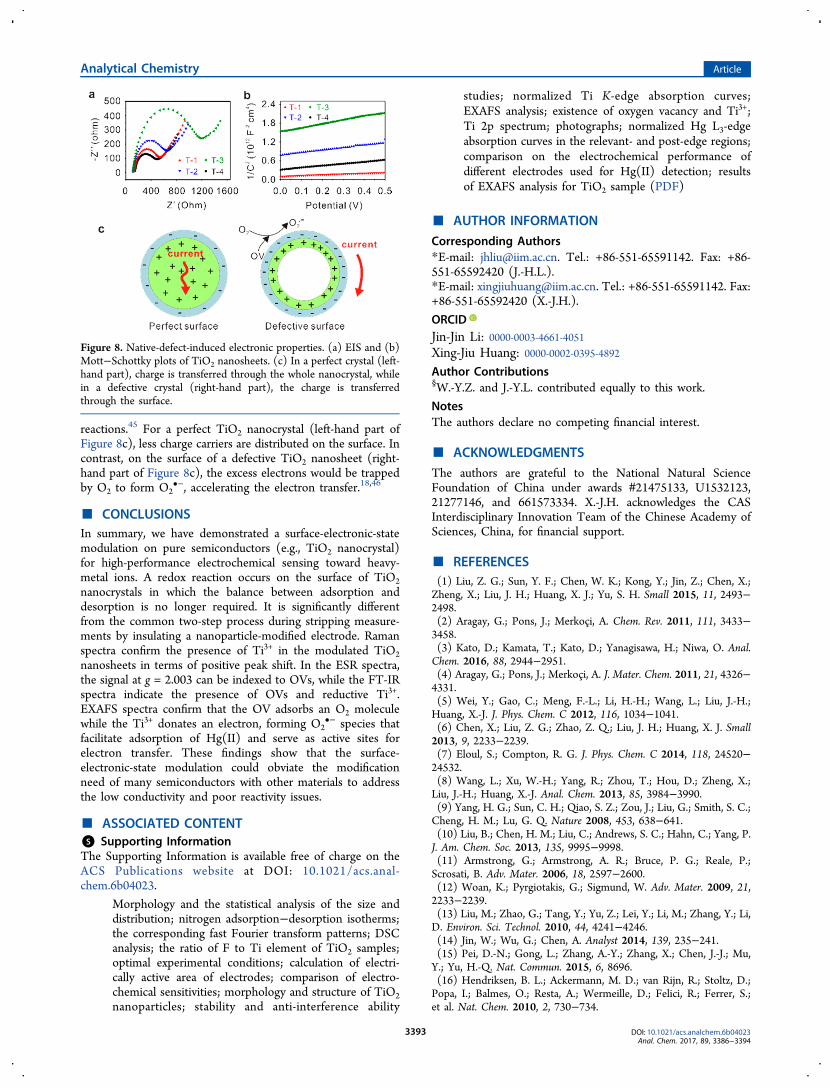
tronic Properties. Since the defects induced by Ti3+ and OVswould impact the adsorption for electrochemical detection, theadsorption capacity toward Hg(II) was measured, and theresults are shown in Figure 7a. As the concentration of nativedefects decreases, which is confirmed by ESR, the adsorptioncapacity is reduced. In Figure 7b, XPS spectra of Hg 4f5/2(105.0 eV) and Hg 4f7/2 (100.9 eV) in the TiO2 after Hg(II)adsorption are presented. The adsorption capacity follows thesequence T-1 > T-2 > T-3 > T-4. The adsorption capability ofT-1, T-2, and T-3 is in the sequence T-1 > T-2 > T-3, whichagrees with the sensitivities from electrochemical measurements(Figure 3a).As the O2 molecules can be adsorbed onto the surface OVs
preferentially,15 surface reduced Ti3+ would transfer an electronto the adsorbed O2 to form a superoxide radical (O2
•−) thatadsorbs electropositive Hg(II). Hg L3-edge X-ray absorptionspectra of Hg/T-1 and Hg/T-3 after adsorption wereinvestigated (Figure S16). Background-subtracted, k3-weightedχ(k) functions and RSFs are obtained using the ATHENAprogram. Fitting of the EXAFS was conducted throughARTEMIS to obtain quantitative information about coordina-tion numbers (CNs), bond distance (R), static and thermaldisorder (σ2), phase shift (ΔE0), and R-factor, as shown inTable 1. For the first shell (Hg−O), the accuracies of the fitparameters are CN ± 0.22 and R ± 0.01 for Hg/T-1 and CN ±0.07 and R ± 0.01 for Hg/T-3, respectively. For the secondshell (Hg−Hg), accuracies are CN ± 0.44 and R ± 0.02 andCN ± 0.15 and R ± 0.04, respectively. In Figure 7d, the peaksat R ≈ 1.75 and 3.0 Å in RSFs (without phase correction) areindexed to Hg−O and Hg−Hg, respectively.39 As listed inTable 1, the coordination numbers and intensity of Hg−O(1.4) and Hg−Hg (2.8) in Hg/T-1 are higher than in Hg/T-3
(0.6 and 2.4, respectively), suggesting that more O and Hgatoms locate around the central Hg atoms.40
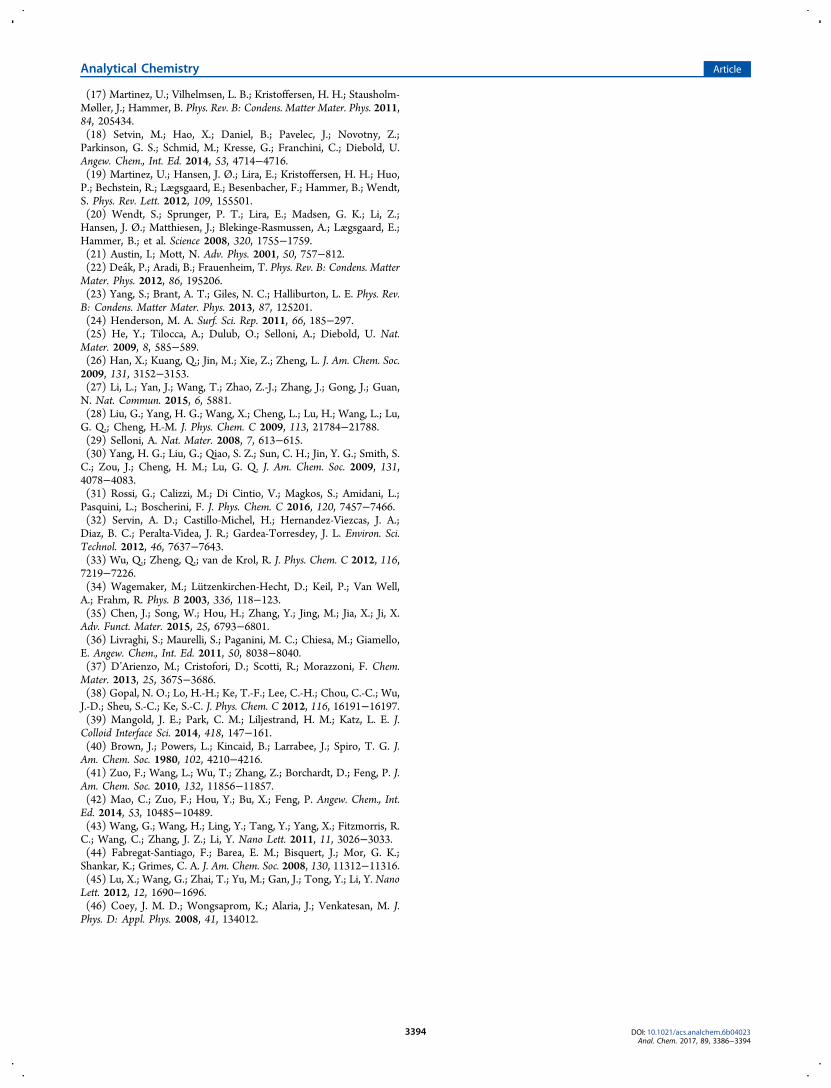
New energy levels can be introduced by Ti3+ self-dopingbelow the bottom of the conductance band,41,42 which narrowsthe inherent bandgap and enhances the electrical conductivity(Figure 8a). Mott−Schottky plots were collected using thefollowing equation:15
=ϵ ϵ
−⎛⎝⎜
⎞⎠⎟⎛
⎝⎜⎜⎜
⎞
⎠⎟⎟⎟
( )N
e V2 d
dC
A0
11
2
(1)
where C, NA, e, ϵ0, ϵ, and V denote space-charge capacitance,electron carrier density, elementary charge value, vacuumpermittivity, relative permittivity, and applied potential,respectively.In Figure 8b, the linear slopes of the Mott−Schottky plots
are positive, indicating an n-type TiO2 with self-doping of Ti3+
and OVs.43 The negative shift of Vfb among T-1, T-2, and T-3indicates a positive shift of the Fermi level, which facilitates thecharge separation on the semiconductor/electrolyte interface.44
From eq 1, the smallest slope (T-1) indicates that the highestdefect concentration provides the largest electron carrierdensity, which improves the electrical conductivity and transferof charge carriers.43 The increased defects not only increase thedensity of hydroxyl groups on the TiO2 surface but alsoenhance the pseudocapacitance which promotes the redox
Figure 7. Native-defects-impacted adsorption capability and the interaction between Hg(II) and TiO2. (a) Statistical distribution of adsorptioncapacity of T-1, T-2, T-3, and T-4 toward Hg(II), extracted from five control experiments. (b) XPS spectra of Hg 4f after adsorption. (c) Fittedmagnitude of k3-weighted Hg L3-edge EXAFS spectra. (d) Fourier transforms and their fits of EXAFS spectra with uncorrected phase shift.
Table 1. EXAFS Analysis on T-1 and T-3 after Hg(II)Adsorption
sample path CN (NS02) R (Å) σ2 ΔE0 (eV) R-factor
Hg/T-1Hg−O 1.4 2.05 0.003 15.07
0.0039Hg−Hg 2.8 3.08 0.019 −27.93
Hg/T-3Hg−O 0.6 2.06 0.005 15.05
0.0026Hg−Hg 2.4 3.06 0.015 −20.76
Analytical Chemistry Article
DOI: 10.1021/acs.analchem.6b04023Anal. Chem. 2017, 89, 3386−3394
3392
reactions.45 For a perfect TiO2 nanocrystal (left-hand part ofFigure 8c), less charge carriers are distributed on the surface. Incontrast, on the surface of a defective TiO2 nanosheet (right-hand part of Figure 8c), the excess electrons would be trappedby O2 to form O2
•−, accelerating the electron transfer.18,46
■ CONCLUSIONSIn summary, we have demonstrated a surface-electronic-statemodulation on pure semiconductors (e.g., TiO2 nanocrystal)for high-performance electrochemical sensing toward heavy-metal ions. A redox reaction occurs on the surface of TiO2nanocrystals in which the balance between adsorption anddesorption is no longer required. It is significantly differentfrom the common two-step process during stripping measure-ments by insulating a nanoparticle-modified electrode. Ramanspectra confirm the presence of Ti3+ in the modulated TiO2nanosheets in terms of positive peak shift. In the ESR spectra,the signal at g = 2.003 can be indexed to OVs, while the FT-IRspectra indicate the presence of OVs and reductive Ti3+.EXAFS spectra confirm that the OV adsorbs an O2 moleculewhile the Ti3+ donates an electron, forming O2
•− species thatfacilitate adsorption of Hg(II) and serve as active sites forelectron transfer. These findings show that the surface-electronic-state modulation could obviate the modificationneed of many semiconductors with other materials to addressthe low conductivity and poor reactivity issues.
■ ASSOCIATED CONTENT*S Supporting InformationThe Supporting Information is available free of charge on theACS Publications website at DOI: 10.1021/acs.anal-chem.6b04023.
Morphology and the statistical analysis of the size anddistribution; nitrogen adsorption−desorption isotherms;the corresponding fast Fourier transform patterns; DSCanalysis; the ratio of F to Ti element of TiO2 samples;optimal experimental conditions; calculation of electri-cally active area of electrodes; comparison of electro-chemical sensitivities; morphology and structure of TiO2nanoparticles; stability and anti-interference ability
studies; normalized Ti K-edge absorption curves;EXAFS analysis; existence of oxygen vacancy and Ti3+;Ti 2p spectrum; photographs; normalized Hg L3-edgeabsorption curves in the relevant- and post-edge regions;comparison on the electrochemical performance ofdifferent electrodes used for Hg(II) detection; resultsof EXAFS analysis for TiO2 sample (PDF)
■ AUTHOR INFORMATION
Corresponding Authors*E-mail: [email protected]. Tel.: +86-551-65591142. Fax: +86-551-65592420 (J.-H.L.).*E-mail: [email protected]. Tel.: +86-551-65591142. Fax:+86-551-65592420 (X.-J.H.).
ORCIDJin-Jin Li: 0000-0003-4661-4051Xing-Jiu Huang: 0000-0002-0395-4892Author Contributions§W.-Y.Z. and J.-Y.L. contributed equally to this work.
NotesThe authors declare no competing financial interest.
■ ACKNOWLEDGMENTS
The authors are grateful to the National Natural ScienceFoundation of China under awards #21475133, U1532123,21277146, and 661573334. X.-J.H. acknowledges the CASInterdisciplinary Innovation Team of the Chinese Academy ofSciences, China, for financial support.
■ REFERENCES(1) Liu, Z. G.; Sun, Y. F.; Chen, W. K.; Kong, Y.; Jin, Z.; Chen, X.;Zheng, X.; Liu, J. H.; Huang, X. J.; Yu, S. H. Small 2015, 11, 2493−2498.(2) Aragay, G.; Pons, J.; Merkoci, A. Chem. Rev. 2011, 111, 3433−3458.(3) Kato, D.; Kamata, T.; Kato, D.; Yanagisawa, H.; Niwa, O. Anal.Chem. 2016, 88, 2944−2951.(4) Aragay, G.; Pons, J.; Merkoci, A. J. Mater. Chem. 2011, 21, 4326−4331.(5) Wei, Y.; Gao, C.; Meng, F.-L.; Li, H.-H.; Wang, L.; Liu, J.-H.;Huang, X.-J. J. Phys. Chem. C 2012, 116, 1034−1041.(6) Chen, X.; Liu, Z. G.; Zhao, Z. Q.; Liu, J. H.; Huang, X. J. Small2013, 9, 2233−2239.(7) Eloul, S.; Compton, R. G. J. Phys. Chem. C 2014, 118, 24520−24532.(8) Wang, L.; Xu, W.-H.; Yang, R.; Zhou, T.; Hou, D.; Zheng, X.;Liu, J.-H.; Huang, X.-J. Anal. Chem. 2013, 85, 3984−3990.(9) Yang, H. G.; Sun, C. H.; Qiao, S. Z.; Zou, J.; Liu, G.; Smith, S. C.;Cheng, H. M.; Lu, G. Q. Nature 2008, 453, 638−641.(10) Liu, B.; Chen, H. M.; Liu, C.; Andrews, S. C.; Hahn, C.; Yang, P.J. Am. Chem. Soc. 2013, 135, 9995−9998.(11) Armstrong, G.; Armstrong, A. R.; Bruce, P. G.; Reale, P.;Scrosati, B. Adv. Mater. 2006, 18, 2597−2600.(12) Woan, K.; Pyrgiotakis, G.; Sigmund, W. Adv. Mater. 2009, 21,2233−2239.(13) Liu, M.; Zhao, G.; Tang, Y.; Yu, Z.; Lei, Y.; Li, M.; Zhang, Y.; Li,D. Environ. Sci. Technol. 2010, 44, 4241−4246.(14) Jin, W.; Wu, G.; Chen, A. Analyst 2014, 139, 235−241.(15) Pei, D.-N.; Gong, L.; Zhang, A.-Y.; Zhang, X.; Chen, J.-J.; Mu,Y.; Yu, H.-Q. Nat. Commun. 2015, 6, 8696.(16) Hendriksen, B. L.; Ackermann, M. D.; van Rijn, R.; Stoltz, D.;Popa, I.; Balmes, O.; Resta, A.; Wermeille, D.; Felici, R.; Ferrer, S.;et al. Nat. Chem. 2010, 2, 730−734.
Figure 8. Native-defect-induced electronic properties. (a) EIS and (b)Mott−Schottky plots of TiO2 nanosheets. (c) In a perfect crystal (left-hand part), charge is transferred through the whole nanocrystal, whilein a defective crystal (right-hand part), the charge is transferredthrough the surface.
Analytical Chemistry Article
DOI: 10.1021/acs.analchem.6b04023Anal. Chem. 2017, 89, 3386−3394
3393
(17) Martinez, U.; Vilhelmsen, L. B.; Kristoffersen, H. H.; Stausholm-Møller, J.; Hammer, B. Phys. Rev. B: Condens. Matter Mater. Phys. 2011,84, 205434.(18) Setvin, M.; Hao, X.; Daniel, B.; Pavelec, J.; Novotny, Z.;Parkinson, G. S.; Schmid, M.; Kresse, G.; Franchini, C.; Diebold, U.Angew. Chem., Int. Ed. 2014, 53, 4714−4716.(19) Martinez, U.; Hansen, J. Ø.; Lira, E.; Kristoffersen, H. H.; Huo,P.; Bechstein, R.; Lægsgaard, E.; Besenbacher, F.; Hammer, B.; Wendt,S. Phys. Rev. Lett. 2012, 109, 155501.(20) Wendt, S.; Sprunger, P. T.; Lira, E.; Madsen, G. K.; Li, Z.;Hansen, J. Ø.; Matthiesen, J.; Blekinge-Rasmussen, A.; Lægsgaard, E.;Hammer, B.; et al. Science 2008, 320, 1755−1759.(21) Austin, I.; Mott, N. Adv. Phys. 2001, 50, 757−812.(22) Deak, P.; Aradi, B.; Frauenheim, T. Phys. Rev. B: Condens. MatterMater. Phys. 2012, 86, 195206.(23) Yang, S.; Brant, A. T.; Giles, N. C.; Halliburton, L. E. Phys. Rev.B: Condens. Matter Mater. Phys. 2013, 87, 125201.(24) Henderson, M. A. Surf. Sci. Rep. 2011, 66, 185−297.(25) He, Y.; Tilocca, A.; Dulub, O.; Selloni, A.; Diebold, U. Nat.Mater. 2009, 8, 585−589.(26) Han, X.; Kuang, Q.; Jin, M.; Xie, Z.; Zheng, L. J. Am. Chem. Soc.2009, 131, 3152−3153.(27) Li, L.; Yan, J.; Wang, T.; Zhao, Z.-J.; Zhang, J.; Gong, J.; Guan,N. Nat. Commun. 2015, 6, 5881.(28) Liu, G.; Yang, H. G.; Wang, X.; Cheng, L.; Lu, H.; Wang, L.; Lu,G. Q.; Cheng, H.-M. J. Phys. Chem. C 2009, 113, 21784−21788.(29) Selloni, A. Nat. Mater. 2008, 7, 613−615.(30) Yang, H. G.; Liu, G.; Qiao, S. Z.; Sun, C. H.; Jin, Y. G.; Smith, S.C.; Zou, J.; Cheng, H. M.; Lu, G. Q. J. Am. Chem. Soc. 2009, 131,4078−4083.(31) Rossi, G.; Calizzi, M.; Di Cintio, V.; Magkos, S.; Amidani, L.;Pasquini, L.; Boscherini, F. J. Phys. Chem. C 2016, 120, 7457−7466.(32) Servin, A. D.; Castillo-Michel, H.; Hernandez-Viezcas, J. A.;Diaz, B. C.; Peralta-Videa, J. R.; Gardea-Torresdey, J. L. Environ. Sci.Technol. 2012, 46, 7637−7643.(33) Wu, Q.; Zheng, Q.; van de Krol, R. J. Phys. Chem. C 2012, 116,7219−7226.(34) Wagemaker, M.; Lutzenkirchen-Hecht, D.; Keil, P.; Van Well,A.; Frahm, R. Phys. B 2003, 336, 118−123.(35) Chen, J.; Song, W.; Hou, H.; Zhang, Y.; Jing, M.; Jia, X.; Ji, X.Adv. Funct. Mater. 2015, 25, 6793−6801.(36) Livraghi, S.; Maurelli, S.; Paganini, M. C.; Chiesa, M.; Giamello,E. Angew. Chem., Int. Ed. 2011, 50, 8038−8040.(37) D’Arienzo, M.; Cristofori, D.; Scotti, R.; Morazzoni, F. Chem.Mater. 2013, 25, 3675−3686.(38) Gopal, N. O.; Lo, H.-H.; Ke, T.-F.; Lee, C.-H.; Chou, C.-C.; Wu,J.-D.; Sheu, S.-C.; Ke, S.-C. J. Phys. Chem. C 2012, 116, 16191−16197.(39) Mangold, J. E.; Park, C. M.; Liljestrand, H. M.; Katz, L. E. J.Colloid Interface Sci. 2014, 418, 147−161.(40) Brown, J.; Powers, L.; Kincaid, B.; Larrabee, J.; Spiro, T. G. J.Am. Chem. Soc. 1980, 102, 4210−4216.(41) Zuo, F.; Wang, L.; Wu, T.; Zhang, Z.; Borchardt, D.; Feng, P. J.Am. Chem. Soc. 2010, 132, 11856−11857.(42) Mao, C.; Zuo, F.; Hou, Y.; Bu, X.; Feng, P. Angew. Chem., Int.Ed. 2014, 53, 10485−10489.(43) Wang, G.; Wang, H.; Ling, Y.; Tang, Y.; Yang, X.; Fitzmorris, R.C.; Wang, C.; Zhang, J. Z.; Li, Y. Nano Lett. 2011, 11, 3026−3033.(44) Fabregat-Santiago, F.; Barea, E. M.; Bisquert, J.; Mor, G. K.;Shankar, K.; Grimes, C. A. J. Am. Chem. Soc. 2008, 130, 11312−11316.(45) Lu, X.; Wang, G.; Zhai, T.; Yu, M.; Gan, J.; Tong, Y.; Li, Y. NanoLett. 2012, 12, 1690−1696.(46) Coey, J. M. D.; Wongsaprom, K.; Alaria, J.; Venkatesan, M. J.Phys. D: Appl. Phys. 2008, 41, 134012.
Analytical Chemistry Article
DOI: 10.1021/acs.analchem.6b04023Anal. Chem. 2017, 89, 3386−3394
3394