surface quality optimization in turning … int. j. mech. eng. & rob. res. 2014 govindan p and...
TRANSCRIPT

89
Int. J. Mech. Eng. & Rob. Res. 2014 Govindan P and Vipindas M P, 2014
SURFACE QUALITY OPTIMIZATION IN TURNINGOPERATIONS USING TAGUCHI METHOD—A
REVIEW
Govindan P1* and Vipindas M P1
*Corresponding Author: Govindan P,[email protected]
Machining operations have been the core of the manufacturing industry since the industrialrevolution. The productivity and quality are two important characteristics those control most ofthe manufacturing processes. Surface roughness imposes one of the most significant constraintsfor the selection of cutting parameters and machine tools in development of a process. Theoptimized parameters of machining are important especially to maximize production rate and toreduce cost. In actual practice, all the factors which affect the surface roughness are classifiedinto tool variables, work piece variables and cutting conditions. To this end, a great deal ofresearch has been performed in order to quantify the effect of various turning process parametersto surface quality. In this paper, an attempt is made to review the optimization of surface roughnessin turning operations using Taguchi method, which is being applied successfully in industrialapplications for optimal selection of process variables in the area of machining.
Keywords: Optimization, Surface roughness, Turning, Significant constraints, Surface quality
INTRODUCTIONTurning is a versatile and useful machiningoperation. It is the most important operationand is widely used in most of the manufacturingindustries due to its capability of producingcomplex geometric surfaces with reasonableaccuracy and surface finish. In modern industryone of the trends is to manufacture low cost,high quality products in short time. Increasingproductivity, decreasing costs, and maintaining
ISSN 2278 – 0149 www.ijmerr.comVol. 3, No. 1, January 2014
© 2014 IJMERR. All Rights Reserved
Int. J. Mech. Eng. & Rob. Res. 2014
1 Government College of Engineering Kannur, Kerala, India.
high product quality at the same time are themain challenges manufacturing face today(Azouzi and Guillot, 1998). Surface roughnessimposes one of the most significant constraintsfor the selection of cutting parameters andmachine tools in development of a process(Abhang and Hameedullah, 2010). It requiresattention both from industry personnel as wellas in research and development, because thisgreatly influences machining performances. In
Review Article

90
Int. J. Mech. Eng. & Rob. Res. 2014 Govindan P and Vipindas M P, 2014
a manufacturing process it is very importantto achieve a consistence tolerance andsurface finish (Choudhury and El-Baradie,1997). Cutting parameters are reflected onsurface roughness, surface texture anddimensional deviation turned product. So,there is a need for a tool that should allow theevaluation of the surface roughness valuebefore the machining of the part and which, atthe same time, can easily be used in theproduction floor environment contributing to theminimization of required time and cost and theproduction of desired surface quality.
Process optimization is the discipline ofadjusting a process to optimize somespecified set of parameters without violatingsome constraint. The most common goals areminimizing cost, maximizing throughout, and/or efficiency. This is one of the majorquantitative tools in industrial decision making.Manufacturing industries have long dependedon the skill and experience of shop floormachine tool operators for optimal selectionof cutting conditions and cutting tools. The mostadverse effect of such a not very scientificpractice is decreased productivity due to suboptimal use of machining capability.Optimization of machining parameters not onlyincreases the utility for machining economics,but also the product quality to a great extent. Inconventional (manual) manufacturing systems,the machined components take only about 6%to 10% of the total available production timeon machines being used. By contrast, it hasbeen estimated that the percentage wouldincrease to 65%-80% in modern computerbased manufacturing because of the adventof computer based and automated machiningsystems. This situation makes the need for
economic optimization and reliableperformance data of machining processeseven more pressing than ever before. Thesurface roughness greatly varies with thechange of cutting process parameters.Surface finish in turning has been found to beinfluenced in varying amounts by a number offactors such as feed rate, work materialcharacteristics, work hardness, unstable built-up edge, cutting speed, depth of cut, cuttingtime, tool nose radius and tool cutting edgeangles, stability of machine tool and workpiece setup, chatter, and use of cutting fluids(Palanikumar et al., 2006). That is why properselection of process parameters is essentialalong with the prediction of the surface finish(lower Ra value) in turning process.
Modeling of machining processes hasattracted the attention of a number ofresearchers in view of its signif icantcontribution to the overall cost of the product(Merchant, 1998). Measuring surfaceroughness is vital to quality control ofmachining work piece. There are problemsin attempt to get high quality surface finish ofproducts. For this reason many authorsconsider the roughness as the fourthdimension of the design (Van Luhervelt et al.,1998). The optimized parameters ofmachining are important especially tomaximize production rate and to reduce cost.Optimized parameters are of great concernin manufacturing environments, whereeconomics of machining operation plays akey role in competitiveness of market, seeFigure 1.
It is found that many research works havebeen done so far on continuous improvementof the performance of turning process. Despite

91
Int. J. Mech. Eng. & Rob. Res. 2014 Govindan P and Vipindas M P, 2014
Taylor’s early work on establishing optimumcutting speeds in single pass turnings,progress has been slow since all the processparameters need to be optimized. For realisticsolutions, the many constraints met in practice,such as low machine tool power, torque, forcelimits and component surface roughness mustbe overcome. The performance of turning ismeasured in terms of surface finish, cuttingforces, power consumed and tool wear. Fromthe era of conventional machine tools to thepresent era of CNC machine tools, theprediction of cutting behavior of processes andoptimization of machining parameters havebeen hot areas of research. Due to thewidespread use of high automated machinetools in industry, manufacturing requiresreliable monitoring and optimization. Today themarket has an ever changing demand for newproducts, which require shorter developmentcycle. An important part of the productdevelopment cycle is manufacturing processplanning. Shorter process planning time can
lead to the use of machining parameters thatare not optimal and this can lead to the greatercost of production. A human process plannerselects proper machining parameters by usingnot only his own experience and knowledgebut also from handbooks of technologicalrequirements, machine tool, cutting tool andselected part material. This manual selectioncan be slow and does not have to give optimalresults. Figure 1 depicts the possibleoptimization goals.
The latest techniques for optimization, FuzzyLogic, Scatter Search technique, Ant Colonytechnique, Genetic Algorithm, Taguchitechnique, Response Surface Methodologyetc. are being applied successfully in industrialapplications for optimal selection of processvariables in the area of machining (Shirpurkaret al., 2012). Among these Taguchi Method(Taguchi, 1986) is widely using in industriesfor making product/process insensitive to anyuncontrollable factors such as environmentalvariables. Through this paper, an attempt ismade to review the Taguchi method foroptimization of surface roughness in turningoperations.
TURNING PROCESSTurning is the primary process in most of theproduction activities in the industry. In turningprocess, a single point cutting tool movesalong the axis of a rotating work piece. Turningis used to reduce the diameter of the workpiece, usually to a specified dimension, andto produce a smooth finish on the metal.Turning produces rotational, typically axissymmetric parts that have many features, suchas holes, grooves, threads, tapers, variousdiameter steps, and even contoured surfaces.
Figure 1: Possible Optimization Goals

92
Int. J. Mech. Eng. & Rob. Res. 2014 Govindan P and Vipindas M P, 2014
It can be done manually, in a traditional form oflathe, which frequently requires continuoussupervision by the operator, or by using acomputer controlled and automated lathe whichdoes not.
Parts that are fabricated completely throughturning often include components that are usedin limited quantities, perhaps for prototypes,such as custom designed shafts and fastener.Turning is also commonly used as a secondaryprocess to add or refine features on parts thatwere manufactured using a different process.Due to the high tolerances and surface finishesthat turning can offer, it is ideal for addingprecision rotational features to a part whosebasic shape has already been formed. Theperipheral speed of the work piece calledcutting speed, movement of the tool along theaxis of job for one revolution of job called feed,and radial depth of cut of the tool are theprocess parameters which are shown in Figure2. These parameters may be optimized forobtaining the minimum cost of machining andminimum production time. However, foroptimization, performance of the process hasto be predicted.
Two main attributes of quality of turned jobare surface finish and dimensional deviation.Surface finish is defined as the degree ofsmoothness of a part’s surface after it has beenmanufactured. Surface finish is the result of thesurface roughness, waviness, and flawsremaining on the part. Dimensional deviationis defined as the radial difference between theset depth of cut and the obtained depth of cut.Optimization of cutting parameters is a difficultwork (Cus and Balic, 2000), where the followingaspects are required knowledge of machining,empirical equations relating the tool life, forces,power, surface finish, etc., to develop realisticconstraints, specification of machine toolcapabilities, development of an effectiveoptimization criterion and knowledge ofmathematical and numerical optimizationtechniques. Researchers studied the effect ofnumber of factors such as feed rate, cuttingspeed, depth of cut, work materialcharacterestics, unstable built up edge, toolnose radius, tool angles, stability of material,tool and work piece setup, use of cutting fluids,radial vibration, tool material, etc., on surfacefinish. The three primary factors in any basicturning operation are speed, feed, and depthof cut. Other factors such as kind of materialand type of tool have a large influence, of course,but these three are the ones the operator canchange by adjusting the controls, right at themachine. In order to conduct optimization, amathematical model has to be defined. It isfound that many research works have beendone so far on continuous improvement of theperformance of turning process.
SURFACE ROUGHNESSDimensional accuracy, form stability, surfacesmoothness, fulf illment of functional
Figure 2: Adjustable Parametersin Turning
Source: Choudhury and El-Baradie (1997)

93
Int. J. Mech. Eng. & Rob. Res. 2014 Govindan P and Vipindas M P, 2014
requirements in prescribed area ofapplication, etc., are important qualityattributes of the product. Optimization of singlepass turning has been attempted in earlyworks. However, in general, a turning operationinvolves a number of rough cuts and a finalfinish cut. In manufacturing industries, multipass turning is widely used than single passturning. The highest possible metal removal isaimed in rough passes, where surface finishis not an important consideration. However, infinish turning process, surface finish is the mostimportant consideration. Surface roughness istermed as the small, finely spaced deviationsfrom nominal surface of the third up to sixthorder. Figure 3 shows the surface roughnessprofile. The average surface roughness isgiven by,
L
a dxxYL
R0
1
where Ra is the arithmetic average deviationfrom mean line, L is the sampling length and Ythe ordinate of the profile curve (Khalil andYasir, 2008). Measuring of surface roughnessis vital to quality control of machined parts.Measurement of surface roughness ofmachined work pieces can be carried out bymeans of different techniques such as, directmeasurement, comparison based techniques,noncontact methods, on-processmeasurement, etc.
Surface finish influences functionalproperties of machined components such asfatigue strength, wear rate, coefficient offriction, and corrosion resistance of themachined components. The most importantparameter describing the surface integrity issurface roughness. Parts such as automobile,aerospace, and medical components needhigh precision in surface finish. In the
Figure 3: Surface Roughness Profile

94
Int. J. Mech. Eng. & Rob. Res. 2014 Govindan P and Vipindas M P, 2014
manufacturing industry today, surface must bewithin certain limits of roughness. The dynamicnature and widespread usage of turningoperations in practice have raised a need forseeking a systematic approach that can helpto set up turning operations in a timely mannerand also to achieve the desired surface quality.Figure 4 shows a fishbone diagram with theparameters that affect surface roughness.
TAGUCHI METHOD—ANOVERVIEWThe Taguchi experimental design method, byGenichi Taguchi is a well-known, unique andpowerful technique for product or processquality improvement. It is widely used foranalysis of experiment and product or process
optimization. Genichi Taguchi is a Japaneseengineer who has been active in theimprovement of Japan’s industrial productsand processes since the late 1940s. He hasdeveloped both the philosophy andmethodology for process or product qualityimprovement that depends heavily onstatistical concepts and tools, especiallystatistically designed experiments. Taguchihas developed a methodology for theapplication of factorial design experiments thathas taken the design of experiments from theexclusive world of the statistician and broughtit more fully into the world of manufacturing.His contributions have also made thepractitioner’s work simpler by advocating theuse of fewer experimental designs, and
Figure 4: Parameters Affecting Surface Roughness
Source: Benardos and Vosniakos (2003)

95
Int. J. Mech. Eng. & Rob. Res. 2014 Govindan P and Vipindas M P, 2014
providing a clearer understanding of the natureof variation and the economic consequencesof quality engineering in the world ofmanufacturing. Taguchi introduces hisconcepts to:
• Quality should be designed into a productand not inspected into it.
• Quality is best achieved by minimizing thedeviation from a target.
• Cost of quality should be measured as afunction of deviation from the standard andthe losses should be measured systemwide.
Taguchi recommends a three stageprocess to achieve desirable product qualityby design-system design, parameter designand tolerance design. While system designhelps to identify working levels of the designparameters, parameter design seeks todetermine parameter levels that provide thebest performance of the product or processunder study. The optimum condition isselected so that the influence of uncontrollablefactors causes minimum variation to systemperformance. Orthogonal arrays, variance andSignal to Noise analysis are the essential toolsof parameter design. Tolerance design is astep to fine tune the results of parameterdesign (Ross, 1996). Many Japanese firmshave achieved great success by applying hismethods. Thousands of engineers haveperformed tens of thousands of experimentsbased on his teachings (Wu, 1982). Taguchihas received Japan’s most prestigiousawards for quality achievement, including theDeming prize. In 1986, Taguchi received themost prestigious prize from the InternationalTechnology Institute-Willard F Rockwell medal
for excellence in technology. Taguchi’s majorcontribution has involved combiningengineering and statistical methods to achieverapid improvements in cost and quality byoptimizing product design and manufacturingprocesses. After Taguchi’s association with thetop companies and institutes in USA (AT andT) Bell Laboratories, Xerox, Lawrence Instituteof Technology (LIT), Ford Motor Company etc.)his methods have been called a radicalapproach to quality, experimental design andengineering (Barker, 1990). “Taguchi Method”(TM) refers to the parameter design, tolerancedesign, quality loss function, on line qualitycontrol, design of experiments usingorthogonal arrays, and methodology appliedto evaluate measuring systems. Pignatiello(1988) identifies two separate aspects of theTaguchi methods: the strategy of Taguchi andthe tactics of Taguchi. Taguchi tactics refer tothe collection of specific methods andtechniques used by Taguchi, and Taguchistrategy is the conceptual framework orstructure for planning a product or processdesign experiment. Taguchi addresses designand engineering (off-line) as well asmanufacturing (on-line) quality (Benton, 1991).This fundamentally differentiates TM fromStatistical Process Control (SPC), which ispurely an on-line quality control method.
Taguchi methods represent a newphilosophy (Lin et al., 1990). Quality ismeasured by the deviation of a functionalcharacteristic from its target value. Noises(uncontrolled variables) can cause suchdeviations resulting in loss of quality. Taguchimethods seek to remove the effect of noises.Taguchi described that quality engineeringencompasses all stages of product/process

96
Int. J. Mech. Eng. & Rob. Res. 2014 Govindan P and Vipindas M P, 2014
development: system design, parameterdesign, and tolerance design. The key elementfor achieving high quality and low cost isparameter design (Byrne and Taguchi, 1987).Through parameter design, levels of productand process factors are determined, such thatthe product’s functional characteristics areoptimized and the effect of noise factors isminimized. Parameter design reducesperformance variation by reducing theinfluence of the sources of variation rather thanby controlling them, it is thus a very costeffective technique for improving engineeringdesign (Kackar and Shoemaker, 1986). Figure5 shows Taguchi design procedure (Zhanget al., 2007).
The very intention of Taguchi parameterdesign is to maximize the performance of anaturally variable production process bymodifying the controlled factors (Roy, 2001).
A key idea is the contention that Taguchiparameter design uses the nonlinearity of aresponse parameter to decrease the sensitivityof the quality characteristic to variability. Figure6 shows the parameter diagram (P diagram)for a product/process or system. Variability ina manufacturing process can be significant,often uncontrollable, and have varying effectson quality characteristics.
Figure 5: Taguchi Design Procedure
Source: Zhang et al. (2007)
Figure 6: P Diagram
Taguchi’s Orthogonal Array (OA) providesa set of well-balanced experiments (with lessnumber of experimental runs) and Taguchi’sSignal-to-Noise ratio (S/N), which islogarithmic functions of desired output; serveas objective functions in the optimizationprocess. The S/N ratio is the ratio of the mean(Signal) to the standard deviation (Noise). Thestandard deviation cannot be minimized firstand the mean brought to the target (Kim,2010). The ratio depends on the qualitycharacteristics of the product/process to beoptimized. The standard S/N ratios generallyused are as follows: Nominal-is-Best (NB),Lower-the-Better (LB) and Higher-the-Better(HB). Because, irrespective of the qualitycriteria may be (NB, LB, and HB) S/N ratioshould always be maximized. Optimum cuttingconditions required for the minimum surfaceroughness is obtained by using LB criterion.S/N ratio can be obtained from equation,
97
Int. J. Mech. Eng. & Rob. Res. 2014 Govindan P and Vipindas M P, 2014
• Create Orthogonal Arrays for the parameterdesign indicating the number of andconditions for each experiment.
• Conduct the experiments indicated in thecompleted array to collect data on the effecton the performance measure.
• Complete data analysis to determine theeffect of the different parameters on theperformance measure.
– Analysis of variance (ANOVA) is acollection of statistical models, and theirassociated procedures, in which theobserved variance in a particularvariable is partitioned into componentsattributable to different sources ofvariation. ANOVA is used in the analysisof comparative experiments those inwhich only the difference in outcomes isof interest.
– The statistical significance of theexperiment is determined by a ratio oftwo variances. This ratio is independentof several possible alterations to theexperimental observations: adding aconstant to all observations does not altersignificance. Multiplying all observationsby a constant does not alter significance.So ANOVA statistical significance resultsare independent of constant bias andscaling errors as well as the units usedin expressing observations.
LITERATURE REVIEWConsideration of machining parameteroptimization started out as early as 1907,when (Taylor, 1907) acknowledged theexistence of an optimum cutting speed formaximizing material removal rate in single
S/N = –10 log 1/n(y2) (Hasnul Hadi et al.,2011).
Taguchi method for experimental design isstraightforward and easy to apply to manyengineering situations with less statisticalknowledge. Taguchi method provides asimple, competent and methodical approachto optimize the designs for performance,quality, and cost. It is a method of powerfultool for the design of high quality systems. Themethodology is important when the designparameters are qualitative and distinct.Taguchi parameter design can optimize theperformance characteristics through thesettings of the design parameters and reducethe sensitivity of the system performance tosources of variation. In recent years, the rapidgrowth of interest in the Taguchi method hasled to numerous applications of the methodin a world wide range of industries andcountries.
The general steps involved in the TaguchiMethod are as follows.
• Define the process objective, or morespecifically, a target value for a performancemeasure of the process. The target of aprocess may also be a minimum ormaximum. The deviation in the performancecharacteristic from the target value is usedto define the loss function for the process.
• Determine the design parameters affectingthe process. Parameters are variableswithin the process that affect theperformance measure such astemperatures, pressures, etc. that can beeasily controlled. The number of levels thatthe parameters should be varied must bespecified.

98
Int. J. Mech. Eng. & Rob. Res. 2014 Govindan P and Vipindas M P, 2014
pass turning operations. Research onmachining parameter optimization hasincreased since the 1950’s. In 1950 (Gilbert,1950) presented a theoretical analysis ofoptimization of machining process andproposed an analytical procedure todetermine the cutting speed for a single-passturning operation with fixed feed rate and depthof cut by using two different objectives (i)maximum production rate and (ii) minimummachining cost. In a review of metal cuttinganalysis in 1956, Finnie (1956) pointed out-”Despite the large number of attempts, pastand present, to analyze metal cutting, a basicrelationship between the various variables isstill lacking.” This remark is valid till today, evenafter a half century. Nevertheless, the efforts tomodel machining process are still going on,as the proper understanding of the machiningprocess has a large bearing on the economicsof machining. With the advent of capitalintensive CNC machine tools, this need hasstrengthened. An earlier survey for machiningaluminum alloy components in the US aircraftindustry has shown that the selected cuttingspeeds were far below the optimal economicspeeds. One of the reasons for this poorperformance is the lack of predictive models.This has inhibited the widespread use of theavailable optimization strategies. But, ifreliable predictive models for the varioustechnological performance measures aredeveloped, then optimizing the economicperformance is feasible, and this can providea means for bridging the gap between theoryand practice.
The prediction of surface roughness, cuttingforce, and tool life in machining is a challengingtask, but is necessary for proper optimization
of the process. In actual practice, all the factorswhich affect the surface roughness areclassified into: tool variables, work piecevariables and cutting conditions. Tool variablesinclude tool material, nose radius, rake angle,cutting edge geometry, tool vibration, tooloverhang, tool point angle, etc. Work piecevariables include material, hardness and othermechanical properties. Machining parametersin metal turning are cutting speed, feed rateand depth of cut. The setting of theseparameters determines the qualitycharacteristics of turned parts. Traditionally, theselection of cutting conditions for metal cuttingis left to the machine operator. In such cases,the experience of the operator plays a majorrole, but even for a skilled operator it is verydifficult to attain the optimum values each time.To this end, a great deal of research has beenperformed in order to quantify the effect ofvarious turning process parameters to surfacequality. Figure 7 shows the process andperformance parameters of the turningprocess. The machining optimization problemis highly nonlinear and possesses multiple
Figure 7: Process and PerformanceParameters of Turning

99
Int. J. Mech. Eng. & Rob. Res. 2014 Govindan P and Vipindas M P, 2014
solutions. Researchers considered variousinput (cutting) parameters like cutting speed,feed rate, depth of cut, cutting time, coolantpressure, etc. Since it can be done at thedesign stage, Taguchi parameter designallows quality engineers to reduce the needfor quality control later (Sriraman, 1996).
Yang and Tang (1998) carried out anexperiment consisting of 18 combinations onan engine lathe using tungsten carbide withthe grade of P-10 for the machining of S45Csteel bars. The cutting parameters that havebeen selected are cutting speed, feed rateand depth of cut with the response variable,tool life and surface roughness. Results showthat for surface roughness, all the cuttingparameters have the significant effect. Theconfirmation experiments then wereconducted to verify the optimal cuttingparameters. The improvement of tool life andsurface roughness from the initial cuttingparameters to the optimal cutting parametersis about 250%.
Daniel Kirby (2006) investigated theapplication of the Taguchi parameter designmethod to optimize the surface finish in aturning operation of 6061-T6511 Aluminiumalloy. In order to meet this purpose in terms ofboth efficiency and effectiveness, this studyutilizes the Taguchi parameter designmethodology. This includes selection ofparameters, utilizing an orthogonal array,conducting experimental runs, data analysis,determining the optimum combination, andverification. Controlled factors include spindlespeed, feed rate, and depth of cut; and thenoise factor is slightly damaged jaws. Table 1shows the parameters and levels for thisexperimental design. The noise factor is
included to increase the robustness andapplicability of this study. The array selectedto meet these criteria is a modified L8 array.In this study he concluded that feed rate hadthe highest effect on surface roughness,spindle speed had a moderate effect, anddepth of cut had an insignificant effect.
Thamizhmanii et al. (2007) applied Taguchimethod for finding out the optimal value ofsurface roughness under optimum cuttingcondition in turning SCM 440 alloy steel. Theexperiment was designed by using Taguchimethod and experiments were conducted andresults thereof were analysed with the help ofANOVA. The causes of poor surface finish asdetected were machine tool vibrations, toolchattering whose effects were ignored foranalysis. The authors concluded that the resultsobtained by this method would be useful toother researches for similar type of study ontool vibrations, cutting forces etc. The workconcluded that depth of cut was the onlysignificant factor which contributed to thesurface roughness. Sahoo et al. (2008)studied for optimization of machiningparameters combinations emphasizing onfractal characteristics of surface profilegenerated in CNC turning operation. Theauthors used L27 Taguchi Orthogonal Arraydesign with machining parameters: speed,feed and depth of cut on three different workpiece materials viz., aluminium, mild steel and
Table 1: Parameters and Levelsfor Experimental Design
Source: Daniel Kirby (2006)

100
Int. J. Mech. Eng. & Rob. Res. 2014 Govindan P and Vipindas M P, 2014
brass. It was concluded that feed rate was moresignificant influencing surface finish in all threematerials. It was observed that in case of mildsteel and aluminium feed showed someinfluences while in case of brass depth of cutwas noticed to impose some influences onsurface finish. The factorial interaction wasresponsible for controlling the fractaldimensions of surface profile produced in CNCturning.
Philip Selvaraj and Chandramohan (2010)presents the influence of cutting parameterslike cutting speed, feed rate and depth of cuton the surface roughness of austeniticstainless steel during dry turning. A plan ofexperiments based on Taguchi technique hasbeen used to acquire the data. An OrthogonalArray, S/N ratio and the Analysis of Variance(ANOVA) are employed to investigate thecutting characteristics of AISI 304 austeniticstainless steel bars using TiC and TiCN coatedtungsten carbide cutting tool. The parametersselected are speed (80, 100, 120 m/min), feed(0.08, 0.1, 0.12 mm/rev) and depth of cut (0.4,0.6, 0.8 mm). In this study, Taguchi OrthogonalArray, the Signal to Noise (S/N) ratio and theanalysis of variance (ANOVA) were used forthe optimization of cutting parameters. ANOVAresults shows that feed rate, cutting speed anddepth of cut affects the surface roughness by51.84%, 41.99% and 1.66% respectively. A
confirmation experiment verif ied theeffectiveness of the Taguchi optimizationmethod which is evident from Table 2.
Venkata Ramana et al. (2011) investigatedthe performance evaluation and optimizationof process parameters in turning of Ti6Al4Valloy with different coolant conditions usingTaguchi design of experiments methodologyon surface roughness, by uncoated carbidetool. The results have been compared amongdry, flooded with servo cut oil and water andflooded with synthetic oil coolant conditionsand optimum is found out which is shown inTable 3. From the experimental investigations,the cutting performance on Ti6Al4V alloy withsynthetic oil is found to be better whencompared to dry and servo cut oil and water inreducing surface roughness. The results fromANOVA shows that while machining Ti6Al4Valloy, the synthetic oil is more effective underhigh cutting speed, high depth of cut and lowfeed rate compared to dry and servo cut oiland water conditions. The ANOVA also revealsthat feed rate is dominant parameter under dry,servo cut oil and water and synthetic oilconditions in optimizing the surface roughness.
Table 2: Results of the ConfirmationExperiment for Surface Roughness
Source: Philip Selvaraj and Chandramohan (2010)
Table 3: Optimum Parameters
Source: Venkata Ramana et al. (2011)
Marinkovic Velibor and MadicMilos (2011)investigated the modelling and optimization ofsurface roughness in dry single point turningof cold rolled alloy steel 42CrMo4/AISI 4140using TiN-coated tungsten carbide inserts.Figure 8 shows the cutting factors and their

101
Int. J. Mech. Eng. & Rob. Res. 2014 Govindan P and Vipindas M P, 2014
levels used for this study. Each of the otherparameters was taken as constant. Theaverage surface roughness was chosen as ameasure of surface quality. The experimentwas designed and carried out on the basis ofstandard L27 Taguchi orthogonal array. Thedata set from the experiment was employedfor conducting the optimization procedures,according to the principles of the Taguchimethod. The results of calculations were ingood agreement with the experimental data.The results confirm the effectiveness of Taguchitechnique in optimization of cutting processes.On the basis of the experimental results andderived analysis, concluded that cutting speedhas the most dominant effect on the observedsurface roughness, followed by feed rate anddepth of cut, whose influences on surfaceroughness are smaller. The surface roughnessis continuously improved with the increase incutting speed, but increase in feed rate anddepth of cut causes a significant deteriorationof surface roughness. The results obtainedusing the Taguchi optimization methodrevealed that the cutting speed should be keptat the highest level, while both feed rate and
depth of cut should be kept at the lowest levelto get minimum roughness.
Adarsh Kumar et al. (2012) conducted theanalysis of optimum cutting conditions to getlowest surface roughness in facing byregression analysis. They conducted anexperimental study to investigate the effectsof cutting parameters like spindle speed, feedand depth of cut on surface finish on EN-8. Thelevels of parameters selected are speed (100,360, 560rpm), feed (0.14, 0.15, 0.16 mm/rev)and depth of cut (0.5, 1, 1.5 mm). Multipleregression modelling was performed topredict the surface roughness by usingmachining parameters. Machining was doneusing cemented carbide insert. Mitutoyo SJ-310 for surface roughness tester is used forroughness readings. It was seen that the effectof feed rate is greater than the effect of cuttingspeed and to improve the surface roughness,a good combination of cutting speed and feedrate needs to be selected. The feed has thevariable effect on surface roughness. Figure9 shows the comparison of experimental andpredicted surface roughness reveals the
Figure 8: Dry Turning of 42CrMo4/AISI4140
Source: Marinkovic Velibor and MadicMilos (2011)
Figure 9: Comparison of Experimental andPredicted Surface Roughness
Source: Marinkovic Adarsh Kumar et al. (2012)

102
Int. J. Mech. Eng. & Rob. Res. 2014 Govindan P and Vipindas M P, 2014
validity of the experiment. The relationshipbetween feed rate and surface roughness isproportional, increasing the feed rate,increases the surface roughness. On surfaceroughness, the effect of feed rate is moreconsiderable than cutting speed.
Somashekara and Lakshmana Swamy(2012) investigated optimization of surfaceroughness in turning operation using Taguchitechnique and ANOVA. The objective of thestudy is to obtain an optimal setting of turningparameters (cutting speed, feed and depth ofcut) which results in an optimal value of surfaceroughness while machining Al 6351-T6 alloywith uncoated carbide inserts. The machiningcondition parameters were the cutting speedof 500, 1000 and 1500 rpm, feed rate of 0.1,0.4 and 0.7 mm/rev, while the Depth Of Cut(DOC) as 0.2, 0.5 and 0.8 mm. From the resultsobtained a regression model has beendeveloped for surface roughness as,
Ra (µm) = 1.69 + 0.00146 Speed (rpm) –1.92 Feed (mm/rev) + 0.24 DOC (mm). Fromthis equation one can predict the value ofsurface roughness if the values of cutting speed,feed and depth of cut are known. Figure 10
shows S/N ratio values for surface roughness.From ANOVA and response table for Signalto Noise ratios, it can be concluded that speedhas a greater influence on the surfaceroughness followed by feed. Depth of cut hasleast influence on surface roughness.
Sreenivasa Murthy et al. (2013) in their workenvisage the optimal setting of processparameters which influences the surfaceroughness during the machining operation ofEN41B alloy steel with cermet tool.Experiments have been carried out usingTaguchi design. The surface roughness isconsidered as quality characteristic while theprocess parameters considered are speed,feed and depth of cut. Table 4 shows theranking of cutting parameters selected byANOVA. Regression equation for surfaceroughness is obtained using MINITAB 16 asRa = e3.02 S0.068 f0.874 d0.074. The results ofmachining experiments were used tocharacterize the main factors affecting surfaceroughness by the Analysis of Variance. Thefeed and speed are identified as the mostinfluential process parameters on work piecesurface roughness. The ANOVA and F-testrevealed that feed is the dominant parameterfollowed by speed for surface roughness.
Ballal Yuvaraj et al. (2012) carried outturning of grey cast iron using Taguchi method.They describe use and steps of Taguchi design
Figure 10: S/N Ratio Values for SurfaceRoughness
Source: Somashekara and Lakshmana Swamy (2012)
Table 4: Ranking of Cutting Parameters
Source: Sreenivasa Murthy et al. (2013)

103
Int. J. Mech. Eng. & Rob. Res. 2014 Govindan P and Vipindas M P, 2014
of experiments and Orthogonal Array to find aspecific range and combinations of turningparameters like cutting speed, feed rate anddepth of cut to achieve optimal values ofresponse variables like surface finish, toolwear, material removal rate in turning of FG260 gray cast iron material. Three parametersnamely feed rate, spindle speed and depth ofcut are varied to study their effect on surfacefinish, tool wear and MRR. They carried workon simple turn 5075 CNC lathe with CNMA120408 as a tool material with Minitabsoftware for effect analysis. They selected L27orthogonal array for taguchi design. It is ascientifically disciplined mechanism forevaluating and implementing improvements inproducts, processes, materials, equipment’sand facilities.
Neseli et al. (2011)] investigated theinfluence of tool geometry on the surface finishobtained in turning of AISI 1040 steel withAl2O3/TiC tool. The results indicated that thetool nose radius was the dominant factor onthe surface roughness with 51.45%contribution in the total variability of model.Kilickap et al. (2005) investigated tool wearand surface roughness in machining ofhomogenized SiC-p reinforced Aluminiummetal matrix composite using Taguchi method.They found that surface roughness is influencedwith cutting speed and feed rate. Higher cuttingspeed and lower feed rates produced bettersurface quality.
Kassab and Khoshnaw (2007) examinedthe correlation between surface roughness andcutting tool vibration for turning operation. Theprocess parameters were cutting speed, depthof cut, feed rate and tool overhanging. Theexperiments were carried out on lathe using
dry turning operation of medium carbon steelwith different level of aforesaid processparameters. Dry turning was helpful for goodcorrelation between surface roughness andcutting tool vibration because of cleanenvironment. The authors developed goodcorrelation between the cutting tool vibrationand surface roughness for controlling thesurface finish of the work pieces during massproduction. The study concluded that thesurface roughness of work piece wasobserved to be affected more by cutting toolacceleration; acceleration increased withoverhang of cutting tool. Surface roughnesswas found to be increased with increase infeed rate.
Kamaraj Chandrasekaran et al. (2012)carried out CNC turning on AISI410 with singleand nano multilayered carbide tools coatedwith multilayered TiCN + Al2O3, multilayered Ti(C, N, B), single layered (Ti, Al) N, and nanomultilayered B-Tic under dry conditions.Different cutting parameters, namely, cuttingspeed, feed rate, and depth of the cut are usedfor the optimal setting of the parameters.Experiments were carried out using theTaguchi’s L27 orthogonal array. The effect ofcutting parameters on Surface Roughness(SR) was evaluated and optimal settingconditions were determined for minimizationof SR. Analysis of Variance (ANOVA) wasused for identifying the significant parametersaffecting the response. They concluded fromthe results of ANOVA, the feed rate and cuttingspeed are the significant cutting parametersaffecting the SR with Ti (C, N, B), (Ti,Al) N, andB-Tic, the feed rate and depth of cut are thesignificant cutting parameters affecting the SRwith TiCN + Al2O3, a minimum SR value was

104
Int. J. Mech. Eng. & Rob. Res. 2014 Govindan P and Vipindas M P, 2014
obtained using multilayered B-Tic carbide toolsrather than TiCN + Al2O3 (C,N,B) and (Ti,Al)N.
Yanda et al. (2010) carried out optimizationof material removal rate, surface roughnessand tool life on conventional dry turning ofductile cast iron FCD700 grade using TiNcoated cutting tool. The machining parameterswere the cutting speed (220, 300, 360 m/min),feed rate (0.2, 0.3, 0.5 mm/rev) while the DepthOf Cut (DOC) was kept constant at 2 mm. Theeffect of cutting condition (cutting speed andfeed rate) on MRR, surface roughness, andtool life were studied and analysed.Experiments were conducted based on theTaguchi design of experiments (DOE) withorthogonal L9 array, and then followed byoptimization of the results using ANOVA. Lowsurface finish was obtained at high cuttingspeed and low feed rate.
Senthilkumaar et al. (2010) carried out theanalysis of surface roughness and flank wearin finish turning and facing of Inconel 718 usingTaguchi technique. Single pass finish turningand facing operations were conducted in drycutting condition using uncoated carbide tools.The experiments were conducted on the L16ACE designer CNC lathe. Uncoated carbideinserts as per ISO specification SNMG120408-QM H13A were clamped onto a toolholder with a designation of DSKNL 2020K12 IMP for facing operation and DBSNR2020K 12 for turning operation. Cuttingexperiments were conducted as per the fullfactorial design under dry cutting conditions.The machining parameters and performancemeasures were shown in Figure 11. Based onTaguchi design of experiments and non-linearregression analysis, the cutting speed is foundas the main factor that has highest influence
on surface roughness as well as flank wear ofturning and facing processes. The percentageerror between experimental and predictedresult is 8.69% and 8.49% in turning and facingprocess respectively. Based on the analysiscutting speed and depth of cut are found asthe dominant factors.
Basim Khidhir and Bashir Mohamed (2011)performed CNC turning on Nickel basedHastelloy C-276 using two different inserts ofceramic cutting tools. The influences of cuttingspeed, tool inserts type and work piecematerial were investigated on the machinedsurface roughness. Cutting speed was foundto have a significant effect on the machinedsurface roughness values. Figure 12 shows
Figure 11: CNC Turning of Inconel 718
Source: Senthilkumaar et al. (2010)
Fig.12. Main Effects Plot for SurfaceRoughness
Source: Basim Khidhir and Bashir Mohamed (2011)

105
Int. J. Mech. Eng. & Rob. Res. 2014 Govindan P and Vipindas M P, 2014
the main effects plot for surface roughness.Round insert found to produce better surfaceroughness associated with decreasing thedepth of cut and increasing the cutting speed.
Mustafa Gunaya and Emre Yucel (2012)investigated the cutting conditions for theaverage surface roughness (Ra) obtained inmachining of high alloy white cast iron (Ni-Hard) at two different hard-ness levels (50HRC and 62 HRC). Machining experimentswere performed at the CNC lathe usingceramic and Cubic Boron Nitride (CBN)cutting tools on Ni-Hard materials. Cuttingspeed, feed rate and depth of cut were chosenas the cutting parameters. Table 5 shows thevariables and their levels used in this work.Taguchi L18 Orthogonal Array was used todesign of experiment. Optimal cuttingconditions was determined using the Signal-to-Noise (S/N) ratio which was calculated forRa according to the-smaller-the-betterapproach. The effects of the cutting parametersand tool materials on surface roughness wereevaluated by ANOVA. The statistical analysisindicated that the parameters that have thebiggest effect on Ra for Ni hard materials with50 HRC and 62 HRC are the cutting speedand feed rate, respectively.
Bouacha et al. (2010) investigated theroughness values created in hard turning of 64HRC hardness AISI 52100 bearing steel with
CBN cutting tool. They performed themachining tests according to the L27orthogonal array of Taguchi experimentaldesign method. They reported that the cuttingparameter which is the most effective on Rais the feed rate and cutting speed.
Davim and Figueira (2007) investigated themachinability of a cold work tool steel which ishardened to 60 HRC by turning. In the end ofthe experiments performed according toTaguchi L27 Orthogonal Array they found thatRa value decreases by the increasing cuttingspeed.
Aslan et al. (2007) evaluated the Ra andcutting tool wear during the machining of AISI4140 (63 HRC) steel by an experiment usingAl2O3 + TiCN cutting tool according to TaguchiL27 Orthogonal Array. The experimentalparameters chosen were speed, feed anddepth of cut. They reported according to theANOVA results that the effect of cutting speedon the tool wear is 30%. The surfaceroughness increased as the speed increases.They suggested 250 m/min cutting speed, 0.25mm depth of cut and 0.05 mm/rev feed rate tominimize the Ra value.
Asilturk and Akkus (2011) investigated theuse of the Taguchi method for minimizing theaverage surface roughness (Ra) and thearithmetic mean value of the singleroughness depths of consecutive samplinglengths (Rz) in turning of hardened AISI 4140(51 HRC) with coated carbide cutting tools.Taguchi Orthogonal and Signal-to-Noiseratios (S/N) are used as objective functionsin optimization process. Their study focusedon effects of cutting speed, feed rate anddepth of cut on surface roughness. Statisticalanalysis of experimental data indicated that
Table 5: Variables and Levels
Source: Davim and Figueira (2007)

106
Int. J. Mech. Eng. & Rob. Res. 2014 Govindan P and Vipindas M P, 2014
the feed rate has the most significant effecton Ra and Rz. The authors were also foundthat the optimum cutting conditions wasdifferent for Ra and Rz.
Mahendra Korat and Neeraj Agarwal (2012)investigated the effects of the processparameters viz., coolant condition, cuttingspeed, feed, depth of cut, nose radius, onresponse characteristics viz., material removalrate, surface roughness, on EN24 material inCNC turning. The tungsten carbide insertsused were of ISO coding TNMG 160404,TNMG 160408 and TNMG 160412 and toolholder of ISO coding ETJNL2525M16.Analysis of Variance suggests that the noseradius is the most significant factor and cuttingenvironment is most insignificant factor for bothsurface roughness and MRR. ANOVA resultsshows that nose radius, feed rate, depth of cut,cutting speed and coolant condition affects thesurface roughness by 65.38%, 25.15%,3.06%, 1.41% and 0.09% respectively.Figure 13 shows the effect of processparameters on surface roughness.
Kacal and Gulesin (2011) optimized themachining parameters in finish turning ofaustempered cast iron GJS-400-15 accordingto the L18 Orthogonal Array of Taguchi.ANOVA results revealed that feed rate is themost effective parameter for surfaceroughness. The optimum cutting conditionsfound for Ra as: 290 °C austemperingtemperature, ceramic tool, 800 m/min cuttingspeed and 0.05 mm/rev feed rate.
Nalbant et al. (2007) in their study usedTaguchi method to find the optimal cuttingparameters for surface roughness in turning.The Orthogonal Array, the Signal-to-Noiseratio, and ANOVA are employed to study theperformance characteristics in turningoperations of AISI 1030 steel bars using TiNcoated tools. Three cutting parameters namely,insert radius, feed rate, and depth of cut, areoptimized with consideration of surfaceroughness. Figure 14 shows Signal to-Noisegraph for surface roughness. The experimentalresults demonstrate that the insert radius andfeed rate are the main parameters among the
Figure 13: Effect of Process Parameterson Surface Roughness
Source: Mahendra Korat and Neeraj Agarwal (2012)
Figure 14: Signal-to-Noise Graphfor Surface Roughness
Source: Nalbant et al. (2007)

107
Int. J. Mech. Eng. & Rob. Res. 2014 Govindan P and Vipindas M P, 2014
three controllable factors (insert radius, feedrate and depth of cut) that influence the surfaceroughness. The percentage contributions ofinsert radius, feed rate and depth of cut are48.54, 46.95 and 3.39, respectively. It is foundthat the parameter design of the Taguchimethod provides a simple, systematic, andefficient methodology for the optimization ofthe cutting parameters.
Anirban Bhattacharya et al. (2009) haveinvestigated the effect of cutting parameterson surface finish and power consumptionduring high speed machining of AISI 1045steel using Taguchi design and ANOVA. Theresult showed a significant effect of cuttingspeed on surface roughness and powerconsumption, while the other parameters havenot substantially affected the response.
Lan and Wang (2009) used OrthogonalArray of Taguchi method coupled with GreyRelational Analysis considering fourparameters viz. speed, cutting depth, feedrate, tool nose run off etc. for optimizing threeresponses: surface roughness, tool wear andmaterial removal rate in precision turning onan ECOCA-3807 CNC lathe. The MINITABsoftware was explored to analyse the meaneffect of Signal-to-Noise (S/N) ratio to achievethe multi objective features. This study not onlyproposed an optimization approach usingOrthogonal Array and Grey Relational Analysisbut also contributed a satisfactory techniquefor improving the multiple machiningperformances in precision CNC turning withprofound insight.
Kandananond (2009) investigated thecutting conditions for minimizing surfaceroughness in a turning process of ferritestainless steel, grade AISI 12L14. The work
pieces used were the sleeves of FluidDynamic Bearing (FDB) spindle motorsmanufactured in the final assembly departmentat a factory which supplies FDB motors forhard disk drives. The effects of the depth ofcut, spindle speed and feed rate on surfaceroughness were studied using the Taguchidesign. The ANOVA shows that all three factorsand the interactions depth of cut, spindlespeed, feed rate have significant effects onthe response. Figure 15 shows surfaceroughness Ra versus depth of cut, feed andspeed graphs.
Kaladhar et al. (2012) deals with theoptimization of machining parameters inturning of AISI 202 austenitic stainless steelusing CVD coated cemented carbide tools.During the experiment, process parameterssuch as speed, feed, depth of cut and noseradius are used to explore their effect on thesurface roughness (Ra) of the work piece. Theexperiments have been conducted using fullfactorial design in the Design of Experiments(DOE) on CNC lathe. Further, the ANOVA was
Figure 15: Ra versus Depth of Cut, Feedand Speed
Source: Kandananond (2009)

108
Int. J. Mech. Eng. & Rob. Res. 2014 Govindan P and Vipindas M P, 2014
used to analyse the influence of processparameters and their interaction duringmachining. Figure 16 shows the main effectsplot for surface roughness. From the analysis,it is observed that the feed is the mostsignificant factor that influences the surfaceroughness followed by nose radius. An attempthas been made to generate to predictionmodels for surface roughness. The predictedvalues are confirmed by using validationexperiments.
Akhyar et al. (2008) elaborates Taguchioptimization methodology is applied tooptimize cutting parameters in turning Ti6Al4Vextra low interstitial with coated and uncoatedcemented carbide tools under dry cuttingcondition and high cutting speed. The turningparameters evaluated are cutting speed of 55,75, and 95 m/min, feed rate of 0.15, 0.25 and0.35 mm/rev, depth of cut of 0.10, 0.15 and0.20 mm and tool grades of K313, KC9225and KC5010, each at three levels. Thesignificant factors for the surface roughnessin turning Ti6Al4V ELI were the feed rate andthe tool grade, with contribution of 47.146%and 38.881%, respectively. The general linearmodel for analysis of variance is presented inFigure 18.
Kopac et al. (2002) considered cuttingspeed, tool materials, feed rate and depth ofcut as cutting parameters in machining C15E4 steel on a lathe. They used TaguchiOrthogonal Array of L16, which has two levelsand a degree of freedom of 13 in theexperimental design. They reported that the
Jitendra Verma (2012) focused on theanalysis of optimum cutting conditions to getlowest surface roughness in turning ASTMA242 Type 1 alloy steel using universal turningmachine tool by Taguchi method. 9experiments were conducted by this process.The results are analysed using Taguchimethod. ANOVA has shown that the cuttingspeed has significant role to play in producinglower surface roughness about 58% followedby feed rate about 23% which is shown inFigure 17. The depth of cut has lesser role onsurface roughness from the tests.
Figure 16: Main Effects Plot for SurfaceRoughness
Source: Kaladhar et al. (2012)
Figure 17: % Contribution for SurfaceRoughness
Source: Jitendra Verma (2012)

109
Int. J. Mech. Eng. & Rob. Res. 2014 Govindan P and Vipindas M P, 2014
cutting parameter which is most effective onRa is the cutting speed and better surfaceroughness is obtained at higher cuttingspeeds.
Lazarevic et al. (2012) discusses the useof Taguchi method for minimizing the surfaceroughness in turning polyethylene. Theinfluence of four cutting parameters, cuttingspeed (65.03, 115.61, 213.88 m/min),feed rate(0.049, 0.098, 0.196 mm/rev), depth of cut(1,2,4 mm) and tool nose radius (0.4,0.8 mm)on average surface roughness (Ra) was
analyzed on the basis of the standard L27Taguchi orthogonal array. The experimentalresults were then collected and analyzed withthe help of the commercial software packageMINITAB. Based on the analysis of means(ANOM) and analysis of variance (ANOVA),the optimal cutting parameter settings aredetermined, as well as level of importance ofthe cutting parameters. ANOVA results indicatethat the feed rate is far the most significantparameter, followed by tool nose radius, andcutting speed, whereas the influence of depthof cut is negligible. Figure 19 shows %contribution for surface roughness. TheANOVA resulted in less than 10% errorindicating that the interaction effect of processparameters is small. The optimum levels of theprocess parameters for minimum surfaceroughness are as follows: cutting speed–213.88 m/min, feed rate –0.049 mm/rev,depth of cut –2 mm, and tool nose radius –0.8mm. The machine used for the experimentswas the universal lathe machine Potisje PA-C30. Cutting tool was SANDVIK coromant tool
Figure 18: General Linear Modelfor ANOVA
Source: Akhyar et al. (2008)
Figure 19: % Contribution for SurfaceRoughness
Source: Lazarevic et al. (2012)

110
Int. J. Mech. Eng. & Rob. Res. 2014 Govindan P and Vipindas M P, 2014
holder SVJBR 3225P 16 with inserts VCGX16 04 04-AL (H10) and VCGX 16 04 08-AL(H10). It was measured at three equally spacedpositions around the circumference of the workpiece using the profilometer Surftest MitutoyoSJ-301.
Ali Riza Motorcu (2010) investigated thesurface roughness in the turning of AISI 8660hardened alloy steels by ceramic based cuttingtools was in terms of main cutting parameterssuch as cutting speed, feed rate, depth of cutin addition to tool nose radius, using astatistical approach. Machining tests werecarried out with PVD coated ceramic cuttingtools under different conditions. An OrthogonalArray, Signal-to-Noise ratio and Analysis ofVariance were employed to find out theeffective cutting parameters and nose radiuson the surface roughness. The machine usedfor the turning tests was a John ford TC35industrial type of Computer Numeric Control(CNC) lathe machine. The insert was coatedusing a PVD method. The coating substancetook place on the mixed ceramic substrate andPVD-TiN coated mixed ceramic with a matrixof Al2O3 (70%): TiC (30%) +TiN. The inserttypes were SNGA 120408 and SNGA 120412.AISI 8660 is a high carbon, chromium-nickel-molybdenum alloy steel with high hardnessand strength and is suitable for springs andaxle shafts. The work pieces were in the formof cylinders of 52 mm diameter and 220 mmlength. The standard heat treatment processto specimens was applied under watercondition and the average hardness measuredwas about 50 HRC. These bars are machinedunder dry condition. The equipment used formeasuring the surface roughness was asurface roughness tester, MAHR Perthometer-
M1 type of portable. The surface roughnessmeasures used is the arithmetic meandeviation of the surface roughness of profile,Ra. In collecting the surface roughness dataof the shaft with the surface profilometer, threemeasurements were taken along the shaft axisfor each sample with the measurements beingabout 120° apart. Figure 20 shows factorlevels and their interactions on Ra.
Figure 20: Factor Levels and TheirInteractions on Ra
Source: Lazarevic et al. (2012)
The obtained results indicate that the feedrate was found to be the dominant factoramong controllable factors on the surfaceroughness, followed by depth of cut and tool’snose radius. However, the cutting speedshowed an insignificant effect. Furthermore,the interaction of feed rate/depth of cut wasfound to be significant on the surface finish dueto surface hardening of steel. Moreover, thesecond order regression model also showsthat the predicted values were very close tothe experimental one for surface roughness.
Salvi et al. (2013) focused on hard turningof 20 MnCr5 Steel. The purpose of this paper

111
Int. J. Mech. Eng. & Rob. Res. 2014 Govindan P and Vipindas M P, 2014
is to analyze optimum cutting conditions to getlowest surface roughness in turning of 20MnCr5 Steel. Taguchi method has been usedfor this. Table 6 shows the parameters and theirlevels used for the experiment. An Orthogonalarray, the signal to noise ratio and analysis ofvariance (ANOVA) are employed toinvestigate the cutting characteristics. Thecutting insert used is ceramic based TNGA160404. ACE Jobber Jr.lathe machine wasused to test cut the hardened material. TaylorHobson Surtronic 3+ portable surfaceprofilometer is used to measure surfaceroughness of the work piece machine duringexperiment. The cutting tool (insert) used forthis experiment is supplied by Sandwich. Theinsert used is TNGA160404. It is a ceramicbased cutting tool. Cutting tool is ideal forfinishing to general machining of most workpiece materials at higher speeds. It was placedon a right-hand tool holder with a designationof MCLNR 2525M12. The results indicate thatfeed rate has significant role to play inproducing lower surface roughness followedby cutting speed. When the feed speedincreases the Ra values also increases.
speed, feed and depth of cut) withconsideration of surface roughness.Significant factors affecting surface roughnesswere identified, and the optimal cuttingcombination was determined by seeking thebest surface roughness (response) and S/Nratio. Using multiple regression theexponential, first order linear and second orderprediction models were obtained to find thecorrelation between surface roughness andindependent variables. Finally, confirmationtests verified that the Taguchi design wassuccessful in optimizing turning parameters forsurface roughness. Figure 21 shows Signal-to-Noise graph for parameters. Cutting speedhad insignificant influence on surfaceroughness. The contributions are in thefollowing order: feed rate (56.736%), depth ofcut (41.86%) and then cutting speed (0.214%).The estimated ratio and were calculated usingthe optimal cutting parameters for surfaceroughness.
(Salvi et al. (2013)
Parameters Level 1 Level 2 Level 3
Speed (m/min) 290 175 232.5
Feed (mm/rev) 0.25 0.15 0.2
Depth of Cut (mm) 0.4 0.07 0.23
Table 6: Parameters and Their Levels
Franko Puh et al. (2012) applied Taguchimethod to find optimum process parametersfor hard turning of hardened steel AISI 4142using PCBN tool. Orthogonal design (L9),Signal-to-Noise ratio and Analysis of Variance(ANOVA) are applied to study performancecharacteristics of cutting parameters (cutting
Figure 21: Signal-to-Noise Graphfor Parameters
Source: Franko Puh et al. (2012)

112
Int. J. Mech. Eng. & Rob. Res. 2014 Govindan P and Vipindas M P, 2014
The confirmation experiment wasconducted and verified the optimal cuttingparameters. The mean result of theconfirmation test at the optimum condition iswithin confidence interval (0.257-0.294) m.The experiment is considered satisfactorywhen the mean result falls within this limit. Theimprovement of surface roughness from theinitial cutting parameters to the optimal cuttingparameters is about 50% suggesting that theTaguchi parameter design is an efficient andeffective method for optimizing surfaceroughness in a hard turning operation. Theexponential, first order linear and second orderprediction models were obtained usingmultiple regression. The results obtained bymeans of prediction models prove that theycan be used to predict surface roughness inhard turning, within the experimental domain,with a reasonable degree of approximation.
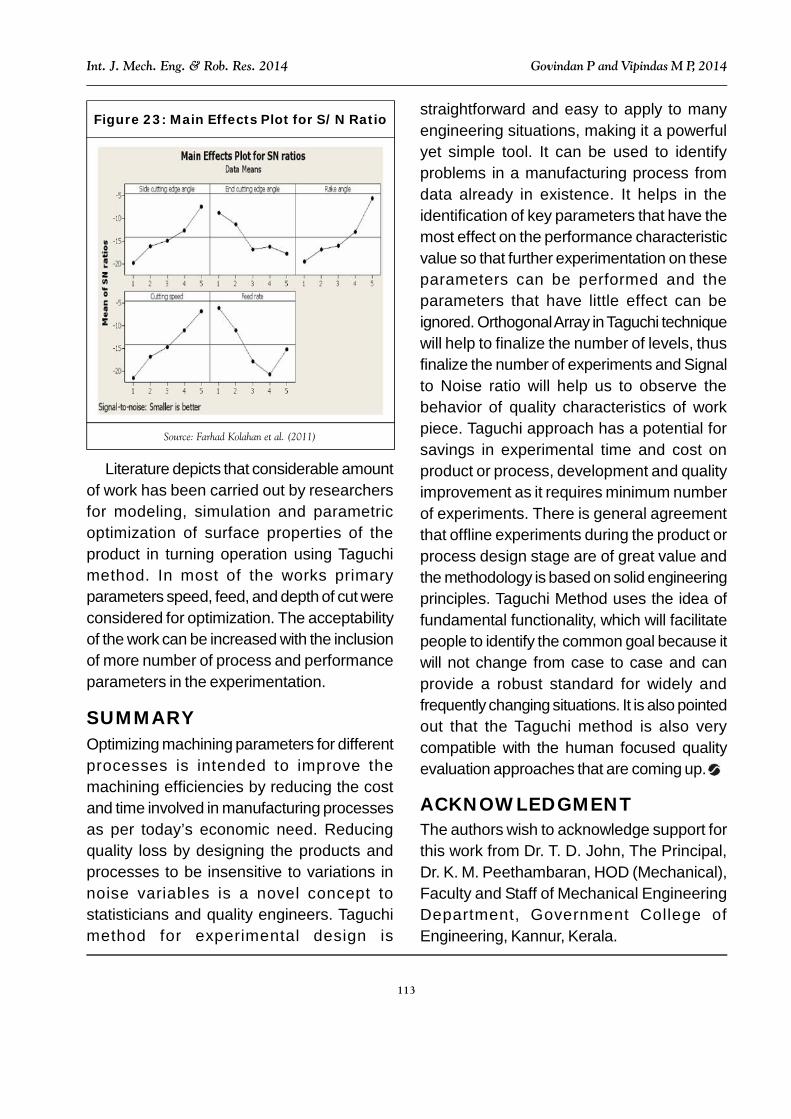
Farhad Kolahan et al. (2011) the mainobjective of this study is to simultaneouslymodel and optimize machining parametersand tool geometry in order to improve thesurface roughness for AISI1045 steel. ATaguchi approach is employed to gatherexperimental data. Then, based on S/N ratio,the best sets of cutting parameters and toolgeometry specif ications have beendetermined. Using these parameters values,the surface roughness of AISI1045 steel partsis minimized. A medium duty lathe with 2 kwspindle power was used to performexperiments. The tool employed inexperiments was HSS (5% Cobalt). This wasselected since the tool angles can beimplemented simply in this kind of cutting tools.The average surface roughness (Ra) in thedirection of the tool movement was measured
in three different places of the machinedsurface using a surface roughness tester,Taylor-Hobson. Several levels of machiningparameters and tool geometry specificationsare considered as input parameters. Thesurface roughness is selected as processoutput measure of performance. The importantcontrolling process parameters and toolgeometry in turning include rake angle , sidecutting edge angle X, end cutting edge angleX’, cutting speed v and feed rate f as shown inFigure 22. In turn depth of cut, nose radius andfree angle are set as constant parameters.
Figure 22: Turning of AISI1045 Steel
Source: Farhad Kolahan et al. (2011)
Figure 23 represents the mean S/N ratiofor the side cutting edge angle, end cuttingedge angle, rake angle, feed rate and cuttingspeed, respectively. The values of the graphsindicate that, based on S/N ratio, the optimalmachining and tool geometry parameters forsurface roughness are x5, x’1, 5, v5 and f1.The results illustrates that feed rate has slightlymore effect on the surface roughness than thecutting speed.
113
Int. J. Mech. Eng. & Rob. Res. 2014 Govindan P and Vipindas M P, 2014
Literature depicts that considerable amountof work has been carried out by researchersfor modeling, simulation and parametricoptimization of surface properties of theproduct in turning operation using Taguchimethod. In most of the works primaryparameters speed, feed, and depth of cut wereconsidered for optimization. The acceptabilityof the work can be increased with the inclusionof more number of process and performanceparameters in the experimentation.
SUMMARYOptimizing machining parameters for differentprocesses is intended to improve themachining efficiencies by reducing the costand time involved in manufacturing processesas per today’s economic need. Reducingquality loss by designing the products andprocesses to be insensitive to variations innoise variables is a novel concept tostatisticians and quality engineers. Taguchimethod for experimental design is
straightforward and easy to apply to manyengineering situations, making it a powerfulyet simple tool. It can be used to identifyproblems in a manufacturing process fromdata already in existence. It helps in theidentification of key parameters that have themost effect on the performance characteristicvalue so that further experimentation on theseparameters can be performed and theparameters that have little effect can beignored. Orthogonal Array in Taguchi techniquewill help to finalize the number of levels, thusfinalize the number of experiments and Signalto Noise ratio will help us to observe thebehavior of quality characteristics of workpiece. Taguchi approach has a potential forsavings in experimental time and cost onproduct or process, development and qualityimprovement as it requires minimum numberof experiments. There is general agreementthat offline experiments during the product orprocess design stage are of great value andthe methodology is based on solid engineeringprinciples. Taguchi Method uses the idea offundamental functionality, which will facilitatepeople to identify the common goal because itwill not change from case to case and canprovide a robust standard for widely andfrequently changing situations. It is also pointedout that the Taguchi method is also verycompatible with the human focused qualityevaluation approaches that are coming up.
ACKNOWLEDGMENTThe authors wish to acknowledge support forthis work from Dr. T. D. John, The Principal,Dr. K. M. Peethambaran, HOD (Mechanical),Faculty and Staff of Mechanical EngineeringDepartment, Government College ofEngineering, Kannur, Kerala.
Figure 23: Main Effects Plot for S/N Ratio
Source: Farhad Kolahan et al. (2011)

114
Int. J. Mech. Eng. & Rob. Res. 2014 Govindan P and Vipindas M P, 2014
REFERENCES1. Abhang L B and Hameedullah M (2010),
“Chip-Tool Interface TemperaturePrediction Model for Turning Process”,International Journal of EngineeringScience and Technology, Vol. 2, No. 4,pp. 382-393.
2. Adarsh Kumar K, Ratnam Ch, Murthy B SN and Satish Ben B (2012), “Optimizationof Surface Roughness in Face TurningOperation in Machining of EN-8”,International Journal of EngineeringScience & Advanced Technology, Vol. 2,No. 4, pp. 807-812.
3. Akhyar G, CheHaron C H and Ghani J A(2008), “Application of Taguchi Method inthe Optimization of Turning Parameters forSurface Roughness”, InternationalJournal of Science Engineering andTechnology, Vol. 1, No. 3, pp. 60-66.
4. Ali Riza Motorcu (2010), “TheOptimization of Machining ParametersUsing the Taguchi Method for SurfaceRoughness of AISI 8660 Hardened AlloySteel”, Journal of MechanicalEngineering, Vol. 56, No. 6, pp. 391-401,UDC 669.14:621.7.015: 621.9.02.
5. Anirban Bhattacharya, Santanu Das andMajumder P (2009), “Ajay Batish,Estimating the Effect of CuttingParameters on Surface Finish and PowerConsumption During High SpeedMachining of AISI 1045 Steel UsingTaguchi Design and ANOVA”, Prod. Eng.Res. Devel., Vol. 3, pp. 31-40.
6. Asilturk I and Akkus H (2011),“Determining the Effect of CuttingParameters on Surface Roughness in
Hard Turning Using the Taguchi Method”,Measurement, Vol. 44, pp. 1697-1704.
7. Aslan E, Camuscu N and Birgoren B(2007), “Design Optimization of CuttingParameters When Turning Hardened AISI4140 Steel (63 HRC) with Al2O3+TicnMixed Ceramic Tool”, Mater. Des., Vol. 28,pp. 1618-1622.
8. Azouzi R and Guillot M (1998), “On-LineOptimization of the Turning Using anInverse Process Neuro ControllerTranslation”, ASME Journal ofManufacturing Science andEngineering, Vol. 120, pp. 101-107.
9. Ballal Yuvaraj P, Inamdar K H and Patil PV (2012), “Application of Taguchi Methodfor Design of Experiments in Turning GrayCast Iron”, International Journal ofEngineering Research and Applications(IJERA), Vol. 2, No. 3, pp. 1391-1397,ISSN: 2248-9622.
10. Barker T B (1990), Engineering QualityBy Design, Marcel Dekker, New York.
11. Basim A Khidhir and Bashir Mohamed(2011), “Analyzing the Effect of CuttingParameters on Surface Roughness andTool Wear When Machining Nickel BasedHastelloy–276”, IOP Conf. Series:Materials Science and Engineering,Vol. 17, pp. 012-043.
12. Benardos P G and Vosniakos G C (2003),“Predicting Surface Roughness inMachining: A Review”, InternationalJournal of Machine Tools &Manufacture, Vol. 43, pp. 833-844.
13. Benton W C (1991), “Statistical ProcessControl and the Taguchi Method: A

115
Int. J. Mech. Eng. & Rob. Res. 2014 Govindan P and Vipindas M P, 2014
Comparative Evaluation”, Int. J. Prod.Res., Vol. 29, pp. 1761-1770.
14. Bouacha K, Yallese M A, Mabrouki T andRigal J F (2010), “Statistical Analysis ofSurface Roughness and Cutting ForcesUsing Response Surface Methodology inHard Turning of AISI 52100 Bearing Steelwith CBN Tool”, Int. J. Refract. Met. Hard,Vol. 28, No. 3, pp. 349-361.
15. Byrne D M and Taguchi S (1987), “TheTaguchi Approach to Parameter Design”,Quality Progress, Vol. 20, pp. 19-26.
16. Choudhury I A and El-Baradie M A (1997),“Surface Roughness Prediction in theTurning of High Strength Steel by FactorialDesign of Experiments”, Journal ofMaterials Processing Technology ,Vol. 67, pp. 55-67.
17. Cus F and Balic J (2000), “Selection ofCutting Conditions and Tool Flow in FlexibleManufacturing System”, The InternationalJournal for Manufacturing Science andTechnology, Vol. 2, pp. 101-106.
18. Daniel Kirby E (2006), “A ParameterDesign Study in Turning Operation UsingTaguchi Method”, The TechnologyInterface/Fall.
19. Davim J P and Figueira L (2007),“Machinability Evaluation in Hard Turningof Cold Work Tool Steel (D2) withCeramic Tools Using StatisticalTechniques”, Mater. Des., Vol. 28, No. 4,pp. 1186-1191.
20. Farhad Kolahan, Mohsen Manoochehriand Abbas Hosseini (2011),“Simultaneous Optimization of MachiningParameters and Tool Geometry
Specifications in Turning Operation ofAISI1045 Steel”, World Academy ofScience, Engineering and Technology,Vol. 50.
21. Finnie I (1956), “Review of the Metal-Cutting Analysis of the Past HundredYears”, Mech. Eng., Vol. 78, pp. 715-721.
22. Franko Puh, Toni Segota and ZoranJurkovic (2012), “Optimization of HardTurning Process Parameters with PCBNTool Based on the Taguchi Method”,Technical Gazette, Vol. 19, No. 2,pp. 415-419.
23. Gilbert W W (1950), “Economics ofMachining-Machining Theory andPractice”, American Society of Metals,pp. 465-485.
24. Hasnul Hadi, Liyana Tajul, Zailani Z A,Hamzas M F M A and Hussin M S (2011),“The Parametric Effect and Optimizationon JIS S45C Steel Turning”, InternationalJournal of Engineering Science andTechnology (IJEST), Vol. 3, No. 5.
25. Jitendra Verma (2012), “TurningParameter Optimization for SurfaceRoughness of ASTMA242 Type-1 AlloySteel by Taguchi Method”, InternationalJournal of Advances in Engineering &Technology.
26. Kacal A and Gulesin M (2011),“Determination of Optimal CuttingConditions in Finish Turning ofAustempered Ductile Iron Using TaguchiDesign Method”, J. Sci. Ind. Res. India,Vol. 70, pp. 278-283.
27. Kackar R N and Shoemaker A C (1986),“Robust Design: A Cost Effective Method

116
Int. J. Mech. Eng. & Rob. Res. 2014 Govindan P and Vipindas M P, 2014
for Improving Manufacturing Processes”,AT & TTech. J., Vol. 65, March-April,pp. 39-50.
28. Kaladhar M, Venkata Subbaiah K,Srinivasa Rao Ch. and Narayana Rao K(2012), “Determination of OptimumProcess Parameter During Turning ofAISI 304 Austenitic Stainless Steel”,International Journal of Lean Thinking,Vol. 3, No. 1.
29. Kamaraj Chandrasekaran, PerumalMarimuthu and Raja K (2012), “ComputerNumerical Control Turning on AISI410 withSingle and Nano Multilayered CoatedCarbide Tools Under Dry Conditions”,Vol. 2, No. 2, pp. 75-81.
30. Kandananond K (2009), “Characterizationof FDB Sleeve Surface Roughness Usingthe Taguchi Approach”, European Journalof Scientific Research, Vol. 33, No. 2,pp. 330-337.
31. Kassab S Y and Khoshnaw Y K (2007),“The Effect of Cutting Tool Vibration onSurface Roughness of Work Piece in DryTurning Operation”, Engineering andTechnology, Vol. 25, No. 7, pp. 879-889.
32. Khalil Aslam Awan and Yasir A Hadi(2008), “Prediction of Al and Cu SurfaceRoughness Based Regression AnalysisModel”, VI Mation Journal, Knowledge,Service & Production: IT as an Enabler,No. 1, pp. 32-39.
33. Kilickap E, Cakir O, Aksoy M and Inan A(2005), “Study of Tool Wear and SurfaceRoughness in Machining ofHomogenised Sic-P ReinforcedAluminium Metal Matrix Composite”,
Journal of Materials ProcessingTechnology, Vol. 164-165, May 15,pp. 862-867.
34. Kim H S (2010), “A Combined FEA andDesign of Experiments Approach for theDesign and Analysis of Warm Forming ofAluminium Sheet Alloys”, InternationalJournal of Advanced ManufacturingTechnology, Vol. 51, Nos. 1-4, pp. 1-14.
35. Kopac J, Bahor M and Sokovic M (2002),“Optimal Machining Parameters forAchieving the Desired SurfaceRoughness in Fine Turning of Cold Pre-Formed Steel Work Pieces”,International Journal of Machine Toolsand Manufacture, Vol. 42, pp. 707-716.
36. Krathikeyan R (2006), “Assessment ofFactors Influencing Surface Roughness onthe Machining of Glass – ReinforcedPolymer Composites”, Journal of Materialsand Design, Vol. 27, pp. 862-871.
37. Lan T S and Wang M Y (2009), “CompetitiveParameter Optimization of Multi-QualityCNC Turning”, International Journal ofAdvanced Manufacturing Technology,Vol. 41, Nos. 7-8, pp. 820-826.
38. Lazarevic D, Madic M, Jankovic P andLazarevic A (2012), “Cutting ParametersOptimization for Surface Roughness inTurning Operation of Polyethylene (PE)Using Taguchi Method”, Tribology inIndustry, Vol. 34, No. 2, pp. 68-73.
39. Lin Paul K H, Sullivan L P and Taguchi G(1990), “Taguchi Methods in QualityEngineering”, Quality Progress, pp. 55-59.
40. Mahendra Korat and Neeraj Agarwal(2012), “Optimization of Different

117
Int. J. Mech. Eng. & Rob. Res. 2014 Govindan P and Vipindas M P, 2014
Machining Parameters of En24 Alloy Steelin CNC Turning by Use of TaguchiMethod”, International Journal ofEngineering Research and Applications(IJERA), Vol. 2, No. 5, pp.160-164,ISSN: 2248-9622.
41. Marinkovic Velibor and MadicMilos (2011),“Optimization of Surface Roughness inTurning Alloy Steel by Using TaguchiMethod”, Scientific Research and Essays,Vol. 6, No. 16, pp. 3474-3484.
42. Merchant M E (1998), “Interpretative Lookon 20th Century Research on Modeling ofMachining”, Mach. Sci. Technol., Vol. 2,pp. 157-163, doi: 10.1080/10940349808945666.
43. Mustafa Gunaya and Emre Yucel (2012),Application of Taguchi Method forDetermining Optimum SurfaceRoughness in Turning of High-Alloy WhiteCast Iron”, Elsevier Measurement.
44. Nalbant N, Gokkaya H and Sur G (2007),“Application of Taguchi Method in theOptimization of Cutting Parameters forSurface Roughness in Turning”, Materialsand Design, pp. 1379-1385.
45. Neseli S Yaldýz and Turkes E (2011),Optimization of Tool Geometry Parametersfor Turning Operations Based on theResponse Surface Methodology”,Measurement, Vol. 44, No. 3, pp. 580-587.
46. Palanikumar, Karunamoorthy L andPignatiello J J (1988), “An Overview of theStrategy and Tactics of Taguchi”, Inst. Ind.Eng. Trans., Vol. 20, pp. 247-254.
47. Philip Selvaraj D and Chandramohan P(2010), “Optimization of Surface
Roughness of AiSi 304 AusteniticStainless Steel in Dry Turning OperationUsing Taguchi Design Method”, Journalof Engineering Science andTechnology, Vol. 5, No. 3, pp. 293-301.
48. Ross P J (1996), Taguchi Techniques forQuality Engineering: Loss Function,Orthogonal Experiments, Parameter andTolerance Design, 2nd Edition, McGraw-Hill, New York.
49. Roy R K (2001), “Design of ExperimentsUsing the Taguchi Approach: 16 Steps toProduct and Process Improvement”,Wiley, New York.
50. Sahoo P, Barman T K and Routara B C(2008), “Taguchi Based PracticalDimension Modelling and Optimization inCNC Turning”, Advance in ProductionEngineering and Management, Vol. 3,No. 4, pp. 205-217.
51. Salvi S B, Deshmukh R R and DeshmukhS D (2013), “Analysis of SurfaceRoughness in Hard Turning by UsingTaguchi Method”, International Journal ofEngineering Science and Technology(IJEST), Vol. 5, No. 02.
52. Senthilkumaar J S, Selvarani P andArunachalam R M (2010), “Selection ofMachining Parameters Based on theAnalysis of Surface Roughness and FlankWear in Finish Turning and Facing ofInconel 718 Using Taguchi Technique”,Emirates Journal for EngineeringResearch, Vol. 15, No. 2, pp. 7-14.
53. Shirpurkar P P, Bobde S R, Patil V V andKale B N (2012), “Optimization of TurningProcess Parameters by Using Tool

118
Int. J. Mech. Eng. & Rob. Res. 2014 Govindan P and Vipindas M P, 2014
Inserts—A Review”, International Journalof Engineering and InnovativeTechnology (IJEIT), Vol. 2, No. 6.
54. Somashekara H M and LakshmanaSwamy N (2012), “Optimizing SurfaceRoughness in Turning Operation UsingTaguchi Technique and Anova”,International Journal of EngineeringScience and Technology (IJEST), Vol. 4,No. 5.
55. Sreenivasa Murthy T, Suresh R K,Krishnaiah G and Diwakar Reddy V(2013), “Optimization of ProcessParameters in Dry Turning Operation ofEN 41B Alloy Steels with Cermet ToolBased on the Taguchi Method”,International Journal of EngineeringResearch and Applications (IJERA),pp. 1144-1148.
56. Sriraman V (1996), “A Primer on theTaguchi System of Quality Engineering”,The Journal of Technology Studies,Vol. 22, No. 2, pp. 64-66.
57. Taguchi G (1986), “Introduction to QualityEngineering”, Proceedings of AsianProductivity Organization, UNIPUB, WhitePlains, New York.
58. Taylor F W (1907), “On the Art of CuttingMetals”, Transactions of the AmericanSociety of Mechanical Engineers ,Vol. 28, pp. 31-35.
59. Thamizhmanii S, Saparudin S andHasan S (2007), “Analysis of SurfaceRoughness by Using Taguchi Method”,Achievements in Materials andManufacturing Engineering, Vol. 20,Nos. 1-2, pp. 503-505.
60. Van C A, Luhervelt T H C, Childs I S,Jawahir F Klocke and Venuvinod P(1998), “Present Situation & FutureTrends Modeling of Machining OperationsProgress Report of the CIRP WorkingGroup ‘Modelling of MachiningOperations’ Analysis of the CIRP”, Vol. 47,No. 2, pp. 587-626.
61. Venkata Ramana M, Srinivasulu K andKrishna Mohana Rao G (2011),“Performance Evaluation and Selection ofOptimal Parameters in Turning of Ti-6Al-4V Alloy Under Different CoolingConditions”, International Journal ofInnovative Technology & CreativeEngineering, Vol. 1, No. 5.
62. Wu V (1982), “Off-Line Quality Control:Japanese Quality Engineering”, AmericanSupplier Institute, Dearborn, MI.
63. Yanda H, Ghani J A, Rodzi M N A M,Othman K and Haron C H C (2010),“Optimization of Material Removal Rate,Surface Roughness and Tool Life onConventional Dry Turning of Fcd700”,International Journal of Mechanical andMaterials Engineering, Vol. 5, No. 2,pp. 182-190.
64. Yang W H and Tang Y S (1998), “DesignOptimization of Cutting Parameters forTurning Operations Based on the TaguchiMethod”, Journal of Materials ProcessingTechnology, Vol. 84, pp. 122-129.
65. Zhang J Z, Chenb J C and Kirby E D(2007), “Surface Roughness Optimizationin an End-Milling Operation Using theTaguchi Design Method”, Journal ofMaterials Processing Technology ,Vol. 184, pp. 233-239.