surface sample bias and clast fabric interpretation based ... · surface sample bias and clast...
TRANSCRIPT

Surface Sample Bias and Clast Fabric Interpretation Based on Till, Ditch Plains, Long Island
Elliot C. Klein and Dan M. Davis Department of Geosciences, State University of New York at Stony Brook, Stony Brook,
NY 11794
Abstract
Quantitative clast fabric analysis, despite its limitations, is a useful analytical tool in glacigenic sediment studies. More powerful than graphical methods, eigenanalysis allows quantification of otherwise descriptive three-dimensional fabrics. In conjunction with the orientation of the long-axes, short-axes preferred direction can further establish the nature of shear, emplacement, and deposition in glacigenic settings. Field measurement, however, produces a systematic sampling bias in favor of pebbles normal to outcrop surface. This sampling bias is a function of the orientation of outcrop surface to the fabric and can affect the perceived fabric strength (eigenvalues) enough to influence interpretation. We use simple calculations and numerically generated random pebble populations to quantify this bias and we find that it is greatest for those pebbles best suited to fabric analysis (those that are rod-like in shape). The effect of this surface bias can be mitigated with careful sampling and interpretation. Fortunately, its effect upon strong fabric orientation (eigenvectors) is generally small.
Clast Fabric Analysis in Glacial Sediment
The manner in which glacigenic clasts are arranged provides outcrop-scale information that may help to constrain the physical dimensions of stratigraphic units and also provides clues to the nature and sequence of glaciotectonic and depositional processes. A quantitative description of a clast fabric, defining the degree of preferred orientation observed in exposed diamict settings, is obtained by a combination of field measurement and vector analysis (e.g., Mark, 1974). The statistical description of a glacigenic sediment clast fabric reflects the effect of both depositional conditions and the subsequent strain, in principle enabling the differentiation of the structural contrasts recorded in glaciotectonic shear zones. Published research (e.g., Dowdeswell et al., 1985; Dowdeswell and Sharp, 1986; Lawson, 1979) on a variety of glacial diamict deposits has shown a broad range of preferred clast orientations, producing fabrics of strengths that differ with depositional setting. The glacigenic settings which produce these differing results range from weakly organized clast orientations (e.g., water-lain glacigenic sediment) preserved during outwash deposition to highly uniform lineations (e.g., subglacial melt-out till) generated by well-developed shear zones that are later preserved during subglacial melt-out deposition from motionless glacial ice. The magnitude of clast orientation preference is a measure of the degree to which all preserved and observed clasts measured are aligned subparallel to a unique direction. Strongly organized, highly

anisotropic clast orientations derived from subglacial-meltout or lodgment processes are typically subparallel with local ice flow direction (e.g., Lawson, 1979; Dreimanis, 1999). Fabric strength generally decreases as water content in the sediment-ice mixture increases. Clast fabric is not uniquely indicative of sediment genesis, but can be an indicator of relative strain within a stratigraphic unit (e.g., Bennett, et al. 1999; Karlstom, 2000).
We have studied glacigenic sediments at a site within the Ronkonkoma Moraine of Long Island, New York. Our field area, Ditch Plains, roughly 5 kilometers west of Montauk Point on the south fork of eastern Long Island (Fig. 1), is spaced along several kilometers of the shoreline. Bluffs and vertical exposures outcrop at heights as great as 10 to 15 meters, as the Ronkonkoma Moraine resists erosion caused by ocean surf and other weathering processes. We interpret the general stratigraphy to include two distinctive glacial diamict deposits. A massive upper diamict unit (Dmm) overlies a lower stratified diamict unit (Dms), (e.g., Klein, et. al., 1998, 2001).
In clast fabric analysis, each individual clast may be approximated by a triaxial ellipsoid with three mutually orthogonal principal axes. It is convenient to determine such principal axes for each clast by first measuring the length and orientation of the longest axis through the clast center. The lengths and orientations of two mutually perpendicular and orthogonal axes to the established long axis orientation can then be established and recorded. We record the orientation (bearing and plunge) of any two of these principal axes, from which we can calculate the third. The bulk fabric information gleaned from in-situ measurement of axial orientations for a given number of clasts (vectors) in a clast distribution is transformable into a three-dimensional orientation tensor (e.g., Mark, 1973; Woodcock, 1977). The elements of the orientation tensor, defined in a 3 x 3 symmetric matrix, indicate the degree to which a particular clast axis (this technique is usually applied to the long axis) tends to align in a given direction. Clast shape can play a significant role in the determination of a clast orientation. Rod-like clast shapes, however, have an obvious long axis orientation, allowing them to contribute to a more robust orientation tensor.
The analytical solution obtained by eigenanalysis determines three normalized eigenvalues (a maximum, an intermediate, and a minimum) and assigns one eigenvalue to each one of three mutually perpendicular preferred eigenvector directions. These eigenvectors can be thought of as the most, intermediate, and least preferred clast-vector directions (all mutually perpendicular). The corresponding normalized eigenvalues describe the degree of preference for each of these directions. For example, a normalized eigenvalue equal to one would mean that all axes point exactly that way, while an eigenvalue of zero would indicate that they are all 90º from that direction. Three-dimensional eigenvalue analysis in glacially-derived diamicts has been used by a number of researchers studying clast fabrics as a diagnostic tool intended to deduce the genetic origin of glacial deposits (e.g., Mark, 1974, Lawson 1979; Dowdeswell et al., 1985; Rappol, 1985; Dowdeswell and Sharp, 1986; Benn, 1994, Ham and Mickelson, 1994; Hicock et al., 1996; Larsen et al., 1999; Kjaer et al., 2001) and to infer relative strain within glacigenic sediments (e.g., Hicock, 1992; Hart, 1994; Benn, 1995; Benn and

Evans, 1996; Rijsdijk, 2001). Clast shapes affect the nature and strength of the clast orientation fabric. If a is the long axis, b the intermediate axis, and c is the short axis for a particular clast, then the clast shape is defined as a rod if a>b≈c, a disc if a≈b>c, a blade if a>b>c, or a spheroid if a≈b≈c (e.g., Zingg, 1935; Sneed and Folk, 1958). Spheres have infinite combinations of three mutually perpendicular axes so spheroidal clasts make a very weak fabric, have no preferred directions, and indicate little about emplacement or strain. Glacigenic deposits composed exclusively of sediment of extreme textural maturity are therefore the poorest targets for clast fabric analysis. Rod-like clasts are often the easiest shapes in the field to measure, so they are the most ideal shapes for the determining long axis orientation.
Figure 1. Map of Long Island. Shaded in gray are the Harbor Hill and Ronkonkoma moraines. Ditch Plains field study area is indicated by the small black dot on the south fork.
A more complete description of clast fabric includes the clast short-axis directions since it is equally possible to study the distribution of long or short axes, although the literature emphasizes long axis orientations, particularly for blunt rods (aspect ratio a:b of at least 3:2) (e.g., Bennett et al., 1999; Kjaer and Krüger, 1998; Krüger and Kjaer, 1999; Millar and Nelson, 2001a,b). To this date there is limited reporting of measured short axis orientation distributions in glacigenic sediment studies. Combining long axis and short axis orientations of the same set of clasts may permit clearer discernment of the nature of shear responsible for emplacement of the clasts. A clast fabric describing short axis orientations for a set of blade-like (triaxial) clasts (a>b>c) may help in identifying pure shear uniaxial shortening. For example, if a randomly oriented clast set is subjected to

pure uniaxial compression, then the clasts long axes will tend to girdle in orientations radially normal to the compression direction and the clasts short axes orientations will be apt to cluster subparallel to the compression direction. For simple shear, long axes tend to cluster in the shear direction (e.g., Dreimanis, 1999), although some studies describe quasiperoidic behavior (e.g., Lindsay, 1968).
The short axis direction of the clasts measured at Ditch Plains have a great propensity for being aligned nearly vertical. This, like the long axis orientation, is consistent with emplacement and subsequent shear from the north due to glacial advance. The short axes of 141 of the 150 Ditch Plains clasts cluster on a stereonet in a near-vertical orientation more tightly aligned than the long axes (Fig. 2). The distribution of the long and short axial orientations of the Ditch Plains clasts is suggestive of a well-developed fabric, enhanced by considerable shear.
Figure 2. A. Equal-area steronet projection of 141 short-axis clast orientations recorded in the stratified diamict unit at Ditch Plains. B. Equal-area steronet projection of 150 long-axis clast orientations (including the long-axis orientations of the 141 clasts in figure 2A) observed in the stratified diamict unit. Note; north is located at the top of each of steronet diagram and that the steronets are contoured at 2% intervals for 1% area.
Although glacial ice might be responsible for clast fabric generation and the subsequent deposition of lodgement, deformation, and subglacial-meltout tills from its basal zone, direct evidence for regional ice movement can not easily be delineated by fabric geometry exclusively. For instance, ice-marginal moraines formed by many locally

small and structurally complex ice tongues may introduce so much genetic (modal) and directional variability that it is often not possible to establish a single local ice movement direction (e.g., Dreimanis, 1999). Inferring strain accumulation during the emplacement of glacial diamicts is a formidable challenge. Many kilometers of ice may, before melting, shear past a point very near the front of the moraine, leaving no further trace. An indeterminate amount of that shear may occur in the ice, as opposed to the sediments. For these reasons, absolute strain levels may not be recorded clearly in sediments. Therefore, clast fabric analysis is best suited as a relative (as opposed to absolute) strain indicator within a single set of glacial sediment deposits (e.g., Bennett et al., 1999).
Reconstruction of shear as recorded in quantitative clast fabric analysis opens up the possibility of mapping patterns of glaciomechanical strain. It is possible with eigenanalysis to map the directional changes associated with ice movements and to relate sediment emplacements to depositional processes that are evident in more traditional examination of the outcrop. Researchers (e.g., Hart, 1998) have sought to correlate quantitative measures of clast fabrics with shear zones.
In most subglacial tills, preferred direction is parallel with the movement of ice and the clasts preferentially plunge upglacier (e.g., Krüger, 1970; Dreimanis, 1999). The preferred long axis eigenvector (342°, 06°) obtained by eigenanalysis for the stratified diamict unit at Ditch Plains suggests that the pebble orientation in that unit may be subparallel with the Pleistocene ice flow direction believed to be from the NNW (Klein and Davis, 2001). The short axes of these clasts predominately plunge steeply north (upglacier) which suggests that the long and short axes directions are not orthogonal. We infer that the stratified diamict unit originated by subglacial melt-out deposition in the local direction of glacier movement based on the strongly preferred orientations of the long and short axes.
A clast fabric is a bulk volume property requiring careful sampling acquisition and statistical interpretation. Randomness of the sample is assumed when performing eigenanalysis and the resultant eigenvectors obtained from the analysis are constrained to be orthogonal although the most and least preferred directions do not need to be normal to each other. Furthermore, because nearly equal eigenvalues yield a girdle of unresolved vectors making impossible a distinction of orthogonal directional preference, the eigenvalue S3 found for long axes eigenanalysis is not necessarily the preferred direction (S1) for the short axes.
Sample Surface Bias Since clast fabrics are a bulk volume property, one ideally measures all clasts in a
defined volume of an outcrop. This, however, is usually not possible. More commonly, clast orientations recorded from at and near an outcrop surface plane are assumed to represent statistically the clast fabric of an associated unit volume (e.g., Benn and Ringrose, 2001). Clast orientations more likely will be preserved in a cohesive matrix containing a high proportion of clay and silt-size particles with relatively tightly packed pore spaces. The best outcrops for measuring clast orientation are quite hard, making

them resistant to late slumping and facilitating accurate determination of orientations. Unfortunately, hardness also makes deep excavation difficult. Therefore, measurements are often constrained to at and near exposed surfaces.
Investigators commonly sample as many clast orientations as possible in order to maximize data sets and minimize random measurement errors, but do so with limited excavation. Such surficial (rather than volumetric) sampling can lead to a systematic sampling bias (e.g., Millar and Nelson, 2001a,b). Furthemore, the surface sampling bias can skew by a large degree (dependent on true eigenvalue) the eigenvalues reported in eigenvalue studies of fabric shape. Eigenvectors determined by eigenanalysis are much less susceptible to this bias than are eigenvalues especially if S1>>S2. The likelihood of sampling an individual clast depends on the angle that its long-axis makes with the plane of an exposed outcrop surface. As a diamict outcrop erodes, more and more clasts are gradually exposed. The long axis of a rod-like clast aligned parallel to the strike direction of an eroding outcrop surface will fall out of an outcrop significantly sooner after first exposure than would the equivalent clast with its long-axis direction oriented normal to the exposed surface. The determination of clast fabric strength from clast orientations recorded at an outcrop surface therefore contains an intrinsic bias, because elongated clasts aligned parallel with an eroding outcrop surface will be undersampled and elongated clasts oriented normal to the eroding surface will be oversampled (Fig. 3). Clast orientation sampling can be termed volumetric if outcrop material is excavated to a distance much greater than the mean particle size of the clasts being measured. Absent such excavation, the bias inherent in surface sampling will inevitably appear in the data. The magnitude of the surface sampling bias and its effect on the apparent strength of a long-axis clast fabric is not only a function of the angle made between the preferred volumetric long-axis direction of the recorded clast orientations and the orientation of the eroding outcrop surface but it is also a function of the average clast aspect ratio measured therein.

Figure 3. Three cross sections of a moraine eroding from right to left in a time ordered series. As the outcrop surface gradually erodes clasts oriented normal to the exposed surface are over-sampled, while clasts oriented parallel to the surface are under-sampled. A. Erosion begins at the vertical surface of an outcrop slowly exposing the clasts of a weakly oriented fabric that is composed of equivalent shaped clasts. B. After time, an individual clast with a long-axis orientation closely parallel with the eroding surface falls out of the outcrop while the other clasts remain embedded in the morain. C. As erosion continues, another clast falls out of the outcrop exposure. Three clasts oriented approximately normal to the eroding surface remain cantilevering out from the moraine, and would be over-sampled if recorded. The two clasts orientations that had been oriented nearly parallel to the outcrop surface would be under-sampled since these orientations could no longer be recorded.
Sphere-like clasts have no bias, but they also convey no directional information. Elongate rods: with aspect ratio approaching infinity (c≈b<<a) are the ideal clasts to indicate lineation fabric (e.g., Millar and Nelson, 2001b). Because of erosion, rods parallel to outcrop surface erode away almost as soon as they appear, but those with long axes normal to the outcrop surface are preferentially exposed. Waterlain glacigenic sediments and flow tills are deposits that are particularly vulnerable to the affect of sampling bias. These settings produce weak fabrics (e.g., Lawson, 1979) which could be misidentified as moderately well-developed fabrics if the sample of elongated clasts are limited to those visible at or near the outcrop surface.
The probability of a clast being observed in situ depends upon the period of time over which it is exposed at the surface. Clasts with their shortest axes normal to the eroding outcrop surface will be removed by erosion quite soon after they are first

exposed. Relatively few such clasts will be observed at any given time. Conversely, pebbles with their long axes normal to the eroding outcrop surface will be exposed over an extended period time before they are removed. They will be relatively over-represented in field studies. We will assume that each clast is ellipsoidal and that it remains embedded in the outcrop until some fraction of its volume (here, we assume ½) is exposed. Results seem to depend only weakly upon this assumption. The degree to which clasts of a given orientation are over- or under-represented in a surficial sample can then be calculated as a function of the orientation of its axes with respect to the surface. If the erosion rate is either constant or random over time, we can calculate this degree of preference simply by determining the projection of the pebble normal to the outcrop surface.
Quantifying the Bias in Limiting Cases We use numerical methods and “Monte Carlo” calculations to quantify the sample
bias due to recording clast orientations from an outcrop surface. For simplicity, it is assumed that clasts are sufficiently widely spaced so that their interactions can be ignored. Each clast is treated as an ellipsoid of rotation, (either b=a or b=c). Larger clasts are obviously exposed longest but for any given size clast, shape and orientation also matter.
In our Monte Carlo calculations, we randomly ‘create’ thousands of rod-like clasts per numerical experiment. For each experiment we assume a uniform clast size and aspect ratio (a/c), as well as a prescribed true anisotropy in clast orientation introduced by modifying the random statistics to produce a ‘preferred’ fabric. We then define an outcrop surface orientation anywhere from normal to parallel to the fabric axis. We calculate the true eigenvalues and eigenvectors of this synthetic clast data set, as if observed by deep excavation. Simultaneously, we carry out the same calculations for the population of pebbles exposed at an outcrop surface for each pebble to determine its relative likelihood of appearing on the surface. For each experiment, we calculate for a population of 5,000 pebbles and compare eigenvalues: the true S1, S2, S3 vs. the ‘observed’ S1’, S2’, S3’.
The effect of the bias on the fabric depends on the angular separation (θ) between the most preferred eigenvector direction of the ‘true’ fabric with the orientation of the sampling surface. In addition, the effect is smaller with smaller a:c aspect ratio but still produces a significant sampling bias on clasts with realistic aspect ratios of a:c ≈ 2.5 (Fig. 4). The results of our surface sampling ‘experiments’ show that the sampling bias has very little impact on ‘observed’ eigenvectors of strong fabrics (Fig. 5), which remain fairly stable even though the ‘observed’ eigenvalues are distributed widely. Moderate and weakly preferred surface sampled fabrics can have extreme observational errors in calculated eigenvector direction (Fig. 6). These large errors are reproducible and cast serious doubt on the accuracy of interpreted eigenvector directions that result from clast orientation data sets measured at poorly excavated field sites. ‘True’ eigenvalues of clast

fabrics can not be reproduced from surface sampled clast orientations (Fig. 4, 5, 6 Table 1) but in some instances the eigenvalue ratios of both ‘true’ and ‘observed’ eigenvalues are serendipitously about equal, due to trade-offs among sets of eigenvalue combinations.
Implications for Field Studies The sampling bias associated with clast axes measured in situ has very little
impact on reliable eigenvector determination for strong fabrics. This bias causes deviations from true fabric directions (by a few degrees) that are smaller than the typical uncertainties due to various inevitable observational errors. The effect of the bias on direction is more pronounced for increasingly weak fabrics but is not large (tens of degrees) except for those fabrics which very nearly isotropic. Extremely weak fabrics are inherently variable, giving little preferred orientation information, so they would not typically be used as directional indicators when reconstructing former ice sheet movement even if they were not effected by such a bias.
The sampling bias effect always skews the true eigenvalue distribution. Nearly isotropic distributions can be falsely perceived as only a moderate lineated fabric if observed at a surface that is nearly parallel to the preferred clast long axis. Likewise, moderately clustered lineations can be misidentified either as nearly isotropic fabrics or as fabrics of greater than their true strength. Variability in flow strength and direction is undoubtedly responsible for the large eigenvalue range found for the flow till domain (Fig. 4). The surface sampling bias is by itself, capable of producing spurious results that vary by amounts larger than typically cited sizes of genetic till domain ranges (e.g., Dowdeswell et al., 1985). Figure 4, illustrates the effective eigenvalue range produced by the bias on several data points with aspect ratio a:c = 2.5 and how the magnitude of the eigenvalue bias is larger than the standard deviation ellipses of genetic glacial diamict domains. Thus, ‘observed’ eigenvalues vary greatly because of the surface sampling bias and cannot be relied upon to distinguish genetic glacial diamicts.

Figure 4. (S1, S3) eigenvalue plot of glacigenic diamict fabric domains by standard deviation ellipses (e.g., Dowdeswell et al., 1985). Plotted are computer generated random clast fabric eigenvalue data sets for volume measured fabrics (single data points) along with surface sample bias related observation errors. These eigenvalue observation errors are a function of clast aspect ratio (a.r. = a/c) and angular separation, θ, between the most preferred eigenvector direction of the volume measured fabric and the orientation of the sampling surface. The bias related observation errors plot as individual curves linking eigenvalue combinations calculated and plotted, from the left to right, as individual data points on each curve using values of θ = 90°, 60°, 45°, 30°, and 0°, respectively. Generated data sets are composed of hundred thousand of equivalent shaped clasts all with aspect ratios, a/c = 2.5. In addition, we plot computer generated clast fabric data in order to test the robustness of field data obtained by surface sampling the stratified diamict unit at Ditch Plains (average recorded clast aspect ratio, a/c ≈ 2.5).

Figure 5. Detail of (S1, S3) eigenvalue plot shown in figure 4 along with eigenvector observation errors. In fabrics of modest strength, surface sampled eigenvectors are significantly displaced from the true population (volume measured) eigenvector.
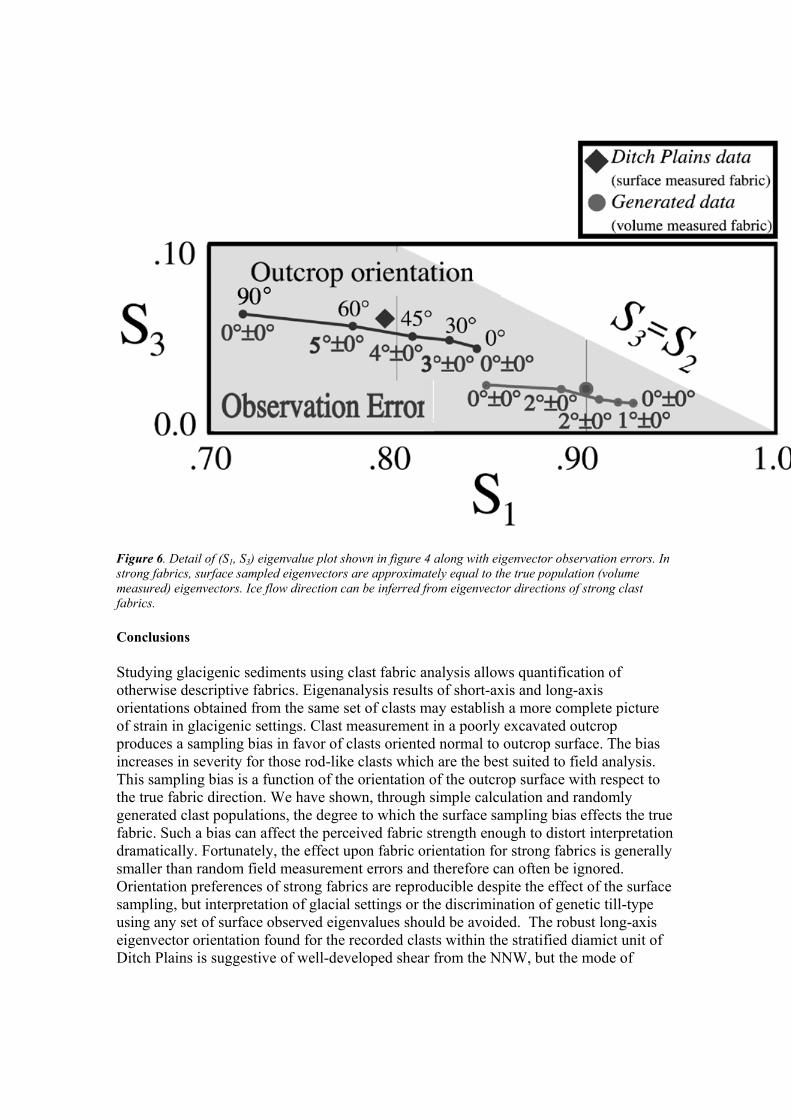
Figure 6. Detail of (S1, S3) eigenvalue plot shown in figure 4 along with eigenvector observation errors. In strong fabrics, surface sampled eigenvectors are approximately equal to the true population (volume measured) eigenvectors. Ice flow direction can be inferred from eigenvector directions of strong clast fabrics.
Conclusions Studying glacigenic sediments using clast fabric analysis allows quantification of otherwise descriptive fabrics. Eigenanalysis results of short-axis and long-axis orientations obtained from the same set of clasts may establish a more complete picture of strain in glacigenic settings. Clast measurement in a poorly excavated outcrop produces a sampling bias in favor of clasts oriented normal to outcrop surface. The bias increases in severity for those rod-like clasts which are the best suited to field analysis. This sampling bias is a function of the orientation of the outcrop surface with respect to the true fabric direction. We have shown, through simple calculation and randomly generated clast populations, the degree to which the surface sampling bias effects the true fabric. Such a bias can affect the perceived fabric strength enough to distort interpretation dramatically. Fortunately, the effect upon fabric orientation for strong fabrics is generally smaller than random field measurement errors and therefore can often be ignored. Orientation preferences of strong fabrics are reproducible despite the effect of the surface sampling, but interpretation of glacial settings or the discrimination of genetic till-type using any set of surface observed eigenvalues should be avoided. The robust long-axis eigenvector orientation found for the recorded clasts within the stratified diamict unit of Ditch Plains is suggestive of well-developed shear from the NNW, but the mode of

emplacement for the diamict still remains speculative. Under the best of circumstance, distinguishing genetic till types by glacial diamict fabric ‘domains’ should only be done under limited, local conditions (e.g., Kjaer and Krüger, 1998; Bennett et al., 1999). Our results restrict the utility of such analyses even further. The effects of the surface sampling bias are averted with careful sampling and interpretation.
Computer generated random clast fabric data sets for volume measured fabrics (eigenvalues and eigenvectors) along with observational errors and standard deviations due to the surface sampling bias. Surface measured eigenvalue combinations and observation errors are based on clast aspect ratio (a.r. =2.5 and = 5.0) and angular separation, θ, (90º, 60º, 45º, 30º, and 0º) between the preferred eigenvector direction and the orientation of the outcrop surface creating the sampling bias.
Table 1 Table 2 Table 3 Table 4 Table 5 Table 6
References Benn, D.I., Fabric shape and the interpretation of sedimentary fabric data, Journal of Sedimentary
Petrology, A64, 910-915, 1994.
Benn, D.I., Fabric signature of subglacial till deformation, Breidamerkurjökull, Iceland, Sedimentology, 42, 735-747, 1995.
Benn, D.I., and D.J. A. Evans, The interpretation and classification of subglacially-deformed materials, Quaternary Science Reviews, 15, 23-52, 1996.
Benn, D.I., and Ringrose, T.J., Random variation of fabric eigenvalues: implications for the use of A-axis fabric data to differentiate till facies, Earth Surface Processes and Landforms, 26, 295-306, 2001.
Bennett, M.R., Waller, R.I., Glasser, N.F., Hambrey, M.J., and Huddart, D., Glacigenic clast fabrics: genetic fingerprint or wishful thinking? Journal of Quaternary Science, 14, 125-135, 1999.
Dowdeswell, J.A., Hambrey, M.J., and Wu R., A comparison of clast fabric and shape in late Precambrian and modern glacigenic sediments, Journal of Sedimentary Petrology, 55, 691-704, 1985.
Dowdeswell, J.A., and Sharp, M.J. Characterization of pebble fabrics in modern terrestrial glacigenic sediments, Sedimentology, 33, 699-710, 1986.
Dreimanis, A., Need for three-dimensional analysis of structural elements in glacial deposits for determination of direction of glacier movement, Geological Society of America, Special Paper 337, 59-67, 1999.
Ham, N.R., and Mickelson, D.M., Basal till fabric and deposition at Burroughs Glacier, Glacier Bay, Alaska, Geological Society of America Bulletin, 106, 1552-1559, 1994.

Hart, J.K., Till fabric associated with deformable beds, Earth Surface Processes and Landforms, 19, 15-32, 1994.
Hart, J.K., The deforming bed/debris-rich basal ice continuum and its implications for the formation of glacial landforms (flutes) and sediments (melt-out till), Quaternary Science Reviews, 17, 737-754, 1998.
Hicock, S.R., and Dreimanis, A., Deformation till in the Great-Lakes region - implications for rapid flow along the south-central margin of the Laurentide Ice Sheet, Canadian Journal of Earth Sciences, 29, 1565-1579, 1992.
Hicock, S.R., Goff, J.R., Lian, O.B., and Little, E.C., On the interpretation of subglacial till fabric, Journal of Sedimentary Research, 66, 928-934, 1996.
Karlstrom, E.T., Fabric and origin of multiple diamictons within the pre-Illinoian Kennedy Drift east of Waterton-Glacier International Peace Park, Alberta Canada, and Montana, USA, Geological Society of America Bulletin, 112, 1496-1506, 2000.
Kjær, K.H., Demidov, I., Houmark-Nielsen, M., and Larsen, E., Distinguishing between tills from Valdaian ice sheets in the Arkhangelsk region, Northwest Russia, Global and Planetary Change, 31, 201-214, 2001.
Kjær, K.H., and Krüger, J., Does clast size influence fabric strength?, Journal of Sedimentary Petrology, 68, 746-749, 1998.
Klein, E., and Davis, D.M., 2001, Long Island clast orientations and what they till us: p.35-40., In “Geology of Long Island and Metropolitan New York”, April 21, 2001, Long Island Geologists, State University of New York, p.128.
Klein, E.C., Meyers, W.J., and Davis, D.M., 1998, Deciphering the origin of diamict deposits at Ditch Plains, Long Island: p.54-63., In “Geology of Long Island and Metropolitan New York”, April 18, 1998, Long Island Geologists, State University of New York, p.161.
Krüger, J., Till fabric in relation to direction of ice movement, a study from the Fakse Banke, Denmark, Geografisk Tidsskrift, 69, 133-170, 1970.
Krüger, J., and Kjær, K.H., A data chart for field description and genetic interpretation of glacial diamicts and associated sediments — with examples from Greenland, Iceland, and Denmark, Boreas, 28, 386-402, 1999.
Larsen, E., Lyså, A., Demidov, I., Funder, S., Houmark-Nielsen, M., Kjær, K.H., and Murray, A.S., Age and extent of the Scandinavian ice sheet in northwest Russia, Boreas, 28, 115-132, 1999.
Lawson, D.E., A comparison of the pebble orientations in and deposits of the Matanuska Glacier, Alaska, Journal of Geology, 87, 629-645, 1979.
Lindsay, J.F., The development of clast fabric in mudflows, Journal of Sedimentary Petrology, 38, 1242-1253, 1968.

Mark, D.A., Analysis of axial orientation data, including till fabrics, Geological Society of America Bulletin, 84, 1369-1374, 1973.
Mark, D.A., On the interpretation of till fabrics, Geology, 2, 101-104, 1974.
Millar, S.W.S., and Nelson, F.E., Sampling-surface orientation and clast macrofabric in periglacial colluvium, Earth Surface Processes and Landforms, 26, 523-529, 2001a.
Millar, S.W.S., and Nelson, F.E., Clast fabric in relict periglacial colluvium, Salamanca re-entrant, southwestern New York, USA, Geografiska Annaler, 83A, 145-156, 2001b.
Rappol, M., Clast-fabric strength in tills and debris flows compared for different environments, Geologie en Mijnbouw, 64, 327-332, 1985.
Rijsdijk, K.F., Density-driven deformation structures in glacigenic consolidated diamicts: examples from Traeth Y Mwnt, Cardiganshire, Wales, U.K., Journal of Sedimentary Research, 71, 122-135, 2001.
Sneed, E.D., and Folk, R.L., Pebbles in the lower Colorado River, Texas a study in particle morphogenesis, Journal of Geology, 66, 114-150, 1958.
Zingg, T.H., 1935 in Pettijohn, F.J., Sedimentary Rocks. 628 p., Harper and Row, New York, 1975.