surfactant enhanced in situ chemical oxidation (s isco®) · copyright verutek 2010copyright...
TRANSCRIPT
Copyright VeruTEK 2010Copyright VeruTEK 2010
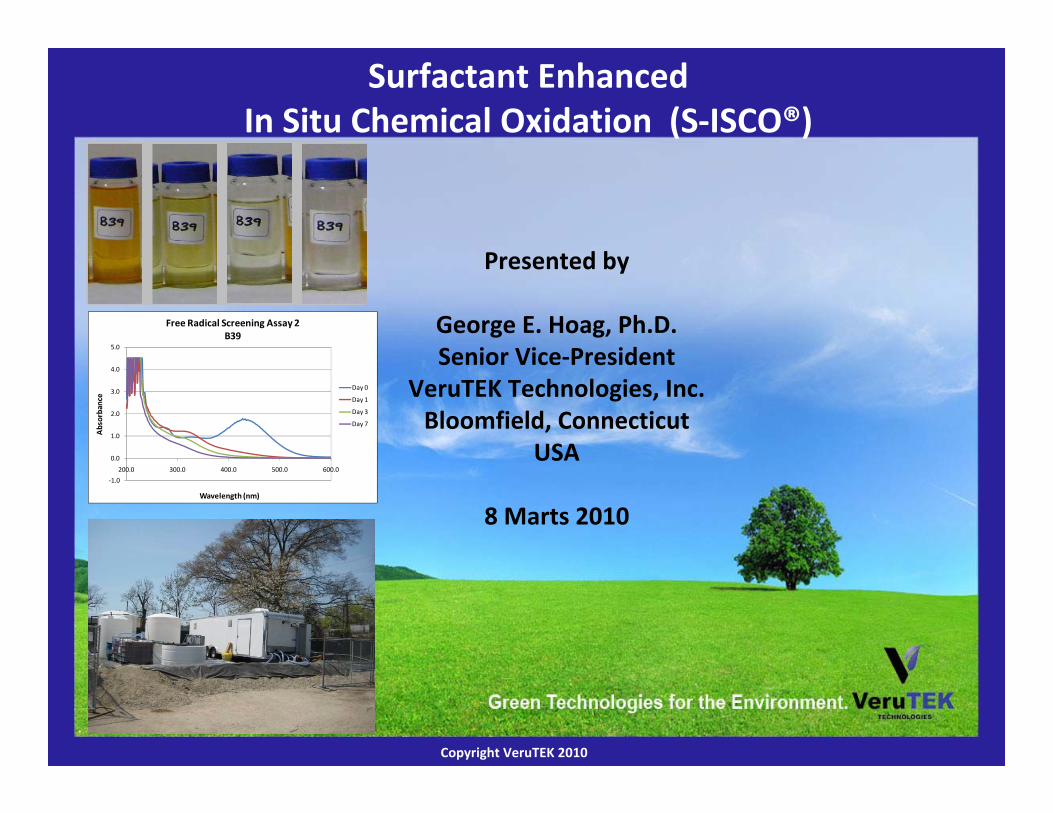
Surfactant EnhancedIn Situ Chemical Oxidation (S‐ISCO®)
Presented by
George E. Hoag, Ph.D.Senior Vice‐President
VeruTEK Technologies, Inc.Bloomfield, Connecticut
USA
8 Marts 2010
‐1.0
0.0
1.0
2.0
3.0
4.0
5.0
200.0 300.0 400.0 500.0 600.0
Abs
orba
nce
Wavelength (nm)
Free Radical Screening Assay 2B39
Day 0
Day 1
Day 3
Day 7

Copyright VeruTEK 2010Copyright VeruTEK 2010
Presentation Outline
• Purpose – Balance Scientific Fundamentals with Applications
• Introduction
‐ Overview of Surfactant Behavior
‐ Reactions of Surfactants and Oxidants
• Laboratory‐Scale Results
• Full‐Scale Applications
• Conclusions
Copyright VeruTEK 2010Copyright VeruTEK 2010
Surfactant Enhanced In Situ Chemical Oxidation
• The focus of S‐ISCO® is to treat Light and Dense Non AqueousPhase Liquids (NAPLs) & Sorbed Phase Contaminants
‐ Chlorinated Solvents, Hydrocarbons, Coal Tars, FuelsPesticides, Hydraulic Oils, Heat Exchange Fluids, PCBs
• Coupled Subsurface Coelution of Cosolvent/Surfactants toSolubilize and Free Radical Oxidants to Destroy NAPLsand Sorbed Residuals
• Also Applicable for Ex Situ, Construction Materials, Oily Wastewater, Oil Drilling Cuttings
Copyright VeruTEK 2010Copyright VeruTEK 2010
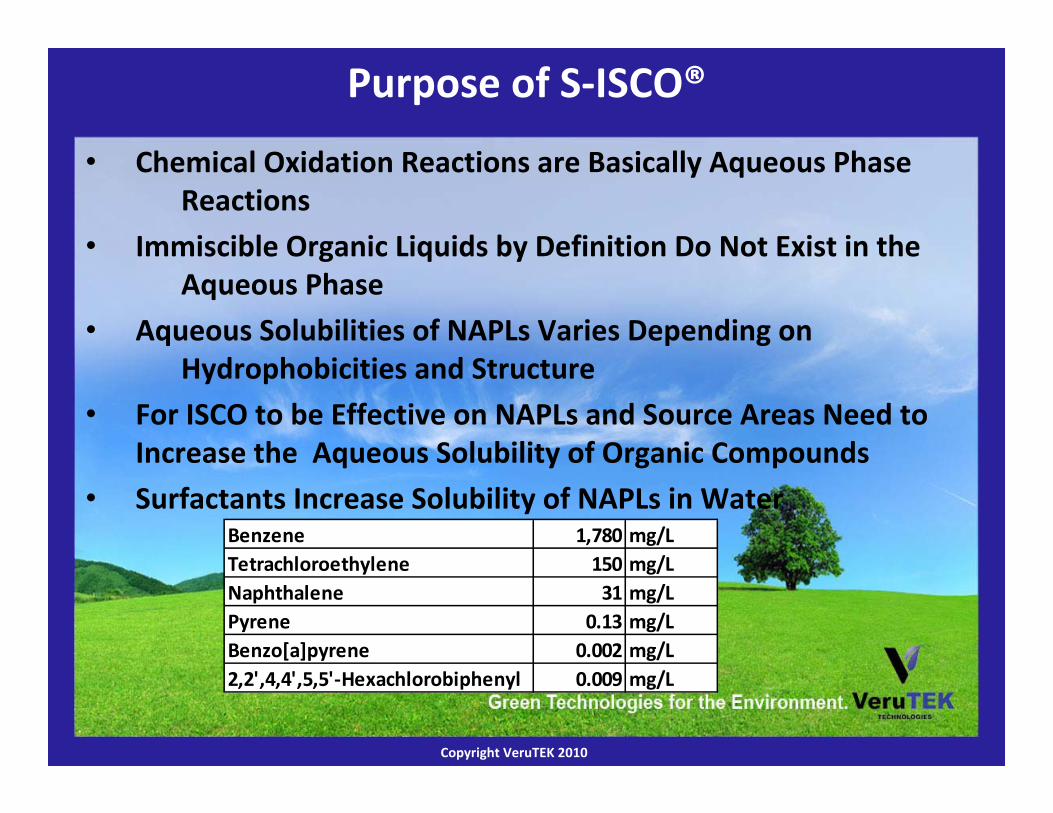
Purpose of S‐ISCO®
• Chemical Oxidation Reactions are Basically Aqueous Phase Reactions
• Immiscible Organic Liquids by Definition Do Not Exist in the Aqueous Phase
• Aqueous Solubilities of NAPLs Varies Depending on Hydrophobicities and Structure
• For ISCO to be Effective on NAPLs and Source Areas Need to Increase the Aqueous Solubility of Organic Compounds
• Surfactants Increase Solubility of NAPLs in WaterBenzene 1,780 mg/LTetrachloroethylene 150 mg/LNaphthalene 31 mg/LPyrene 0.13 mg/LBenzo[a]pyrene 0.002 mg/L2,2',4,4',5,5'‐Hexachlorobiphenyl 0.009 mg/L

Copyright VeruTEK 2010Copyright VeruTEK 2010
Key Factors to Make S‐ISCO® Work• Emulsify/Solubilize NAPL Phase and Desorb “Source Zone”
Contaminants using Surfactants and Cosolvents
• Make Free Radicals by Activating/Catalyzing Oxidants
• Oxidize Solubilized Contaminants with Free Radicals
• Do The Above by Simultaneous Subsurface Injections of Surfactants, Oxidants and Catalysts
• This is Called Reactive Transport or Co‐Elution
• Monitor Surfactants, Oxidants and Catalysts During
Application
Copyright VeruTEK 2010Copyright VeruTEK 2010
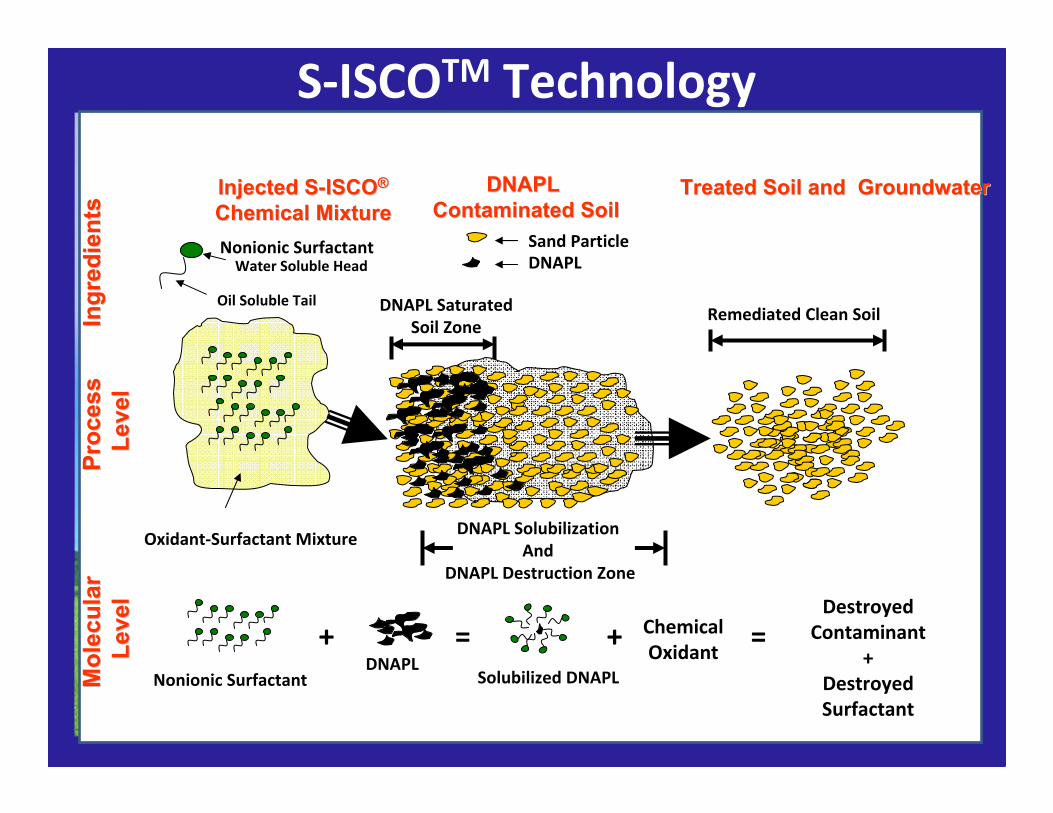
S‐ISCOTM Technology
Nonionic SurfactantWater Soluble Head
Oil Soluble Tail
Sand ParticleDNAPL
DNAPL SaturatedSoil Zone
Injected SInjected S--ISCOISCO®®
Chemical MixtureChemical MixtureDNAPL DNAPL
Contaminated SoilContaminated Soil
Oxidant‐Surfactant MixtureDNAPL Solubilization
AndDNAPL Destruction Zone
Remediated Clean Soil
=Nonionic Surfactant
DNAPL+
Solubilized DNAPL
+ ChemicalOxidant
=Destroyed
Contaminant+
Destroyed Surfactant
Treated Soil and GroundwaterTreated Soil and Groundwater
Mol
ecul
ar
Mol
ecul
ar
Leve
lLe
vel
Proc
ess
Proc
ess
Leve
lLe
vel
Ingr
edie
nts
Ingr
edie
nts

Copyright VeruTEK 2010Copyright VeruTEK 2010
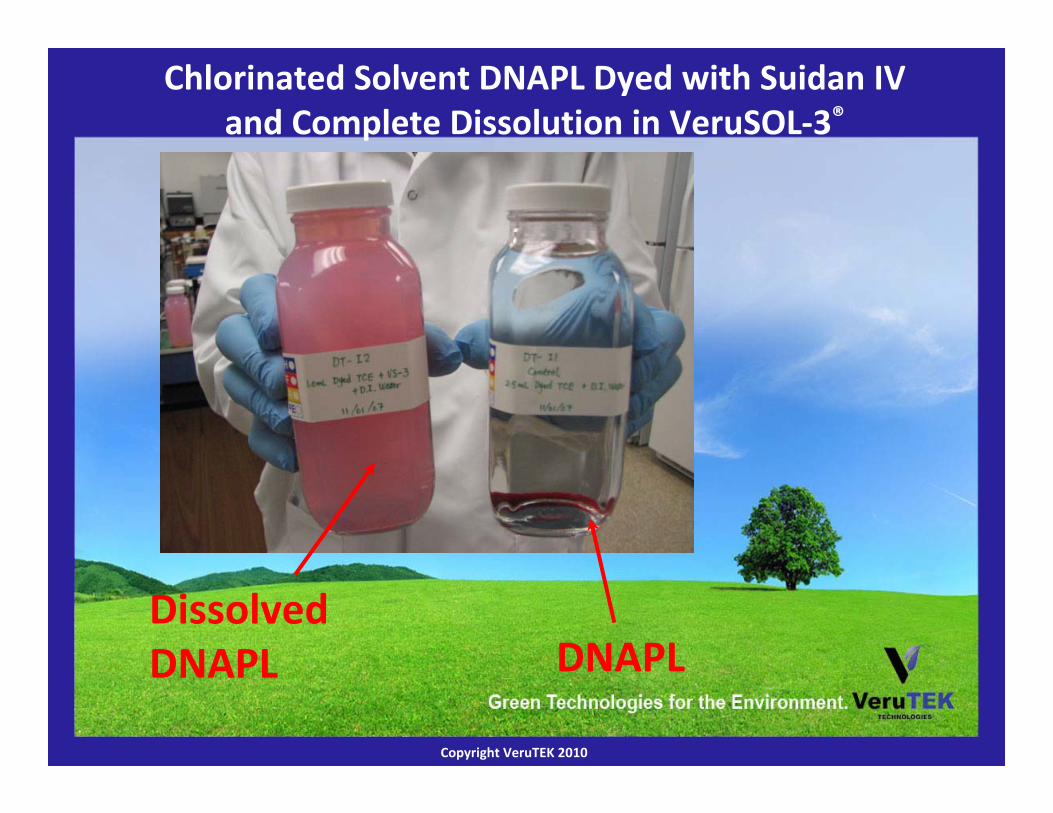
Chlorinated Solvent DNAPL Dyed with Suidan IVand Complete Dissolution in VeruSOL‐3®
DNAPLDissolvedDNAPL
Copyright VeruTEK 2010Copyright VeruTEK 2010
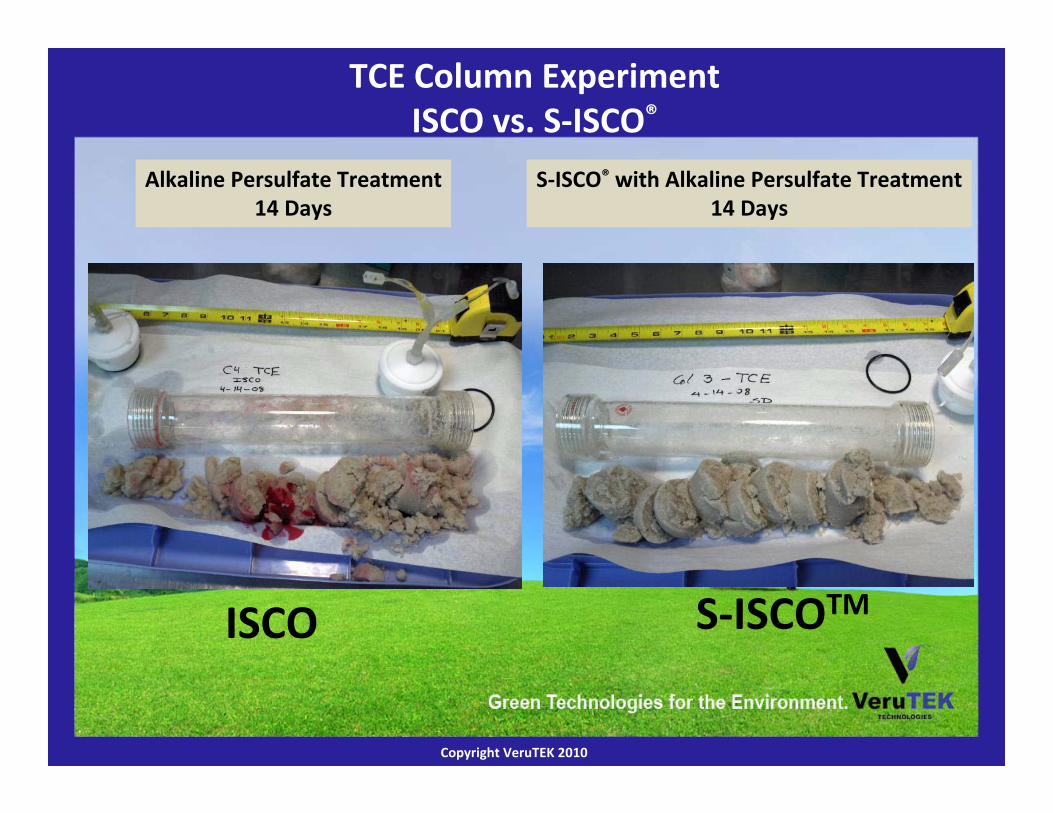
TCE Column ExperimentISCO vs. S‐ISCO®
S‐ISCOTMISCO
Alkaline Persulfate Treatment14 Days
S‐ISCO® with Alkaline Persulfate Treatment14 Days
Copyright VeruTEK 2010Copyright VeruTEK 2010
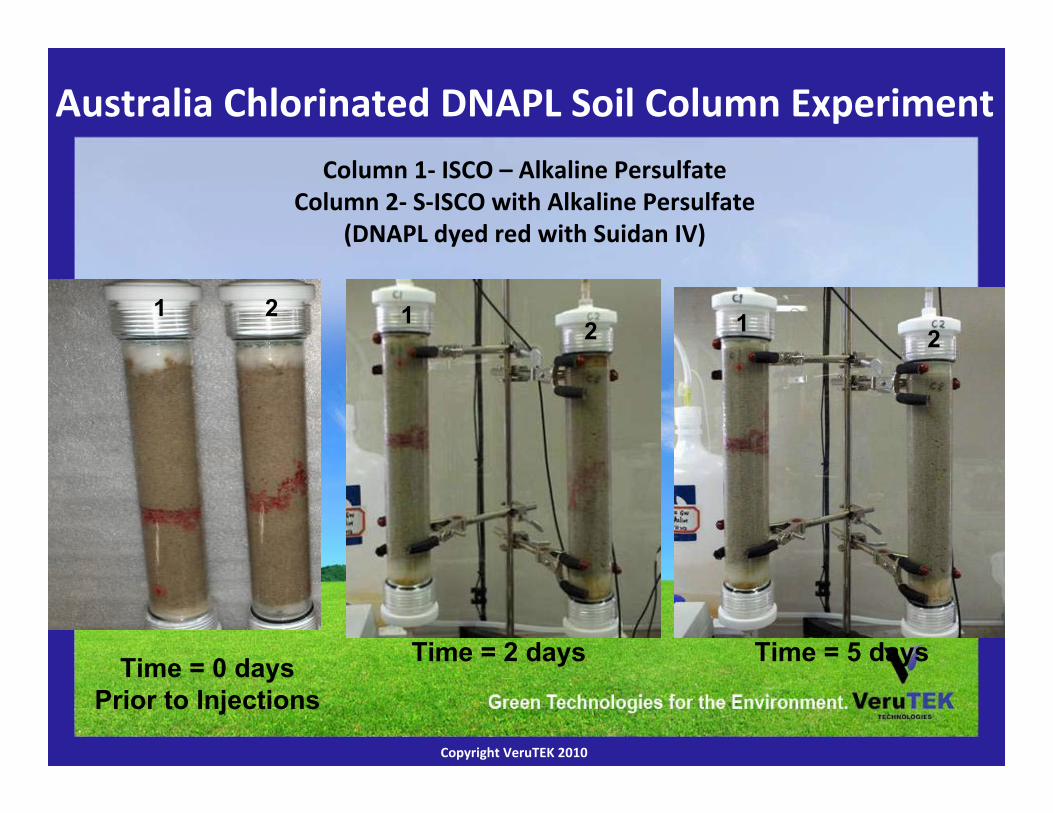
1 2
Time = 0 daysPrior to Injections
Time = 2 days Time = 5 days
Australia Chlorinated DNAPL Soil Column Experiment
Column 1‐ ISCO – Alkaline PersulfateColumn 2‐ S‐ISCO with Alkaline Persulfate
(DNAPL dyed red with Suidan IV)
1 2 1 2
Copyright VeruTEK 2010Copyright VeruTEK 2010
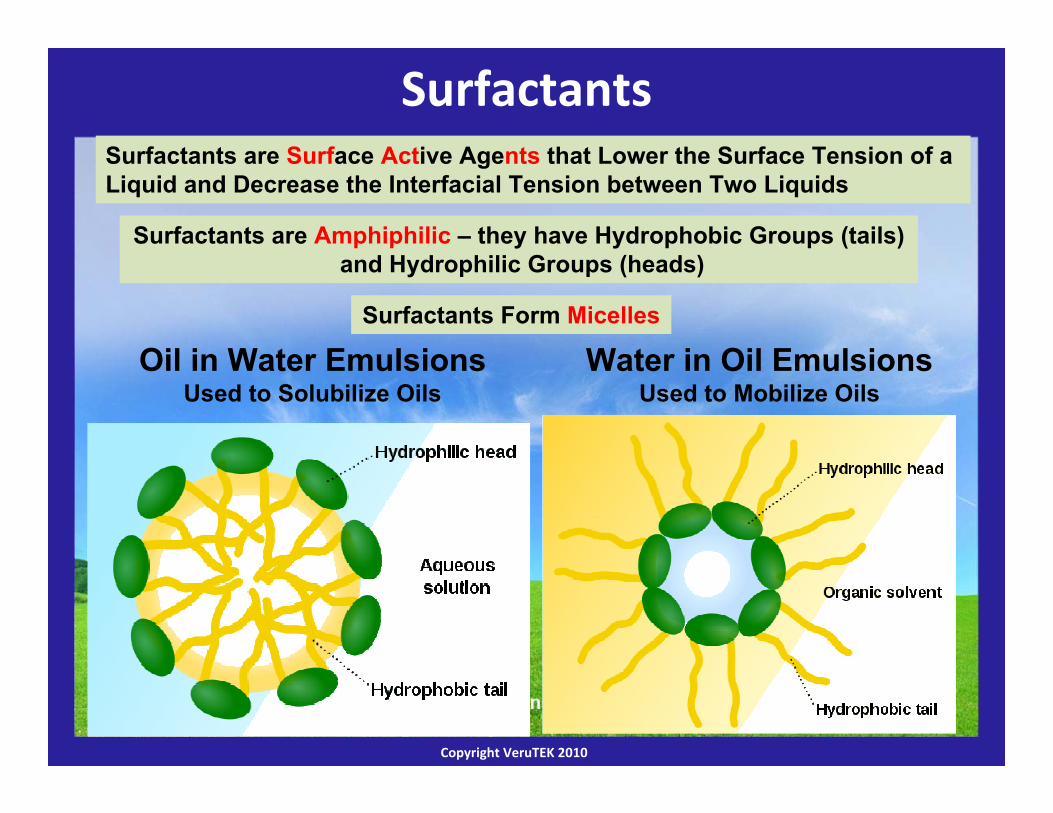
Surfactants
Oil in Water EmulsionsUsed to Solubilize Oils
Water in Oil EmulsionsUsed to Mobilize Oils
Surfactants are Surface Active Agents that Lower the Surface Tension of aLiquid and Decrease the Interfacial Tension between Two Liquids
Surfactants are Amphiphilic – they have Hydrophobic Groups (tails)and Hydrophilic Groups (heads)
Surfactants Form Micelles
Copyright VeruTEK 2010Copyright VeruTEK 2010
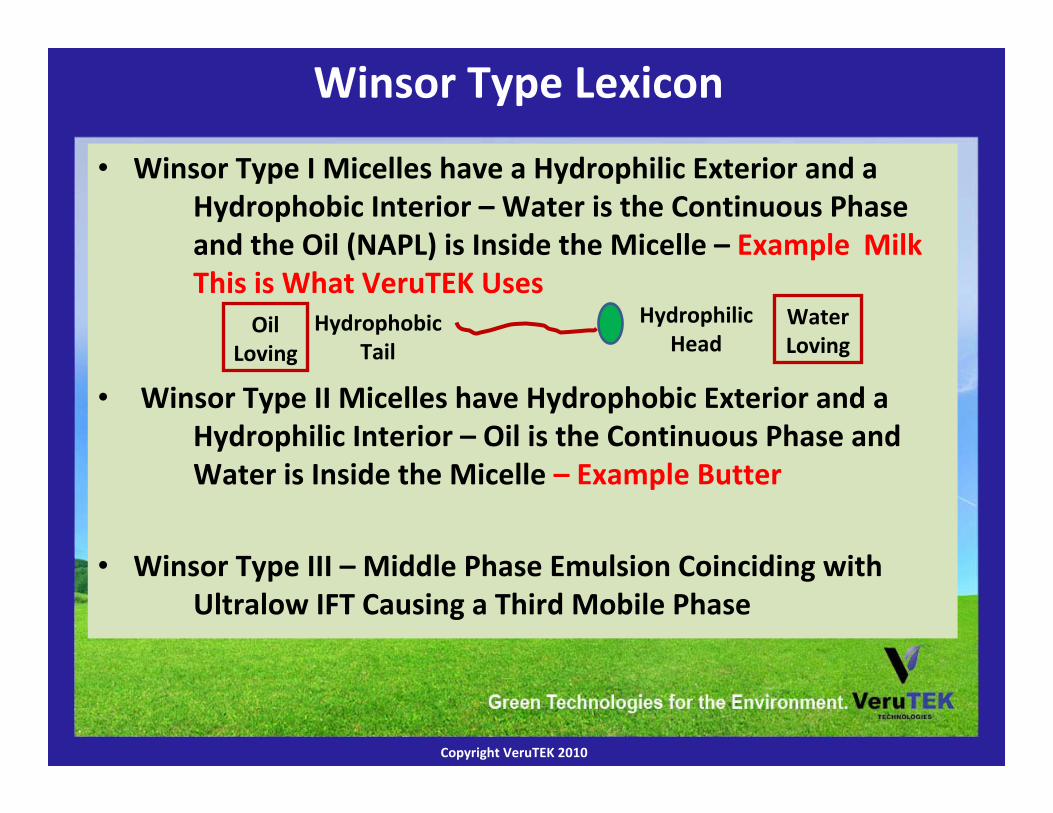
Winsor Type Lexicon
• Winsor Type I Micelles have a Hydrophilic Exterior and a Hydrophobic Interior – Water is the Continuous Phase and the Oil (NAPL) is Inside the Micelle – Example MilkThis is What VeruTEK Uses
• Winsor Type II Micelles have Hydrophobic Exterior and a Hydrophilic Interior – Oil is the Continuous Phase and Water is Inside the Micelle – Example Butter
• Winsor Type III – Middle Phase Emulsion Coinciding with Ultralow IFT Causing a Third Mobile Phase
HydrophilicHead
HydrophobicTail
WaterLoving
OilLoving
Copyright VeruTEK 2010Copyright VeruTEK 2010
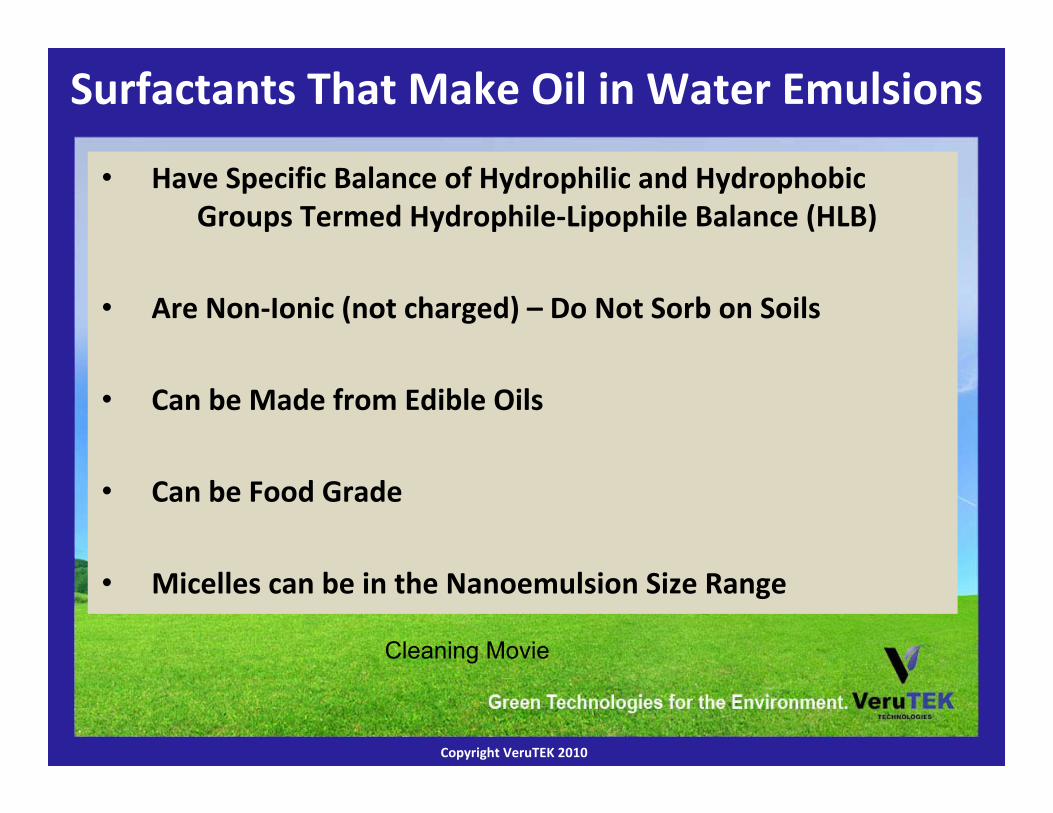
Cleaning Movie
Surfactants That Make Oil in Water Emulsions
• Have Specific Balance of Hydrophilic and Hydrophobic Groups Termed Hydrophile‐Lipophile Balance (HLB)
• Are Non‐Ionic (not charged) – Do Not Sorb on Soils
• Can be Made from Edible Oils
• Can be Food Grade
• Micelles can be in the Nanoemulsion Size Range
Copyright VeruTEK 2010Copyright VeruTEK 2010
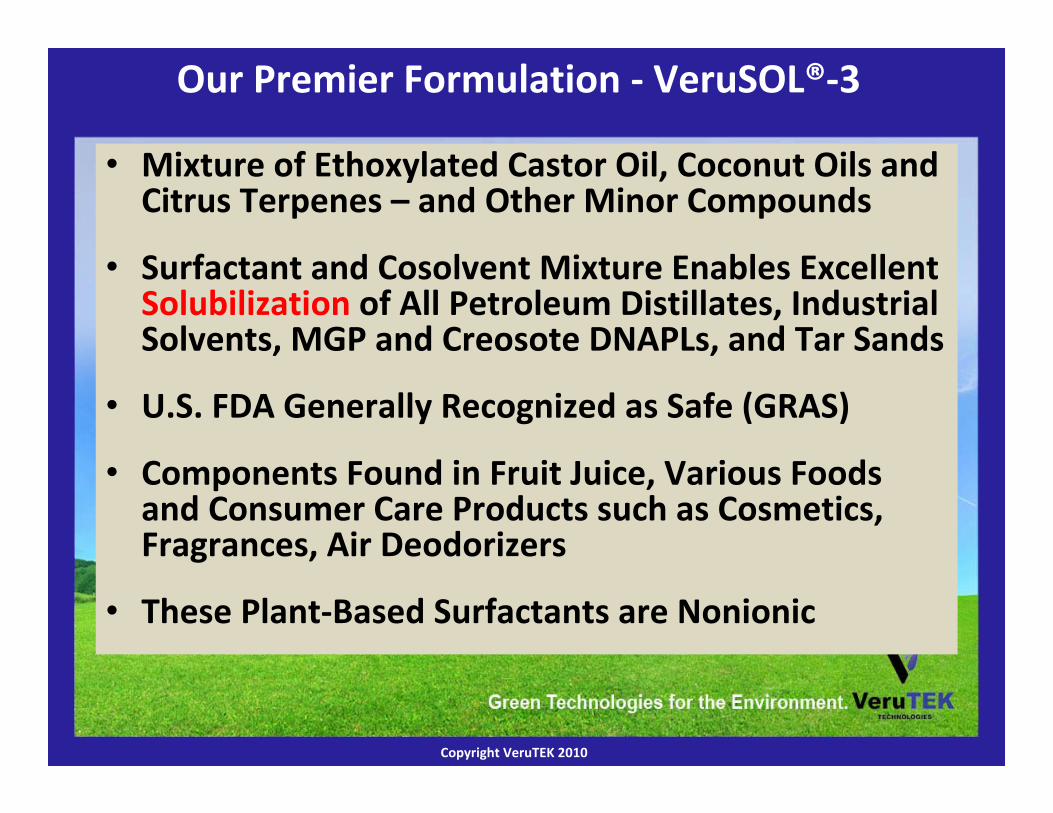
Our Premier Formulation ‐ VeruSOL®‐3
• Mixture of Ethoxylated Castor Oil, Coconut Oils and Citrus Terpenes – and Other Minor Compounds
• Surfactant and Cosolvent Mixture Enables Excellent Solubilization of All Petroleum Distillates, Industrial Solvents, MGP and Creosote DNAPLs, and Tar Sands
• U.S. FDA Generally Recognized as Safe (GRAS)
• Components Found in Fruit Juice, Various Foods and Consumer Care Products such as Cosmetics, Fragrances, Air Deodorizers
• These Plant‐Based Surfactants are Nonionic
Copyright VeruTEK 2010Copyright VeruTEK 2010
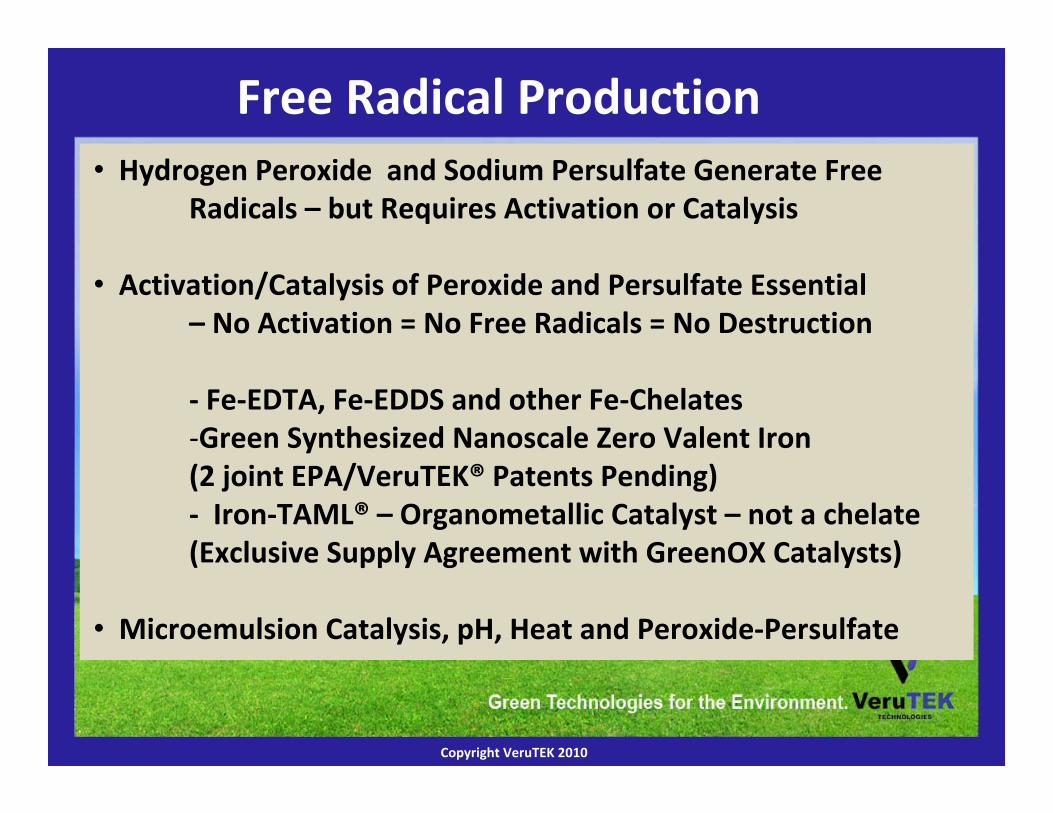
• Hydrogen Peroxide and Sodium Persulfate Generate Free Radicals – but Requires Activation or Catalysis
• Activation/Catalysis of Peroxide and Persulfate Essential– No Activation = No Free Radicals = No Destruction
‐ Fe‐EDTA, Fe‐EDDS and other Fe‐Chelates‐Green Synthesized Nanoscale Zero Valent Iron(2 joint EPA/VeruTEK® Patents Pending)‐ Iron‐TAML® – Organometallic Catalyst – not a chelate(Exclusive Supply Agreement with GreenOX Catalysts)
• Microemulsion Catalysis, pH, Heat and Peroxide‐Persulfate
Free Radical Production

Copyright VeruTEK 2010Copyright VeruTEK 2010
Free Radical Production
Copyright VeruTEK 2010Copyright VeruTEK 2010
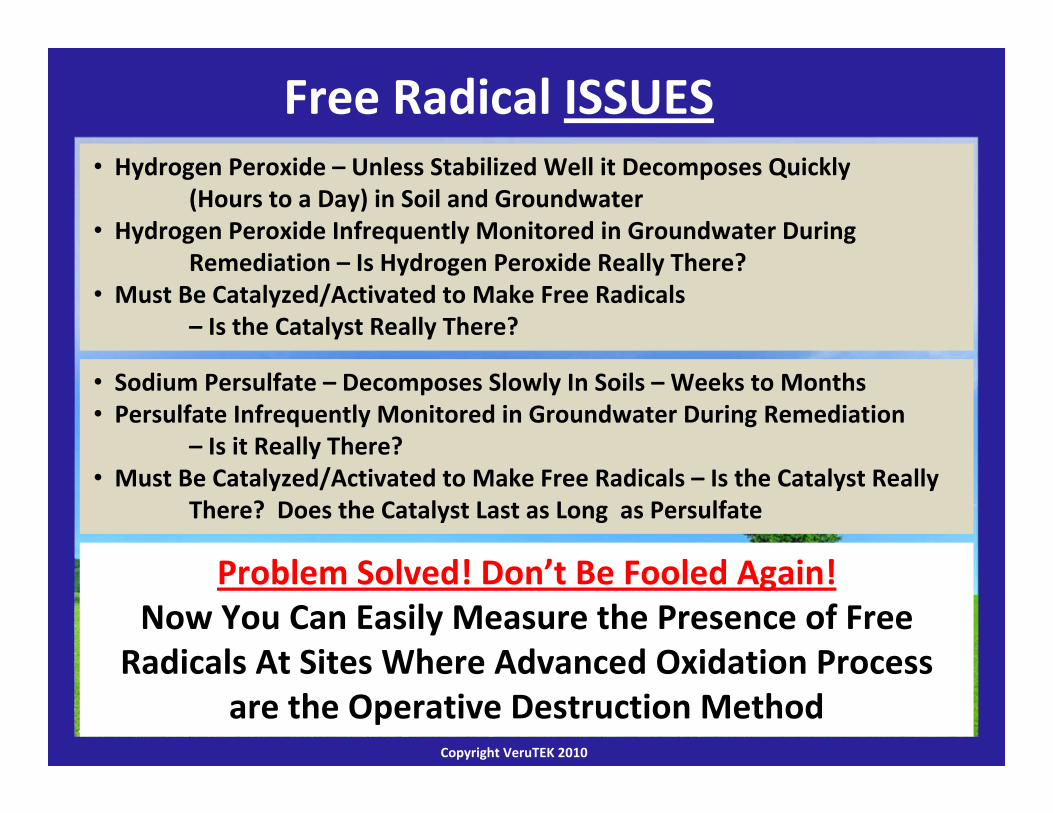
Free Radical ISSUES• Hydrogen Peroxide – Unless Stabilized Well it Decomposes Quickly
(Hours to a Day) in Soil and Groundwater• Hydrogen Peroxide Infrequently Monitored in Groundwater During
Remediation – Is Hydrogen Peroxide Really There?• Must Be Catalyzed/Activated to Make Free Radicals
– Is the Catalyst Really There?
• Sodium Persulfate – Decomposes Slowly In Soils – Weeks to Months• Persulfate Infrequently Monitored in Groundwater During Remediation
– Is it Really There?• Must Be Catalyzed/Activated to Make Free Radicals – Is the Catalyst Really
There? Does the Catalyst Last as Long as Persulfate
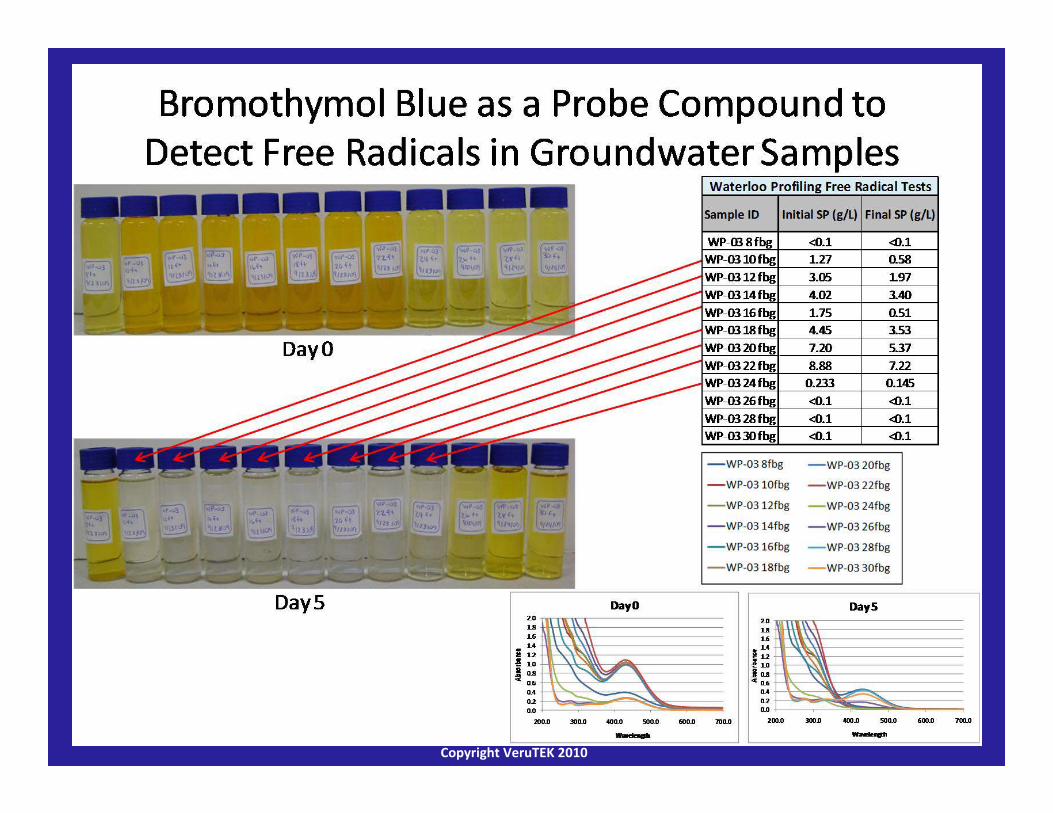
Problem Solved! Don’t Be Fooled Again!Now You Can Easily Measure the Presence of Free
Radicals At Sites Where Advanced Oxidation Process are the Operative Destruction Method
Copyright VeruTEK 2010Copyright VeruTEK 2010
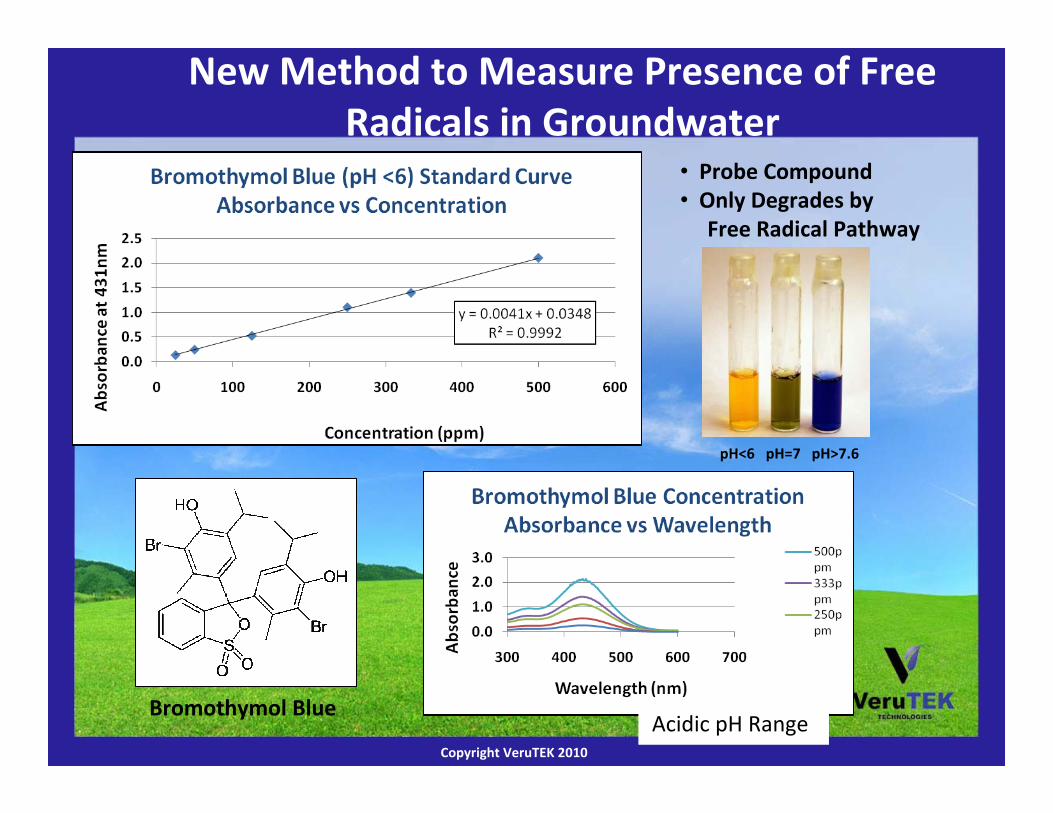
New Method to Measure Presence of Free Radicals in Groundwater
Acidic pH Range Bromothymol Blue
pH<6 pH=7 pH>7.6
• Probe Compound• Only Degrades by
Free Radical Pathway
Copyright VeruTEK 2010Copyright VeruTEK 2010
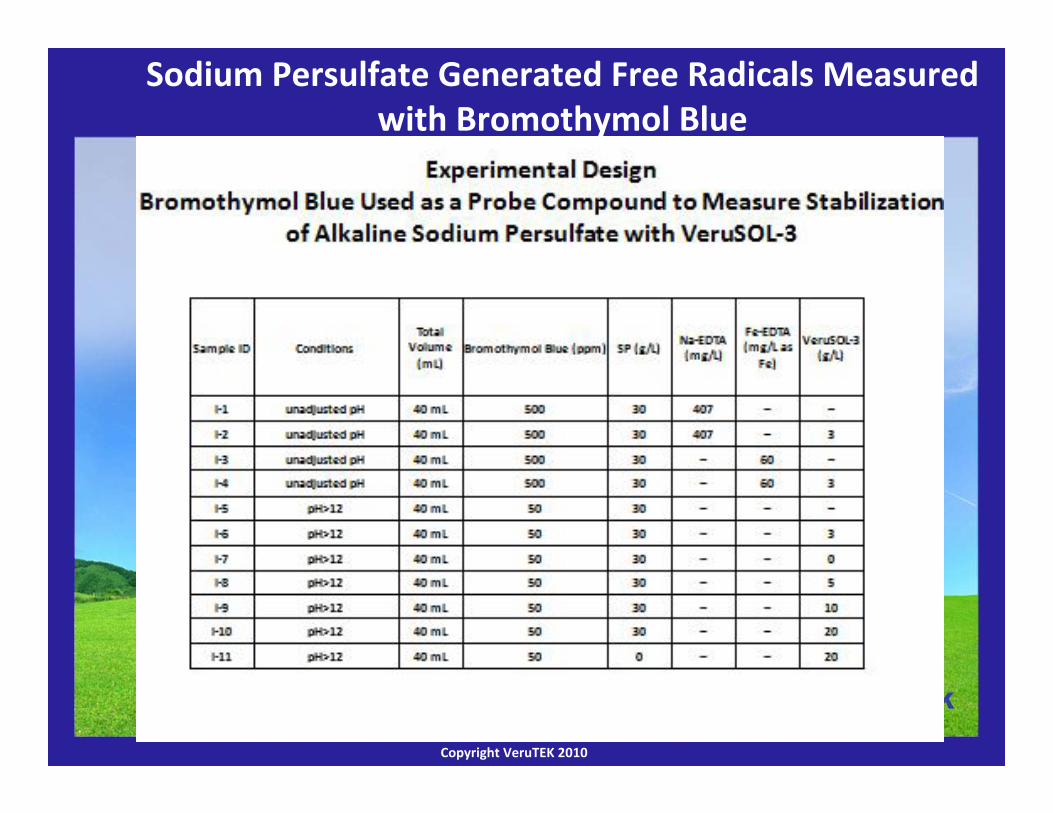
Sodium Persulfate Generated Free Radicals Measured with Bromothymol Blue
Copyright VeruTEK 2010Copyright VeruTEK 2010
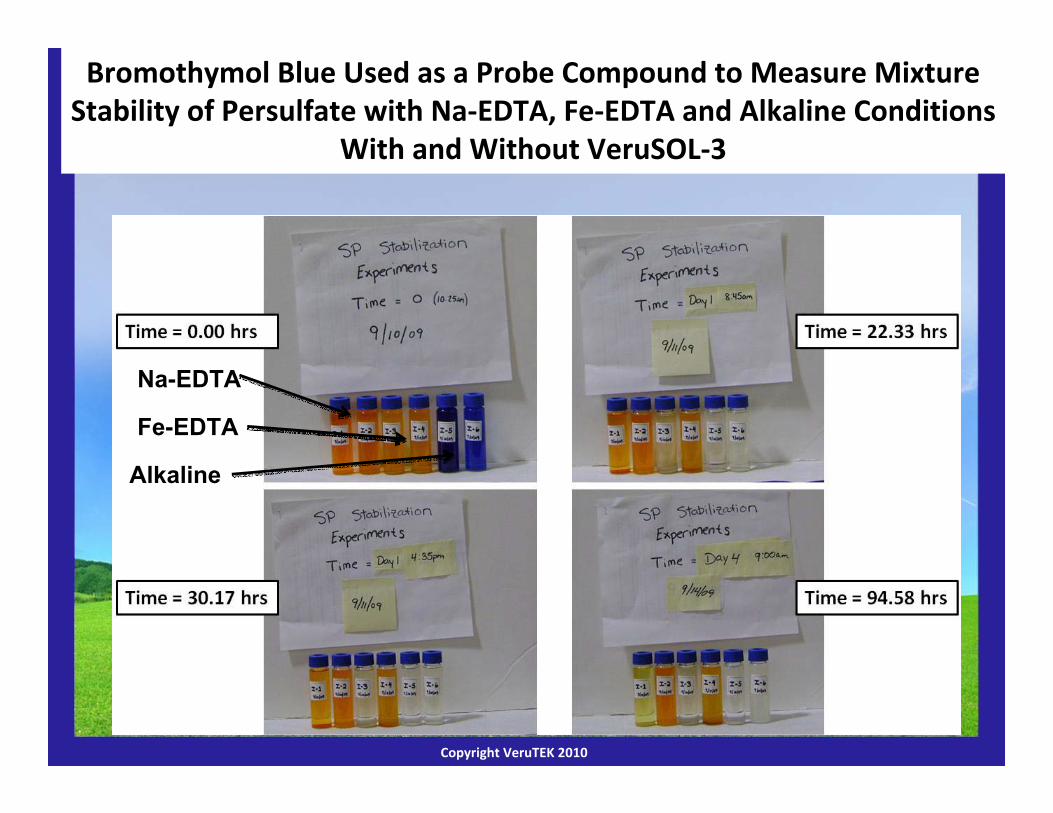
Bromothymol Blue Used as a Probe Compound to Measure MixtureStability of Persulfate with Na‐EDTA, Fe‐EDTA and Alkaline Conditions
With and Without VeruSOL‐3
Na-EDTA
Fe-EDTA
Alkaline
Copyright VeruTEK 2010Copyright VeruTEK 2010
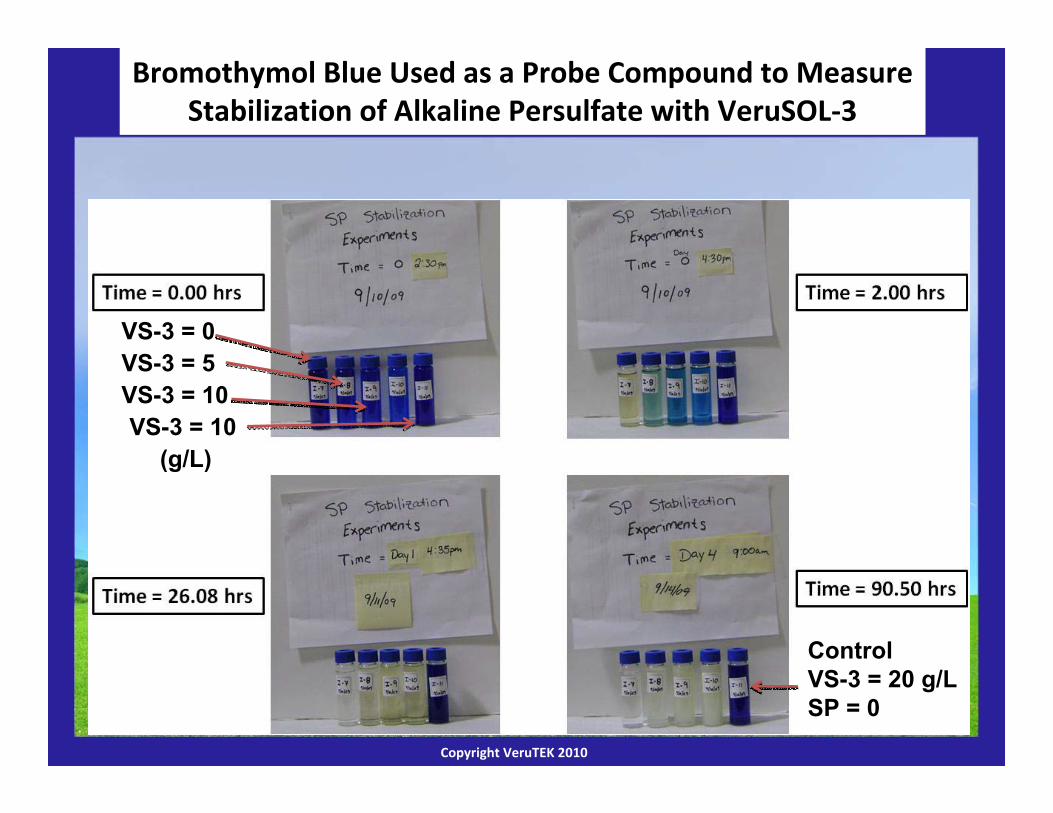
Bromothymol Blue Used as a Probe Compound to MeasureStabilization of Alkaline Persulfate with VeruSOL‐3
VS-3 = 0VS-3 = 5VS-3 = 10VS-3 = 10
(g/L)
ControlVS-3 = 20 g/LSP = 0
Copyright VeruTEK 2010Copyright VeruTEK 2010
Copyright VeruTEK 2010Copyright VeruTEK 2010
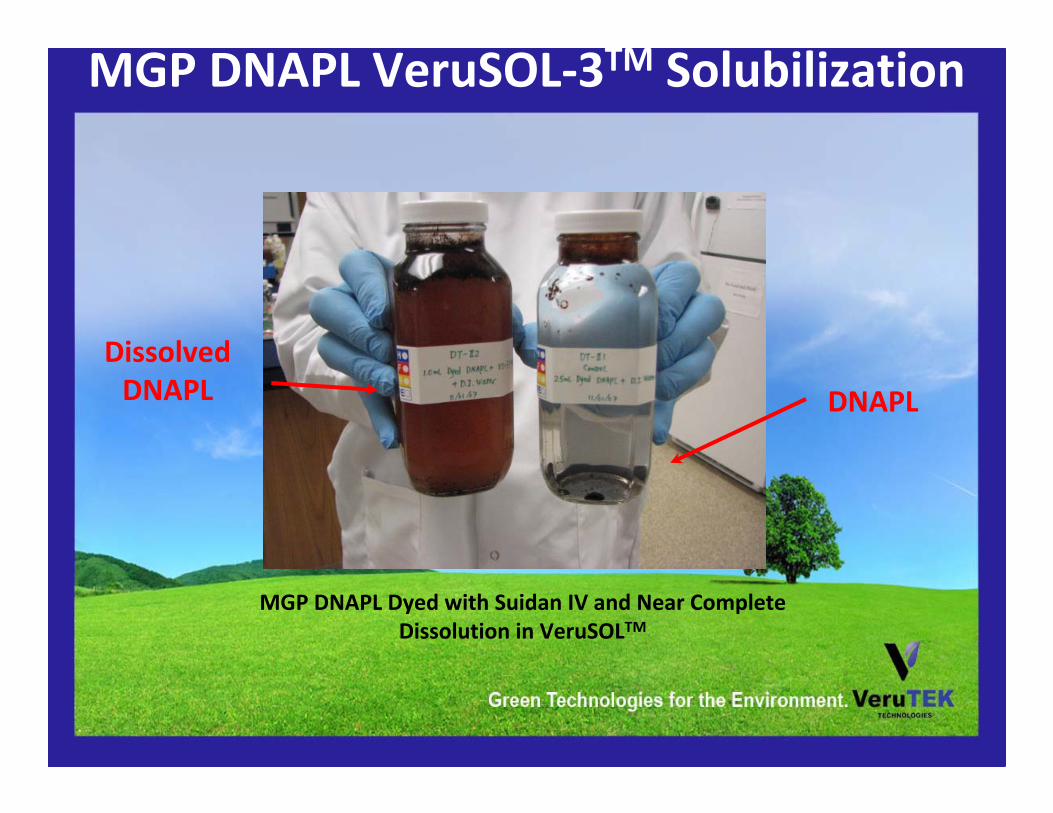
MGP DNAPL Dyed with Suidan IV and Near Complete Dissolution in VeruSOLTM
DNAPL
DissolvedDNAPL
MGP DNAPL VeruSOL‐3TM Solubilization
Copyright VeruTEK 2010Copyright VeruTEK 2010
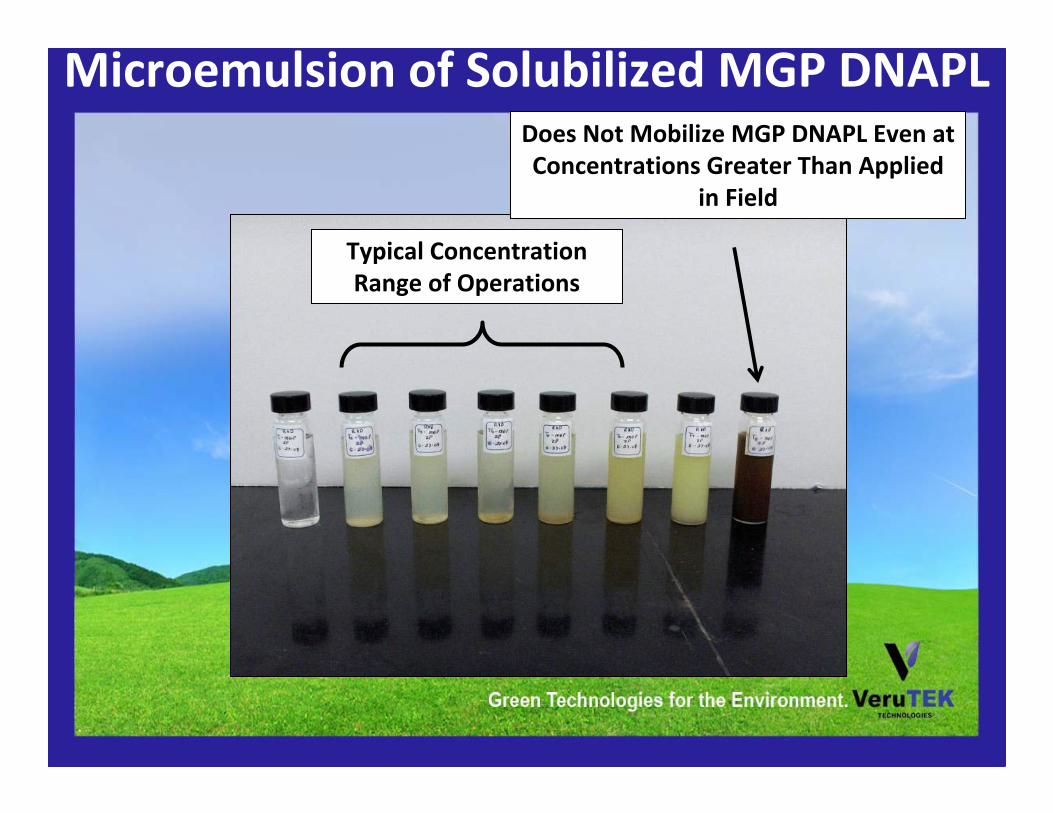
Microemulsion of Solubilized MGP DNAPL
Typical ConcentrationRange of Operations
Does Not Mobilize MGP DNAPL Even at Concentrations Greater Than Applied
in Field

Copyright VeruTEK 2010Copyright VeruTEK 2010
As the VeruSOL‐3 Dose is Increased, the Interfacial Tension Between the Two Liquids Decreases
VeruSOL‐3TM Effect on Interfacial Tension

Copyright VeruTEK 2010Copyright VeruTEK 2010
As the VeruSOL‐3 Dose is Increased, the MGP DNAPL Solubility Increases Because of Creating Oil in Water Emulsions
VeruSOL‐3TM MGP Solubility
Copyright VeruTEK 2010Copyright VeruTEK 2010
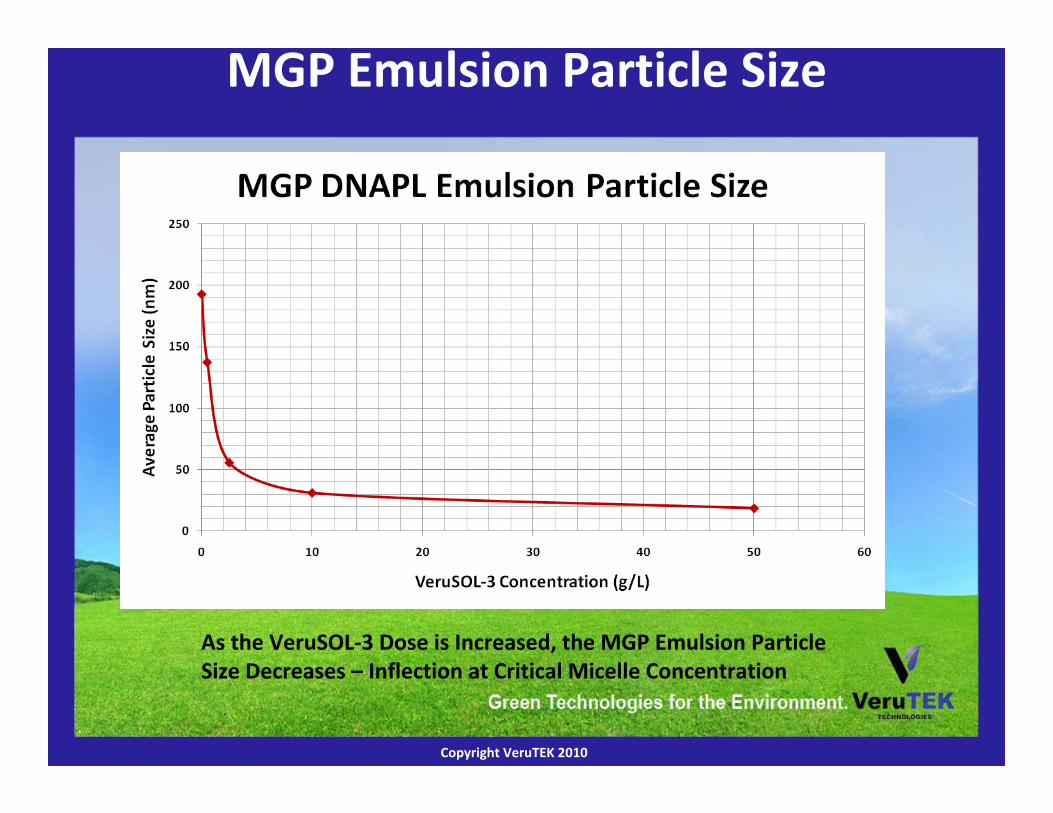
As the VeruSOL‐3 Dose is Increased, the MGP Emulsion Particle Size Decreases – Inflection at Critical Micelle Concentration
MGP Emulsion Particle Size
Copyright VeruTEK 2010Copyright VeruTEK 2010
Chlorinated Solvent DNAPL Dyed with Suidan IVand Complete Dissolution in VeruSOL‐3®
DNAPLDissolvedDNAPL
Copyright VeruTEK 2010Copyright VeruTEK 2010
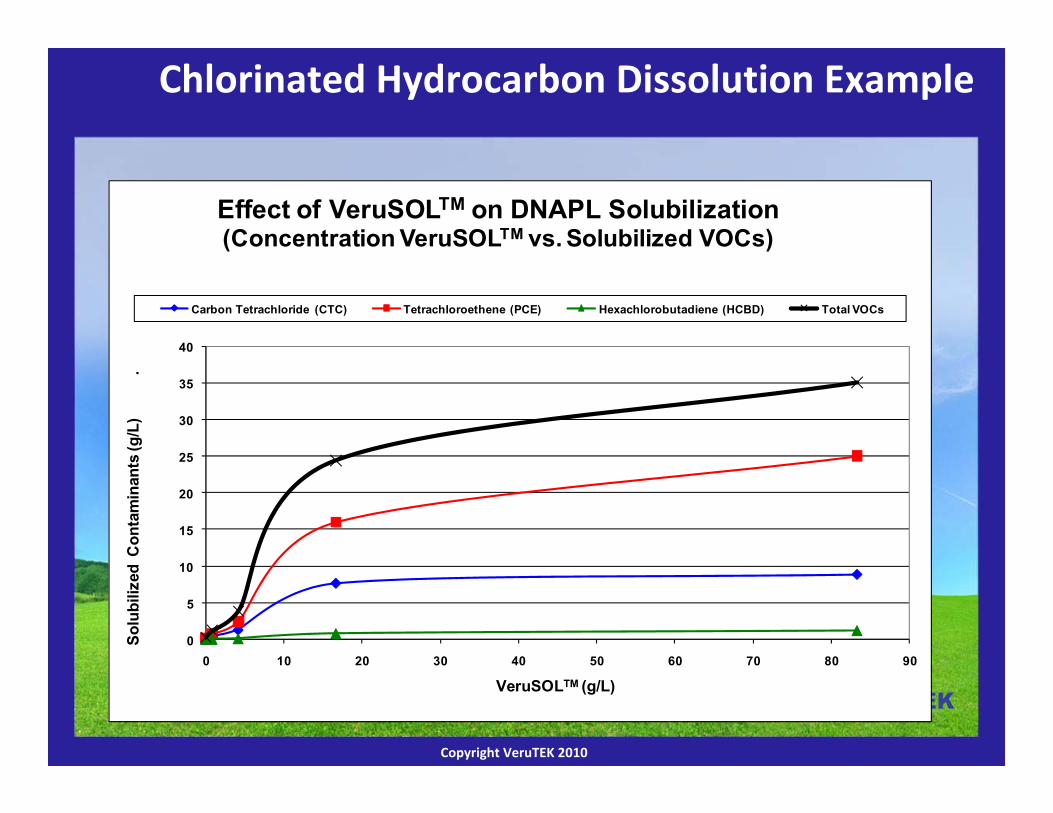
0
5
10
15
20
25
30
35
40
0 10 20 30 40 50 60 70 80 90
Solu
biliz
ed C
onta
min
ants
(g/L
)
.
VeruSOLTM (g/L)
Effect of VeruSOLTM on DNAPL Solubilization(Concentration VeruSOLTM vs. Solubilized VOCs)
Carbon Tetrachloride (CTC) Tetrachloroethene (PCE) Hexachlorobutadiene (HCBD) Total VOCs
Chlorinated Hydrocarbon Dissolution Example
Copyright VeruTEK 2010Copyright VeruTEK 2010
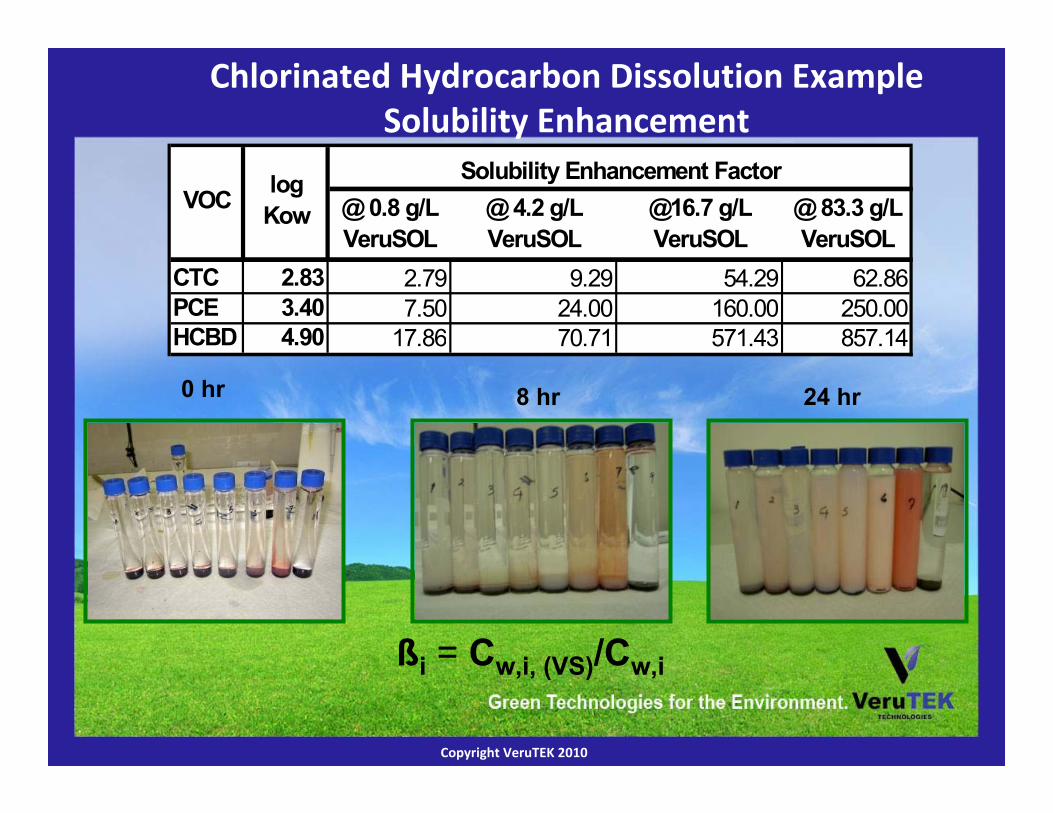
@ 0.8 g/L VeruSOL
@ 4.2 g/L VeruSOL
@16.7 g/L VeruSOL
@ 83.3 g/L VeruSOL
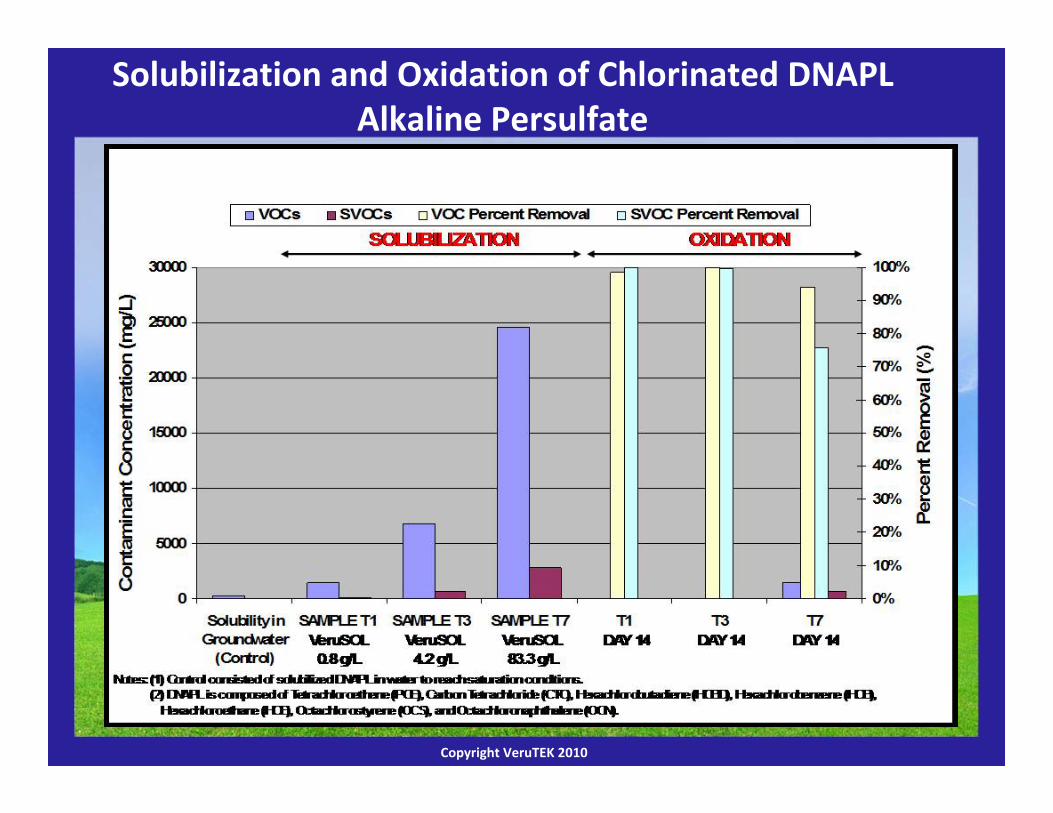
CTC 2.83 2.79 9.29 54.29 62.86PCE 3.40 7.50 24.00 160.00 250.00HCBD 4.90 17.86 70.71 571.43 857.14
Solubility Enhancement FactorVOC log
Kow
ßi = Cw,i, (VS)/Cw,i
0 hr 8 hr 24 hr
Chlorinated Hydrocarbon Dissolution ExampleSolubility Enhancement
Copyright VeruTEK 2010Copyright VeruTEK 2010
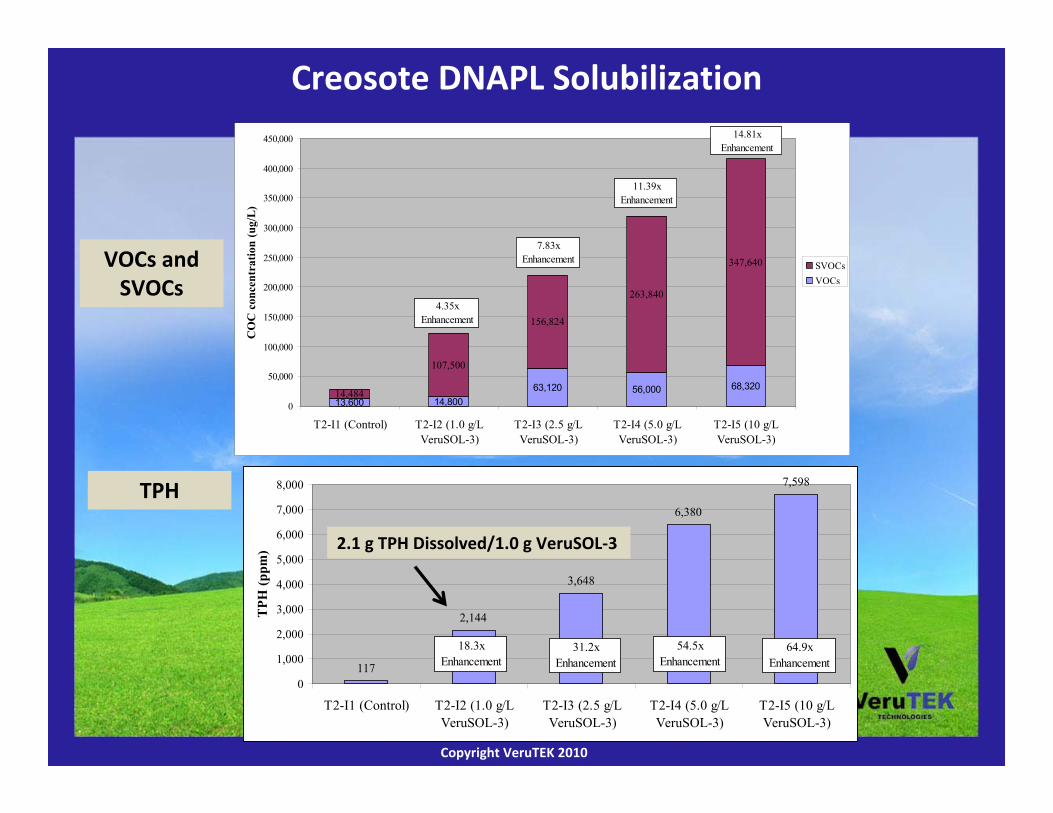
13,600 14,80063,120 56,000 68,320
14,484
107,500
156,824
263,840
347,640
0
50,000
100,000
150,000
200,000
250,000
300,000
350,000
400,000
450,000
T2-I1 (Control) T2-I2 (1.0 g/LVeruSOL-3)
T2-I3 (2.5 g/LVeruSOL-3)
T2-I4 (5.0 g/LVeruSOL-3)
T2-I5 (10 g/LVeruSOL-3)
CO
C c
once
ntra
tion
(ug/
L)
SVOCsVOCs
7.83x Enhancement
11.39x Enhancement
14.81x Enhancement
4.35x Enhancement
117
2,144
3,648
6,380
7,598
0
1,000
2,000
3,000
4,000
5,000
6,000
7,000
8,000
T2-I1 (Control) T2-I2 (1.0 g/LVeruSOL-3)
T2-I3 (2.5 g/LVeruSOL-3)
T2-I4 (5.0 g/LVeruSOL-3)
T2-I5 (10 g/LVeruSOL-3)
TPH
(ppm
)
18.3x Enhancement
31.2x Enhancement
54.5x Enhancement
64.9x Enhancement
VOCs and SVOCs
TPH
Creosote DNAPL Solubilization
2.1 g TPH Dissolved/1.0 g VeruSOL‐3
Copyright VeruTEK 2010Copyright VeruTEK 2010
Solubilization and Oxidation of Chlorinated DNAPLAlkaline Persulfate

Copyright VeruTEK 2010Copyright VeruTEK 2010
Oxidation of Emulsified/Solubilized NAPLs
Copyright VeruTEK 2010Copyright VeruTEK 2010
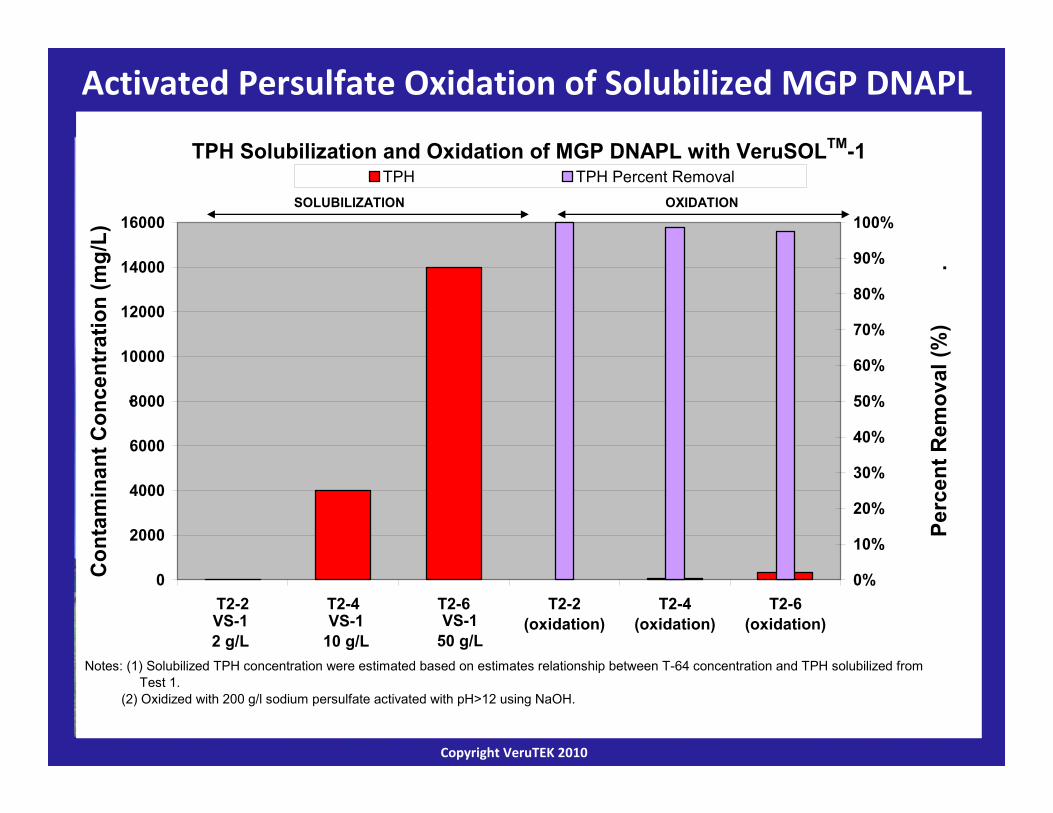
Activated Persulfate Oxidation of Solubilized MGP DNAPL
TPH Solubilization and Oxidation of MGP DNAPL with VeruSOLTM-1
0
2000
4000
6000
8000
10000
12000
14000
16000
T2-2 T2-4 T2-6 T2-2(oxidation)
T2-4(oxidation)
T2-6(oxidation)
Con
tam
inan
t Con
cent
ratio
n (m
g/L)
.
0%
10%
20%
30%
40%
50%
60%
70%
80%
90%
100%
Perc
ent R
emov
al (%
)
.
TPH TPH Percent RemovalSOLUBILIZATION OXIDATION
Notes: (1) Solubilized TPH concentration were estimated based on estimates relationship between T-64 concentration and TPH solubilized from Test 1. (2) Oxidized with 200 g/l sodium persulfate activated with pH>12 using NaOH.
VS-1 2 g/L
VS-110 g/L
VS-150 g/L

Copyright VeruTEK 2010Copyright VeruTEK 2010
259,200
1,159
27,590
10,125
318,880
17,648
130,713
89,120
5,900 4,550 4,250 3,5500
50,000
100,000
150,000
200,000
250,000
300,000
350,000
Initial Soil Column 1 ‐ 30 Day Treated Soil
Column 2 ‐ 14 Day Treated Soil
Column 3 ‐ 14 Day Treated Soil
COC
Conc
entr
atio
n (u
g/L)
Column Soil
Soil Column Experiments ‐COC Destruction of Treated Soils
VOCs
SVOCs
Arsenic
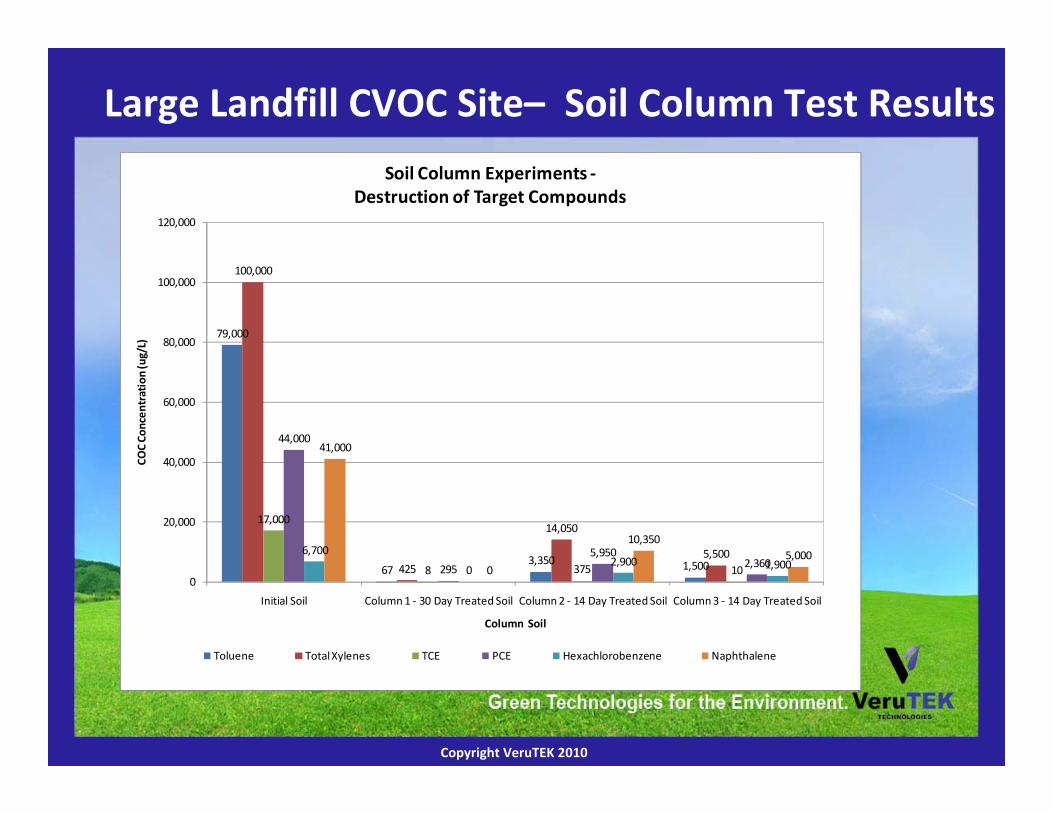
Column 1 – Sodium Persulfate – 50 g/L, pH> 11, VeruSOL‐3 ‐ 5 g/L, 10oC, 30 daysColumn 2 – Sodium Persulfate – 100 g/L, pH> 11, VeruSOL‐3 ‐ 5 g/L, 10oC, 14 daysColumn 3 – Sodium Persulfate – 100 g/L, pH> 8, Fe‐TAML‐ 0.1 µMm VeruSOL‐3 ‐ 5 g/L, 14 daysAll Columns run at 10oC
Large Landfill CVOC Site– Soil Column Test Results
Copyright VeruTEK 2010Copyright VeruTEK 2010
79,000
673,350 1,500
100,000
425
14,050
5,500
17,000
8 375 10
44,000
2955,950
2,3606,700
02,900 1,900
41,000
0
10,3505,000
0
20,000
40,000
60,000
80,000
100,000
120,000
Initial Soil Column 1 ‐ 30 Day Treated Soil Column 2 ‐ 14 Day Treated Soil Column 3 ‐ 14 Day Treated Soil
COC
Conc
entr
atio
n (u
g/L)
Column Soil
Soil Column Experiments ‐Destruction of Target Compounds
Toluene Total Xylenes TCE PCE Hexachlorobenzene Naphthalene
Large Landfill CVOC Site– Soil Column Test Results

Copyright VeruTEK 2010Copyright VeruTEK 2010
58,900
24 26 3
47,250
5,555
0
10,000
20,000
30,000
40,000
50,000
60,000
70,000
Column 100SP 20 g/L + VSOL 5 g/L
+ Fe-EDTA 250 mg/L
Column 101SP 50 g/L + VSOL 10 g/L
+ Fe-EDTA 250 mg/L
Column 102SP 10 g/L + VSOL 2 g/L
+ Fe-EDTA 250 mg/L
TPH
(mg/
kg)
Before After
99.9% Destruction
99.9% Destruction
99.9% Destruction
Notes:1)DNAPL spiked soil was prepared using hexane to dissolve the DNAPL and uniformly contaminate the soil, followed by evaporation of the hexane prior to treatment.2)1kg of AFS 50-70 sand (200 µ to 300 µ particle size) was used in each of Columns 100 and 101. 3)1kg of AFS 20-40 sand was used in Column 102. 4)5 g MGP DNAPL was dissolved in 100 mL hexane for Columns 100 and 101 and 1 g MGP DNAPL was dissolved in 100 mL hexane for Column 1025)For each column the DNAPL-hexane mixture was poured into the sand and periodically mixed in a pan and allowed to evaporate over a 24 hour period6)Each column was then packed in the columns in small lifts by place the sand in standing water then vibrating to consolidate sand. This procedure was repeated until 1kg was placed in the column7)Columns effluents were sampled daily (complete composite) for persulfate, pH, ORP, conductivity, turbidity, flow rate, interfacial tension and TPH8)After completion of tests each column was sacrificed, composited into three aliquots (top, middle and bottom) and analyze for TPH 9)Experiments were run for 28 days10)Flow rates for each column were 0.5 ml/min
Column MGP S‐ISCO® Treatment
Copyright VeruTEK 2010Copyright VeruTEK 2010
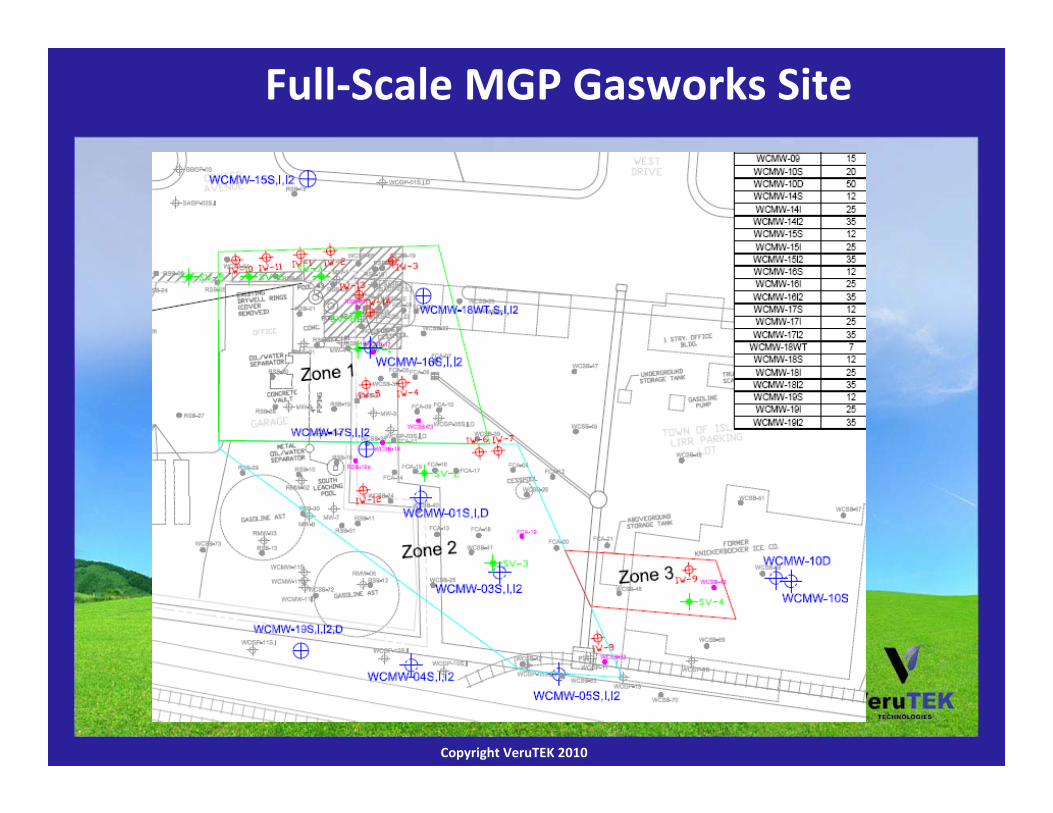
Full‐Scale MGP Gasworks Site

Copyright VeruTEK 2010Copyright VeruTEK 2010
• Gasworks Contamination at Large Site
• This Portion of Site Received Process Wastewater and Coal Tar
• Contamination from 1.2 m to ~ 9.0 m Below Ground Surface over 0.33 ha
• Extensive Coal Tar Saturated Soils Present in Lenses(Shallower, Deeper and Upgradient Contamination Discovered After Project Started)
• Fine to Medium Sand – 1.0 m to Water Table – 21 m to Aquitard
• Required Targeting Upper 10 m
Full‐Scale MGP Gasworks Site

Copyright VeruTEK 2010Copyright VeruTEK 2010
• Injected Chemicals – May 2009 to November 2009 ‐ 160,000 kg Sodium Persulfate‐ 45,000 kg Fe‐EDTA‐ 13,000 kg VeruSOL‐3
• 42 Monitoring Wells in 18 Clusters
• 12 Injection Wells – Typically 15 g/L to 25 g/L Persulfate, <5 g/L VeruSOL‐3 and 250 mg/L of Fe‐EDTA as Fe
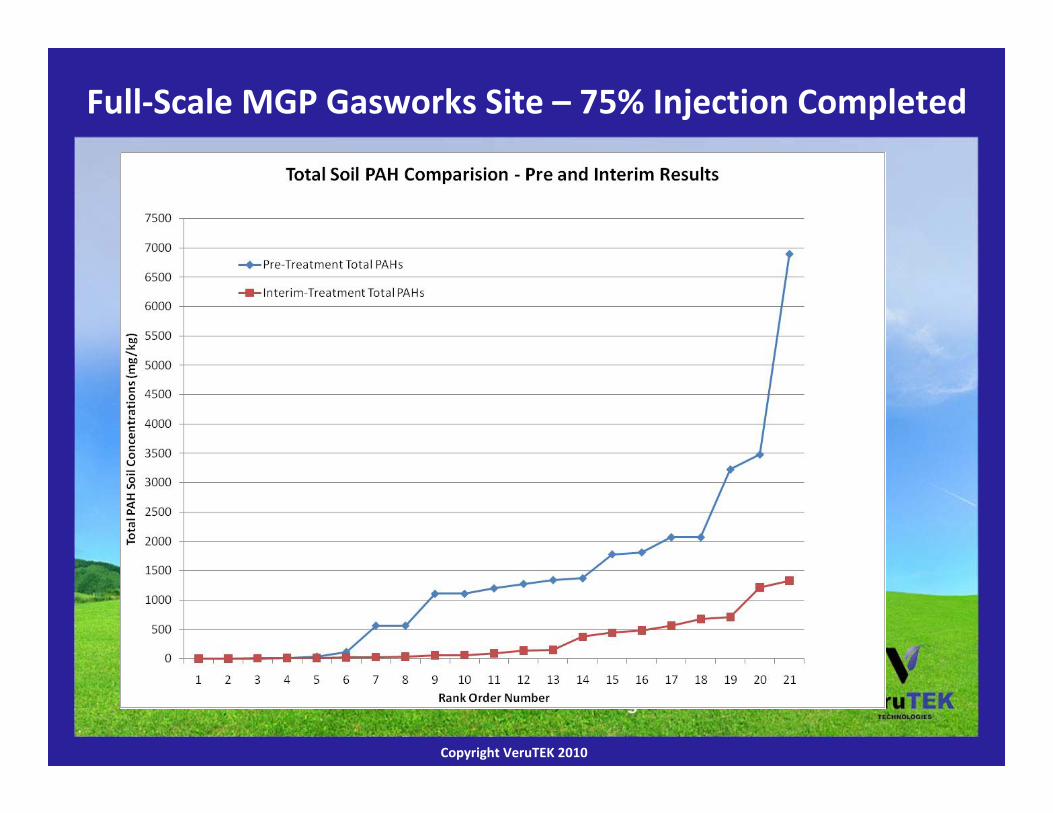
• Interim Soil Samples Taken After 75% of Chemical Injected (10/09) (Represents 50% of S‐ISCO Chemicals Reacted)
• 56,000 Metric Tons Soils (29,250 m3) Treated
• 49,000 kg TPH Destroyed – 79% Reduction 50% Chemical Reacted
• ~2.9 g Persulfate/kg Soil Applied to Treatment Zone
Full‐Scale MGP Gasworks Site
Copyright VeruTEK 2010Copyright VeruTEK 2010
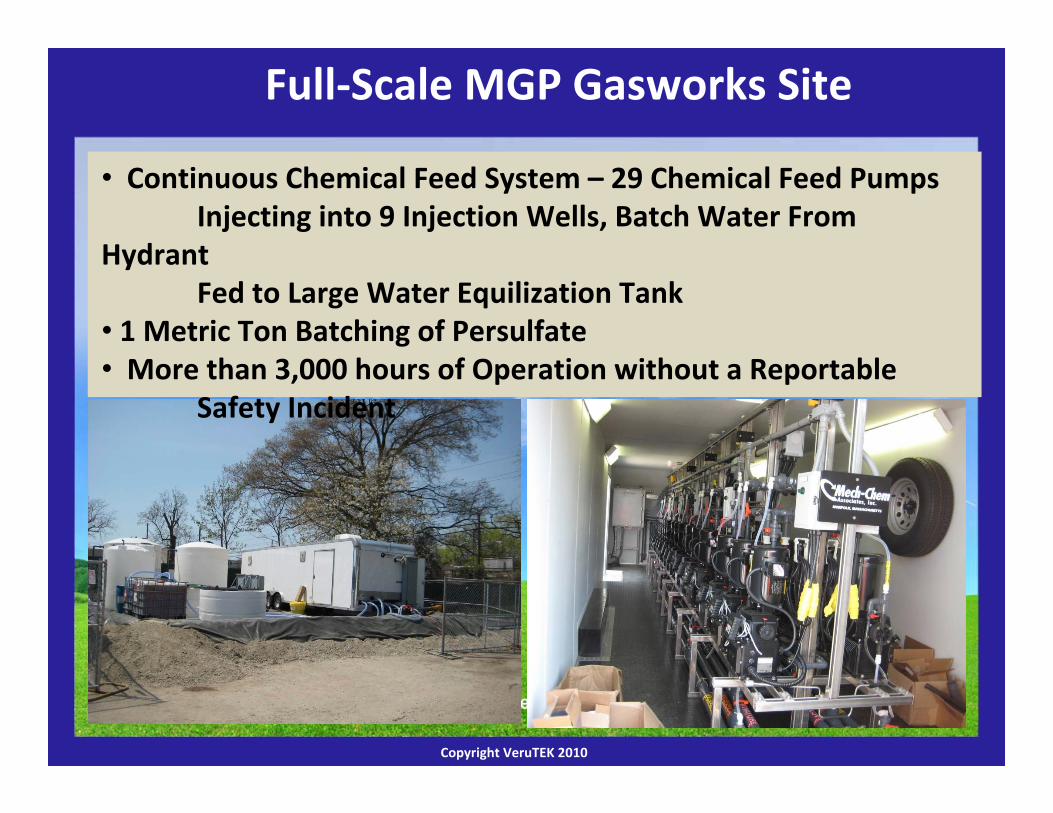
Full‐Scale MGP Gasworks Site
• Continuous Chemical Feed System – 29 Chemical Feed PumpsInjecting into 9 Injection Wells, Batch Water From
HydrantFed to Large Water Equilization Tank
• 1 Metric Ton Batching of Persulfate• More than 3,000 hours of Operation without a Reportable
Safety Incident
Copyright VeruTEK 2010Copyright VeruTEK 2010
Full‐Scale MGP Gasworks Site – 75% Injection Completed
Copyright VeruTEK 2010Copyright VeruTEK 2010
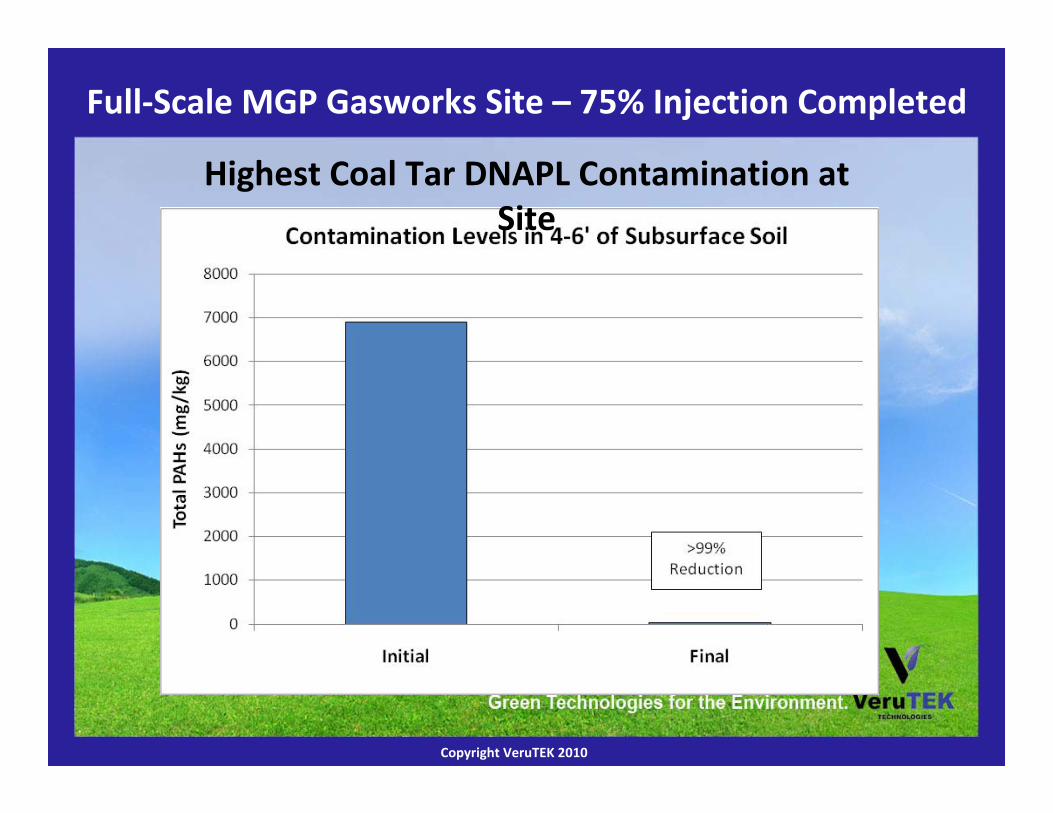
Highest Coal Tar DNAPL Contamination at Site
Full‐Scale MGP Gasworks Site – 75% Injection Completed

Copyright VeruTEK 2010Copyright VeruTEK 2010
0
2
4
6
8
10
12
14
0
0.2
0.4
0.6
0.8
1
1.2
1.4
1.6
1.8
2
3/28 5/17 7/6 8/25 10/14 12/3 1/22 3/13
Pers
ulfa
te C
once
ntra
tion
(g/L
)
Elec
trol
ytic
Con
duct
ivit
y (m
S/cm
)
Date
WCMW‐16IElectrolytic Conductivity (mS/cm) and Persulfate
Concentration (g/L)
Cond. (mS/cm)
Persulfate Conc. (g/L)
0
2
4
6
8
10
12
14
0
0.2
0.4
0.6
0.8
1
1.2
1.4
1.6
1.8
2
3/28 5/17 7/6 8/25 10/14 12/3 1/22 3/13
Pers
ulfa
te C
once
ntra
tion
(g/L
)
Elec
trol
ytic
Con
duct
ivit
y (m
S/cm
)
Date
WCMW‐16SElectrolytic Conductivity (mS/cm) and Persulfate
Concentration (g/L)
Cond. (mS/cm)
Persulfate Conc. (g/L)
0
2
4
6
8
10
12
14
0
0.2
0.4
0.6
0.8
1
1.2
1.4
1.6
1.8
2
3/28 5/17 7/6 8/25 10/14 12/3 1/22 3/13Pe
rsul
fate
Con
cent
rati
on (g
/L)
Elec
trol
ytic
Con
duct
ivit
y (m
S/cm
)
Date
WCMW‐16I2Electrolytic Conductivity (mS/cm) and Persulfate
Concentration (g/L)
Cond. (mS/cm)
Persulfate Conc. (g/L)
0.6 – 3.7 mScreened Interval
6.1 – 7.6 mScreened Interval
9.1 – 10.7 mScreened Interval
Full‐Scale MGP Gasworks Site – Typical Monitoring ResultsElectrolytic Conductivity and Persulfate Concentrations
Copyright VeruTEK 2010Copyright VeruTEK 2010
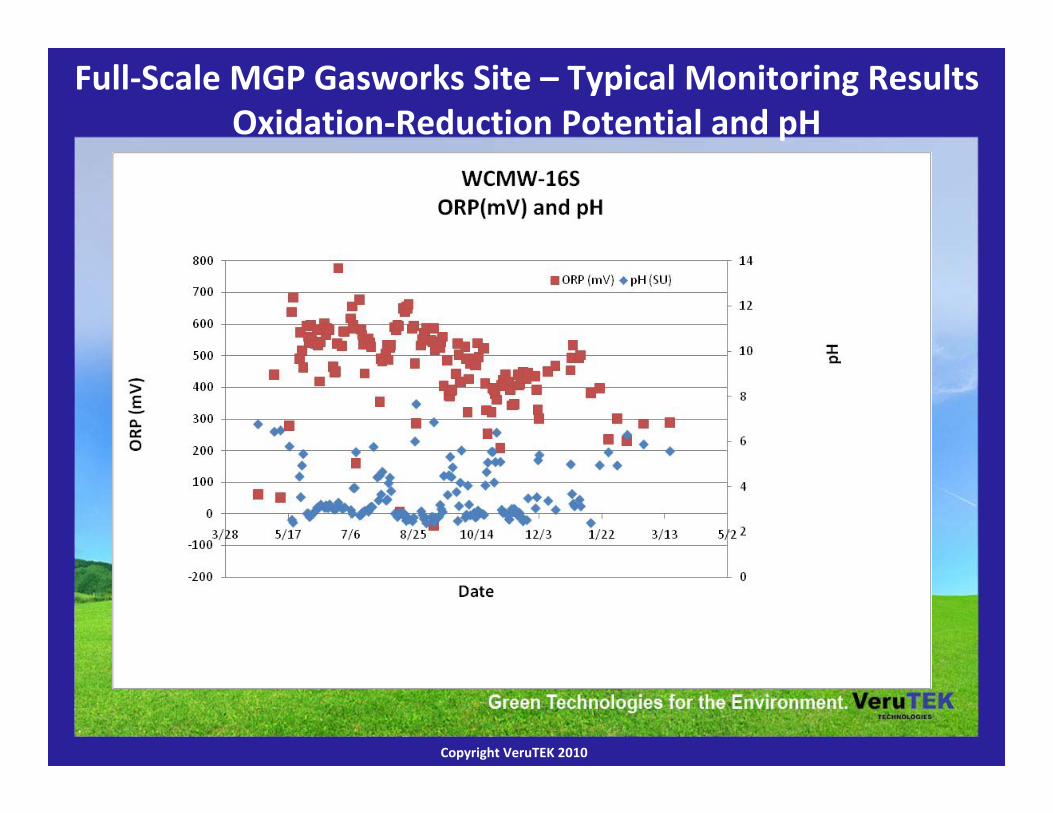
Full‐Scale MGP Gasworks Site – Typical Monitoring ResultsOxidation‐Reduction Potential and pH

Copyright VeruTEK 2010Copyright VeruTEK 2010
Full‐Scale MGP Gasworks Site – MW‐1 PAH Groundwater

Copyright VeruTEK 2010Copyright VeruTEK 2010
• Significant Mass Reduction After Only 50% Chemical Reacted‐ 49,000 kg TPH Removed
• Groundwater Reductions Last to Be Observed Based on the Process, but Reductions are Taking Place
• No Groundwater PAH Increases Downgradient in the Next Gasworks Contaminated Property
• Rigorous Monitoring Shows Reactants and Reaction FrontPassing Through the Treatment Zones
• Able to Target Upper 10 m of Saturated Zone
• More Contamination Initially Present than Estimated by Consultants – Upgradient and Shallow
• Costs for Design, Implementation, Project Management and Monitoring ~ 215DKK/Metric Ton – 28.8€/Metric Ton
Conclusions MGP Gasworks Site
Copyright VeruTEK 2010Copyright VeruTEK 2010
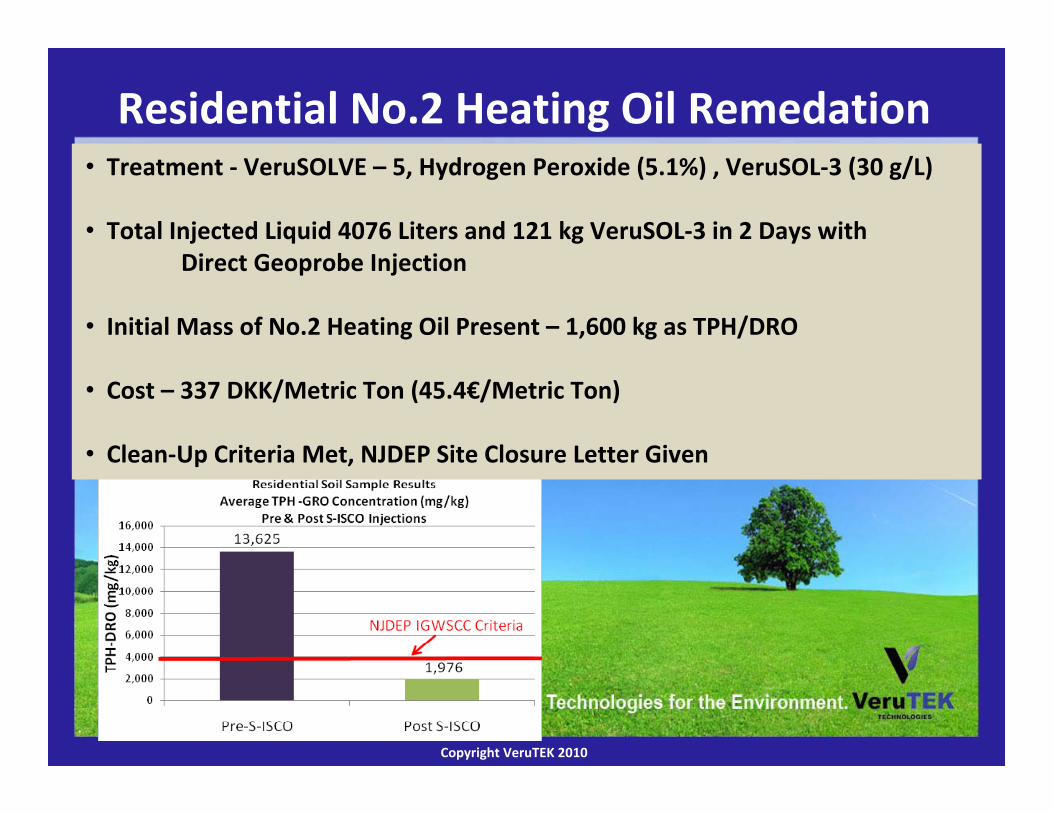
Residential No.2 Heating Oil Remedation• Treatment ‐ VeruSOLVE – 5, Hydrogen Peroxide (5.1%) , VeruSOL‐3 (30 g/L)
• Total Injected Liquid 4076 Liters and 121 kg VeruSOL‐3 in 2 Days with Direct Geoprobe Injection
• Initial Mass of No.2 Heating Oil Present – 1,600 kg as TPH/DRO
• Cost – 337 DKK/Metric Ton (45.4€/Metric Ton)
• Clean‐Up Criteria Met, NJDEP Site Closure Letter Given

Copyright VeruTEK 2010Copyright VeruTEK 2010
Pharmaceutical Chlorinated Solvent Site• 2,807 Metric Tons Soil Treated , 584 m3 soil in November 2008• Contaminants ‐ 1‐1‐dichloroethene, 1,2‐dichloroethane, benzene and
chlorobenzene• Total Contaminant Mass – 227 kg• Soils were Silty Sand with Clay with Significant Contamination of the Backfill
Around Many Utility Trenches in Clay with Sand/Clay Backfill• 80,533 L liquid Injected with 13.2 kg Fe‐EDTA, 609 kg VeruSOL‐3 • Injection Over a 18 days of Injection During 4 Week Period• CTDEP Criteria Met for All Contaminants 1,1‐dichloroethene (6 ug/L),
benzene (530 ug/L), chlorobenzene (6150 ug/L), and 1,2‐dichloroethane (90 ug/L)
• Site Closed in August 2009
Copyright VeruTEK 2010Copyright VeruTEK 2010
Area III, Skuldelev Site Denmark• Full‐Scale Application Presented by Lotte Rasmussen, NIRAS
• Summary Laboratory Treatability Test Presented Here
• Significant Pure Phase Tetrachloroethylene (PCE) DNAPL PresentLower Concentrations of TCE, cis‐1,2‐DCE and Vinyl Chloride
• Treatment using S‐ISCO with Alkaline Persulfate
• Laboratory Treatability Test Completed in January 2008‐ PCE DNAPL Solubilization Tests‐ Emulsion Oxidation Tests‐ Soil Oxidant Demand Tests
Copyright VeruTEK 2010Copyright VeruTEK 2010
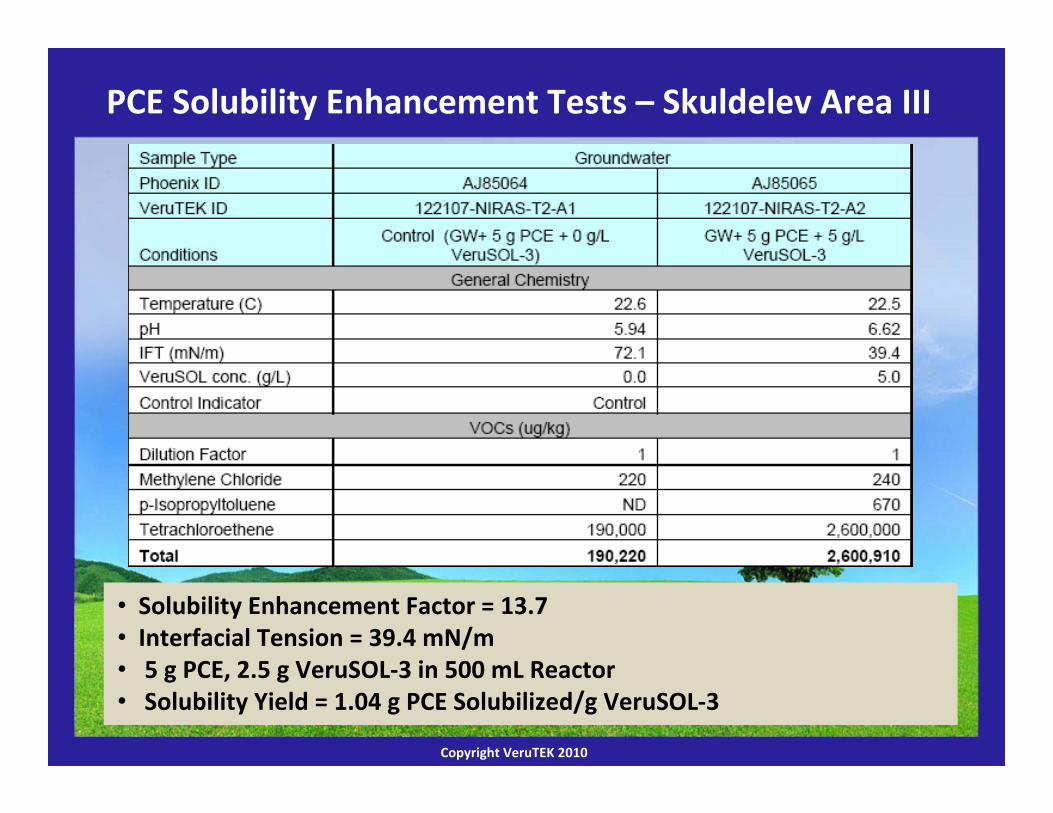
• Solubility Enhancement Factor = 13.7• Interfacial Tension = 39.4 mN/m• 5 g PCE, 2.5 g VeruSOL‐3 in 500 mL Reactor• Solubility Yield = 1.04 g PCE Solubilized/g VeruSOL‐3
PCE Solubility Enhancement Tests – Skuldelev Area III
Copyright VeruTEK 2010Copyright VeruTEK 2010
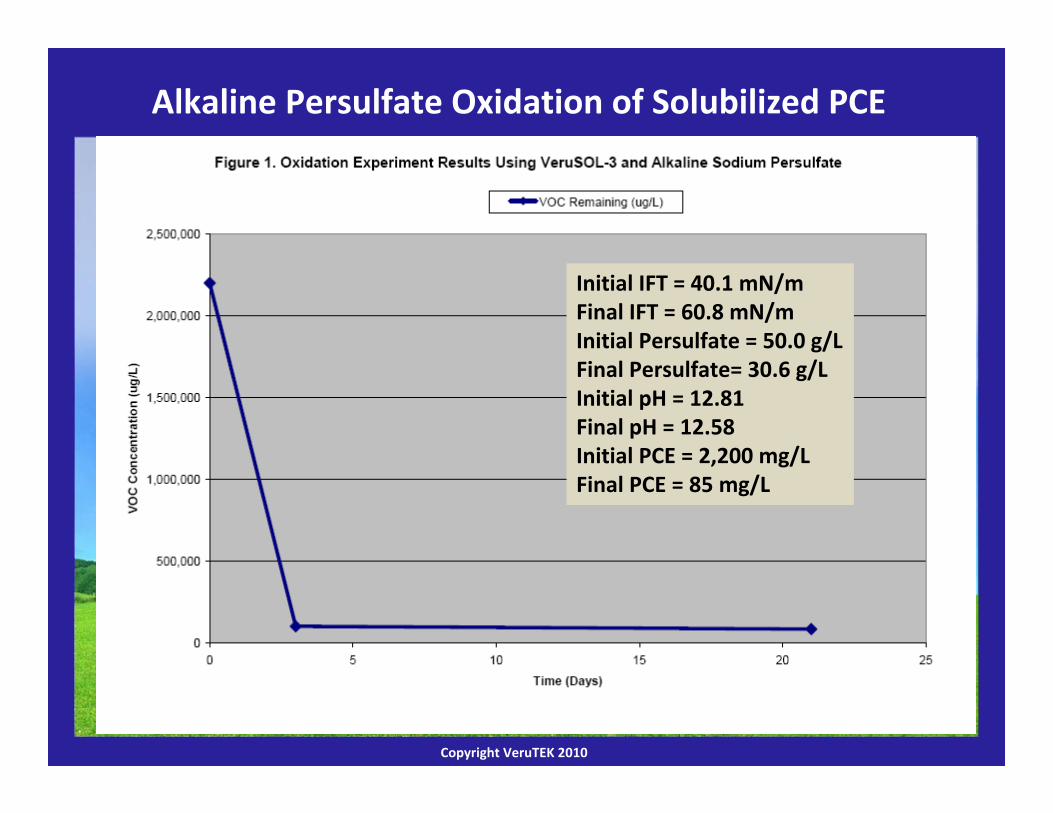
Alkaline Persulfate Oxidation of Solubilized PCE
Initial IFT = 40.1 mN/mFinal IFT = 60.8 mN/mInitial Persulfate = 50.0 g/LFinal Persulfate= 30.6 g/LInitial pH = 12.81 Final pH = 12.58Initial PCE = 2,200 mg/LFinal PCE = 85 mg/L

Copyright VeruTEK 2010Copyright VeruTEK 2010
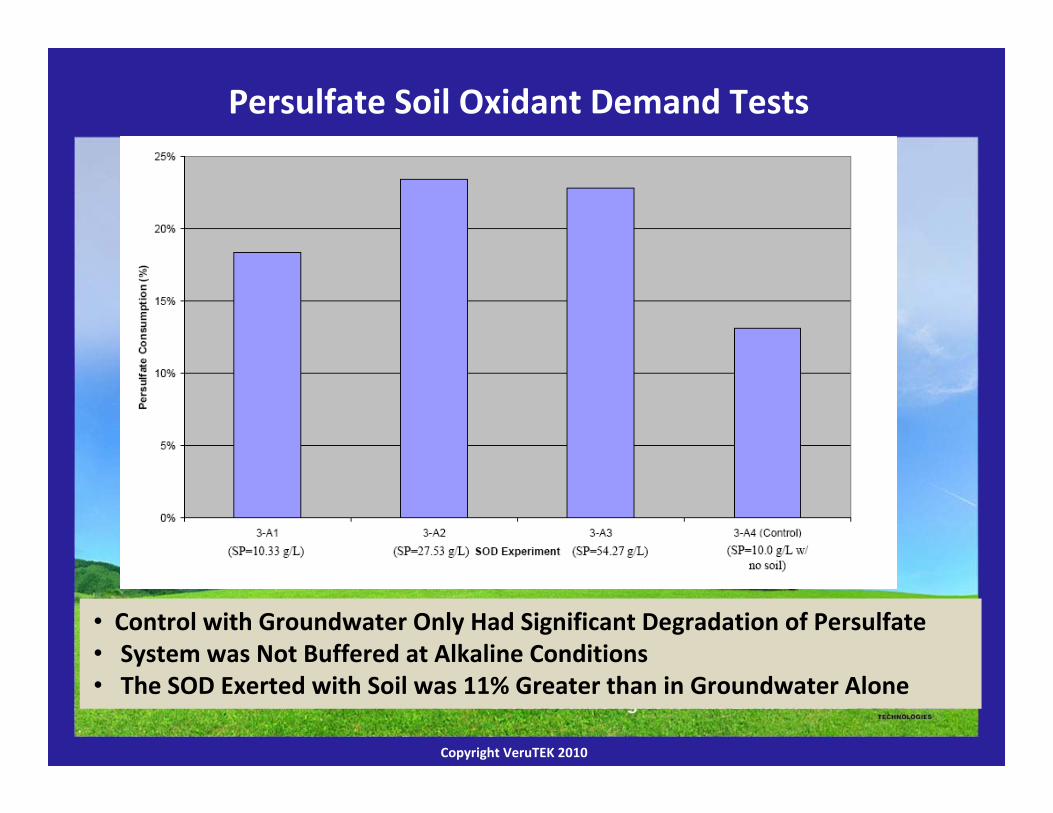
Persulfate Soil Oxidant Demand Tests
• Persulfate SOD TestConditions and Results
Copyright VeruTEK 2010Copyright VeruTEK 2010
• Control with Groundwater Only Had Significant Degradation of Persulfate• System was Not Buffered at Alkaline Conditions• The SOD Exerted with Soil was 11% Greater than in Groundwater Alone
Persulfate Soil Oxidant Demand Tests

Copyright VeruTEK 2010Copyright VeruTEK 2010
• Treatment Area ~75 m2 – Treat Larger Area to Ensure Contact
• Treatment Soil Volume ‐ 375 m3
• Estimated Contaminant Mass ‐ 1,102 kg DNAPL
• Design Soil Oxidant Demand (with DNAPL included) – 15 g/kg
• VeruSOL‐3 Dose – 800 kg
• NaOH Dose – 800 kg (based on Soil Titration Curve)
• Design Injection Flow – 5 gpm (Sandy Site)
• Design Injection Concentration of Persulfate – 100 g/L(Used 25 to 50 g/L to Avoid Density Driven Transport)
Full‐ Scale Design Area III Skuldelev Site