surrogate safety measures from traffic simulation models final report
TRANSCRIPT

Surrogate Safety Measures From Traffic Simulation Models
Final Report
Publication No: FHWA-RD-03-050
U.S. DEPARTMENT OF TRANSPORTATION FEDERAL HIGHWAY ADMINISTRATION Research, Development, and Technology Office of Safety Research and Development Turner-Fairbank Highway Research Center 6300 Georgetown Pike McLean, Virginia 22101
FOREWORD This report summarizes the activities and results of a project to evaluate the assessment of surrogate measures of safety for traffic intersections from existing, commercially available traffic simulation models. The objective of the project was to evaluate the various simulation models’ capabilities for producing measures of intersection safety and specify algorithms for calculating the measures. Copies of this report can be obtained from the Research and Technology Report Center, 9701 Philadelphia Court, Unit Q, Lanham, Maryland 20706; telephone: (301) 577-0818; fax: (301) 577-1421; or the National Technical Information Service (NTIS), 5285 Port Royal Road, Springfield, Virginia 22161; telephone: (703) 487-4650; fax: (703) 321-8547.
Michael F. Trentacoste Director Office of Safety Research and Development
NOTICE This document is disseminated under the sponsorship of the U.S. Department of Transportation in the interest of information exchange. The United States Government assumes no liability for its contents or use thereof. This report does not constitute a standard, specification, or regulation. The U.S. government does not endorse products or manufacturers. Trade and manufacturers’ names appear in this report only because they are considered essential to the object of this document.

Technical Report Documentation Page
1. Report No. FHWA-RD-03-050
2. Government Accession No. 3. Recipient's Catalog No.
5. Report Date
4. Title and Subtitle Surrogate Safety Measures From Traffic Simulation Models, Final Report
6. Performing Organization Code
7. Author(s) Douglas Gettman and Larry Head
8. Performing Organization Report No.
10. Work Unit No. (TRAIS)
9. Performing Organization Name and Address Siemens Gardner Transportation Systems 6375 E. Tanque Verde, Suite 170 Tucson, AZ 85715
11. Contract or Grant No. DTFH61-01-P-00393 13. Type of Report and Period Covered Final Report October 2001 – January 2003
12. Sponsoring Agency Name and Address Office of Safety Research and Development Turner-Fairbank Highway Research Center Federal Highway Administration 6300 Georgetown Pike McLean, VA 22101
14. Sponsoring Agency Code
15. Supplementary Notes FHWA Contracting Officer’s Technical Representative (COTR): Joe Bared, Office of Safety R&D 16. Abstract This project investigates the potential for deriving surrogate measures of safety from existing microscopic traffic simulation models for intersections. The process of computing the measures in the simulation, extracting the required data, and summarizing the results is denoted as the Surrogate Safety Assessment Methodology. These surrogate measures could then be used to support traffic engineering alternatives evaluation with respect to safety for both signalized and unsignalized intersections. The report describes the five main activities of this project: (1) review of previous work in modeling of safety at traffic facilities (focusing on intersection safety modeling) using surrogate measures, (2) survey of the capabilities of existing traffic simulation models to support derivation of surrogate measures of safety, (3) identification of use cases and functional requirements for a surrogate safety assessment tool that interacts with traffic simulation model outputs, (4) specification of algorithms for calculating surrogate measures of safety appropriate for intersections, and (5) suggestions for validation activities to support the analysis potential for surrogate measures and compare surrogate measures from simulation models with field data and previous safety studies. 17. Key Words Surrogate safety measures, traffic simulation models, traffic conflicts, intersection safety assessment.
18. Distribution Statement No restrictions. This document is available to the public through the National Technical Information Service. Springfield, VA 22161
19. Security Classif. (of this report) Unclassified
20. Security Classif. (of this page) Unclassified
21. No. of Pages 126
22. Price
Form DOT F 1700.7 (8-72) Reproduction of completed page authorized

SI* (MODERN METRIC) CONVERSION FACTORS APPROXIMATE CONVERSIONS TO SI UNITS
APPROXIMATE CONVERSIONS FROM SI UNITS
Symbol When You Know Multiply By To Find Symbol
Symbol When You Know Multiply By To Find Symbol
LENGTH
in inches 25.4 millimeters mm ft feet 0.305 meters m yd yards 0.914 meters m mi miles 1.61 kilometers km
AREA
in2 square inches 645.2 square millimeters mm2 ft2 square feet 0.093 square meters m2 yd2 square yards 0.836 square meters m2 ac acres 0.405 hectares ha mi2 square miles 2.59 square kilometers km2
VOLUME
fl oz fluid ounces 29.57 millimeters mL gal gallons 3.785 liters L ft3 cubic feet 0.028 cubic meters m3 yd3 cubic yards 0.765 cubic meters m3
NOTE: Volumes greater than 1000 L shall be shown in m3.
MASS
oz ounces 28.35 grams g lb pounds 0.454 kilograms kg T short tons (2000 lb) 0.907 megagrams Mg
(or "metric ton") (or "t") TEMPERATURE (exact)
°F Fahrenheit 5(F-32)/9 Celsius °C temperature or (F-32)/1.8 temperature
ILLUMINATION
fc foot-candles 10.76 lux lx fl foot-Lamberts 3.426 candela/m2 cd/m2
FORCE and PRESSURE or STRESS
lbf poundforce 4.45 newtons N lbf/in2 poundforce per 6.89 kilopascals kPa
square inch
LENGTH
mm millimeters 0.039 inches in m meters 3.28 feet ft m meters 1.09 yards yd km kilometers 0.621 miles mi
AREA
mm2 square millimeters 0.0016 square inches in2 m2 square meters 10.764 square feet ft2 m2 square meters 1.195 square yards yd2 ha hectares 2.47 acres ac km2 square kilometers 0.386 square miles mi2
VOLUME
mL milliters 0.034 fluid ounces fl oz L liters 0.264 gallons gal m3 cubic meters 35.71 cubic feet ft3 m3 cubic meters 1.307 cubic yards yd3
MASS
g grams 0.035 ounces oz kg kilograms 2.202 pounds lb Mg megagrams 1.103 short tons (2000 lb) T
(or "metric ton") TEMPERATURE (exact)
°C Celsius 1.8C + 32 Fahrenheit °F temperature temperature
ILLUMINATION
lx lux 0.0929 foot-candles fc fl candela/m2 0.2919 foot-Lamberts fl
FORCE and PRESSURE or STRESS
N newtons 0.225 poundforce lbf kPa kilopascals 0.145 poundforce per lbf/in2
square inch
* SI IS THE SYMBOL FOR THE INTERNATIONAL SYSTEM OF UNITS. APPROPRIATE ROUNDING SHOULD BE MADE TO COMPLY WITH SECTION 4 OF ASTM E380.
iii
Surrogate Safety Measures From Traffic Simulation Models FHWA-RD-03-050
1
TABLE OF CONTENTS 1. INTRODUCTION................................................................................................................. 5
2. LITERATURE REVIEW .................................................................................................... 7 CONFLICTS................................................................................................................................... 8
Conflict Severity...................................................................................................................... 8 Ranking Conflict Measures on Collection Desirability .......................................................... 9
OTHER SURROGATE MEASURES................................................................................................. 10 SURROGATE MEASURES FROM MICROSCOPIC SIMULATIONS..................................................... 11
General-Purpose Microscopic Models ................................................................................. 11 LITERATURE SUMMARY............................................................................................................. 12
3. TRAFFIC SIMULATION MODEL OVERVIEW.......................................................... 11 GENERAL ................................................................................................................................... 13 BEHAVIOR MODELING ............................................................................................................... 17 DATA EXTRACTION.................................................................................................................... 23 CALIBRATION AND PARAMETERS............................................................................................... 26 COST.......................................................................................................................................... 29
4. DISCUSSION OF MICROSCOPIC SIMULATION MODEL COMPARISONS....... 31 CORSIM ................................................................................................................................... 31 SIMTRAFFIC........................................................................................................................... 32 VISSIM..................................................................................................................................... 32 HUTSIM ................................................................................................................................... 32 PARAMICS.................................................................................................................................. 33 INTEGRATION............................................................................................................................. 33 AIMSUN................................................................................................................................... 33 WATSIM .................................................................................................................................. 34 TEXAS........................................................................................................................................ 34
5. SUMMARY OF SIMULATION MODEL FEATURES REVIEW ............................... 35
6. SSAM FUNCTIONAL REQUIREMENTS...................................................................... 37 FUNCTIONAL REQUIREMENTS DEVELOPMENT PROCESS ............................................................ 37
System Owner, Users, and Stakeholders............................................................................... 38 SSAM Objectives................................................................................................................... 39 Concept of Operation of the SSAM....................................................................................... 39
USE CASE ANALYSIS ................................................................................................................. 40 System Users ......................................................................................................................... 41 Use Case Packages ............................................................................................................... 42
USER INTERFACE MOCK-UPS..................................................................................................... 47 FUNCTIONAL REQUIREMENTS .................................................................................................... 52
7. ALGORITHMS FOR SURROGATE MEASURES OF SAFETY AT INTERSECTIONS...................................................................................................................... 63

Surrogate Safety Measures From Traffic Simulation Models FHWA-RD-03-050
2
CONFLICT EVENT DESCRIPTIONS ............................................................................................... 63 Crossing Flows—Conflict Point Events ............................................................................... 64 Merging Crossing Flows—Conflict Line Events.................................................................. 64 Adjacent Flows—Lane-Changing Conflict Line Events....................................................... 65 Following Flows—Rear-End Conflict Line Events .............................................................. 65 Collision Types Not Represented in the Surrogate Measures .............................................. 65 Pedestrian Collisions ............................................................................................................ 66 U-Turn-Related Collisions.................................................................................................... 66 Summary ............................................................................................................................... 67 Unrepresented Evasive Maneuvers....................................................................................... 67 Significant Unrepresented Conflict Event Contributors....................................................... 68
CONFLICT POINT........................................................................................................................ 69 CONFLICT LINE .......................................................................................................................... 72 REAR-END CONFLICT LINE........................................................................................................ 75 SUMMARY OF CONFLICT POINTS, LINES, AND REAR-END LINES............................................... 78 SURROGATE MEASURES DEFINITIONS........................................................................................ 78
Severity of Conflict and Severity of Resulting Collision....................................................... 78 SURROGATE MEASURES FOR CONFLICT POINTS ........................................................................ 80
Time To Collision.................................................................................................................. 80 Post-Encroachment Time...................................................................................................... 80 MaxS ..................................................................................................................................... 80 DeltaS.................................................................................................................................... 80 Initial Deceleration Rate....................................................................................................... 80 Location of the Conflict Point............................................................................................... 80
COMPUTATIONAL ALGORITHMS—CONFLICT POINTS ................................................................ 82 SURROGATE MEASURES FOR CONFLICT LINES WITH MERGING FLOWS .................................... 85
Time To Collision.................................................................................................................. 85 Post-Encroachment Time...................................................................................................... 85 MaxS ..................................................................................................................................... 85 DeltaS.................................................................................................................................... 86 Initial Deceleration Rate....................................................................................................... 86 Location of the Conflict Line ................................................................................................ 86
COMPUTATIONAL ALGORITHMS—CONFLICT LINES FOR MERGING FLOWS ............................... 88 SURROGATE MEASURES FOR REAR-END CONFLICT LINES ........................................................ 91
Time To Collision.................................................................................................................. 91 Post-Encroachment Time...................................................................................................... 91 MaxS ..................................................................................................................................... 91 DeltaS.................................................................................................................................... 92 Initial Deceleration Rate....................................................................................................... 92 Location of the Conflict Line ................................................................................................ 92
COMPUTATIONAL ALGORITHMS—REAR-END CONFLICT LINES ................................................ 94 SUMMARY.................................................................................................................................. 97
8. EVENT FILE SPECIFICATION...................................................................................... 99 ELEMENTS IN THE EVENT FILE................................................................................................... 99

Surrogate Safety Measures From Traffic Simulation Models FHWA-RD-03-050
3
Elements in the Header....................................................................................................... 101 Elements in Each Time Step................................................................................................ 101 Implications of File Size...................................................................................................... 101 File Naming Conventions ................................................................................................... 102
9. VALIDATION OF SURROGATE MEASURES .............................................................. 103 DISCRIMINATION BETWEEN INTERSECTION DESIGN ALTERNATIVES ....................................... 103
Approach............................................................................................................................. 104 CORRELATION WITH TRAFFIC CONFLICTS............................................................................... 104
Approach............................................................................................................................. 104 PREDICTION OF REDUCTIONS IN TRAFFIC CONFLICTS.............................................................. 105
Approach............................................................................................................................. 105 Alternative Approach .......................................................................................................... 105
10. REPORT SUMMARY.................................................................................................. 107
11. REFERENCES.............................................................................................................. 111

Surrogate Safety Measures From Traffic Simulation Models FHWA-RD-03-050
4
LIST OF FIGURES Figure 1. Requirements development process........................................ 38 Figure 2. Event-file-based information flow diagram............................... 40 Figure 3. Use case package diagram. ................................................... 42 Figure 4. Main application with network-level display. ............................ 48 Figure 5. Intersection close-up window................................................. 49 Figure 6. Table display....................................................................... 49 Figure 7. Graph display. ..................................................................... 50 Figure 8. Distribution comparison display. ............................................ 51 Figure 9. Workspace display. .............................................................. 52 Figure 10. Conflict point and lines........................................................ 64 Figure 11. Conflict point diagram......................................................... 71 Figure 12. Conflict line example. ......................................................... 74 Figure 13. Rear-end conflict line example. ............................................ 77 Figure 14. Surrogate measures on conflict point diagram........................ 81 Figure 15. Surrogate measures on conflict line diagram. ......................... 87 Figure 16. Surrogates identified on rear-end line diagram. ...................... 93
LIST OF TABLES Table 1. Table of surrogate safety conflict measures. ............................... 9 Table 2. General simulation characteristics comparison........................... 16 Table 3. Behavior modeling comparison. .............................................. 22 Table 4. Data extraction capabilities comparison.................................... 25 Table 5. Calibration and parameters comparison.................................... 28 Table 6. Modification cost comparison. ................................................. 30 Table 7. Use case actors. ................................................................... 41 Table 8. Install and upgrade use cases................................................. 42 Table 9. Configure use cases. ............................................................. 44 Table 10. Operate use cases. .............................................................. 45 Table 11. Analysis use cases............................................................... 46 Table 12. Reporting use cases............................................................. 46 Table 13. Percentage of total intersection crashes made up of angle, rear-
end, and pedestrian collisions (other and unknown percentages in parentheses)............................................................................... 67

Surrogate Safety Measures From Traffic Simulation Models FHWA-RD-03-050
5
1. Introduction Safety is an area of increased attention and awareness within transportation engineering. Historically, safety has been difficult to assess for new and innovative traffic treatments, primarily because of the lack of good predictive models of crash potential and lack of consensus on what constitutes a safe or unsafe facility. This Federal Highway Administration (FHWA) project is intended to investigate the potential for deriving surrogate measures of safety from existing microscopic traffic simulation models for intersections. The process of computing the measures in the simulation, extracting the required data, and summarizing the results is denoted as the Surrogate Safety Assessment Methodology (SSAM). These surrogate measures could then be used to support traffic engineering alternatives evaluation with respect to safety for both signalized and unsignalized intersections. This document has several main sections:
1. Review of previous work in modeling of safety at traffic facilities (focusing on intersection safety modeling) using surrogate measures (covered in chapter 2).
2. Survey of the capabilities of existing traffic simulation models to support derivation of surrogate measures of safety (covered in chapters 3, 4, and 5).
3. Identification of use cases and functional requirements for a surrogate safety assessment tool that interacts with traffic simulation model outputs (covered in chapter 6).
4. Specification of algorithms for calculating surrogate measures of safety appropriate for intersections (covered in chapters 7 and 8).
5. Suggestions for validation activities to support the analysis potential for surrogate measures and compare surrogate measures from simulation models with field data and previous safety studies (covered in chapter 9).
6. Report summary (covered in chapter 10). 7. References (chapter 11).

Surrogate Safety Measures From Traffic Simulation Models FHWA-RD-03-050
6
Page intentionally blank

Surrogate Safety Measures From Traffic Simulation Models FHWA-RD-03-050
7
2. Literature Review For the purpose of this study, the safety of a traffic facility is defined as follows: The expected number of crashes, by type, expected to occur at an entity in a certain period, per unit of time. In this study, crashes will be treated as unintended collisions between two or more motor vehicles of the canonical types specified in (1). Note that single-vehicle crashes are excluded from this definition. In addition, the bulk of crash research and the available literature on surrogate measures neglects collisions involving more than two vehicles. Those events are much less prevalent than collisions involving a pair of vehicles (e.g., see table 1 in [2]). To estimate the safety of various traffic facilities, including facilities that have not yet been built, research in safety has focused on the establishment of safety performance functions that relate the number of crashes or crash rate to a number of “operational” (e.g., Average annual daily traffic (AADT), average speed) and “nonoperational” independent variables via a (typically complex) regression equation(s), including AADT, occupancy, Volume to capacity (V/C) ratios, products of crossing volumes, etc. (2, 3, 4, 5, 6, 7, 8, 9, 10, 11, 12, 13). Calibration is then required to choose the equation parameters for the best statistical fit to the available data (2, 14, 15). Research has also been done on Bayesian methods and advanced statistical techniques (e.g., Classification And Regression Trees) for revising crash estimates based on observations as a way to develop safety estimates for facilities with no crash data (16, 17, 18, 19, 20). Various other methods for combining crash rates and other measures into “safety level of service” measures (21, 22) or common indices based on one type of crash (e.g., property damage only) have also been proposed (23). Both methods proposed in (21) and (23) rely on macroscopic measurements of total flows rather than recording individual vehicle movements or events to develop safety level-of-service estimates. Despite the large body of safety modeling research, absolute numbers of crashes and crash rates are still difficult to predict accurately. This has led to increased interest over time in obtaining surrogate measures that reflect the safety of a facility or at least the increased probability of higher than average crash rates for a facility. The most prevalent literature in surrogate measures is related to the traffic conflicts technique (24, 25, 26, 27).

Surrogate Safety Measures From Traffic Simulation Models FHWA-RD-03-050
8
Conflicts A conflict is defined as: An observable situation in which two or more road users approach each other in time and space to such an extent that there is risk of collision if their movements remain unchanged (28). The traffic conflicts technique is a methodology for field observers to identify conflict events at intersections by watching for strong braking and evasive maneuvers. The method has a long history of development, including research on:
• Recommended data collection methods (27, 29). • Definitions of various types of conflicts (26, 30). • Severity measures (31, 32). • How conflict measures are related to crash counts (27, 33). • How conflicts are related to specific crash types (23). • Standards for data collection (34). • Standard definitions of conflict indices that can be used to compare the
performance of multiple facilities (33). There is, however, still some debate regarding the connection between conflict measures and crash predictions (30). This includes the fact that the subjectivity of field observers induces additional uncertainty into the collection of accurate data on conflicts. Conflict studies are, however, still continuing to be used to rank locations with respect to safety to identify construction upgrades (35, 36, 37). There is general consensus that higher rates of traffic conflicts can indicate lower levels of safety for a particular facility, given that conflicts generally result from a lack or misunderstanding of communication between the different road users (38, 39). Conflict Severity Tabulation of total numbers of traffic conflicts indicates one part of the safety issue (frequency). The other element of the safety issue is the severity of the conflicts that occur. The primary conflict severity measure that has been proposed is the time to collision (TTC) (31, 40). Some researchers have indicated that TTC is the surrogate measure of safety, while others refute that lower TTC indicates higher severity of crashes, primarily because speed is not included in the measure (41, 42). That is to say that lower TTC certainly indicates a higher probability of collision, but cannot be directly linked to the severity of the collision. Some research indicates deceleration rate (DR) as the primary indicator of severity instead
Surrogate Safety Measures From Traffic Simulation Models FHWA-RD-03-050
9
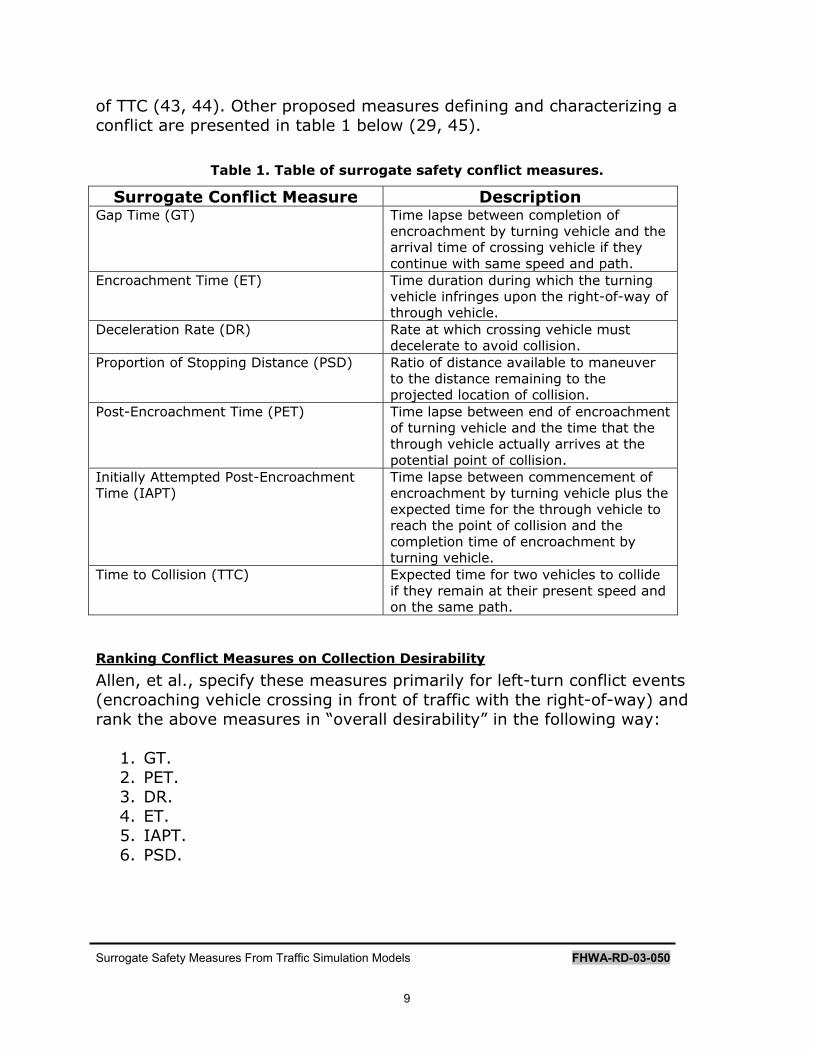
of TTC (43, 44). Other proposed measures defining and characterizing a conflict are presented in table 1 below (29, 45).
Table 1. Table of surrogate safety conflict measures.
Surrogate Conflict Measure Description Gap Time (GT) Time lapse between completion of
encroachment by turning vehicle and the arrival time of crossing vehicle if they continue with same speed and path.
Encroachment Time (ET) Time duration during which the turning vehicle infringes upon the right-of-way of through vehicle.
Deceleration Rate (DR) Rate at which crossing vehicle must decelerate to avoid collision.
Proportion of Stopping Distance (PSD) Ratio of distance available to maneuver to the distance remaining to the projected location of collision.
Post-Encroachment Time (PET) Time lapse between end of encroachment of turning vehicle and the time that the through vehicle actually arrives at the potential point of collision.
Initially Attempted Post-Encroachment Time (IAPT)
Time lapse between commencement of encroachment by turning vehicle plus the expected time for the through vehicle to reach the point of collision and the completion time of encroachment by turning vehicle.
Time to Collision (TTC) Expected time for two vehicles to collide if they remain at their present speed and on the same path.
Ranking Conflict Measures on Collection Desirability
Allen, et al., specify these measures primarily for left-turn conflict events (encroaching vehicle crossing in front of traffic with the right-of-way) and rank the above measures in “overall desirability” in the following way:
1. GT. 2. PET. 3. DR. 4. ET. 5. IAPT. 6. PSD.

Surrogate Safety Measures From Traffic Simulation Models FHWA-RD-03-050
10
This ranking by Allen, et al., takes into consideration the relation to crash history, relations among the other measurements, consistency over time, relation to braking application, ease of measurement, and application to other conflict types. TTC is similar to GT and would be ranked accordingly. The measures in table 1 are computed for each conflicting event (as appropriate for the measure, e.g., GT does not apply to rear-end conflicting events). More evaluation of each of these measures will be provided in the algorithm development report. Other Surrogate Measures Other surrogate safety measures proposed in the literature for intersections include fairly standard measures of effectiveness: delay, travel time, approach speed, percent stops, queue length, stop-bar encroachments, red-light violations, percent left turns, spot speed, speed distribution, and deceleration distribution (46, 47, 48). No attempt was made to relate these measures quantitatively to crash rates, but rather to assert such rules-of-thumb as “more stop-bar encroachments indicates higher probability of crashes,” “longer queues indicate higher probability of crashes,” and so on. A similar list of surrogates for two-lane roads has also been published, although more non-operational variables appear in the list for two-lane roads (e.g., superelevation, curvature, distance since last curve) (12, 46, 47, 48). The above statistics, as well as conflict measures, require field observer crews to collect the data. This is expensive and includes the problem of unreliable subjective observers. Collection of TTC measures and the other measures in table 1 requires instrumented vehicles and/or high-resolution, multi-view video footage and extensive human analysis. Some additional surrogate measures proposed include:
• DR distributions. • Required braking power distributions. • Distribution of merge points (freeway travel). • Merge area encroachments (freeway on-ramp merging in weaving
areas). • Gap-acceptance distributions. • Number of vehicles caught in dilemma zones. • Speed differential between crossing movements. • Speed variance. • Red- and yellow-light violations by phase. • Time-integrated and time-exposed TTC measures (TET and TIT—
duration of time that the TTC is less than a threshold and the integrated total TTC summation during that time, respectively) (49).

Surrogate Safety Measures From Traffic Simulation Models FHWA-RD-03-050
11
Surrogate Measures From Microscopic Simulations As indicated by the above measures, microscopic simulations are generally required for generating and collecting conflict severity statistics and/or other surrogate measures that require detailed information on vehicle acceleration, deceleration, position, etc. as a substitute for field studies. Some simulation models have been built specifically for simulation of particular conflict types and based on varying approaches to the computation of conflicts (22, 45, 50, 51, 52, 53, 54, 55). In particular, (45) contains a comprehensive treatment of conflict types and surrogate measures for both signalized and unsignalized intersections. The level of detail and variety of modeling variables available to the user are typically compromised in special-purpose simulations. General-Purpose Microscopic Models Some previous efforts have also focused on modification of multipurpose traffic simulation models to include conflict statistics or other surrogates (32, 43, 56, 57, 58, 59). This category includes the Helsinki Urban Traffic Simulation (HUTSIM), Transportation Analysis and Simulation System (TRANSIMS), Integrated Traffic Simulator (INTRAS - now FRESIM - Freeway Simulation, part of CORSIM – Corridor Simulation), NETSIM (Network Simulation - also now part of CORSIM), Texas, Advanced Interactive Microscopic Simulator for Urban and Non-urban Networks (AIMSUN), and Integration (no acronym meaning). SAFETY INDICATORS (SINDI) The SINDI project specifies including a more detailed driver behavior model (i.e., “nanoscopic” simulation) into the HUTSIM microscopic simulation for representation of lapses in driver reaction time and errors in response. The project is still in development (58). The paper on TRANSIMS is a discussion of the potential uses of microsimulation for safety analysis (59). TRANSIMS uses macroscopic representation of vehicle movements to simulate large-scale network (e.g., entire cities) transportation behavior and is therefore probably not detailed enough for the level of analysis required for this effort. CORSIM CORSIM currently outputs “conflict” statistics by movement (left, right, through/diagonal), conflicting movement (left, right, through/diagonal), and approach for intersections when micronode analysis is enabled (60, 61). Micronode analysis is an approach to simulation of the vehicles within the intersection “box.” CORSIM normally operates by considering the intersection as a point. The vehicle movement logic determines whether the vehicle is clear to enter the intersection and then places the vehicle on the

Surrogate Safety Measures From Traffic Simulation Models FHWA-RD-03-050
12
next link after a delay time based on the speed of the vehicle and the width of the intersection (or path distance of the left or right turn). The animation element of CORSIM (Traffic Visualization - TRAFVU) “fills in” the movements of the vehicles within the intersection for visualization. The micronode module, although based on reasonable approximation principles, is not considered a viable model for intersection vehicle movements. Also, the FRESIM component of CORSIM was modified to output merging conflicts for freeway weaving sections (when the model was called INTRAS) at an earlier time (32). TEXAS Texas uses the concept of conflicts to determine acceptance of gaps and lane changes by checking for conflicts and then avoiding conflicts. At each check and avoidance step, TTC and distance proximity values, as well as the relevant acceleration, deceleration, velocity, position, etc. of the two conflicting vehicles, can be exported to a file (62). AIMSUN A recent study (63) illustrates the use of AIMSUN for collecting a surrogate measure of safety for ramp junctions. This study extracts the speed differential, maximum speed of the follower, and the DR of the follower vehicle for all ramp-merging events in a test case with and without ramp metering. The “un-safety” measure is the product of the three values. The study illustrates the effectiveness of ramp metering in decreasing the cumulative “un-safety” during rush-hour peak periods. INTEGRATION Integration has also been augmented to produce estimates of the safety impact of traffic signal coordination (64). The hypothesis is that reducing the number of vehicle-to-vehicle interactions by reducing total stops would result in fewer total crashes. A module for calculating total crashes based on mean free speed (using previously developed nonlinear regression functions for safety performance) of each intersection approach was added to Integration. In addition, lookup tables for type of crash based on speed were added to the simulation model. Literature Summary There is limited quantitative research to date on surrogate measures for safety assessment. The main difficulty is illustrating the correlation between any proposed surrogates with crashes, since crashes are rare events. The available literature is focused mainly on various aspects of traffic conflicts and related field studies for obtaining surrogate measures. Given the

Surrogate Safety Measures From Traffic Simulation Models FHWA-RD-03-050
13
technical difficulty and cost of field studies, use of simulation models has been proposed and some previous work has been done to develop specific models for simulating conflicts. The most notable surrogate measure of the severity of a conflict is the TTC, although other surrogates (e.g., PET, DR) have been proposed to measure other characteristics of conflict situations. Only limited effort has been expended to modify or enhance existing, general-purpose microscopic simulations to obtain conflict or other surrogate measures for intersections and two-lane roads. The primary difficulty is defining:
• A set of surrogate measures that can be extracted from simulations that were specifically designed to be “crash-free.”
• A set of surrogate measures that have reasonable connectivity to safety assessment of particular facilities (e.g., the frequency and severity of resulting crashes).
It is desirable to have a general-purpose simulation that can produce surrogate measures. The next section will discuss various attributes and features of general-purpose, commercially available microscopic simulation models that are required for obtaining or enhancing the ability to obtain surrogate measures of safety.

Surrogate Safety Measures From Traffic Simulation Models FHWA-RD-03-050
14
Page intentionally blank

Surrogate Safety Measures From Traffic Simulation Models FHWA-RD-03-050
Page 11
3. Traffic Simulation Model Overview Microscopic simulation models hold some promise for collecting surrogate measures of safety for intersections. Microscopic models typically simulate traffic systems on a vehicle-by-vehicle basis by updating position, speed, acceleration, lane position, and other state variables on time steps, such as on a seconds basis, as the vehicles interact with traffic signals, signs, other vehicles, and roadway geometrics. Some simulations allow use of even smaller time steps for more accurate behavioral analysis and/or use an event-driven structure for more computational efficiency. Microscopic simulations generally also include detailed modeling of traffic signal operations. Accurate modeling of traffic signals will be a requirement for derivation of surrogate safety measures. However, all microscopic traffic simulation models were designed assuming that drivers behave in a “safe” manner, but according to their particular driver behavior characteristics (i.e., aggressiveness for gap acceptance and lane changing). This is true in the real world also, but because of misjudgment and mistakes, crashes do occur. Any derivation of surrogate measures must account for this basic fact that simulations do not (currently) include crash occurrence. Without yet assuming a particular form of the SSAM (i.e., internal enhancements or external processing of model outputs), the pertinent characteristics of microscopic simulations for this project are:
• General features such as user base, stability, usability, model bugs, etc.
• Behavioral modeling of driver/vehicle interactions. • Ability to extract detailed data from the simulation (application
programming interfaces (APIs), output files, open source). • Ability to calibrate and select parameters of models. • Cost to modify source or outputs to support surrogate measures.
General Microscopic models that are well used in the transportation community, with easy-to-run analyses will be preferred for adaptation for surrogate safety measures analysis. Features such as post-processing analysis tools, graphical network editors, and extensible components are preferred.

Surrogate Safety Measures From Traffic Simulation Models FHWA-RD-03-050
Page 12
Behavioral Modeling For evaluation of surrogate safety measures, microscopic simulations must model the key driver behaviors that produce opportunities for crashes. Those behaviors are mainly:
• Car following. • Gap acceptance. • Lane changing.
All microscopic traffic simulation models include these behaviors with varying levels of resolution and realism. However, models with especially detailed, realistic behavioral components will be more amenable for use in later phases of this surrogate safety measures project. Some evaluation of the comparative strengths and weaknesses of the behavioral components of available models is provided. Data Extraction Almost all of the proposed and existing surrogate measures of safety require detailed information about vehicle/vehicle interactions that is not typically available to the end-user from microscopic simulation models. Microscopic simulations with fewer barriers to data extraction, such as providing APIs or configurable output files, would be more amenable for use in the later phases of this project. Calibration and Parameter Testing The derivation of surrogate safety measures from simulation models is dependent upon the parameters used in the behavioral and performance sub-models. The ability to calibrate, modify, and manipulate these parameters is a key characteristic of microscopic models amenable for use in the later phases of this project. Cost Making modifications to existing model structure, architecture, and Graphical User Interfaces (GUI), and adding outputs, adding inputs, and other features of customized software can be expensive. Microscopic simulations that have a nominal modification cost (such as a cooperative vendor willing to make modifications for free) will be more amenable for use in later phases of this project. Leverage of past government expenditures should also be considered (e.g., CORSIM investment). These characteristics are evaluated in more detail against commonly available microscopic traffic simulation models in the following sections. The

Surrogate Safety Measures From Traffic Simulation Models FHWA-RD-03-050
Page 13
models reviewed are CORSIM, Verkehr in Stadten – simulation (VISSIM), Simtraffic, Paramics, HUTSIM, Texas, Wide-Area Traffic Simulation (WATSIM), Integration, and AIMSUN. There are other microscopic traffic simulation models available in the community, which are used primarily for research (65). Only those that are commercially supported to some degree were evaluated. Some elements of the tables contain value judgments for a specific model characteristic (high, medium, low, possible). These judgments are the opinion of the authors and do not reflect any official FHWA opinions or policies. Information that was not available is marked as “NI.” Attributes that are not applicable to a particular simulation model are marked “N/A.” Some “yes” indications are asterisked, indicating that additional detail is available in the discussion section for that row of the table. The evaluation is not intended to be exhaustive and was limited by the funding available under this contract. It includes only those elements of microscopic simulations that were anticipated to impact surrogate safety assessment and collection of surrogate measures. Best efforts were made to verify the accuracy of ratings with the simulation model developers and reviewing available documentation (66, 67, 68, 69, 70, 71, 72, 73, 74, 75, 76, 77, 78, 79, 80). General Table 2 compares the simulation models included in this review for the following general model characteristics: Source Code Available Availability of source code makes the model easier to change, modify, and understand the underlying models. Of those reviewed, only CORSIM and Texas have available source code. The other models are commercial products that are the principal business of the developer organizations. Interaction With External Codes Developers that have linked their simulations to other external software modules have more experience and understanding of what would be required for an external link to an SSAM. For example, CORSIM has been linked to Adaptive Control System (ACS) prototypes and Split, Cycle, and Offset Optimization Technique (SCOOT), VISSIM has been linked to Virtual NextPhase, and AIMSUN has been linked to Sydney Coordinated Adaptive Traffic System (SCATS). Post-Processing Analysis Tools

Surrogate Safety Measures From Traffic Simulation Models FHWA-RD-03-050
Page 14
Simulations with existing post-processors are more likely built to allow the SSAM to operate independently from the main code. Paramics and AIMSUN have post-processing tools supplied with their software. Many users of CORSIM and VISSIM have built post-processors for model output (and share them in the user community), but “integrated” tools are not available with the software itself. Texas can output data to formatted text files for import into spreadsheets (62). Graphical Network Editor Allows models to be built, manipulated, and visualized more easily. Preferred for general ease-of-use. Most of the models include some form of a graphical editor (some easier to use than others). Graphical Network Editor Extensible An “extensible” network editor may allow external codes to be configured, parameters set, etc. in conjunction with network creation and configuration. Paramics claims an “extensible” network editor, part of their suite of APIs. Runs on a Personal Computer (PC) Important for ease-of-use and distribution to the widest range of users. All of the models reviewed run on a PC, either native or through emulation. Object-Oriented Simulations with an object-oriented structure would probably be easier to modify, enhance, and augment for SSAM functionality (of course, that does not guarantee that the object model is appropriate or useful). Actuated Signals Modeled The SSAM is intended for analysis of North American intersections, which includes actuated traffic signals (e.g., evaluation of three-phase versus four-phase signals with respect to safety). Simulations that explicitly model actuated signals are preferred for SSAM application. CORSIM includes explicit modeling of National Electronics Manufacturers Association (NEMA) eight-phase controllers (down to simulation at the assembly-code level), but lacks detailed modeling of the transition (transition is not necessarily required for SSAM analysis). VISSIM models all controllers using their Signal state generator (VAP) modeling language or provides a software interface to field software, including NextPhase, Vehrkers Systeme - Plus (VS-PLUS), SCATS, and NH-VOS (Netherlands – no acronym available). However, an issue with connecting directly to field firmware for accurate signal controller modeling is running simulations only at real-time speeds (i.e., a 4-hour (h)

Surrogate Safety Measures From Traffic Simulation Models FHWA-RD-03-050
Page 15
simulation takes 4 h to execute). AIMSUN also allows NEMA controller modeling through an external software interface.

Table 2. General simulation characteristics comparison.
CORSIM
SIMTRAFFIC
VISSIM
HUTSIM
PARAMICS
TEXAS
AIMSUN
WATSIM
INTEGRATIO
N
Characteristic
Source code available yes no no no no yes no no no
Interaction with external codesACS, CID synchro CID, VNP planned yes no EMME/2,
SCATS CINEMA no
Post-processing analysis tool(s) no no no no yes yes* yes no yes*Graphical network editor yes yes yes yes yes no yes no niGraphical network editor extensible no no no ni yes n/a ni n/a noRuns on PC yes yes yes yes emulation yes x-server yes yesObject-oriented structure no ni yes yes yes no yes no niActuated signals modeled yes yes yes** no yes*** yes yes*** yes no
CharacteristicGENERAL
ni No information n/a Not applicable * Software can output formatted text files for spreadsheet analysis ** With use of VAP language *** With use of hardware-in-loop
Surrogate Safety Measures From
Traffic Simulation M
odels FH
WA
-RD
-03-050 Page 1
6
Surrogate Safety Measures From Traffic Simulation Models FHWA-RD-03-050
Page 17
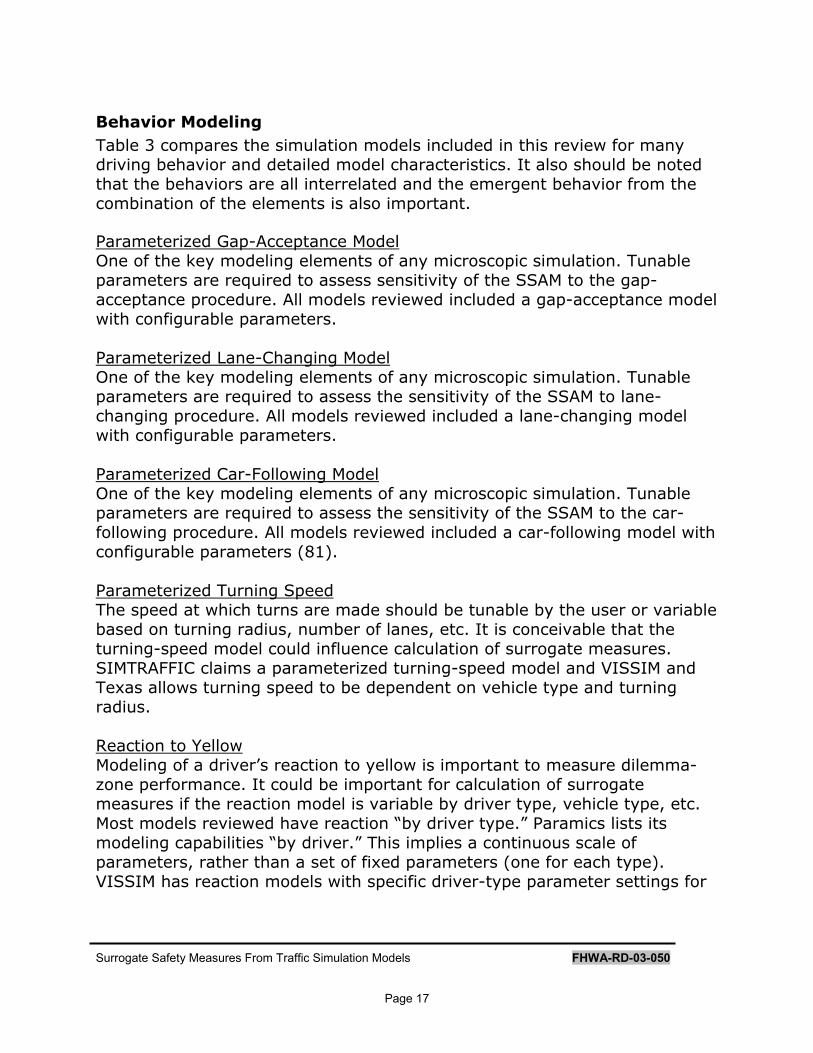
Behavior Modeling Table 3 compares the simulation models included in this review for many driving behavior and detailed model characteristics. It also should be noted that the behaviors are all interrelated and the emergent behavior from the combination of the elements is also important. Parameterized Gap-Acceptance Model One of the key modeling elements of any microscopic simulation. Tunable parameters are required to assess sensitivity of the SSAM to the gap-acceptance procedure. All models reviewed included a gap-acceptance model with configurable parameters. Parameterized Lane-Changing Model One of the key modeling elements of any microscopic simulation. Tunable parameters are required to assess the sensitivity of the SSAM to lane-changing procedure. All models reviewed included a lane-changing model with configurable parameters. Parameterized Car-Following Model One of the key modeling elements of any microscopic simulation. Tunable parameters are required to assess the sensitivity of the SSAM to the car-following procedure. All models reviewed included a car-following model with configurable parameters (81). Parameterized Turning Speed The speed at which turns are made should be tunable by the user or variable based on turning radius, number of lanes, etc. It is conceivable that the turning-speed model could influence calculation of surrogate measures. SIMTRAFFIC claims a parameterized turning-speed model and VISSIM and Texas allows turning speed to be dependent on vehicle type and turning radius. Reaction to Yellow Modeling of a driver’s reaction to yellow is important to measure dilemma-zone performance. It could be important for calculation of surrogate measures if the reaction model is variable by driver type, vehicle type, etc. Most models reviewed have reaction “by driver type.” Paramics lists its modeling capabilities “by driver.” This implies a continuous scale of parameters, rather than a set of fixed parameters (one for each type). VISSIM has reaction models with specific driver-type parameter settings for

Surrogate Safety Measures From Traffic Simulation Models FHWA-RD-03-050
Page 18
both signal sequences with and without flashing signals (for both European and North American signalization approaches). Variable Driver Reaction Time Reflects the model’s ability to represent the delay experienced between the driver’s identification of a potential collision and the application of control measures (braking, acceleration, or lane change) to avoid collision. In the real world, drivers’ reaction times vary by experience, age, etc. HUTSIM is planning integration of nanoscopic modeling of driver reactions and Paramics models driver awareness. Intersection Box Movements For assessment of surrogate safety measures, it is important for the simulation to model movement of the vehicles in the intersection with significant fidelity. For example, for left turns, Texas models intersection movements as combinations of appropriately sized arcs from the center of the beginning lane to the center of the receiving lane. Variable Acceleration (and Deceleration) Rate Simulations should include modeling of different vehicle capabilities by vehicle type. Unrealistic DRs (and maximum DR distributions) may underestimate the true statistics of surrogate measures. This is included in all models that were reviewed. Sight-Distance Limits Models that limit the “look-ahead” distance of drivers when making decisions (or model the look-ahead distance by driver or driver type) can more accurately model the awareness of drivers in surrogate measure statistics. In addition, sight-distance limits can reflect the modeling of roadway obstructions, such as curves, crests, trees, buildings, etc. This may also apply to modeling of in-vehicle sight restrictions, such as those that occur when following a large truck. Most of the models reviewed lack sophisticated sight-distance limitation modeling. VISSIM has some modeling of both the number of vehicles to look ahead and a distance ahead to consider before making maneuvers (as do other models as listed in the table), but no occlusion effects are modeled. CORSIM has a sight-distance limit for vehicles at the stop bar to look ahead for vehicles conflicting with their movement in the intersection. Rolling Yield Accurate modeling of yield signs and locations will be crucial for accurate collection of surrogate measures. It is hypothesized that the SSAM will be

Surrogate Safety Measures From Traffic Simulation Models FHWA-RD-03-050
Page 19
used for safety analyses of yield operations versus stop or signalized operations. A “rolling” yield indicates that the yield operation can occur with a slowed vehicle that does not come to a complete stop before re-entering the traffic stream. Vehicles Interact With Pedestrians Pedestrian safety is of extreme importance to traffic engineers. Simulations that model vehicle interactions with pedestrians may have the ability to assess the pedestrian safety effects of various alternatives (82). VISSIM and Paramics explicitly model pedestrian movements in crosswalks during pedestrian timings. Friendly Merging Refers to the phenomenon where certain driver types slow or stop to allow vehicles to merge (more) safely, which occurs in the real world, as opposed to only modeling slowing or stopping in a reactive sense. Friendly merging indicates that the following vehicle can create a gap for a merging vehicle. CORSIM and VISSIM include such behavior and AIMSUN includes such behavior for ramp junctions. Modeling of Multilane Merging Behavior In many locations, it is typical for vehicles entering the mainline flow to cross the path of an oncoming vehicle traveling in the same direction as the intended direction of travel of the entering vehicle and start accelerating in the adjacent lane. In this way, the oncoming vehicle can continue at its current speed without having to break for the turning vehicle (the maneuver is considered courteous behavior). Simulation models that allow for such behaviors to occur will more accurately represent the conflict behavior of locales that experience high volumes of such behaviors with wide multilane arterials. VISSIM can model such behavior with preferred entrance lanes for particular driver types, but it is not dependent on the lane that the oncoming vehicle is in. Modeling of Right-of-Way in Intersection A significant issue for modeling conflict events is that some turning behaviors must produce braking events by the traffic that has the right-of-way (i.e., making a left turn in front of oncoming traffic) to be considered unsafe events. If a simulation model does not represent this behavior, the surrogates cannot be reasonably measured. For example, AIMSUN calculates the TTC at the beginning of a left-turn maneuver to determine if a gap can be accepted with reasonable braking by the right-of-way vehicle. Therefore, some gap-acceptance maneuvers will, by definition, produce conflict events.

Surrogate Safety Measures From Traffic Simulation Models FHWA-RD-03-050
Page 20
Modeling/Recording of Maneuver Failures Acceptance of a gap is one event that can cause conflict events. On the other hand, the “rejection of gap” events may also have a surrogate safety implication. Models that can record the rejection or “failure” of the gap-acceptance process could produce another surrogate measure of the distribution and number of rejected gaps. Models that can export gap-acceptance event details could also easily export gap-failure event details. For example, Texas can export a table of conflict “check” (inherently a rejection if not followed by an acceptance event) and acceptance events. Parking Maneuvers On-street parking (parallel and double parking) creates conflict situations, lane changes, etc. in the real world and has a significant safety impact. Simulations that model on-street parking maneuvers are preferred. CORSIM models parking as “randomly occurring on-street incidents of variable duration,” rather than explicitly modeling actual vehicles stopping to park and then restarting their trip later. The mean duration of parking events must be less than 100 seconds, and there must be more than 14 events per hour. Modeling of Turn Signaling One significant aspect of rear-end conflict events is the use of turn signals by drivers. How turn signals (i.e., lack of signaling) affect the car-following and lane-changing logics is important to assessing the frequency and severity of rear-end conflict events. Turn signaling is notably a difficult modeling phenomenon. AIMSUN, for example, models the “emergency” of a vehicle changing lanes in advance of a turn to determine how aggressive the vehicle will be in cutting off right-of-way vehicles to make its turn, which could be considered a form of implicit modeling of turn signaling. VISSIM models turn signals for lane changes (i.e., turn signals are always used and some drivers will open gaps to allow merging), but does not model the presence or absence of a turn signal at a right or left turn at a junction. In addition, the presence of a turn signal on a vehicle in an adjacent lane affects driver behavior. U-Turns U-turns frequently cause conflict situations and some locations experience high enough volumes of U-turn traffic that their impact on safety should be addressed (e.g., including U-turns to businesses at the intersection corner or to access a freeway on-ramp). Simulations that include modeling of U-turns are preferred.

Surrogate Safety Measures From Traffic Simulation Models FHWA-RD-03-050
Page 21
Origins and Destinations at the Intersection Corners Many conflict situations are created by vehicles not turning at the intersection itself, but rather going to and coming from businesses at the intersection corners (e.g., convenience stores, gas stations, restaurants). Simulation models that can represent detailed business access situations will be preferred to those that cannot simulate such situations. For example, CORSIM would have difficulty modeling such situations because each driveway would have to be modeled as a separate node (intersection) and the minimum link length is 50 feet (ft) (15.15m) (some access driveways could be less than 50 ft (15.15m) from the traffic signal). VISSIM is the strongest model in this area, since each driveway would not have to be modeled as a node. The VISSIM structure is links and connectors with priority rules for right-of-way.

Table 3. Behavior modeling comparison.
CORSIM
SIMTRAFFIC
VISSIM
HUTSIM
PARAMICS
TEXAS
AIMSUN
WATSIM
INTEGRATIO
N
Characteristic
Parameterized gap-acceptance model yes yes yes yes yes yes yes yes yesParameterized lane-changing model yes yes yes yes yes yes yes yes yesParameterized car-following model yes yes yes yes yes yes yes yes yesParameterized turn speed no yes yes no no yes no no no
Reaction to yellow by type by type by driver, by signal ni by driver by driver, by
vehicle yes by type ni
Variable driver reaction time no no no planned yes yes yes no noIntersection box movements yes* yes yes ni yes yes yes yes noVariable acceleration/deceleration rate yes yes yes yes yes yes yes yes yesSight distance limits yes** ni yes** ni no yes yes** ni noRolling yield yes yes yes ni yes yes yes yes niVehicles interact with pedestrians implicit yes yes yes yes no yes implicit noFriendly merging yes no yes ni ramps only no ramps only no noMulti-lane merging no no yes*** ni yes*** no no no niIntersection right-of-way yes yes yes yes yes yes yes yes niManeuver failure recording possible possible possible possible possible yes**** possible possible noParking maneuvers yes^ no yes ni yes no no no noTurn signal modeling no ni no ni no no no no noU-turns no yes yes ni yes^^ yes yes ni niDriveways at the intersection corners no no yes no yes no no no no
CharacteristicBEHAVIOR MODELING
ni No information n/a Not applicable * with use of “micronode” logic; also note that micronode logic found to be inadequate ** specific look-ahead distance limit can be specified, but no obstructions *** model can include preferred entrance lanes, but not dependent upon oncoming vehicles **** Table of conflict “check” events can currently be exported with developer assistance ^ mean duration of parking events must be less than 100s; mean number of events must be
greater than 14 ^^ requires special link coding
Surrogate Safety Measures From
Traffic Simulation M
odels FH
WA
-RD
-03-050 Page 2
2
Surrogate Safety Measures From Traffic Simulation Models FHWA-RD-03-050
Page 23
Data Extraction Table 4 compares the simulation models included in this review for the following characteristics of extracting data from the simulation: Vehicle States Exportable to File Indicates that the simulation is capable of exporting all of the vehicle state variables (speed, location, acceleration, lane, following identification number (ID), etc.) to a file that could be processed by an external SSAM. CORSIM includes an API that allows this. Paramics, VISSIM, and AIMSUN allow vehicle state variables to be exported as well. Published Animation File Format Indicates that the simulation’s animation file format is known or published. This would be important if the animation file output included enough information to allow an external SSAM to produce meaningful estimates. The CORSIM format is known and available; the Paramics format is known, and VISSIM publishes a .BTX format that contains vehicle-state variables that include information that could be used for external visualization. API Available Simulations with defined APIs are more amenable to interaction with an SSAM without extensive modifications to internal code. APIs are available for a number of codes, although there are no standards. Output File(s) Configurable Configurable output files allow the simulation to hide or display certain statistics (or calculate or not calculate). This capability could be leveraged into easily displaying certain SSAM aggregated statistics or not. Gap-Acceptance Events Exportable Simulations that can export data based on the occurrence of events are preferred (rather than just a time history of state variables for all vehicles that SSAM would have to post-process). Texas, for example, can export conflict check details for accepting and rejecting gaps. Gap-Rejection Events Exportable The flipside of exporting gap-acceptance events is exporting gap-rejection events. Texas, for example, can export conflict checks that fail for gap acceptance.

Surrogate Safety Measures From Traffic Simulation Models FHWA-RD-03-050
Page 24
Lane-Change Events Exportable Simulations that can export data based on the occurrence of events are preferred (rather than just a time history of state variables for all vehicles that SSAM would have to post-process). The details of a lane change can indicate whether or not a conflict event has occurred. Vehicle-State Variables Include X,Y Position For estimating surrogate measures of conflict events, the x,y position is needed for each vehicle over time (absolute x,y, not just relative x,y, to the end of the link, for example, if an arterial is simulated and not just a single intersection). Currently Includes Conflict Statistics Simulations that already compute conflict statistics or produce certain surrogates would certainly be preferred to those that do not. Texas appears to currently include calculations closest to those desired for surrogate measures calculations. VISSIM also reports various TTC-related outputs (with the research version of the software license) used by various car manufacturers (BMW, DaimlerChrysler, Volkswagen, Ford) to test the traffic impact of automatic cruise control algorithms. These outputs are computed for vehicles traveling in the same direction (i.e., lane changing on multilane links and within merging zones at exits and entrances). Less experience is available with TTC calculations within VISSIM for conflict maneuvers at intersections.

Table 4. Data extraction capabilities comparison.
CORSIM
SIMTRAFFIC
VISSIM
HUTSIM
PARAMICS
TEXAS
AIMSUN
WATSIM
INTEGRATIO
N
Characteristic
Vehicle state variables exportable to file yes no yes ni yes yes yes no noPublished animation file format yes no yes ni yes yes* no no noAPI available yes no yes no yes no yes no noOutput file(s) configurable no no yes no yes no ni no noGap-acceptance events exportable possible ni possible ni possible yes possible ni noGap-acceptance rejections exportable possible ni possible ni possible yes possible ni noLane-change events exportable possible ni possible ni possible possible possible ni noVehicle state variables include x,y position yes** yes yes yes yes yes yes yes niCurrently includes conflict stats output yes*** no yes**** planned no yes^ no no yes^^
CharacteristicDATA EXTRACTION
ni No information n/a Not applicable * vehicle state variables exportable ** relative to link position, not absolute *** with micronode logic enabled; only provides total conflict counts by approach **** for car-following only; used for adaptive cruise control calculations ^ time-to-collision only ^^ TTC summary statistics by distance from intersection per approach
Surrogate Safety Measures From
Traffic Simulation M
odels FH
WA
-RD
-03-050 Page 2
5

Surrogate Safety Measures From Traffic Simulation Models FHWA-RD-03-050
Page 26
Calibration and Parameters Table 5 compares the simulation models included in this review for the following characteristics related to user-selectable parameters: Variable Time Steps Simulations with tunable time-step length are preferred to those with fixed-time steps for evaluation of sensitivity of surrogate measures to time-step size. In addition, simulations with variable time steps have more robust behavior models. Significantly, CORSIM does not allow tunable time steps. Time Steps <1.0 second (s) The precision of evaluating surrogate measures relies on frequent state-variable updates. The time scales of decision-making for surrogate measure evaluation are on the order of fractional seconds. The simulation must allow modeling of this fidelity. Many of the simulations include tunable time-step resolution. Gap-Acceptance Criteria Change by Delay Many drivers in the real world change their behavior based on how long they have been waiting (i.e., they accept smaller gaps and apply larger accelerations the longer they have waited to make a particular opposed movement). Simulations that model this behavior are preferred. AIMSUN and Paramics claim to model such functionality for crossing flows; VISSIM and CORSIM model gap-acceptance behavior for lane changes that is modified based on the distance to the required movement (AIMSUN and Paramics also model a type of urgency for lane changes as the decision point comes nearer). Vehicle Length The safety of particular conflicting maneuvers is dependent on the size of the vehicles involved. All of the simulations reviewed include vehicle length. Vehicle Length Considered by Gap Logic Surrogate measures based on the proximity of two vehicles in space and time are affected significantly if the vehicles are modeled as points rather than rectangles. Some animation results indicate that some models do not adequately consider vehicle length for gap acceptance, or the animation routines are not accurate enough to indicate that vehicles would not have collided in the real world.

Surrogate Safety Measures From Traffic Simulation Models FHWA-RD-03-050
Page 27
Variable Headways Different driver types maintain different headways between the vehicle they are following based on their level of risk acceptance. This must be reflected in the simulation for accurate representation of surrogate measures. All models include this feature to varying degrees. Variable Queue Discharge Headway Related to variable headways, as the queue dissipates at a traffic signal, different driver types react at different rates that may have an affect on surrogate measures (primarily rear-end conflict measures). All models except Integration, which does not adequately model intersection dynamics, include this feature.

Table 5. Calibration and parameters comparison.
CORSIM
SIMTRAFFIC
VISSIM
HUTSIM
PARAMICS
TEXAS
AIMSUN
WATSIM
INTEGRATIO
N
Characteristic
Variable time steps no yes yes yes yes yes yes no yesTime steps <1.0s no yes yes yes yes yes yes no yesGap-acceptance criteria change by delay yes* yes* yes* no yes no yes no yesVehicle length by type by type by type yes yes by type by type by type yesVehicle length considered in gap logic ni ni yes ni yes** yes yes ni no
Variable headways by type by type by type yes by driver by distribution by type by type yes
Variable queue discharge headwayby type by type by type ni by driver by driver, by
vehicle by type by type no
CharacteristicCALIBRATION AND PARAMETERS
ni No information n/a Not applicable * gap acceptance for lane-changes modified by distance to required maneuver point ** although animation results indicate otherwise
Surrogate Safety Measures From
Traffic Simulation M
odels FH
WA
-RD
-03-050 Page 2
8

Surrogate Safety Measures From Traffic Simulation Models FHWA-RD-03-050
Page 29
Cost Table 6 compares the simulation models included in this review for the cost required to make changes to support surrogate safety modeling. Each cost is labeled “high,” “medium,” or “low.” A low cost indicates that the effort required is estimated to be less than a person-month. A medium cost indicates that the effort required is estimated to be less than three person-months. A high cost indicates that the effort required is estimated to be more than three person-months. Cost to Modify API The anticipated cost on a relative scale (high, medium, low) to modify, change, or upgrade the API(s) of the simulation to allow SSAM operation. Cost to Modify Output The anticipated cost on a relative scale (high, medium, low) to modify, change, or upgrade the output files or formats of the simulation to allow SSAM operation. Cost to Modify Input The anticipated cost on a relative scale (high, medium, low) to modify, change, or upgrade the input files or formats of the simulation to allow SSAM operation (if required).

Table 6. Modification cost comparison.
CORSIM
SIMTRAFFIC
VISSIM
HUTSIM
PARAMICS
TEXAS
AIMSUN
WATSIM
INTEGRATIO
N
Characteristic
Cost to modify API high n/a medium n/a low n/a low n/a n/aCost to modify output medium ni low ni low low low ni niCost to modify input high ni medium ni medium low medium ni ni
COST Characteristic
ni No information n/a Not applicable
Surrogate Safety Measures From
Traffic Simulation M
odels FH
WA
-RD
-03-050 Page 3
0
Surrogate Safety Measures From Traffic Simulation Models FHWA-RD-03-050
Page 31
4. Discussion of Microscopic Simulation Model Comparisons As the elements in each of the tables in the previous section indicate, each simulation model has its own strengths and weaknesses with respect to both traffic modeling in general and simulation of surrogate safety measures. Previous European research has indicated similar results (39, 65). Summaries of each reviewed model are presented below. All of the models reviewed would require some level of modification, upgrade, or enhancement to support the derivation of surrogate measures of safety—both internal enhancements to the source code and external enhancements for additional output file(s), statistics, and possibly new input value(s). CORSIM CORSIM provides the most natural choice for further FHWA development of a surrogate safety assessment tool. The primary disadvantage of using CORSIM for surrogate safety analysis is the use of the fixed 1-s time-step update interval. The accuracy of the calculations of surrogate measures will be limited by this fundamental issue (i.e., surrogate measure calculations can only be made at certain position and velocity initial conditions). It is possible that certain surrogate measures could be neglected because the update interval was too coarse. The second key issue affecting the use of CORSIM for surrogate safety analysis is the lack of appropriate modeling of vehicle movements in the intersection box. Although the current model includes “micronode” modeling of intersection box movements, the calculation of conflicts and output statistics for conflicts using the micronode logic is not consistent with the definition of conflict used in the safety community. In addition, the model used to evaluate the “real-estate blocks” used to identify situations where conflict opportunities occur is not complete for intersections with more than four legs or irregular intersection geometries (61). Analysis of the micronode logic also indicates two additional difficulties for the current implementation:
• The micronode logic is not implemented in CORSIM as a stand-alone module, i.e., it could not be easily replaced with a new logic that would facilitate both surrogate safety analysis and simulation of vehicle movements in the intersection box.
• Several modules used for simulating vehicle movements and interactions with other vehicles (e.g., car following) have assumptions of 1-s time steps embedded into the equations.

Surrogate Safety Measures From Traffic Simulation Models FHWA-RD-03-050
Page 32
SIMTRAFFIC SIMTRAFFIC is a relatively easy-to-use traffic simulation tool that is designed for use by field traffic engineers primarily as an adjunct to the SYNCHRO signal-timing optimization software. A significant disadvantage of SIMTRAFFIC is the lack of API functions or supporting detailed output of vehicle-state variable information and automated statistical analysis capabilities of other codes. On the other hand, SIMTRAFFIC has the most resolute state variable standard update intervals of all models surveyed (0.1 s) and claims many improvements over the CORSIM models for representing real-world traffic conditions, although the validity of those improvements is not known. SIMTRAFFIC appears to model most of the behaviors necessary for collecting surrogate measures, but at a less resolute level than AIMSUN, VISSIM, or Paramics. VISSIM VISSIM appears to be a full-featured microscopic simulation model with the ability to obtain detailed state variable information on each vehicle on time scales with better than second-by-second accuracy. VISSIM has been interfaced to other external codes before, including hardware signal controllers, thus the developers have experience in development collaboration. The priority rules feature of VISSIM appears to allow complex modeling of junction behavior, including friendly merging (situations where following vehicles will slow for merging vehicles to create a gap), as it occurs in the real world. It is not apparent that other simulation models are able to represent such behavior (AIMSUN supports such an effect at freeway ramp junctions). Another advantage of VISSIM is the representation of on-street parking behavior and double parking. VISSIM has NEMA controller models available (i.e., using the VAP macro language), and adaptive algorithms and real controllers can be integrated and evaluated rather easily with the real-time interface. There are complexity issues involved with setting up the multitude of priority rules at each junction, although, again, this flexibility allows for very detailed modeling of location- and vehicle-specific interactions. However these affect the usability of the software more so than the ability to obtain surrogate measures. VISSIM appears to support most of the modeling features required for obtaining surrogate measures at a reasonable level of fidelity. HUTSIM HUTSIM is currently being modified by Helsinki University to evaluate the use of a nanoscopic driver behavior model to produce delays in driver reaction time that lead to surrogate safety measures (59). They have tentatively selected TTC as their primary surrogate measure. Some of the

Surrogate Safety Measures From Traffic Simulation Models FHWA-RD-03-050
Page 33
details of driver behavior modeling in the HUTSIM simulation were unavailable given the scope of this project. The demo software available indicates a less sophisticated visualization and model-building GUI than other tools, although the software contains an add-on analyzer module for post-processing output data into graphs/charts. It appears that all modifications to HUTSIM are being made internally since no API is available. Sight-distance limitation modeling is a significant advantage of the HUTSIM simulation model. Paramics Paramics appears to be a full-featured microscopic simulation model with the ability to obtain detailed state variable information on each vehicle on time scales with better than second-by-second accuracy. Paramics has been interfaced to other codes before, and the API continues to be refined and extended by researchers around the world, including “extensibility” of the input processor(s) and output processor(s). A significant disadvantage of the Paramics model is the use and reliance on origin-destination matrices to derive traffic volumes. Paramics appears to support most of the modeling features required for obtaining surrogate measures at a reasonable level of fidelity, although some modeling elements are described only at a functional level. Integration Integration is a simulation model developed primarily for research use that has recently been distributed on a commercial basis. Integration does not have an API or access to vehicle state variables on a time step-by-time step basis. Integration appears to be weaker at explicit simulation of detailed vehicle-to-vehicle interactions than other simulation models, given that it originated from a hybrid “mesoscopic” macro/micro modeling base. Integration does not appear to explicitly model movements in the intersection box. Integration has been modified to output TTC distributions and predict crash rate statistics using previously developed nonlinear regression models (based on link mean speed). AIMSUN AIMSUN is a full-featured simulation model with the ability to obtain detailed state variable information on each vehicle on time scales with better than second-by-second accuracy. AIMSUN has a set of APIs and has been interfaced to external codes in the past, such as EMME/2 and SCATS. AIMSUN’s car-following logic has been shown to be realistic in tests during the SMARTEST study (Algers, et al., 1997). A significant advantage of AIMSUN is that the gap-acceptance behavior of drivers is modified based on

Surrogate Safety Measures From Traffic Simulation Models FHWA-RD-03-050
Page 34
their delay time. Most other models do not represent such phenomena. AIMSUN also has a model for vehicle-actuated NEMA controllers and allows for a look-ahead distance restriction at junctions. Most of the necessary elements are modeled in AIMSUN to support the collection of surrogate measures at a reasonable level of fidelity. WATSIM WATSIM is an enhancement of the NETSIM model by one of the original developers of NETSIM. As such, WATSIM inherits many of the limitations of the CORSIM model, including fixed 1-s time steps. WATSIM has many additional features over CORSIM, including light-rail modeling. WATSIM lacks many of the features of general-distribution tools for supporting this type of surrogate safety research, such as configurable output files, post-processing tools, and APIs. Texas Texas allows microscopic simulation modeling of only a single, isolated intersection. Texas includes no significant built-in post-processing tools, configurable outputs, graphical input editors, or APIs (Texas can create a file of the traditional measures of effectiveness (MOEs) that are processed to determine replicate-run MOEs). Texas can output vehicle-state variables for each time step, including data that are along the lines of output of the relevant variables needed for calculation of surrogate measures. FHWA is currently considering making modifications to Texas to allow red-light running in the behavioral modeling in order to study the safety implications. A significant advantage of Texas is explicit modeling of North American semi- and fully-actuated signal controllers, including control of diamond interchanges (i.e., two intersections operated as a single controlled-intersection entity). Texas does allow simulation of vehicle movements at time steps down to 0.1 s. The inclusion of sight-distance limitation modeling is also a significant advantage of the Texas model, as well as the explicit modeling of U-turns. The main drawback of Texas is modeling of just a single intersection junction; however, model appears to support the primary modeling elements necessary for obtaining surrogate measures at a reasonable level of fidelity.

Surrogate Safety Measures From Traffic Simulation Models FHWA-RD-03-050
Page 35
5. Summary of Simulation Model Features Review The results of the simulation model review do not indicate a clear superiority of any particular model when considering all of the elements required for modeling surrogate measures. From the evaluation done to produce this report, it does not appear possible that surrogate measures could be obtained from any of the simulation models that were reviewed without some internal modifications to either the API(s), if provided, or the source-code modules themselves. The selection of a simulation model or models is tightly coupled to both:
• Selection of a recommended approach to obtaining surrogate safety measures from simulation models.
• Determination of the surrogates that are to be extracted or computed. The literature indicates a clear preference for surrogate measures that include specific vehicle-to-vehicle proximity measures, including GT, TTC, and PET. Our evaluation and the results of the Surrogate Safety Measures Workshop held at the beginning of this project confirm this. These event-based measures hold the most promise for evaluating the relative safety of traffic facilities. Aggregated measures such as gap-acceptance distributions, link or lane speeds, etc. have a less credible connection with crash probability and thus are viewed as secondary surrogates of safety. The other most significant finding of the Surrogate Safety Measures Workshop was that an SSAM must be flexible in the aggregation of the measures, i.e., across approaches, movements, conflict types, etc., rather than a priori assuming a particular aggregation methodology. The recommended approach to collecting surrogates from a number of different simulation models in a uniform way is to develop a post-processor surrogate safety assessment module. This requires internal enhancements to a specific model, or models, for calculation of surrogate measures and output of those calculations in a formatted output data file that is post-processed by the stand-alone surrogate safety assessment module to aggregate the internally calculated measures in a variety of ways. This approach has many advantages:
1. Allows specification of a standard SSAM that can be implemented in any simulation model that wishes to support the output format.
2. Maintains an external aggregation and statistics calculation module so the SSAM itself remains decoupled from the simulation.

Surrogate Safety Measures From Traffic Simulation Models FHWA-RD-03-050
Page 36
3. Demonstrates the necessity of distribution-based statistical evaluation and assessment of simulation output (i.e., measurement and display of variance information) rather than the typical average-value analysis that is conducted in practice.
4. Supports the future goal of common standards for traffic simulation input and output specifications.
These recommendations are captured in the next section on requirements for an SSAM software tool.

Surrogate Safety Measures From Traffic Simulation Models FHWA-RD-03-050
Page 37
6. SSAM Functional Requirements This section summarizes the functional requirements for the surrogate safety assessment module from the results of the literature and models review. This section has four main subsections:
1. A brief description of the software requirements development process. 2. Specification of a concept of operations for the SSAM and the
associated use cases. 3. Mock-ups of the user-interface elements of the SSAM. 4. The derived functional requirements in a traceability matrix format.
The functional requirements will be the basis for implementing a surrogate safety assessment software module in the future. Functional Requirements Development Process A standard software design and development methodology is the Unified Software Development Process. Using this process, the functional requirements for the surrogate safety assessment module will be based on developing use cases. A use case (as defined in the Unified Modeling Language - UML) describes some interaction of an external actor with the system. In this project, the system is the surrogate safety assessment module. An actor is typically a human user, but may also be another software process, such as a traffic simulation model – CORSIM/TSIS (Traffic Software Integrated System), VISSIM, AIMSUN, or an external analysis tool like a spreadsheet or graphing software. The use cases define what can be done with, or to, the SSAM. Thus, the functional requirements are naturally derived from specifying the use cases. The use cases also provide traceability that all of the functional requirements are covered in the eventual design. Not every possible use or function of the SSAM software can be envisioned at the beginning of this process. This is another benefit of using the Unified Software Development Process – it is specifically designed to accommodate iterative and incremental development efforts. Hence, every possible consideration is provided to the specification of interfaces that can be extended to allow new and innovative developments to be integrated as the system matures.

Surrogate Safety Measures From Traffic Simulation Models FHWA-RD-03-050
Page 38
There are several key elements of the requirements development process. The first is the concept of requirements layering. This involves the creation of different levels of the requirements documentation where each new level builds more detail upon the foundation of earlier levels. In this project, we identify objectives first as the highest level of requirements. From these objectives and the anticipated concept of operations, we can then develop the high-level use cases. From the use cases and objectives, the functional requirements are then identified (the next level of requirements would be software design requirements, not included in this phase of SSAM development). This process is illustrated in Figure 1.
ObjectivesObjectives
UsersUsers
System OwnerSystem Owner RequirementsRequirements
Concept of Operations
ActorsActors
ViewdataViewdataView
dataViewdataView
dataViewdata
StakeholdersStakeholders
Use Cases
Figure 1. Requirements development process.
The requirements are listed in a traceability matrix conceptually arranged according to their use case packages. A use case package collects use cases that are related to some common function, such as “installation” or “testing.” The purpose of this matrix is to systematically map each requirement through to the design and testing of the system, and identify the priority of each requirement as an essential, important, or simply desirable feature of the eventual system. It is also important to identify requirements that are both measurable and testable. The requirements traceability matrix numbers will be frozen with this submittal. As requirements are added, modified, deleted, etc., the numbering system will remain constant for the purpose of tracking.
System Owner, Users, and Stakeholders
The owner of the SSAM system is FHWA. FHWA has the responsibility for further maintenance and upgrade of SSAM for the benefit of users and other stakeholders. Users of the SSAM software would include traffic safety engineers, traffic simulation analysts, and traffic researchers. Many groups have a stake in the success of the SSAM, including:

Surrogate Safety Measures From Traffic Simulation Models FHWA-RD-03-050
Page 39
• FHWA—promoting use of traffic simulation models, providing tools for
safety analysis, and enhancing decisionmaking for alternative traffic facility designs.
• DOTs and city traffic managers—including safety analysis in decisionmaking, assessing safety impacts of alternative designs.
• Traffic analysts—new safety-related analysis services. • Traffic model researchers and developers—identification of gaps in
traffic models and real driver behaviors, enhanced safety effectiveness research of alternative facility designs.
SSAM Objectives The objectives of the SSAM system are summarized below:
• Provide tool for traffic engineers to perform comparative safety analysis.
• Be compatible with as many traffic simulation models as possible. • Use the best possible surrogate measures (i.e., most representative
of crash propensity) that are observable in simulation models. • Support flexible analysis (e.g., different aggregations of statistics,
different visualization types). Concept of Operation of the SSAM Traffic engineers, analysts, and planners evaluate design options for intersections, arterials, and networks in simulation codes, such as CORSIM, VISSIM, PARAMICS, AIMSUN, etc. In addition to standard measures of effectiveness, such as total delay, average delay, queue lengths, etc., measures of the relative safety of design alternatives are desired from the simulation results. The traffic engineer first enables surrogate safety output in the simulation model of choice and enters any modifications to the default parameters for the surrogate analysis in the input configuration interface for the traffic simulation model. The traffic simulation model is modified by the simulation developer organization so that the input procedure includes these configuration parameters. If the simulation model includes a graphical input editor, configuration of the safety parameters could be integrated into the GUI of the graphical editor. The traffic engineer then runs the simulation model for a number of iterations to obtain surrogate safety output statistics. The output statistics are written by the simulation model to an event file(s). The simulation model exports a separate event file for each iteration, with an appropriate naming convention for importing to the SSAM.

Surrogate Safety Measures From Traffic Simulation Models FHWA-RD-03-050
Page 40
The traffic engineer then launches the stand-alone SSAM application. The simulation scenario file (geometrics, traffic volumes, etc.) is imported to the SSAM application using the standard, common data format supported by the simulation model. The event files are imported into the SSAM and the traffic engineer executes various types of aggregations and analyses, including generating and printing reports, viewing graphical visualizations, and performing comparative analyses with derived statistics. The graphical visualizations might include various types of graphs (scatter, pie chart, time series, three-dimensional), overlays of surrogate statistics on intersection schematics, side-by-side comparisons, and so on. As updates and upgrades are available, the traffic engineer can load the new version of the SSAM software without system administrator assistance. This data-flow process is illustrated in figure 2.
SimulationModel
Event File(s) SSAMEvent File(s)Event File(s)Event File(s)
IMPORT
SSAM
10 %10 %10 %10 %
10 %
10 %
10 %10 %10 %10 %
Figure 2. Event-file-based information flow diagram.
Use Case Analysis The user needs ultimately specify the capabilities of any software system being procured or developed. Use case analysis captures the users’ expectations of the functionality of the system (their needs) and expresses them clearly in terms that software system developers can follow. The use case model is a central part of a requirements document developed within an object-oriented software development process. The use case model emphasizes interfaces and end-to-end functionality within the system by rigorously identifying all system users and the actions they will be able to take. Each use case describes how a system user or an actor would interact with the SSAM software system in each particular case. That is, each use case describes a particular and observable system behavior. These behaviors are then used to develop the detailed software system requirements describing how that behavior is accomplished.

Surrogate Safety Measures From Traffic Simulation Models FHWA-RD-03-050
Page 41
In addition to driving the detailed design of the software, another goal of UML and use case-based design is software module reuse. Many different applications have map interfaces, graphics import, loading files, etc. By identifying common use cases of different software types, those code modules can be built once and reused with minimal modification for a different application at a savings to the customer and reduced total development time. System Users Use cases are guaranteed to be observable by the fact that they must be connected to one or more actors. The actors related to the SSAM system are shown in table 7.
Table 7. Use case actors. Use Case Actor Description Simulation Model
The simulation model produces the traffic events and behavior used to derive the surrogate measures of safety.
Traffic Engineer The traffic engineer runs the simulation model and SSAM to do traffic performance and safety analyses, print reports, set configuration parameters, etc. The SSAM should be designed such that the traffic engineer can install and upgrade the SSAM without system administrator support.
Simulation Model Developer
The simulation model developer updates, modifies, and augments the traffic simulation model to add/change functionality, upgrade the code, fix bugs, etc. As these changes are made, the API for the SSAM may need to be modified/revised.
The following cases are intended to capture the types of interaction that the SSAM system will have with the outside world, based on the user needs, as described briefly in the concept of operations for the SSAM. These cases do not represent the design of the SSAM itself. The use cases only describe the interfaces to the SSAM software and are used to verify that all requirements for the system have been identified, and that all identified requirements have been addressed. The objects identified in the use case analysis are then carried forward to subsequent steps of the object-oriented design process.

Surrogate Safety Measures From Traffic Simulation Models FHWA-RD-03-050
Page 42
Use Case Packages As illustrated in figure 3, the use cases for SSAM are collected into use case packages. A package is a collection of use cases according to common functions, such as installation, operation, analysis, etc. The arrows between use case packages are intended to indicate relationships between the use cases of the two groups. The following sections briefly discuss each of the use case packages.
Install &UpgradeInstall &Upgrade OperateOperateConfigureConfigure
ReportsReports
Traffic EngineerTraffic Engineer
Simulation ModelDeveloperSimulation ModelDeveloper
AnalysisAnalysisSimulation ModelSimulation Model
Figure 3. Use case package diagram.
INSTALL AND UPGRADE The SSAM software has to be installed on the user’s PC and upgraded as new features are identified and bugs are fixed. Table 8 lists the install and upgrade use cases.
Table 8. Install and upgrade use cases. Install SSAM software on PC. Upgrade SSAM software to new version.
CONFIGURE The SSAM software will have many parameters to configure that allow the user to visualize the analysis and customize the analysis results. Some of these data would be best imported from the simulation application(s) itself (e.g., “import traffic-stream data”) using a common file format such as

Surrogate Safety Measures From Traffic Simulation Models FHWA-RD-03-050
Page 43
Traffic Model Markup Language (TMML1). If this is not possible, the data could be configured manually by the user. The data required to adequately analyze the traffic situation includes:
• Network geometry—number of lanes in each direction, turning pockets, driveways, etc.
• Traffic-stream data—volume of traffic in each direction, change in the volumes over the simulation period.
• Intersection control data—how many phases, actuated or nonactuated, phase durations, etc.
• Driver behavior data—aggressiveness distribution, gap-acceptance criteria, etc.
In addition to configuring the details of the intersection and conditions being analyzed, the SSAM software should have features and functions that are configurable by the user. For example, the user should be able to:
• Select the icons that are used to represent each type of conflict from a library of icon types, e.g., stars for rear-end events, circles for crossing events, squares, sunbursts, etc.
• Select the colors for conflict event characteristics from among various palettes, e.g., red is high severity, yellow is medium severity, green is low severity.
• Select the output variables or summary statistics that will appear in an output table, graph, or intersection graphic, e.g., “show me all rear-end conflict events where the speed differential was greater than 25 mi/h (56.25 m/s) occurring in the rightmost lane of all approaches between 7 a.m. and 8 a.m. of the analysis period.”
• Save a set or sets of configuration parameters in workspace variables for retrieval at a later time—so the user can rerun a particular analysis for a particular scenario with new data, or apply the same configuration settings to a new scenario.
Configurability of colors, icons, etc. are generally available “off-the-shelf” in standard graphics libraries provided by the system software manufacturer.
1 TMML is a proposed standard by K. Courage and S. Washburn at the University of Florida based on XML (extensible markup language). The encoding standard is based on the TSDD (Traffic Software Data Dictionary) data elements principally intended to support exchange of data between traffic engineering software without re-encoding the data. The standard is focused currently on the description of facilities.

Surrogate Safety Measures From Traffic Simulation Models FHWA-RD-03-050
Page 44
It would also be useful if the user could calibrate the parameters of the SSAM from field data automatically though the software by importing field data, or visualizing field data on the same graphs, charts, and graphics as the simulated data. Table 9 lists the use cases for configuration of the SSAM software.
Table 9. Configure use cases. Configure network geometry. Import network geometry. Configure surrogate model parameters. Configure summary measure parameters. Configure analysis parameters. Configure reporting/output parameters. Configure graphic display. Save configuration settings. Calibrate surrogate parameters from field data. Configure intersection control details. Import intersection control details. Configure traffic-stream data. Import traffic-stream data. Configure driver behavior parameters. Import driver behavior parameters. Configure color definitions. Configure icon definitions.
OPERATE The use cases in the Operate package are mostly general/generic features of the SSAM software that might be most similar to other applications, such as the traffic simulation software itself, such as:
• Importing data from files. • Selecting background graphics. • Selecting measures from a list. • Zooming and panning the display(s). • Selecting a particular output type. • Selecting a particular data point and getting additional details. • Starting and stopping the software.
These functions and features are typically found on buttons and/or drop-down menus of the software that then might launch additional windows with

Surrogate Safety Measures From Traffic Simulation Models FHWA-RD-03-050
Page 45
more detailed functions (such as found in the analysis use case package). The use cases for Operate are listed in table 10.
Table 10. Operate use cases. Import event file. Import event file batch. Import intersection graphic. Import network graphic. Pan network display. Pan close-up display. Zoom network display. Zoom closeup display. Start SSAM. Quit SSAM. Select intersection for graphic display. Obtain user help. Select intersection for detailed display. Select surrogate for display on graphic. Select graphic type. Select aggregation type. Get details for particular data point. Display field data on graphic.
ANALYSIS Use cases in the Analysis package are the core features of the SSAM software. All of the other use case packages are built to support these core features for analyzing the surrogate safety data from the traffic simulation models. These analyses are probably best run in a comparative way, since the essential information is more likely found in the differences between the results for two scenarios, rather than in the absolute results for a particular scenario. For example, an analysis might be described as the following: “Show me all rear-end conflict events with a speed differential greater than 25 mi/h (56.25 m/s) that occurred between 7 a.m. and 8 a.m. on all approaches in the rightmost lane. Show intersection design A with circle icons and intersection design B with triangle icons. Let the color of the icons indicate the TTC of the conflict event – red for a TTC less than 0.5 s, yellow for a TTC between 1.0 s and 0.5 s, and green for a TTC between 1.0 s and 1.5 s. Put those icons geo-located on a satellite photo of the current intersection design A.” Analysis use cases include, for example:
• Sorting tables by a particular table element.

Surrogate Safety Measures From Traffic Simulation Models FHWA-RD-03-050
Page 46
• Filtering results by ranges of a particular element. • Calculating summary measures, such as weighted combinations of
total numbers of different types of conflict events— “conflict indices.” • Calculating and visualizing distributions of events. • Calculating and visualizing distributions of the differences of events
produced by alternative designs. Distributional analysis is very important in studies involving simulations because of the stochastic nature of the data. A lot of information also is thrown away by simply comparing average values of two or more alternatives. Some previous work in safety analysis has proposed distributional analysis for severity of conflict events (83). However, analysts must be more sophisticated to interpret distributional data or the software will require additional functionality to “auto-analyze” distributional results. Distributional comparisons are discussed further in the Interface Mock-Ups section of this report. Table 11 lists the Analysis use cases.
Table 11. Analysis use cases.
View network summary display. View graphical closeup display. View differences of design A and B. Filter display on event type. Compare surrogate data to field data. Compare intersection design A to designs B,…,N. Compare intersection design A to B. Sort table by column. Filter display by surrogate range. Calculate summary measure.
REPORTING Finally, the SSAM software must have use cases describing how the output of the software is transferred to other formats, either printing or saving the results to a standard file format. Table 12 lists the use cases for the Reporting package.
Table 12. Reporting use cases.
Export graphic display to file. Export report/table to file. Print a graphic display. Print a report/table.

Surrogate Safety Measures From Traffic Simulation Models FHWA-RD-03-050
Page 47
User Interface Mock-Ups Based on the use cases identified in the previous section, some user interface mock-up screens are presented to direct thinking about functionality, additional features, and the complexity involved in designing the SSAM module as an external software system. The SSAM software would notionally be comprised of:
• Main program- and network-level view(s). • Intersection-level view(s). • Tabular view(s). • Graph/chart view(s). • Distribution comparison view(s).
Figures 4 through 9 illustrate samples of what these screens might look like in the eventual SSAM tool. Figure 4 shows the main screen. A number of drop-down menus are available for use to load scenario files, perform analysis steps, set configuration parameters, launch sub-displays for intersection graphics, charts, etc., and get user help. A display of the traffic network being analyzed is shown in the main display. The network display could show conflict event data, both summaries and individual geo-referenced event icons.

Surrogate Safety Measures From Traffic Simulation Models FHWA-RD-03-050
Page 48
File Analysis Display Configure Help
X = 124.4543W Y = 34.2321N Mode = PET
SSAM
Event IDEvent TypeLocation XLocation YTTCPETMax SpeedSpeed Diff
123Rear-end
123.454W34.543N
1.232.1
23.4546.5
Time to collision
Figure 4. Main application with network-level display.
Figure 5 illustrates a notional intersection close-up display. The user could click on individual conflict event icons and get the associated details data in the information box on the left side. The graphic could be zoomed and panned to focus on different parts of the figure. Different surrogate measures could be selected from the menu boxes to change the representation for the color and shape of the icons. Buttons for toggling display of certain conflict event types (shown on the left-hand side of the graphic as pairs of rectangles with arrows indicating direction of travel) might be provided for the user to focus on a particular event class.

Surrogate Safety Measures From Traffic Simulation Models FHWA-RD-03-050
Page 49
SSAM
Event IDEvent TypeLocation XLocation YTTCPETMax SpeedSpeed Diff
123Rear-end
123.454W34.543N
1.232.1
23.4546.5
X = 124.4543W Y = 34.2321N Filter ON
Time to collision
0:00 - 0:05Time
Color
Shape
PET
MaxS
Figure 5. Intersection close-up window.
Figure 6 illustrates a tabular display. The user would be able to add columns, delete columns, filter columns on different measures, and configure default column settings from the drop-down menus. The user could save a particular tabular view to a file for printing or embedding in a report, or some other post-processing with a tool such as a spreadsheet or graphing software.
Add Delete Filter Configure Restore Save SSAM
TYPE PET TTC APPROACH LOCATIONBIN LANE MAX-SRearEnd 1.1 0.76 1 0-50 1 34Merging 0.21 0.31 2 100-150 2 56Merging 0.34 0.23 2 100-150 2 24LeftTurn 1.034 1.3 2 200-250 2 29RightTurn 1.212 1.1 1 0-50 1 45RearEnd 0.34 0.76 2 0-50 2 23LeftTurn 1.034 0.31 3 50-100 2 26LeftTurn 1.212 0.23 3 50-100 4 54
Figure 6. Table display.

Surrogate Safety Measures From Traffic Simulation Models FHWA-RD-03-050
Page 50
Figure 7 shows a graph display. Graph-drawing modules can typically be found in off-the-shelf software libraries. The user would be able to add series, delete series, scale the x,y axes, set configuration parameters, etc. from the drop-down menus. Perhaps the x,y variables could be selectable from a drop-down menu for quick trend analysis. Similar functionality is being developed for HUTSIM (e.g., figure 7 from (39) illustrates a graphical display of TTC and PET versus speed for a particular analysis scenario) in the SINDI project.
Add Delete Scale Configure Restore Save SSAM
PET
TTC
XY
0
0.2
0.4
0.6
0.8
1
1.2
1.4
0 1 2 3 4
Series1
Figure 7. Graph display.
Figure 8 illustrates an important component of the SSAM analysis software. The distribution visualization window would allow the user to compare derived statistics of two (or more) design alternatives without having to dump the results to a file and then post-process the data with a tool such as a spreadsheet. Distribution types could be selectable by the user, or the SSAM could analyze the data and suggest a distribution type based on the best fit to the data (or a general-purpose distributional type could be used with parameters calibrated to the data, e.g., beta distributions can take on almost any shape with the appropriate parameters). For example:

Surrogate Safety Measures From Traffic Simulation Models FHWA-RD-03-050
Page 51
• The user might want to compare the TTC distributions (a histogram of all of the collected TTC values) from two design alternatives for a particular intersection approach (83).
• The user might want to compare the distributions of the total number of rear-end conflict events for 10 iterations of the simulation for a particular approach to 2 different intersection design alternatives.
Add Delete Select Configure Label Save SSAM
TTC distribution - Approach A
0
0.1
0.2
0.3
0.4
0.5
0 0.2 0.4 0.6 0.8
TTC
Prop
ortio
n
Design ADesign B
Figure 8. Distribution comparison display.
Figure 9 shows a mock-up of a user’s workspace using the SSAM tool, including the simulation model window, SSAM main window, two intersection close-up windows, a parameters configuration window, and a distribution display window. It is important to note that a full-featured tool of this type would require considerable design and development effort. The tool should be planned in stages.

Surrogate Safety Measures From Traffic Simulation Models FHWA-RD-03-050
Page 52
SSAM
Event IDEvent TypeLocation XLocation YTTCPETMax SpeedSpeed Diff
123Rear-end
123.454W34.543N
1.232.1
23.4546.5
X = 124.4543W Y = 34.2321N Filter ON
Time to collision
0:00 - 0:05Time
Color
Shape
PET
MaxS
File Analysis Display Configure Help
X = 124.4543W Y = 34.2321N Mode = PET
SSAM
Event IDEvent TypeLocation XLocation YTTCPETMax SpeedSpeed Diff
123Rear-end
123.454W34.543N
1.232.1
23.4546.5
Time to collision
Add Delete Select Configure Label Save SSAM
TTC distribution - Approach A
0
0.1
0.2
0.3
0.4
0.5
0 0.2 0.4 0.6 0.8
TTC
Prop
ortio
nDesign ADesign B
Figure 9. Workspace display.
Functional Requirements The SSAM functional requirements are expressed as a series of “shall” statements that describe the system functionality and are derived from the use cases identified in the previous section. Each requirement is categorized and prioritized according to the features that are mandatory, important, or desirable. Mandatory requirements are features or functionalities that must be provided by the SSAM software/system to fulfill the core mission of SSAM to provide surrogate safety analyses from traffic simulation models. The software will not be acceptable unless the mandatory requirements are met. Important requirements are features or functionalities that could be included in the SSAM software system to enhance the functionality of SSAM and would result in a more complete product, but may not be, for example,

Surrogate Safety Measures From Traffic Simulation Models FHWA-RD-03-050
Page 53
required by the system software in its initial implementation. These features and functions would be expected functions, but might not be included until the next version. Desirable requirements are features or functionalities that would be worthwhile to have in the initial implementation, but describe features or functionalities that are not essential to performing the core mission. These features might enhance usability, provide additional output formats (e.g., graphics, charts, reports), or provide additional user configurability. In this section, “the system” refers to the SSAM software system. The following subsections identify the key functional requirements for SSAM according to the use case packages. The matrix identifies:
1. Requirement number. 2. Requirement category and subcategories. 3. Requirement text. 4. Requirement rating (mandatory, important, desirable). 5. Comments.
The requirements traceability matrix numbers will be frozen with this submittal. For the purpose of tracking, any action such as adding, modifying, or deleting a requirement will not affect the numbering of the other requirements.

REQUIREMENT
NUMBER CATEGORY DESCRIPTION PRIORITY COMMENTS
1. INSTALL SSAM shall be installable on a PC, MacintoshTM, or UnixTM-based computer.
MANDATORY
1.1 INSTALL: automation
SSAM shall be installed by an automated process.
IMPORTANT e.g., Windows 2000TM InstallShieldTM
Installation of SSAM shall be possible without system administrator assistance.
IMPORTANT
2. UPGRADE SSAM shall be upgradable by an automated process.
MANDATORY e.g., patch via Compact-Disk(CD)
Upgrade to SSAM shall not require changes to simulation model.
IMPORTANT
3. CONFIGURE: categories
SSAM shall be configurable. Configurable features of SSAM shall include:
3.1 Surrogate measure thresholds, MANDATORY e.g., TTC < 1.0 s versus 1.5 s
3.2 Surrogate summary measure definitions, MANDATORY e.g., weighted sums of total surrogates – “intersection conflict index”
3.3 Section bin definitions, MANDATORY e.g., how many length regions to divide an approach into, how many time bins to divide each measure into (0.0-0.5, 0.5-1, 1-1.5) versus (0-0.25, 0.25-0.5, 0.5-0.75, 0.75-1), etc.
3.4 Measure color indications, IMPORTANT e.g., red, yellow, green versus 5-10 shades of one color
3.5 Event-type icons, IMPORTANT e.g., stars, circles, boxes, points
3.6 Analysis parameters, MANDATORY
3.7 Graphic display parameters. IMPORTANT
Surrogate Safety Measures From
Traffic Simulation M
odels FH
WA
-RD
-03-050 Page 5
4

REQUIREMENT NUMBER
CATEGORY DESCRIPTION PRIORITY COMMENTS
3.8 CONFIGURE: simulation characteristics
SSAM shall allow user to record characteristics of a simulation, including:
3.8.1 Traffic network geometrics, IMPORTANT e.g., approach lanes, turning-pocket lengths, intersection widths
3.8.2 Intersection controller characteristics, IMPORTANT
3.8.3 Traffic-stream characteristics, IMPORTANT e.g., approach volumes, turning percentages
3.8.4 Driver behavior characteristics. IMPORTANT e.g., gap-acceptance criteria, aggressiveness distribution
3.9 CONFIGURE: import
SSAM shall automatically import characteristics of a simulation, including:
3.9.1 Traffic network and intersection geometrics, DESIRABLE
3.9.1.1 Geometrics shall be imported from an industry-standard definition file
DESIRABLE e.g., TMML
3.9.2 Intersection controller characteristics, DESIRABLE
3.9.2.1 Intersection controller characteristics shall be imported from an industry-standard definition file
DESIRABLE e.g., TMML
3.9.3 Traffic-stream characteristics, DESIRABLE
3.9.3.1 Traffic-stream characteristics shall be imported from an industry-standard definition file
DESIRABLE e.g., TMML
3.9.4 Driver behavior characteristics, DESIRABLE
3.9.4.1 Driver behavior characteristics shall be imported from an industry-standard definition file.
DESIRABLE e.g., TMML
3.10 CONFIGURE: accessibility
Configurable characteristics of SSAM shall be accessible to user without developer intervention.
IMPORTANT
3.11 CONFIGURE: save
SSAM shall save configuration settings, including:
3.11.1 Default settings, MANDATORY At least one set of settings should be retained so that when software is restarted, user does not have to reconfigure everything all over again.
Surrogate Safety Measures From
Traffic Simulation M
odels FH
WA
-RD
-03-050 Page 5
5

REQUIREMENT NUMBER
CATEGORY DESCRIPTION PRIORITY COMMENTS
3.11.2 User-definable sets of configuration settings, DESIRABLE
3.11.2.1 User-defined configuration sets shall be loadable from files,
DESIRABLE
3.11.3 Current work-space state, DESIRABLE In case the program hangs or user’s computer crashes, user does not have to reconfigure everything all over again.
3.11.3.1 Work spaces (project definitions) shall be able to be switched by user without quitting and restarting software.
DESIRABLE e.g., like the way TSIS works with multiple scenarios open at the same time
4. OPERATE SSAM shall be executable by user. Commands shall include:
4.1 OPERATE: start Starting the application, including:
4.1.1 From PC start menu, MANDATORY
4.1.2 From desktop icon, IMPORTANT
4.1.3 Automatically as a component of an existing traffic simulation tool.
DESIRABLE
4.2 OPERATE: stop User shall be able to quit the SSAM application from user interface.
MANDATORY
4.3 OPERATE: help Help shall be available to user, including:
4.3.1 How to operate all controls, IMPORTANT
4.3.2 Interpretation of terminology, IMPORTANT
4.3.3 Guidelines for application of the statistical methodology,
DESIRABLE e.g., number of simulation iterations for meaningful analysis, how to compare distributions with T-test, etc.
4.3.4 Sample scenarios with associated analyses. DESIRABLE
4.4 OPERATE: filter User shall be able to filter displays by:
4.4.1 Event type, IMPORTANT
4.4.2 Surrogate measure severity, IMPORTANT
4.4.3 Surrogate measure type. IMPORTANT
Surrogate Safety Measures From
Traffic Simulation M
odels FH
WA
-RD
-03-050 Page 5
6

REQUIREMENT NUMBER
CATEGORY DESCRIPTION PRIORITY COMMENTS
4.5 OPERATE: get details
User shall be able to view the details of a particular conflict event.
MANDATORY
4.6 OPERATE: load results
User shall be able to load the results of a base case.
MANDATORY e.g., all subsequent design options are compared to the baseline case
4.6.1 Base case shall include multiple iterations of a simulation.
MANDATORY An “iteration” of a simulation is the same conditions simulated with a different random number seed. A “case” is a particular design or traffic scenario.
4.6.2 SSAM shall automatically determine how many simulation iterations will be loaded for a given case.
IMPORTANT It depends on the format of the event file(s) how the SSAM software will determine how many runs are included. It may have to be manually determined.
4.6.3 Results file format shall be a standardized data exchange technology format.
MANDATORY e.g., XML extension of TMML
4.6.3.1 Results file shall contain a header. Header shall contain:
MANDATORY
4.6.3.1.1 Date of analysis, MANDATORY For tracking
4.6.3.1.2 Time of analysis, MANDATORY For tracking
4.6.3.1.3 ID of analyst, MANDATORY For tracking
4.6.3.1.4 Comments on analysis (if any). MANDATORY
4.7 OPERATE: load comparison
SSAM shall allow user to load a comparison case. IMPORTANT e.g., alternative intersection design, different volume scenario, different controller phasing or pattern, etc.
4.7.1 Multiple comparison cases shall be allowed simultaneously.
IMPORTANT
4.7.2 Number of multiple comparison cases shall be, at minimum, 99 cases.
DESIRABLE
Surrogate Safety Measures From
Traffic Simulation M
odels FH
WA
-RD
-03-050 Page 5
7

REQUIREMENT NUMBER
CATEGORY DESCRIPTION PRIORITY COMMENTS
5. ANALYSIS SSAM shall allow user to perform surrogate safety analyses.
5.1 ANALYSIS: summary measures
User shall be able to compute a summary, aggregate surrogate measure by:
5.1.1 Approach, MANDATORY
5.1.2 Movement, MANDATORY
5.1.3 Phase, IMPORTANT
5.1.4 Location, MANDATORY
5.1.5 Intersection, MANDATORY
5.1.6 Time period, IMPORTANT
5.1.7 User-definable formula. DESIRABLE e.g., weighted sums of total conflict events “intersection index” comparison measures
5.1.8 Summary measures shall include statistics across simulation runs.
MANDATORY
5.2 ANALYSIS: differences
SSAM shall display comparative results from the base case and the comparison case.
IMPORTANT
5.2.1 Comparative results shall be displayable on all graphic formats.
DESIRABLE
5.2.2 Comparative results shall be available in tabular format.
DESIRABLE e.g., table could be composed of the differences between design alternatives, rather than the totals for each – software could compute the subtractions for user
6. DISPLAY SSAM shall allow user to display results, including:
6.1 DISPLAY: tables
Summary tables, MANDATORY
6.1.1 Summary tables shall have a default set of column elements.
MANDATORY e.g., conflict type, TTC, approach number, lane number, etc.
Surrogate Safety Measures From
Traffic Simulation M
odels FH
WA
-RD
-03-050 Page 5
8

REQUIREMENT NUMBER
CATEGORY DESCRIPTION PRIORITY COMMENTS
6.1.1.2 Multiple sets of default column combinations shall be supported.
IMPORTANT
6.1.2 User shall be able to sort summary tables by column.
IMPORTANT Typical feature of off-the-shelf table libraries.
6.1.3 Summary tables columns shall be selectable from any state variable returned in the event record.
DESIRABLE
6.2 DISPLAY: graphics
Graphics, including:
6.2.1 x-y plots, IMPORTANT
6.2.1.1 Plots shall be configurable by user. MANDATORY e.g., ticks, scale, bounds, marker types, legend, etc. – typical features of plot libraries
6.2.1.2 Plots shall support more than one series per plot. MANDATORY
6.2.2 Charts, IMPORTANT e.g., pie chart, bar graph, etc.
6.2.2.1 Charts shall be configurable by user. MANDATORY e.g., colors, scale, bounds, marker types, legend, etc. – typical features of chart libraries
6.2.3 DISPLAY: graphics: overhead intersection graphics
Overhead intersection graphics, MANDATORY
6.2.3.1 Overhead intersection graphics shall be able to be launched from the network graphic display.
DESIRABLE
6.2.3.2 Background graphics shall be imported, including:
MANDATORY Intersection schematics, overhead photos
6.2.3.2.1 Vector-based intersection drawings, MANDATORY e.g., Windows metafile (WMF)
6.2.3.2.2 Overhead intersection images. MANDATORY e.g., Graphics Interchanage File (GIF), .JPG (Joint Photographers Group)
6.2.3.2.3 Intersection schematics shall be geo-reference-able for alignment with background images.
DESIRABLE
Surrogate Safety Measures From
Traffic Simulation M
odels FH
WA
-RD
-03-050 Page 5
9

REQUIREMENT NUMBER
CATEGORY DESCRIPTION PRIORITY COMMENTS
6.2.3.2.4 Background graphics shall be able to be rotated for geo-reference.
DESIRABLE
6.2.3.3 Overhead intersection graphics shall be able to be panned by user.
IMPORTANT
6.2.3.4 Overhead intersection graphics shall be able to be zoomed by user.
IMPORTANT
6.2.3.5 Zoom and pan settings shall be retained for print/save.
DESIRABLE
6.2.3.6 Multiple overhead intersection graphics shall be viewable simultaneously.
MANDATORY
6.2.3.7 Conflict events shall be viewable on intersection graphics.
MANDATORY
6.2.3.7.1 Conflict events shall be placed with geo-referenced coordinates.
IMPORTANT Some simulations do not support Geographic Positioning System (GPS)-type vehicle tracking yet.
6.2.4 DISPLAY: graphics: network graphics
Traffic network graphics. DESIRABLE
6.2.4.1 Overhead intersection graphics displays shall be able to be launched from the network graphic display.
DESIRABLE
6.2.4.2 Background graphics shall be imported, including:
MANDATORY Intersection schematics, overhead photos
6.2.4.2.1 Vector-based network drawings, MANDATORY e.g., WMF
6.2.4.2.2 Overhead network images. MANDATORY e.g., GIF, JPG
6.2.4.2.3 Network schematics shall be geo-reference-able for alignment with background images.
DESIRABLE
6.2.4.2.4 Background graphics shall be able to be rotated for geo-reference.
DESIRABLE
6.2.4.3 Network graphics shall be able to be panned by user.
IMPORTANT
6.2.4.4 Network graphics shall be able to be zoomed by user.
IMPORTANT
Surrogate Safety Measures From
Traffic Simulation M
odel FH
WA
-RD
-03-050 Page 6
0
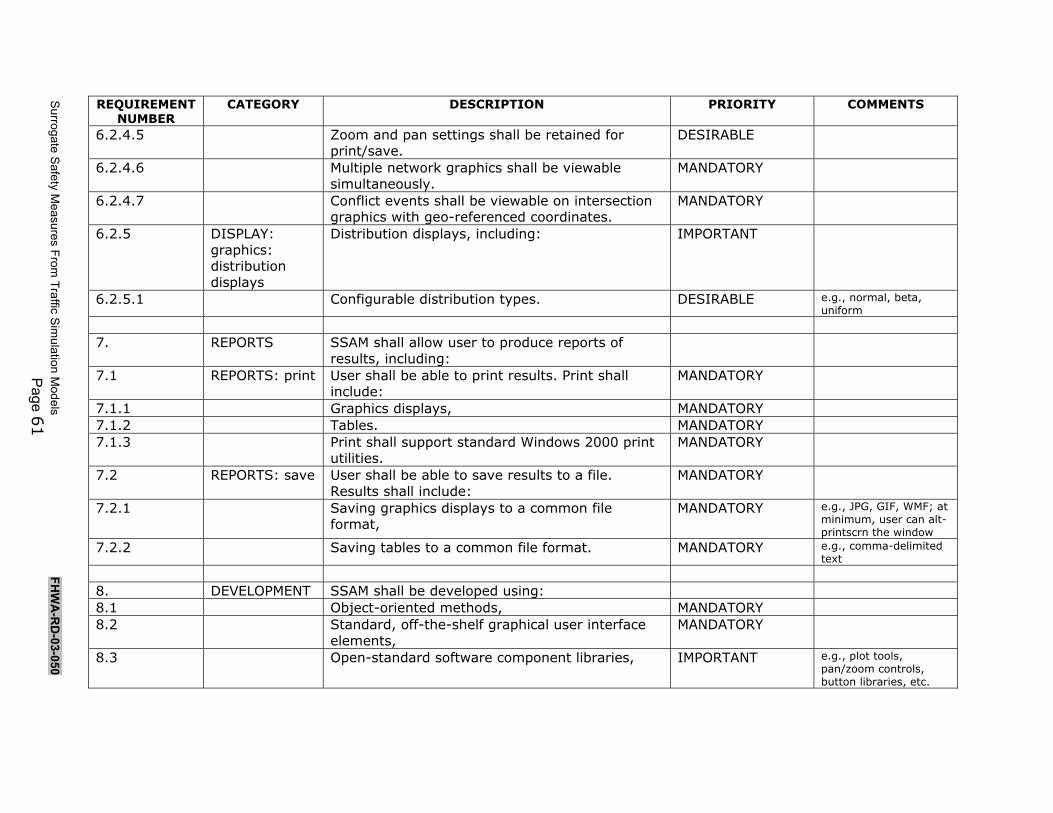
REQUIREMENT NUMBER
CATEGORY DESCRIPTION PRIORITY COMMENTS
6.2.4.5 Zoom and pan settings shall be retained for print/save.
DESIRABLE
6.2.4.6 Multiple network graphics shall be viewable simultaneously.
MANDATORY
6.2.4.7 Conflict events shall be viewable on intersection graphics with geo-referenced coordinates.
MANDATORY
6.2.5 DISPLAY: graphics: distribution displays
Distribution displays, including: IMPORTANT
6.2.5.1 Configurable distribution types. DESIRABLE e.g., normal, beta, uniform
7. REPORTS SSAM shall allow user to produce reports of results, including:
7.1 REPORTS: print User shall be able to print results. Print shall include:
MANDATORY
7.1.1 Graphics displays, MANDATORY
7.1.2 Tables. MANDATORY
7.1.3 Print shall support standard Windows 2000 print utilities.
MANDATORY
7.2 REPORTS: save User shall be able to save results to a file. Results shall include:
MANDATORY
7.2.1 Saving graphics displays to a common file format,
MANDATORY e.g., JPG, GIF, WMF; at minimum, user can alt-printscrn the window
7.2.2 Saving tables to a common file format. MANDATORY e.g., comma-delimited text
8. DEVELOPMENT SSAM shall be developed using:
8.1 Object-oriented methods, MANDATORY
8.2 Standard, off-the-shelf graphical user interface elements,
MANDATORY
8.3 Open-standard software component libraries, IMPORTANT e.g., plot tools, pan/zoom controls, button libraries, etc.
Surrogate Safety Measures From
Traffic Simulation M
odels FH
WA
-RD
-03-050 Page 6
1

REQUIREMENT NUMBER
CATEGORY DESCRIPTION PRIORITY COMMENTS
8.4 Independent modules with documented interfaces,
MANDATORY
8.5 Portable language for cross-platform compatibility.
MANDATORY See requirement 1.1, installation.
Surrogate Safety Measures From
Traffic Simulation M
odels FH
WA
-RD
-03-050 Page 6
2

Surrogate Safety Measures From Traffic Simulation Models FHWA-RD-03-050
Page 63
7. Algorithms for Surrogate Measures of Safety at Intersections
This section summarizes the proposed surrogate measures of safety and the algorithms required to derive the suggested surrogate measures from microscopic traffic simulation models. This section has three main subsections:
1. Description of conflict event situations to be evaluated at intersections. 2. Definition and description of the data required to be collected from the
simulation models to compute the surrogate measures. 3. Proposed step-by-step descriptions of the algorithms for collecting the
surrogates from a simulation model. Conflict Event Descriptions Observable situations (in the simulation) that can indicate the relative safety of different traffic intersection designs are conflict events. Conflict events occur between two vehicles that are on a collision course, but do not collide because of evasive action (by either one or both of the vehicles). These events can either occur in a particular single location in time and space – a conflict point – or during a range of times and locations – a conflict line (45). Figure 10, an elaboration of the figure from (45), illustrates both conflict line and point concepts. In all discussions of this report, travel is assumed to be according to the North American standard – vehicles travel on the right-hand side of the roadway.

Surrogate Safety Measures From Traffic Simulation Models FHWA-RD-03-050
Page 64
4
6
1
2 3
5
7
8
Figure 10. Conflict point and lines.
Crossing Flows—Conflict Point Events As shown in the figure, conflict points (notations 1, 2, 7, and 8) occur at the crossing of:
• Left turn by the westbound traffic onto the minor street conflicting with the eastbound traffic.
• Left turn by the minor approach traffic onto the main street to travel westbound.
• Crossing movement by the minor traffic proceeding straight across conflicting with the traffic going both eastbound and westbound.
These conflict points model the potential for angle collisions due to the acceptance of a gap that is too small by the encroaching traffic. The corresponding conflict events for other travel directions are not shown, but are also possible. Merging Crossing Flows—Conflict Line Events Conflict lines (notations 3 and 4) occur at the crossing of:

Surrogate Safety Measures From Traffic Simulation Models FHWA-RD-03-050
Page 65
• Left turn by the minor-street traffic conflicting with the westbound
traffic. • Right turn by the minor-street traffic conflicting with the eastbound
traffic. These conflict lines model the potential for rear-end collisions (or angle collisions from the rear) due to the acceptance of a gap that is too small by the encroaching traffic. The corresponding conflict events for other travel directions are not shown, but are also possible. Adjacent Flows—Lane-Changing Conflict Line Events Conflict lines (notation 6) denote rear-end events where the leader vehicle changes lanes abruptly in front of the follower vehicle, requiring the vehicle in the adjacent lane to brake to avoid collision. The corresponding alternative lane changes from outer lanes to inner lanes, as well as the occurrence in the other travel directions, are not shown, but are also possible. Following Flows—Rear-End Conflict Line Events Conflict lines (notation 5) denote rear-end events where the leader vehicle makes a right (or left [not shown]) turn causing the following vehicle to decelerate to avoid a collision. Additional conflict lines are possible for other travel directions, but are not shown in the figure. Collision Types Not Represented in the Surrogate Measures All of the conflict events represented in the surrogate measures are those that occur because of normal driving behaviors that are observable and possible to be modeled in a computer simulation. Some collisions that are not included here are sideswipe collisions, head-on collisions, and swerve-out-of-lane collisions. Some discussion of each of these categories is presented in the next subsections. SIDESWIPE COLLISIONS A vehicle in the process of changing lanes strikes an adjacent vehicle in the side because it:
1. Accepts the gap too early. 2. Does not see the vehicle because of obstructions. 3. The vehicle struck has made its own maneuver simultaneously with
the lane-changer, e.g., enters the link from a driveway.

Surrogate Safety Measures From Traffic Simulation Models FHWA-RD-03-050
Page 66
HEAD-ON COLLISIONS Would only be represented in the intersection model as a vehicle inadvertently crossing the centerline. This is not modeled in current simulation codes. SWERVE-OUT-OF-LANE COLLISIONS Much like a head-on collision, vehicles making a right turn from a minor approach onto the major street might veer into the opposing lanes if their speed were too high to make the turn. This is not modeled in current simulation codes. Pedestrian Collisions Simulation of pedestrians’ movements, awareness of pedestrians by vehicles, and vehicle-pedestrian interactions are not as well developed as vehicle-vehicle model components in available traffic simulation models (i.e., car following, lane changing, gap acceptance, etc.). Only a percentage of conflict events between pedestrians and vehicles are because of “normal” driving and pedestrian behaviors (jaywalking and mid-block pedestrian crossings are not typically modeled). Also, sight-distance restrictions and driver distractions play a large part in conflict events between pedestrians and vehicles, and pedestrian movements can cause rear-end conflicts between two approaching vehicles as well. These elements are not modeled in current traffic simulations, but should be an important part of future work in traffic simulation modeling. If the interactions between pedestrians and vehicles can be improved in future simulations, the extension of the concepts presented in this report should be easily extendable to conflict events between pedestrians and vehicles. U-Turn-Related Collisions U-turn maneuvers and the associated conflicts are somewhat difficult to represent in simulation models. Such a maneuver can create a point conflict event (crossing in front of oncoming traffic in the leftmost lane to U-turn into the rightmost lane) and/or merging line conflict event (crossing in front of oncoming traffic to U-turn into the same lane as oncoming traffic). There could also be the case where the U-turning traffic strikes a vehicle turning right (or vice versa). Such conflict events would either involve the U-turner or the right-turner braking to avoid the collision, depending on how the gap-acceptance procedure in the simulation model deals with right-of-way during a U-turn. U-turn conflict event statistics would only be available in simulation models that implement them explicitly and the representation of U-turns would be two separate conflict events—a crossing conflict point

Surrogate Safety Measures From Traffic Simulation Models FHWA-RD-03-050
Page 67
for a vehicle in the lane closest to the median and a conflict line event for a vehicle approaching in the lane that the vehicle enters upon completing the U-turn. Summary Even though these conflict types listed in this section are not represented, the majority of crashes that occur at intersections are covered by the conflicts that are represented in the simulation models. As shown in table 13, not being able to represent sideswipes and head-on conflicts will only have a small effect on estimating the total potential collisions. For example, in the first column, at urban, four-leg intersections, 83 percent of all collisions are angle, rear-end, pedestrian, and “other unknown,” not including sideswipe and head-on collisions. The “other unknown” events are typically single-vehicle crashes (e.g., run-off-road, striking fixed objects) that are not measurable in this project.2
Table 13. Percentage of total intersection crashes made up of angle, rear-end, and pedestrian collisions (other and unknown percentages in parentheses).
Two-Way Stop-Controlled Signalized Intersection Type Urban Rural Urban Rural
3-Legs 64 (+8) 45 (+6) 72 (+8) 66 (+10) 4-Legs 69 (+14) 62 (+6) 78 (+8) 76 (+7)
Unrepresented Evasive Maneuvers
In addition to neglecting the above collision types, the conflict points and lines illustrated in figure 10 also do not represent the capability of the reacting vehicles to perform the following countermeasures to avoid conflict events:
• Change lanes or swerve. • Accelerate. • Proactively decelerate or change lanes (i.e., defensive driving
behaviors that a certain class of drivers learn from experience with a particular location).
• Abort maneuvers.
2 The percent of crashes that are coded as “other” and “unknown” crashes are shown between parentheses (12).

Surrogate Safety Measures From Traffic Simulation Models FHWA-RD-03-050
Page 68
Significant Unrepresented Conflict Event Contributors The simulation models are only approximations to behavior in the real world. The hypothesis of the surrogate measures approach proposed here is essentially that some large percentage of undesirable behaviors (i.e., conflict events) are because of the geometry and/or signal timing of the intersection. Notable effects that are important contributors to conflict events and crashes, which cannot be modeled (yet) in traffic simulations include:
• Obstructions to visibility such as overhanging trees and shrubs, sharp corners, utility poles, bus stops, etc.
• Lighting deficiency or difficult lighting conditions such as sunrise and sunset.
• Snow, rain, blowing dust, standing water, poor drainage design.3 • Lack of adequate signage, location and readability, interpretability of
signs. • Noise level inside and outside of the vehicle. • Driver distractions inside and outside of the vehicle (cell phones,
rubber-necking, etc.). • Special conditions such as reversible lanes during particular times of
the day that are location-specific (and come as a surprise to drivers that are new to an area— “unintentional scofflaw behavior”).
• Red-light violations and other traffic scofflaw behavior.
3 Some representation of snow and rain can be included by modifying the driver behavior parameters—desired following distance, speed, reaction times, and vehicle performance variables. However, representation of reduced visibility, skidding, etc. could not be modeled adequately by modifying behavior parameters.

Surrogate Safety Measures From Traffic Simulation Models FHWA-RD-03-050
Page 69
Conflict Point The conflict point represents a fixed location in space where the crossing flow intersects with the flow proceeding straight through the intersection. In simulations where the crossing path is fixed, i.e., the turning vehicles always enter the receiving link in the same lane, this point would not change for each through lane. Where there are several paths available to the turning vehicle, then there would be several conflict points defined. This would be the case if there is a driveway or intersection at which the turning vehicle wishes to make a right turn shortly downstream (and the simulation models this). It might be useful for the simulation model to pre-process the locations of these conflict points at the beginning of the simulation and store them in a data structure for each intersection. This would eliminate re-computing the conflict points for each evaluation of a crossing maneuver. The time line of a conflict point event is illustrated in figure 11. The top curve represents the time-space trajectory of the crossing vehicle. The bottom curve represents the time-space trajectory of the through vehicle. While these curves are represented as continuous, smooth functions in the following figures, in a traffic simulation, the vehicle time-space trajectories are actually a set of straight lines between time steps. As the number of time steps per second increases, the curves become closer and closer approximations to a smooth curve (assuming the update equations and functions used by the traffic simulation are applicable at any time step resolution). The times t1 through t5 are defined as follows:
• At time t1, the crossing vehicle enters the encroachment area (i.e., starts to turn left).
• At time t2, the through vehicle realizes that a collision might occur and begins braking to avoid the collision.
• At time t3, the corner of the rear bumper (either right or left rear corner, depending on the travel direction) of the crossing vehicle leaves the encroachment point.
• At time t4, the through vehicle was projected to arrive at the conflict point if the vehicle continued at the same speed and trajectory before it started braking.
• At time t5, the through vehicle actually arrives at the conflict point.
Surrogate Safety Measures From Traffic Simulation Models FHWA-RD-03-050
Page 70
Conflict points also occur at the intersection of a flow from a right- or left-turning vehicle that proceeds in the same direction as the conflicted vehicle, but in a different lane. This situation can only be evaluated in simulations where the entering path can vary by lane. For example, in the real world, many maneuvers of this type occur on purpose by drivers that want to accept a particular gap of the size required to enter the flow, but that gap size was not available in the closest lane, because of the acceleration needed by the entering vehicle to avoid an approaching vehicle in that lane. A smaller size gap could be accepted, however, if the entering vehicle crosses in front of the approaching vehicle and begins accelerating in the adjacent lane (no vehicle is approaching in the adjacent lane, or the approaching vehicle in the adjacent lane is farther away). Thus, a conflict point event can occur when the driver crosses the first lane to enter the second one and begins accelerating. This occurs even if the driver then re-enters the crossed lane after the approaching vehicle has passed.

Surrogate Safety Measures From Traffic Simulation Models FHWA-RD-03-050
Page 71
Conflict point
Crossing vehicle
Throughvehicle
Spac
e
t1 Time
encroachment begin
t2 t3
Vehicle begins braking
Encroachment ends
Projected arrival at conflict point
Actual arrival at conflict point
t4 t5
Figure 11. Conflict point diagram.

Surrogate Safety Measures From Traffic Simulation Models FHWA-RD-03-050
Page 72
Conflict Line The conflict line represents a region of space where a preceding vehicle conflicts with a following vehicle in the same lane. This can be true of:
• Vehicle entering the lane from a cross street in front of a vehicle proceeding straight.
• Vehicles traveling in the same direction when the leader decides to turn left or right abruptly.
• Vehicles changing lanes in front of another vehicle, causing braking by the follower to maintain a safe following distance.
The latter two cases are described in the “rear-end conflict line” situations in the next section. The spatial regions of conflict lines are not fixed locations because they depend on the acceleration/deceleration characteristics of the particular vehicles involved in the conflict and the behavior of the driver model, i.e., how early or late the driver uses a turn signal. Thus, each conflict line will have to be computed for each conflict event. A timeline of a conflict line event for a vehicle turning from a minor approach onto the main street in front of a vehicle progressing straight through the intersection is illustrated in figure 12. The topmost curve represents the time-space trajectory of the leading vehicle (turning from the minor street). The bottommost curve represents the time-space trajectory of the following vehicle (vehicle already traveling on the main street). The times t1 through t9 are defined as follows:
• At time t1, the leading vehicle enters the encroachment area (i.e., starts to turn left into the same lane as the follower).
• At time t2, the following vehicle realizes that a collision might occur and begins braking to avoid the collision.
• At time t3, the next time step of the simulation is reached and state variables for each vehicle are updated.
• At time t4, the leading vehicle stops accelerating, reaching its intended travel speed.
• At time t5, the following vehicle is projected to have arrived at the first encroachment point if it had continued at the same velocity as before it started decelerating.
• At time t6, the leading vehicle arrives at a maximum conflict evaluation distance downstream from the starting point.

Surrogate Safety Measures From Traffic Simulation Models FHWA-RD-03-050
Page 73
• At time t7, the following vehicle is projected to have arrived at the second encroachment point if it had continued at the same velocity as at the second time step of the conflict line time period.
• At time t8, the following vehicle reaches the first encroachment point of the conflict line.
• At time t9, the following vehicle reaches the maximum conflict distance point.
The reference maximum downstream distance (shown as the horizontal dotted line across the top of the figure) is required for computation of surrogate measures similar to the post-encroachment time. In a pathological case, the measures could continue to decrease far down the link, and thus the minimum would continue to be recomputed even though the conflict event is not severe enough to be stored as a valid event. This is discussed further in the sections on computation of surrogate measures for conflict lines and rear-end conflict lines.

Surrogate Safety Measures From Traffic Simulation Models FHWA-RD-03-050
Page 74
A
B
Through vehicle
Time
Dis
tanc
e to
Con
flict
Poi
nt
Turning vehicle
0
t1 t2 t3 t5t4 t6 t8t7 t9
Distance of follower at next time step
Start of encroachment
Deceleration reaction
Turning vehicle stops acceleration
first conflict point
Reference maximum distance
Projected time to reach
Through vehicle reachesmaximum conflict distance
Projected time to reachsecond conflict point
Figure 12. Conflict line example.

Surrogate Safety Measures From Traffic Simulation Models FHWA-RD-03-050
Page 75
Rear-End Conflict Line Rear-end conflict lines are a slightly different conflict line situation. This is because either the leader or the follower could be the “encroaching party” in the generation of the near-miss collision event (or both). Consider that:
• The leader may fail to signal a turn soon enough or decelerate or turn suddenly while the follower was initially at a safe following distance.
• The follower may be following too closely to react to an adequate signal indication or at a safe braking speed.
• Both may be true. In any case, the braking done by the following vehicle is the indicator of the need to check for a rear-end conflict event. Recall also that we are seeking a linkage between rear-end conflict event frequency and differences in geometric or operational policies between intersection designs. It will be interesting to learn if the frequency of rear-end conflict events is influenced by geometric and/or phasing differences of intersection designs in the next phase of the surrogate safety measures project. A timeline of a rear-end conflict line event for a vehicle turning off of the main street onto a minor street in front of a vehicle progressing straight through the intersection is illustrated in figure 13. The topmost curve represents the time-space trajectory of the following vehicle (continuing straight). The bottommost curve represents the time-space trajectory of the leading vehicle (turning off of the road). Note that in this figure, the vehicles are traveling in the opposite direction to the vehicles in the example figures 11 and 12. The times t1 through t8 are defined as follows:
• At time t1, the leading vehicle starts to decelerate to turn off of the main street.
• At time t2, the following vehicle realizes that a collision might occur and begins braking to avoid the collision.
• At time t3, the next time step in the simulation begins and the state variables of each vehicle are updated.
• At time t4, the following vehicle is projected to have reached the first encroachment point if it had continued with the same velocity as before beginning deceleration.

Surrogate Safety Measures From Traffic Simulation Models FHWA-RD-03-050
Page 76
• At time t5, the following vehicle is projected to arrive at the next conflict evaluation point in the rear-end conflict line (where the leading vehicle was located at time t3) if it had continued with the same velocity as at time t3.
• At time t6, the next time step in the simulation is reached and the state variables for each vehicle are updated.
• At time t7, the leading vehicle leaves the main street, turning off the road.
• At time t8, the following vehicle is projected to have reached the point where the leading vehicle was located at time t6.
Similar to the conflict line situation, the rear-end conflict line situation requires a reference maximum downstream distance (not shown in figure 13) to terminate calculations of the measures such as the minimum TTC. Otherwise, the minimum TTC could be calculated as zero. This will be discussed further in future sections.

Surrogate Safety Measures From Traffic Simulation Models FHWA-RD-03-050
Page 77
Leading vehicle
Following vehicle
t1 t2 t3 t7t6 Time
Start of deceleration
Deceleration reaction
0
Leader turnsoff road
t4 t5 t8
Distance of leader at road exit
Distance of follower at next time step
Distance to C
onflict Point
Figure 13. Rear-end conflict line example.
Surrogate Safety Measures From Traffic Simulation Models FHWA-RD-03-050
Page 78
Summary of Conflict Points, Lines, and Rear-End Lines Conflict points define the situations where a crossing vehicle interrupts the progress of another vehicle, but the vehicles only interact at a specific point in space. Conflict lines describe the situations where two vehicles interact in the same lane for a period of time. Algorithms for calculating the surrogate measures of safety for these event types are specified in the next section. Surrogate Measures Definitions The surrogate measures that are suggested to be collected for each conflict event (point, line, and rear-end line) that occurs during the simulation are:
1. TTC. 2. PET. 3. Initial DR. 4. Maximum of the speeds of the two vehicles involved in the conflict
event (MaxS). 5. Maximum relative speed of the two vehicles involved in the conflict
event (DeltaS). 6. Starting and ending latitude and longitude – for conflict points (conflict
point location [CPL]) and conflict lines (conflict line starting point [CLSP], conflict line ending point [CLEP]).
The approach suggested here is to collect all of the relevant data on all of the individual conflict events that occur for a particular scenario. The role of the SSAM software is to help the analyst process this list of conflict event data into meaningful information about the surrogate safety of the intersection scenario. Severity of Conflict and Severity of Resulting Collision The size of the surrogates TTC, PET, and DR are intended to indicate the severity of the conflict event. This measures how likely a collision would result from a conflict, such that:
• Lower TTC indicates higher probability of collision. • Lower PET indicates higher probability of collision. • Higher DR indicates higher probability of collision.

Surrogate Safety Measures From Traffic Simulation Models FHWA-RD-03-050
Page 79
MaxS and DeltaS are used to indicate the likely severity of the (potential) resulting collision if the conflict event had resulted in a collision instead of a near-miss, such that:
• Higher MaxS indicates higher severity of the resulting collision. • Higher DeltaS indicates higher severity of the resulting collision.
Using the mass of the vehicles involved in the conflict, the MaxS and DeltaS values could also be used to calculate momentum values and get a better estimate of the severity of the resulting collision. This would reflect the fact that heavier vehicles can cause more damage than lighter ones. One must be careful, however, since the mix of the traffic stream is an input variable to the simulation. The analyst could reduce the incidence of high-consequence conflict events by reducing the proportion of heavier vehicles in the traffic mix. Nevertheless, it is important to determine both the severity of the conflict and the severity of the resulting collision. A location with many conflict events of a severity exceeding the thresholds for TTC, PET, and DR, but that are of low severity on the DeltaS and MaxS scales, may not have as high an interest for the analyst in terms of ranking or selecting intersections for safety improvements or further analysis. The resulting crashes in such a case would be more likely to be property damage only when MaxS and DeltaS are low. Locations that may experience fewer total conflict events with very high resulting potential severity (i.e., higher probability of resulting in injury and fatality crashes) are probably of more interest to analysts and engineers deciding how to prioritize safety upgrades among a number of candidate locations. The next subsections identify the surrogate measures TTC, PET, DR, MaxS, and DeltaS on the conflict point, conflict line, and rear-end conflict line diagrams and specify a procedure for calculations of each.

Surrogate Safety Measures From Traffic Simulation Models FHWA-RD-03-050
Page 80
Surrogate Measures for Conflict Points Figure 14 illustrates the definitions of the surrogate measures for a conflict point on the same diagram as shown in figure 11. Time To Collision TTC is defined uniquely for a conflict point as t4–t3. This is the difference between the encroachment end time of the turning vehicle and the projected arrival time of the through vehicle with the right-of-way at the conflict point if the vehicle had continued at the same speed as at the time of initial deceleration to avoid collision. Post-Encroachment Time PET is defined uniquely for a conflict point as t5-t3. This is the time between the departure of the encroaching vehicle from the conflict point and the arrival of the vehicle with the right-of-way at the conflict point. MaxS MaxS is first defined for each vehicle independently as the maximum speed of the vehicle between the times t1 and t5. Then the maximum of those two maximum values for each vehicle is recorded as the MaxS value for the conflict point event. DeltaS DeltaS is first defined for each time slice (from the beginning to the end of the conflict event) as the difference between the velocity of the two conflicting vehicles. Then the maximum of those DeltaS values for each time slice would be recorded as the DeltaS value. Initial Deceleration Rate Deceleration is the evasive action taken by the subject vehicle to avoid the collision. The initial DR would be a useful measure to indicate the potential severity of the conflict event. Acceleration and DRs should be available directly from the simulation model at each time step. On figure 14, the initial DR is the second derivative of curve B at time t2. Location of the Conflict Point Noting the latitude and longitude of the conflict point event can indicate particular locations that are risk areas.

Surrogate Safety Measures From Traffic Simulation Models FHWA-RD-03-050
Page 81
Conflict point
Through vehicle
Dis
tanc
e
t1 Time
Encroachment begins
t2 t3
Vehicle begins braking
Encroachment ends
Projected arrival at conflictpoint
Actual arrival at conflictpoint
t4 t5
TTC
PET
Initial Deceleration Rate
MaxS and DeltaS
Crossing vehicle
Figure 14. Surrogate measures on conflict point diagram.

Surrogate Safety Measures From Traffic Simulation Models FHWA-RD-03-050
Page 82
Computational Algorithms—Conflict Points Trigger Condition: Crossing vehicle decides to accept a gap and perform crossing maneuver in front of vehicle with right-of-way. The following situations include conflict points:
• Left turn from side street to opposite direction of travel to the right-of-way vehicle.
• Left turn from opposing direction of vehicle with right-of-way onto side street.
• Right turn from side street into lane on left-hand side of vehicle with the right-of-way.
• Left turn from side street to lane on right-hand side of vehicle with the right-of-way in the same direction of travel as the vehicle with the right-of-way.4
1. Record:
1.1. Current time step, t1.
1.2. Starting lane number of the encroaching vehicle.
1.3. Approach number of the encroaching vehicle.
1.4. Approach number of the right-of-way approach.
1.5. For a signalized intersection, traffic signal head indications (green, yellow, red) of all approach directions.
2. Compute the conflict point (latitude, longitude) for each lane crossed by the encroaching vehicle based on the projected path to the exiting lane number.
3. Record the CONFLICT POINT LOCATION (CPL) for each lane.
4. For each lane in the opposing direction crossed by the encroaching vehicle, identify:
4.1. Vehicle closest to the encroaching vehicle in that lane.
5. At each time step until the vehicle clears the conflict point for each lane, record for the crossing vehicle:
5.1. Vehicle speed.
5.2. Vehicle latitude and longitude. 4 Note that multiple combinations of A through D can occur in the same maneuver.

Surrogate Safety Measures From Traffic Simulation Models FHWA-RD-03-050
Page 83
5.3. Vehicle acceleration.
5.4. Driver behavior parameters.
6. Record time t3 that encroaching vehicle (rear bumper) clears the conflict point.
7. At each time step until the right-of-way vehicle clears the conflict point for its lane, record for the right-of-way vehicle:
7.1. Vehicle speed.
7.2. Vehicle latitude and longitude.
7.3. Vehicle acceleration.
7.4. Driver behavior parameters.
7.5. Traffic signal head indications (green, yellow, red) of all approaches impacted by the conflict event.
8. Record clearance time t5 of right-of-way vehicle from the conflict point for all vehicles with the right-of-way.
9. For the data recorded for each vehicle with the right-of-way, determine whether the vehicle had a deceleration event.
9.1. If previous step is true, determine whether the deceleration event was because of normal reaction to yellow/red.5
9.2. If reaction was not because of normal reaction to yellow/red, determine earliest time of deceleration of that vehicle.
10. Record INITIAL DR.
11. Record time t2.
12. Compute the projected arrival time at the conflict point of the right-of-way vehicle using the velocity at time t2 assuming no deceleration.
13. Record as time t4.
14. Compute TTC as t3-t2. Store as TTC.
15. Compute PET as t5-t2.
16. For each time step between t1 and t5, record the difference in the speed values of the encroaching vehicle and the vehicle with the right-of-way.
5 The braking of the right-of-way vehicle could be incidental to the gap acceptance of the encroaching vehicle. In the real world, this is quite common with drivers that anticipate the onset of yellow by watching the DON’T WALK indications change from flashing to solid.
Surrogate Safety Measures From Traffic Simulation Models FHWA-RD-03-050
Page 84
16.1. Find the maximum difference of the speed differential and store as DeltaS.
16.2. Find the maximum speed of encroaching vehicle between t1 and t5. Store as Max-s_encroaching.
16.3. Find the maximum speed of the right-of-way vehicle between t1 and t5. Store as Max-s_row.
16.4. Find the maximum of Max-s_encroaching and Max-s_row. Store as MaxS.
17. Determine whether the event has a significantly small enough TTC to be a valid conflict event.
17.1. If TTC < TTC_upper_limit (user determined parameter, e.g., 1.5 s), keep event.
17.2. Otherwise, do not store event data.

Surrogate Safety Measures From Traffic Simulation Models FHWA-RD-03-050
Page 85
Surrogate Measures for Conflict Lines With Merging Flows Figure 15 illustrates the definitions of the surrogate measures for a conflict line with a merging vehicle from a side street entering the flow in front of a vehicle with the right-of-way. Time To Collision As shown in figure 15, TTC is defined at each time step during the conflict line event. This begins when vehicle A begins braking to avoid the collision. At each time step, calculate the time that it would take vehicle A to reach the current location of vehicle B if its velocity remained unchanged from the start of the time period. The minimum of these TTC values is recorded as the TTC for the conflict line event. If the TTC values begin to increase after the first TTC calculation, the first value will be the minimum. If the TTC values begin to decrease, the values must continue to be calculated until they begin to increase. The value at the inflection point is the minimum TTC. If the TTC values begin to decrease and continue to decrease until the leader vehicle leaves the roadway or a maximum reference distance is reached, the minimum TTC value is recorded as the TTC value at the end of the conflict line event. Post-Encroachment Time Similar to the TTC, the PET must be recorded as the minimum PET over the conflict line duration. Two PET values are illustrated in figure 15. At each time step, the location of the leading vehicle must be recorded until the vehicles are no longer on a collision course (speed of vehicle B has dropped to zero) or the maximum conflict distance has been reached or the leading vehicle leaves the lane of the following vehicle. For each location recorded for the leading vehicle, the PET is calculated as the time difference between the arrival of the leading vehicle at that location and the arrival of the following vehicle at that location. The minimum PET is then selected from the PETs calculated for each location as the PET recorded for this conflict line event. For the situation shown in figure 15, the minimum PET that would be recorded is PET-1. MaxS Similar to the conflict points, MaxS is first defined for each vehicle independently as the maximum speed of the vehicle between the times t1 and t9 (or the time when the vehicles are no longer on a collision course). Then the maximum of the two maximum values for each vehicle is recorded as the MaxS value for the conflict line event.

Surrogate Safety Measures From Traffic Simulation Models FHWA-RD-03-050
Page 86
DeltaS Identical to the calculation for DeltaS in conflict point events, the DeltaS for conflict line events is first defined for each time slice (from the beginning to the end of the conflict event) as the difference between the velocity of the two conflicting vehicles. Then the maximum of those DeltaS values for each time slice would be recorded as the DeltaS value. Initial Deceleration Rate Initial DR is the second derivative of curve A (following vehicle) at time t2. It should be a state variable stored by the simulation model and directly available to be recorded. Location of the Conflict Line Noting the latitude and longitude of the start and ending points of the conflict line event can indicate particular locations that are risk areas. Where the conflict stops could be a number of points in the time line. For simplicity, we choose the ending point as the location of the following vehicle where the minimum PET is recorded. The beginning location is the starting point of the encroachment. The resulting line represents the risk area of the conflict occurrence.

Surrogate Safety Measures From Traffic Simulation Models FHWA-RD-03-050
Page 87
A
B
Through vehicle
Time
Dis
tanc
e to
Con
flict
Poi
nt
Turning vehicle
0
t1 t2 t3 t5t4 t6 t8t7
Distance of B at next time step
t9
PET-2Recorded PET value
TTC-1
TTC-2
Initial decelerationrate (DR)
Recorded TTC value
Speed zerono longer a
collision course
MaxS and DeltaScandidates
MaxS and DeltaScandidates
PET-1
Figure 15. Surrogate measures on conflict line diagram.

Surrogate Safety Measures From Traffic Simulation Models FHWA-RD-03-050
Page 88
Computational Algorithms—Conflict Lines for Merging Flows Trigger Condition: Crossing vehicle decides to accept a gap and enter traffic in same lane as vehicle with right-of-way. The following situations are included in conflict line events:
• Left turn from side street to same direction of travel as the vehicle with the right-of-way.
• Right turn from side street into same lane as vehicle with the right-of-way.
• Vehicle from adjacent lane changing lanes into the current lane in front of vehicle with the right-of-way.
1. Record:
1.1. Current time step, t1.
1.2. Starting lane number of the encroaching vehicle.
1.3. Approach number of the encroaching vehicle.
1.4. Approach number of the right-of-way vehicle.
1.5. For a signalized intersection, traffic signal head indications (green, yellow, red) for all approach directions.
1.6. Vehicle mass values.
1.7. Vehicle ID numbers.
2. Compute the first conflict location (latitude, longitude) for the lane entered by the encroaching vehicle.
3. Record the CONFLICT LINE STARTING POINT (CLSP).
4. For the lane entered by the encroaching vehicle, identify:
4.1. The vehicle closest to the encroaching vehicle in that lane (this vehicle is designated as the right-of-way vehicle).
5. At each time step, until the encroaching vehicle reaches the maximum conflict distance, record for the encroaching vehicle:
5.1. Vehicle speed.
5.2. Vehicle latitude and longitude.
5.3. Vehicle acceleration.
Surrogate Safety Measures From Traffic Simulation Models FHWA-RD-03-050
Page 89
5.4. Driver behavior parameters.
6. At each time step, until the encroaching vehicle reaches the maximum conflict distance, record for the right-of-way vehicle:
6.1. Vehicle speed.
6.2. Vehicle latitude and longitude.
6.3. Vehicle acceleration.
6.4. Driver behavior parameters.
6.5. Traffic signal head indications (green, yellow, red) for all approaches impacted by the conflict event.
7. For the data recorded for the vehicle with the right-of-way, determine whether the vehicle has a deceleration event.
8. If yes, determine whether the deceleration event was because of a normal reaction to yellow/red.6
9. If reaction was not because of a normal reaction to yellow/red, determine earliest time of deceleration of that vehicle.
10. Record INITIAL DR.
11. Record time t2.
12. For each time step t between t2 and t9, compute:
12.1. The projected arrival time at the location of the leading vehicle by the right-of-way vehicle using the velocity at time t assuming no deceleration. Record as time t_arrival.
12.2. Compute TTC(t) as t_arrival – t.
12.3. Determine the location in the list of locations for the leading vehicle that the right-of-way vehicle has just passed. Store the time of passage at that location as t_previous.
12.3.1. If no locations have been passed by the following vehicle yet, continue.
12.3.2. Or else, record the PET(t) as t_previous – t.
12.4. Record the difference in the speed values of the encroaching vehicle and the vehicle with the right-of-way as DELTA SPEED(t).
6 See previous footnote.

Surrogate Safety Measures From Traffic Simulation Models FHWA-RD-03-050
Page 90
12.5. Record the maximum speed of the two speed values of the encroaching and right-of-way vehicles as MAX SPEED(t).
12.6. Check:
12.6.1. If TTC(t) < TTC(t-1),
12.6.1.1. Save TTC = TTC(t).
12.6.2. If PET(t) < PET(t-1),
12.6.2.1. Save PET = PET(t).
12.6.2.2. Save CONFLICT LINE ENDING POINT (CLEP) = Lat, lon of follower at t.
12.6.3. If MaxSpeed(t) > MaxSpeed(t-1),
12.6.3.1. Save MaxS = MaxSpeed(t).
12.6.4. If DeltaSpeed(t) > DeltaSpeed(t-1),
12.6.4.1. Save DeltaS = DeltaSpeed(t).
12.6.5. If velocity of right-of-way vehicle = 0, stop.
13. Record TTC.
14. Record PET.
15. Record CLEP.
16. Record MaxS.
17. Record DeltaS.
18. Determine whether the event has a significantly small enough TTC to be a valid conflict event.
18.1. If TTC < TTC_upper_limit (user-determined parameter, e.g., 1.5 s), keep event.
18.2. Otherwise, do not store event data.

Surrogate Safety Measures From Traffic Simulation Models FHWA-RD-03-050
Page 91
Surrogate Measures for Rear-End Conflict Lines Figure 16 illustrates the definitions of the surrogate measures for a conflict line during a rear-end event. Rear-end events describe those conflict lines that occur specifically when the two interacting vehicles are already in the same lane. Time To Collision As shown in figure 16, TTC is defined at each time step during the conflict line event. This begins when vehicle A begins braking to avoid the collision. At each time step, calculate the time that it would take vehicle A to reach the current location of vehicle B if its velocity remained unchanged from the start of the time period. The minimum of these TTC values is recorded as the TTC for the conflict line event. If the TTC values begin to increase after the first TTC calculation, the first value will be the minimum. If the TTC values begin to decrease, the values must continue to be calculated until they begin to increase. The value at the inflection point is the minimum TTC. If the TTC values begin to decrease and continue to decrease until the leader vehicle leaves the roadway or a maximum reference distance is reached, the minimum TTC value is recorded as the TTC value at the end of the conflict line event. Post-Encroachment Time Similar to the TTC, the PET must be recorded as the minimum PET over the conflict line duration. Two PET values are illustrated in figure 16. At each time step, the location of the leading vehicle must be recorded until the vehicles are no longer on a collision course (speed of vehicle B has dropped to zero) or the maximum conflict distance has been reached or the leading vehicle leaves the lane of the following vehicle. For each location recorded for the leading vehicle, the PET is calculated as the time difference between the arrival of the leading vehicle at that location and the arrival of the following vehicle at that location. The minimum PET is then selected from the PETs calculated for each location as the PET recorded for this conflict line event. For the situation shown in figure 16, the minimum PET that would be recorded is PET-1. MaxS Similar to the conflict points, MaxS is first defined for each vehicle independently as the maximum speed of the vehicle between the times t1 and t9 (or the time when the vehicles are no longer on a collision course). Then the maximum of the two maximum values for each vehicle is recorded as the MaxS value for the conflict line event.
Surrogate Safety Measures From Traffic Simulation Models FHWA-RD-03-050
Page 92
DeltaS Identical to the calculation for DeltaS in the conflict point events, the DeltaS for the conflict line events is first defined for each time slice (from the beginning to the end of the conflict event) as the difference between the velocity of the two conflicting vehicles. Then the maximum of those DeltaS values for each time slice would be recorded as the DeltaS value. Initial Deceleration Rate The initial DR is the second derivative of curve B (following vehicle) at time t2. It should be a state variable stored by the simulation model and directly available to be recorded. Location of the Conflict Line Noting the latitude and longitude of the starting and ending points of the conflict line event can indicate particular locations that are risk areas. Where the conflict stops could be a number of points in the time line. For simplicity, we choose the ending point as the location of the following vehicle where the minimum PET is recorded. The beginning location is the starting point of the encroachment. The resulting line represents the risk area of the conflict occurrence.

Surrogate Safety Measures From Traffic Simulation Models FHWA-RD-03-050
Page 93
Vehicle A
Vehicle BD
ista
nce
to C
onfli
ct P
oint
t1 t2 t3 t7t6 Time
0
15
Leader turnsoff road
t4 t5 t8
10
Recorded PET valueTTC-1
MaxS and DeltaScandidates
TTC-2
PET-2PET-1
Recorded TTC value
Initial decelerationrate (DR)
Figure 16. Surrogates identified on rear-end line diagram.

Surrogate Safety Measures From Traffic Simulation Models FHWA-RD-03-050
Page 94
Computational Algorithms—Rear-End Conflict Lines Trigger Condition: Vehicle B is following vehicle A in the same lane. The following situations are included in rear-end conflict line events:
• Vehicle A turns left from the main travel direction in front of the following vehicle B.
• Vehicle A turns right from the main travel direction in front of the following vehicle B.
• Vehicle A performs unexpected sudden braking to avoid collision and/or react to red/yellow.
1. Record: 1.1. The current time step, t1. 1.2. Lane number of the vehicles. 1.3. Approach number of the vehicles. 1.4. Intended movement of vehicle A (left, right, diagonal). 1.5. For a signalized intersection, traffic signal head indications
(green, yellow, red) for all approach directions. 1.6. Vehicle mass values. 1.7. Vehicle ID numbers
2. Compute the first conflict location (latitude, longitude) for the leading vehicle.
3. Record CLSP. 4. For the leading vehicle, identify:
4.1. The vehicle closest to the encroaching vehicle in that lane (this vehicle is designated as the following vehicle).7
5. At each time step, record for the leading vehicle, until the leading vehicle:
• Reaches the maximum conflict distance,
• Performs the turning maneuver, or
• Comes to a complete stop,
5.1. Vehicle speed.
5.2. Vehicle latitude and longitude.
7 Terms of “encroaching” and “right-of-way” are replaced with “leading” and “following” since, in a rear-end conflict event, the fault can be placed on either driver, or both (failing to signal and/or following too closely).

Surrogate Safety Measures From Traffic Simulation Models FHWA-RD-03-050
Page 95
5.3. Vehicle acceleration.
5.4. Driver behavior parameters.
6. At each time step, until the leading vehicle reaches either of the conditions in the previous step, record for the following vehicle:
6.1. Vehicle speed.
6.2. Vehicle latitude and longitude.
6.3. Vehicle acceleration.
6.4. Driver behavior parameters.
6.5. Traffic signal head indications (green, yellow, red) of all approaches impacted by the conflict event.
7. For the data recorded for the following vehicle, determine whether the vehicle had a deceleration event.
7.1. If yes, determine whether the deceleration event was because of normal reaction to yellow/red.8
7.2. If reaction was not because of normal reaction to yellow/red, determine earliest time of deceleration of that vehicle.
8. Record INITIAL DR.
9. Record time t2.
10. For each time step t between t2 and t9, compute:
10.1. The projected arrival time at the location of the leading vehicle by the following vehicle using the velocity at time t assuming no deceleration.
10.2. Record as time t_arrival.
10.3. Compute TTC(t) as t_arrival – t.
10.4. Determine which location in the list of locations for the leading vehicle that the following vehicle has just passed.
10.5. Store the time of passage at that location as t_previous.
8 As with footnotes 3 and 4, the following vehicle could react to the signal indication independent of closely following the leading vehicle and create a conflict event that is because of behavioral parameters alone. Some combination of phasing strategy and geometry must contribute to the frequency of rear-end conflict events for a valid comparison between alternatives.

Surrogate Safety Measures From Traffic Simulation Models FHWA-RD-03-050
Page 96
10.5.1. If no locations have been passed by the following vehicle yet, continue.
10.5.2. Or else, record the PET(t) as t_previous – t.
10.6. Record the difference in the speed values of the leading vehicle and the following vehicle as DeltaS(t).
10.7. Record the maximum speed of the two speed values of the leading and following vehicles as MaxS(t).
10.8. Check:
10.8.1. if TTC(t) < TTC(t-1),
10.8.1.1. Save TTC = TTC(t).
10.8.2. If PET(t) < PET(t-1),
10.8.2.1. Save PET = PET(t).
10.8.2.2. Save CLEP = Lat, lon of following vehicle at t.
10.8.3. If MaxSpeed(t) > MaxSpeed(t-1),
10.8.3.1. Save MaxS = MaxSpeed(t).
10.8.4. If DeltaSpeed(t) > DeltaSpeed(t-1),
10.8.4.1. Save DeltaS = DeltaSpeed(t).
10.8.5. If velocity of following vehicle = 0, stop.
11. Record TTC.
12. Record PET.
13. Record CLEP.
14. Record MaxS.
15. Record DeltaS.
16. Determine whether the event has a significantly small enough TTC to be a valid conflict event.
16.1. If TTC < TTC_upper_limit (user-determined parameter, e.g., 1.5 s),9 keep event.
16.2. Otherwise, do not store event data. 9 Automated intelligent cruise control (AICC) research (84) indicates that humans remain safe in high-speed car-following experiments at a TTC of 3.5 s without warning systems and 2.6 s with warning systems. (85) has reported lower critical TTC values at intersection approaches of 1.5 s, primarily because of the slower speeds (49).

Surrogate Safety Measures From Traffic Simulation Models FHWA-RD-03-050
Page 97
Summary Surrogate measures from simulation models are proposed to estimate the comparative safety effect of different intersection alternatives. Definitions and computational algorithms for surrogate measures were presented in this section for:
• Conflict points. • Conflict lines with vehicles merging into the same lane. • Conflict lines for vehicles following one another in the same lane.
The surrogates TTC and PET measure the severity of the conflict event and the MaxS, DeltaS, and DR measure the severity of the potential collision that would ensue if, in fact, the vehicles collided. Conflict points have unique definitions of TTC and PET. Conflict lines and rear-end lines require a search for the minimum TTC and PET over the duration of the conflict event (e.g., for all locations on the conflict line). The next section specifies what the event file output from the simulation models could look like to support surrogate safety analysis.

Surrogate Safety Measures From Traffic Simulation Models FHWA-RD-03-050
Page 98
Page intentionally blank

Surrogate Safety Measures From Traffic Simulation Models FHWA-RD-03-050
Page 99
8. Event File Specification Given the calculation algorithms specified above, the next step is to specify the format of the output file and determine how the calculations can be split up between the simulation model and the surrogate safety module. To make it as easy as possible for simulation model developers to support the event file format with a minimum of additions/changes to existing software, there will be more information in the event file list than only valid conflict events (this would indicate that the entire surrogate measures calculation algorithms were embedded in the simulation model). The surrogate safety module would then post-process the event file to extract valid conflict events and compute surrogate measures. Elements in the Event File The event file will contain:
• All lane-change events. • All gap-acceptance events—crossing flows. • All gap-acceptance events—entering flows. • All events where a vehicle makes a turn with a vehicle following that
causes braking. • All events where a leader vehicle brakes and causes the following
vehicle to brake. Three message types are required for each conflict event:
• Event start. • Event continue. • Event end.
The “event continue” entry is needed because the surrogate measures calculations require a time history of state variables for both the leader and follower vehicles (i.e., to find minimum TTC and PET and maximum DeltaS and MaxS). A sequential text file of the resulting format could look like this:
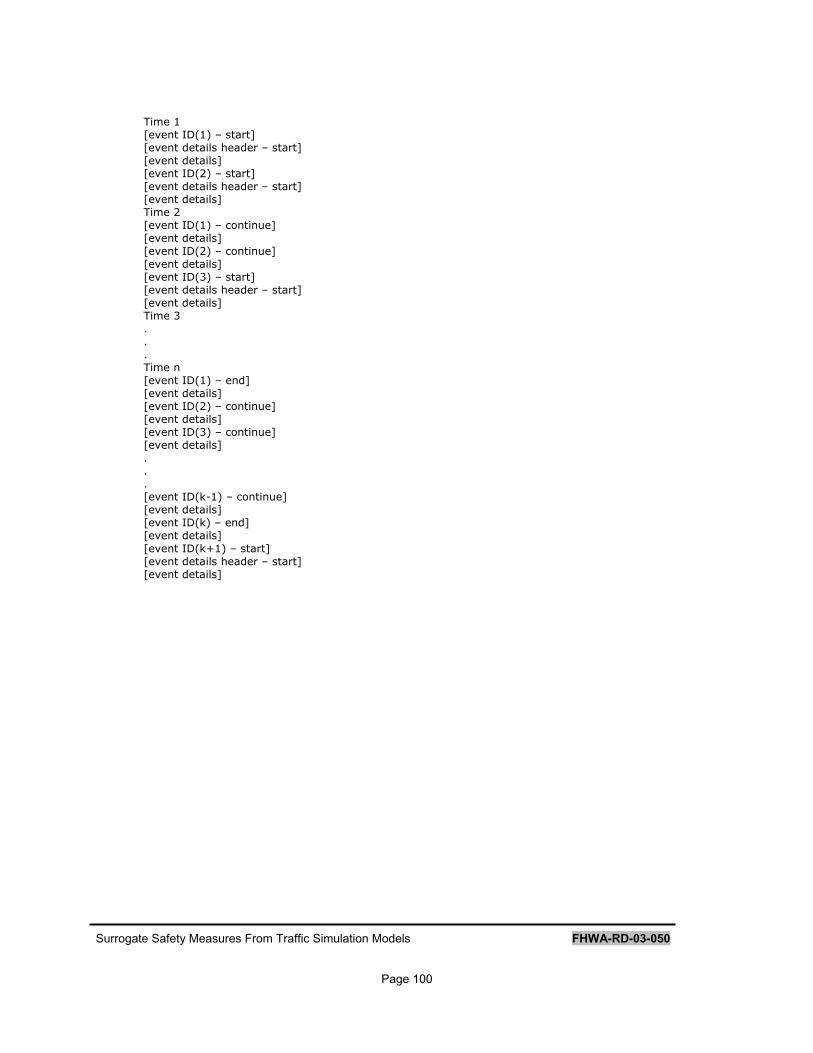
Surrogate Safety Measures From Traffic Simulation Models FHWA-RD-03-050
Page 100
Time 1 [event ID(1) – start] [event details header – start] [event details] [event ID(2) – start] [event details header – start] [event details] Time 2 [event ID(1) – continue] [event details] [event ID(2) – continue] [event details] [event ID(3) – start] [event details header – start] [event details] Time 3 . . . Time n [event ID(1) – end] [event details] [event ID(2) – continue] [event details] [event ID(3) – continue] [event details] . . . [event ID(k-1) – continue] [event details] [event ID(k) – end] [event details] [event ID(k+1) – start] [event details header – start] [event details]

Surrogate Safety Measures From Traffic Simulation Models FHWA-RD-03-050
Page 101
Elements in the Header
The event header at the event start time would include:
1. Event ID number. 2. Intersection ID and control type.10 3. Event type (conflict point, line, rear-end line) and subtype identifier
(e.g., encroaching vehicle left turn to side street in front of right-of-way vehicle).
4. Vehicle ID numbers. 5. Lane number of the leader and follower vehicles. 6. Approach number of the leader and follower vehicles. 7. Intended movement of the leader and follower vehicles. 8. Vehicle mass and performance variables for leader and follower
vehicles. 9. Vehicle driver behavior variables.
Elements in Each Time Step At each time step, the event details would include:
1. Event ID number. 2. If signalized, current signal phase states. 3. Latitude and longitude of leader and follower vehicles. 4. Velocity of leader and follower vehicles. 5. DR of leader and follower vehicles. 6. Turning signal state of leader vehicle (if available). 7. Time-varying driver behavior parameters.11
Implications of File Size The event file may become very large in size due to the limited amount of filtering provided by the simulation model developers. With more filtering according to the computational algorithms of the previous section, the file would be much smaller. If more filtering could be done by the simulation model itself, then the event file format might also change. For example, consider filtering the candidate conflict events based on deceleration events by the following or right-of-way vehicle. This would require a different file format since the event details would only be output by the simulation model
10 Assumes the simulation includes multiple intersections. If only one intersection is modeled, the data element is not required. 11 If any (e.g., increased aggressiveness due to queue wait time is modeled in some simulations).

Surrogate Safety Measures From Traffic Simulation Models FHWA-RD-03-050
Page 102
after the deceleration event was identified. With the current specification, this could not be done. File Naming Conventions One event file would be produced for each simulation iteration with a naming convention so that the surrogate measures software could import each file automatically when the user enters the root file name and the increment format and is pointed to the correct directory where the files reside.12 For example, “testcase001, testcase002,…, testcase045” would have a root of testcase and an increment of NNN.
12 It would be advisable, as indicated in the functional requirements section, that this event file be based on a standard inter-simulation exchange format (e.g., XML based on the TMML).

Surrogate Safety Measures From Traffic Simulation Models FHWA-RD-03-050
Page 103
9. Validation of Surrogate Measures There is a significant amount of additional effort required to validate that the proposed surrogate measures can adequately assess the safety of particular intersection conditions. The proposed surrogate measures are largely not observable by an independent roadside observer with only visually subjective information on vehicle locations and speeds. Past studies on TTC estimation have used categories to judge the value of TTC in bins (i.e., “high,” “medium,” “low” to correlate with 0-0.5 s, 0.5 s-1.0 s, 1.0 s-1.5 s) (33). Video analysis could be used to improve the estimated speed, acceleration, etc. of vehicles involved in particular conflict events so that better estimates of TTC, PET, etc. could be produced. The issue, however, is not whether the surrogates can be replicated in a field study, but rather whether the surrogates are correlated with observable behaviors that indicate the safety of a traffic facility. This does not mean that the surrogates need to be correlated directly to the actual number of crashes or conflicts at a particular intersection, but rather that the relative differences (or perhaps rank order) of various intersection designs as evaluated by the surrogate safety methodology are correlated with a similar study with real-world conflict measurements. Three hypotheses for surrogate safety measures from simulation models and a corresponding validation test approach for each are listed in this section. Each validation test includes an estimate of the level of effort (LOE) required for executing the test activities. The hypotheses for the utility of the surrogate measures are:
1. Discriminating between the safety of two design alternatives in a simulation.
2. Correlation of the surrogate measures with real-world traffic conflict studies.
3. Correlation of surrogate measure reductions with predicted reductions in traffic conflicts.
Discrimination Between Intersection Design Alternatives Hypothesis: Two different intersection designs produce different frequencies of traffic conflict events predicted by a simulation model. This indicates that one intersection design or strategy is more or less safe than another. Positive Result: Validation that traffic simulation results could be used in evaluating proposed future alternatives for intersection redesign. Conclude

Surrogate Safety Measures From Traffic Simulation Models FHWA-RD-03-050
Page 104
that surrogate measure distributions are appropriate discriminators of relative intersection safety performance. This hypothesis must be satisfied before the other hypotheses can be tested. Approach
1. Code intersection design A in simulation model. 2. Code intersection design B in simulation model. 3. Simulate intersection designs over range of volume and turning
probability scenarios. a. Replicate n times per scenario for statistical significance.
4. Collect surrogate measures for each design and compare statistical distributions of various aggregations (distributions of distributions). Test comparisons of:
a. Total number of conflict events. b. Number of events of a particular type. c. Number of total events on a particular approach or movement. d. Other types of aggregations as appropriate.
Correlation With Traffic Conflicts Hypothesis: High frequency of traffic conflict events predicted by a simulation model is correlated with high frequency of traffic conflicts as measured in a real-world study by the traffic conflicts technique. Positive Result: Validation that traffic simulation results could be used to replace or augment traditional data gathering for safety analysis. Approach
1. Code intersection design(s) in simulation model to match real-world intersection(s) with traffic conflict data.
2. Simulate intersection operations over volume and turning probability scenarios as experienced during the traffic conflicts study.
a. Replicate n times per scenario for statistical significance during each scenario.
3. Collect surrogate measures from simulation model scenarios and compare how statistical distributions of various aggregations change with how the traffic conflicts data change for several control variables. Test comparisons of:
a. Total number of conflict events. b. Number of events of a particular type. c. Number of total events on a particular approach or movement.

Surrogate Safety Measures From Traffic Simulation Models FHWA-RD-03-050
Page 105
d. Other types of aggregations as appropriate. Prediction of Reductions in Traffic Conflicts Hypothesis: Frequency of traffic conflict events predicted by the simulation model for a particular intersection improvement alternative is correlated with the actual change in the frequency of conflict events in the real world as measured in a real-world study. Positive Result: Validation that the safety improvements predicted by the simulation model are not only relatively comparable (i.e., percentage improvements) across alternatives, but are also comparable in an absolute sense (total number of conflict events of particular types). Approach
1. Code intersection design(s) for “before” condition A in simulation model to match intersection before improvements.
2. Code intersection design(s) for “after” condition B to match intersection after improvements.
3. Simulate intersection operations over volume and turning probability scenarios as experienced during the traffic conflicts study for before and after conditions.
a. Replicate n times per scenario for statistical significance during each scenario.
4. Collect surrogate measures from simulation model scenarios. 5. Compare how statistical distributions of various aggregations change
in the simulation model “before and after” with how the traffic conflicts data changed for the “before and after” conditions. Test comparisons of:
a. Total number of conflict events. b. Number of events of a particular type. c. Number of total events on a particular approach or movement. d. Other types of aggregations as appropriate.
6. ALTERNATIVE TO (5): Compare predicted conflict reduction of the “after” condition with published collision and/or conflict reduction factors (average percent reductions). Repeat 1 through 4 for several other intersection designs and compare results to published conflict reduction factors.
Alternative Approach
1. Code various types of intersection designs. 2. Simulate intersection operations over volume and turning probability
scenarios as experienced during the traffic conflicts studies.

Surrogate Safety Measures From Traffic Simulation Models FHWA-RD-03-050
Page 106
a. Replicate n times per scenario for statistical significance during each scenario.
3. Collect surrogate measures from simulation model scenarios. 4. Rank surrogate measure results for design scenarios by combining
conflict statistical results into indices. a. Compare the rank order of the simulation design scenarios with
the rank order of the design scenarios according to the potential for conflict reduction ranking.

Surrogate Safety Measures From Traffic Simulation Models FHWA-RD-03-050
Page 107
10. Report Summary This report has presented a review of the literature in surrogate safety assessment, a review of the capabilities of traffic simulation models for obtaining surrogate safety measures, functional requirements for a surrogate safety assessment software tool, and a set of surrogate measures to be collected from traffic simulation models to assess the safety of various intersection designs and timing strategies. The approach suggested here is to collect detailed data on all conflict events that occur between two vehicles at the intersection. Two requirements must be satisfied for an undesirable event to have occurred:
• One of the vehicles must take evasive action to avoid a collision. • The resulting surrogate measures must be of significant value (i.e.,
less than a user-specified threshold, as guided by the literature). The surrogate measures proposed are:
• Minimum time TTC during the conflict event. • Minimum PET during the conflict event. • Maximum speed of the two vehicles (MaxS). • Maximum difference in the speed of the two vehicles during the
conflict event (DeltaS). • Initial DR of the reacting vehicle. • Location of the starting and ending points of the conflict event (CPL,
CLSP, and CLEP). All possible situations where the traffic conflict events occur were presented. These situations can be categorized as conflict points, conflict lines, and rear-end conflict lines. Conflict points describe times when a crossing flow impedes the progression of the right-of-way vehicle at just one point in the path of the vehicle. Conflict lines describe the other situations where a vehicle merges into the traffic stream in front of the vehicle with the right-of-way and causes evasive action by the following vehicle to avoid a collision. Rear-end conflict lines are a special case of conflict lines where the two vehicles are already in the same lane (no merging activity takes place first) and the leading vehicle takes some action that causes the following vehicle to react evasively. Computational algorithms for calculating the surrogate measures for each of the conflict event situations were presented. Example diagrams were shown

Surrogate Safety Measures From Traffic Simulation Models FHWA-RD-03-050
Page 108
that illustrate the calculations of the surrogates graphically. Conflict points are the simplest case for algorithm computations, since the TTC and PET values are defined uniquely. Conflict lines and rear-end conflict lines require multiple computations of the surrogate measures and a minimum (or maximum in the case of MaxS and DeltaS) function must be applied to select the “worst case” value for recording. Given these computational algorithms and surrogate measure definitions, a format for an “event file” that could be produced by simulation models was presented. The event file format identifies a list of data that could be supported by the simulation model developers with a minimum of effort that could be read by the surrogate safety module and post-processed.13 The data are essentially a time history of the speed, acceleration, and location of vehicles in the intersection that are candidates for conflict events. Each time a vehicle:
• Changes lanes. • Accepts a gap to cross the right-of-way flow. • Accepts a gap to join the right-of-way flow. • Brakes and causes a following vehicle to brake. • Turns and causes a following vehicle to brake.
An event record is created and written to the event file until the end of the event. If more logic of the computational algorithms for surrogate measures could be integrated within the simulation model, the event file format would have to be modified. The event file is imported into new software for performing surrogate safety analysis by comparing the performance of various intersection designs by making graphs, charts, tables, and a distributional analysis of the surrogate measures. The entire process of computing, extracting, and analyzing the surrogate measures from the traffic simulation models has been denoted as SSAM. Finally, future validation activities for assessing the connection between surrogate measures and the safety of intersections were presented. Three hypotheses for surrogate safety measures were listed with the associated steps required to complete the acceptance or rejection of the hypothesis.
13 This event file format would also support alternative derived surrogates, such as the TET and TIT measures derived from TTC measurements (49).

Surrogate Safety Measures From Traffic Simulation Models FHWA-RD-03-050
Page 109
The first hypothesis verifies that the simulation models of two different intersection designs produce different distributions of surrogate measures. The second hypothesis is that the surrogate measures produced by the simulation model is correlated with the occurrence of traffic conflicts in the real world, as would be measured by a traffic conflicts study. The third hypothesis is that the surrogate measures produced by the simulation model would predict (be correlated with) the difference in traffic conflicts, as experienced in the real world, between a “before” condition of an intersection design and the “after” condition of an intersection design after improvements were made to improve the safety of the facility (improvements that could, of course, be represented in the simulation model).

Surrogate Safety Measures From Traffic Simulation Models FHWA-RD-03-050
Page 110
Page intentionally blank
Surrogate Safety Measures From Traffic Simulation Models FHWA-RD-03-050
Page 111
11. References 1. W.G. Najm, J.D. Smith, and D.L. Smith, 2001. Analysis of crossing
path crashes, DOT Report HS-809-423. 2. E. Hauer, et al., 1988. “Estimation of safety at signalized
intersections,” Transportation Research Record, Vol. 1185.
3. B. Persaud, 1988. “Do traffic signals affect safety? Some methodological issues,” Transportation Research Record, Vol. 1185.
4. T. Datta, 1991. “Head-on, left-turn accidents at intersections with
newly installed traffic signals,” Transportation Research Record, Vol. 1318.
5. G. Davis and Y. Gao, 1995. “Statistical methods to support induced
exposure analyses of traffic accident data,” Transportation Research Record, Vol. 1401.
6. M. Zhou and V. Sisiopiku, 1997. “Relationship between volume-to-
capacity ratios and accident rates,” Transportation Research Record, Vol. 1581.
7. K. Bauer and D. Harwood, 2000. Statistical models of at-grade
intersection accidents—Addendum, Report No. FHWA-RD-99-094. Federal Highway Administration, Washington, DC.
8. P. Ossenbruggen, 1998. “A method of identifying hazardous highway
locations using the principle of individual lifetime risk,” Risk, Health, and Environment, Volume 83, Winter.
9. Anderson, et al., 1999. “Relationship to safety of geometric design
consistency measures for rural two-lane highways,” Transportation Research Record, No. 1658.
10. J. Bared, et al., 1999. “Safety evaluation of acceleration and
deceleration lane lengths,” ITE Journal, May, pp. 50-54.
11. F. Council and J. Stewart, 1999. “Safety effects of the conversion of rural two-lane to four-lane roadways based on cross-sectional models,” Transportation Research Record, Vol. 1665.

Surrogate Safety Measures From Traffic Simulation Models FHWA-RD-03-050
Page 112
12. D. Harwood, et al., 2000. Prediction of the expected safety
performance of rural two-lane highways, Report No. FHWA-RD-99-207. Federal Highway Administration, Washington, DC.
13. N. Garber and S. Subramanyan, 2001. “A procedure for
incorporating crash risk in selecting congestion mitigation strategies: A case study: Hampton Roads area,” Paper presentation at 80th Annual Meeting of the Transportation Research Board, Washington, D.C.
14. D. Malahel, 1986. A note on accident risk, Vol. 13.
Transportation Research Institute, Israel Institute of Technology.
15. C. Zegeer, 1986. “Methods for identifying hazardous highway elements,” NCHRP Synthesis 128, Transportation Research Board, Washington, DC.
16. E. Hauer, 1996. “Identification of sites with promise,”
Transportation Research Record, Vol. 1542.
17. J. Higle and M. Hecht, 1989. “A comparison of techniques for the identification of hazardous locations,” Transportation Research Record, Vol. 1238.
18. J. Higle and J. Witkowski, 1988. “Bayesian identification of
hazardous locations,” Transportation Research Record, Vol. 1185.
19. M. Lau and A. May, 1988. Accident prediction model development: Signalized intersections, Final Report, Report No. UCB-ITS-RR-88-7. University of California at Berkeley.
20. A. Mensah and E. Hauer, 1998. “Two problems of averaging
arising in the estimation of the relationship between accidents and traffic flow,” Transportation Research Record, Vol. 1635.
21. T. Ha, 1994. “Development of a safety-based level-of-service
criteria for isolated signalized intersections,” UMI 9419575, Ph.D. Dissertation, University of Wisconsin at Madison.

Surrogate Safety Measures From Traffic Simulation Models FHWA-RD-03-050
Page 113
22. T. Sayed, et al., 1994. “Simulation of traffic conflicts at unsignalized intersections,” Accident Analysis and Prevention, Vol. 26, No. 5.
23. A. Kaub, 2000. “Highway corridor safety levels of service based
on annual risk of injury,” 79th Transportation Research Board Annual Meeting, Washington, DC.
24. W. Glauz and D. Migletz, 1980. Application of traffic conflict
analysis at intersections, NCHRP Report 219, Transportation Research Board, Washington, DC.
25. D. Perkins and J. Harris, 1967. Criteria for traffic conflict
characteristics, Report GMF 632, General Motors Corp., Warren, MI.
26. M. Parker and C. Zegeer, 1988. Traffic conflict technique for safety and operations—Engineers guide, Report No. FHWA-IP-026, FHWA, Washington, DC.
27. FHWA, 1990. Traffic conflict techniques for safety and
operations—Course Materials, NHI Course 38059. U.S. Department of Transportation, Washington, DC.
28. F. Amundsen and C. Hyden, 1977. Proceedings of first workshop
on traffic conflicts, Oslo, Institute of Transport Economics.
29. B. Allen, et al., 1978. “Analysis of traffic conflicts and collisions,” Transportation Research Record, No. 667.
30. D. Migletz, et al., 1985. Relationships between traffic conflicts
and accidents, Report No. FHWA-RD-84-042, Federal Highway Administration, Washington, DC.
31. C. Hyden, 1987. The development of a method for traffic safety
evaluation: The Swedish conflicts technique, Department of Traffic Planning and Engineering, Lund University, Sweden.
32. J. Fazio and N. Rouphail, 1990. “Conflict simulation in INTRAS:
Application to weaving area capacity analysis,” Transportation Research Record, Vol. 1287.

Surrogate Safety Measures From Traffic Simulation Models FHWA-RD-03-050
Page 114
33. T. Sayed and S. Zein, 1999. “Traffic conflict standards for intersections,” Transportation Planning and Technology, Vol. 22.
34. K. Fitzpatrick, 1991. “Gaps accepted at stop-controlled
intersections,” Transportation Research Record, Vol. 1301.
35. F. Gharaybeh, 1991. “Identification of accident-prone locations in greater Amman,” Transportation Research Record, Vol. 1318.
36. N. Salman and K. Al-Maita, 1995. “Safety evaluation at three-
leg, unsignalized intersections by traffic conflict technique,” Transportation Research Record, Vol. 1485.
37. N. Katamine and I. Hamarneh, 1998. “Use of the traffic conflict
technique to identify hazardous intersections,” Road and Transport Research, Vol. 7, No. 3.
38. R. Risser, 1985. “Behavior in traffic conflict situations,” Accident
Analysis and Prevention, Vol. 17:2, pp. 179-197.
39. J. Archer, 2000. “Developing the potential of microsimulation modeling for traffic safety assessment,” Proceedings of 13th Annual International Cooperation on Theories and Concepts on Traffic Safety Workshop. Corfu, Greece.
40. J. Hayward, 1972. Near-miss determination through use of a
scale of danger, Report TTSC-7115. University Park, The Pennsylvania State University.
41. H. Kruysse, 1991. “The subjective evaluation of traffic conflicts
based on an internal concept of dangerousness,” Accident Analysis and Prevention, Vol. 23, No. 1.
42. G. Tiwari, et al., 1995. “Conflict analysis for prediction of fatal
crash locations in mixed traffic streams,” Proceedings of the 29th Annual Association for the Advancement of Automotive Medicine, Oct 17-18. Chicago, IL.
43. D. Cooper and N. Ferguson, 1976. “A conflict simulation model,”
Traffic Engineering and Control, Vol. 17, pp. 306-309.

Surrogate Safety Measures From Traffic Simulation Models FHWA-RD-03-050
Page 115
44. J. Darzentas, et al., 1980. “Minimum acceptance gaps and conflict involvement in a single crossing maneuver,” Traffic Engineering and Control, Vol. 21, pp. 58-62.
45. M. Ghaffari, 1990. “A stochastic computer simulation of traffic
conflicts,” Ph.D. Dissertation. University of Illinois at Chicago.
46. D. Perkins and B. Bowman, 1986. “Effectiveness evaluation by using non-accident measures of effectiveness,” Transportation Research Record, Vol. 905.
47. H. Thompson and D. Perkins, 1983. “Surrogate measures for
accident experience at rural isolated horizontal curves,” Paper presented at the Annual Meeting of the Transportation Research Board, Washington, DC.
48. K. Fitzpatrick, et al., 2000. Accident mitigation guide for
congested rural two-lane highways, NCHRP Report 440. National Academy Press, Washington, DC.
49. M. Minderhoud and P. Bovy, 2001. “Extended time to collision
measures for road traffic safety assessment,” Accident Analysis and Prevention, Vol. 33, pp. 89-97.
50. J. Darzentas, et al., 1980. “Simulation of road traffic conflicts at
T-junctions,” Simulation, May, pp. 155-164.
51. V. Hernandez, 1982. “A microscopic digital computer simulation of traffic conflicts at four-way fixed-time signalized urban intersections,” Ph.D. Dissertation, University of California at Los Angeles.
52. B. Persaud and K. Mucsi, 1995. “Microscopic accident potential
models for two-lane rural roads,” Transportation Research Record. No. 1485, pp. 134-139.
53. P. Huang and P. Pant, 1996. “Simulation neural-network model
for evaluating dilemma zone problems at high-speed signalized intersections,” Transportation Research Record, Vol. 1456.

Surrogate Safety Measures From Traffic Simulation Models FHWA-RD-03-050
Page 116
54. V. Rao and V. Regaraju, 1998. “Modeling conflicts of heterogeneous traffic at urban uncontrolled intersections,” Journal of Transportation Engineering, Jan./Feb.
55. A. Mehmood, et al., 2001. “Simulation of road crashes using
systems dynamics,” Paper presented at the 80th Annual Meeting of the Transportation Research Board, Washington, DC.
56. T. Rioux and Lee, 1977. Texas—A microscopic traffic simulation
package for isolated intersections, Center for Highway Research, University of Texas at Austin.
57. J. Fazio, et al., 1995. “Use of freeway conflict rates as an
alternative to crash rates in weaving section safety analyses,” Transportation Research Record, Vol. 1401.
58. I. Kosonen, 1999. “HUTSIM—Urban traffic simulation and control
model: Principles and applications,” Ph.D. Dissertation, Transportation Engineering, Helsinki University of Technology.
59. I. Kosonen and S. Ree, 2000. “The potential for microscopic
simulation in traffic safety and conflict studies,” Proceedings of Conference on Road Safety on Three Continents, Pretoria, South Africa.
60. Alumnus Software, 1993. Document on the micro-node logic as
implemented in the FORTRAN code of CORSIM (TSIS, Version 4.01 Beta), Internal Technical Report, Federal Highway Administration, McLean, VA.
61. S. Lin, 1998. CORSIM micro-node logic, Technical Report,
Federal Highway Administration, McLean, VA.
62. T. Rioux, 2002. “Comments on SSAM literature and models review version 1.0,” personal e-mail communication.
63. A. Torday and A. Dumont, 2002. Safety indicator for
microsimulation-based assessments, Swiss Federal Institute of Technology, Laboratory of Traffic Facilities, LAVOC-EPFL, Lausanne, Switzerland.

Surrogate Safety Measures From Traffic Simulation Models FHWA-RD-03-050
Page 117
64. A. Avgoustis, 1999. “Quantifying the safety impacts of intelligent transportation systems,” M.S. Thesis, Civil Engineering, Virginia Tech, Blacksburg, VA.
65. S. Algers, et al., 1997. Review of microsimulation models,
SMARTEST Project Deliverable D3, Institute for Transport Studies, University of Leeds, Leeds, U.K. (http://www.its.leeds.ac.uk/projects/smartest/deliv3.html#a2).
66. I. Kosonen, et al., 2001. “A short HUTSIM description,” web
document.
67. M. Kokkinen, 1996. HUTSIM 4.2: Quick reference guide. Traficon, Ltd., Helsinki, Finland.
68. J. Barcelo, 2001. Microscopic traffic simulation: A tool for the
analysis and assessment of ITS systems, Transport Simulation Systems Internal Report (www.tss-bcn.com).
69. J. Barcelo, et al., 1998. AIMSUN modeling issues, Transport
Simulation Systems Internal Report (www.tss-bcn.com).
70. J. Barcelo, et al., 1998. Microscopic traffic simulation for ATT systems analysis—A parallel computing version, Transport Simulation Systems Internal Report (www.tss-bcn.com).
71. Transport Simulation Systems, 2002. AIMSUN 4.0 User Manual,
(www.tss-bcn.com).
72. KLD and Associates, 2002. WATSIM features, Internal Report (www.kldassociates.com/faq).
73. C. Lee, et al., 1993. Texas model for intersection traffic version
3.0 documentation—Updated for version 3.20, Center for Transportation Research, University of Texas at Austin.
74. PTV AG, 2001. VISSIM user manual, version 3.6, Demo CD,
Karlsruhe, Germany.
75. Quadstone Ltd., 2002. Paramics Developer Suite, Internal Report (www.paramics-online.com/techsupport/docum.htm).

Surrogate Safety Measures From Traffic Simulation Models FHWA-RD-03-050
Page 118
76. Quadstone Ltd., 2002. Paramics Modeler Reference V3, Internal
Report (www.paramics-online.com/techsupport/docum.htm).
77. Quadstone Ltd., 2002, Paramics System Overview V3, Internal Report (www.paramics-online.com/techsupport/docum.htm).
78. M. Van Aerde, et al., 1998. Integration: Overview of simulation
features, Internal Report, Department of Civil Engineering, Queen’s University, Kingston, Canada.
79. FHWA, 2002. TSIS Help files, Version 5.0. Software help
system.
80. Trafficware, 2001. Simtraffic 5.0 Help files. Demo Software help system. www.trafficware.com.
81. H. Rakha and B. Crowther, 2002. “A comparison of the
Greenshields, Pipes, and Van Aerde car-following and traffic-stream models,” presented at the 81st Annual Meeting of the Transportation Research Board, Washington, DC.
82. E. Pasanen, 1994. “Traffic simulation in pedestrian safety
research,” Proceedings of the 7th Annual ICTCT Workshop, Prague, Czech Republic (www.ictct.org).
83. A. Svensson, 1998. “A method for analyzing the traffic process in
a safety perspective,” Proceedings of the 11th Annual ICTCT Workshop, Budapest, Hungary (www.ictct.org).
84. Hogema and W. Janssen, 1996. Effects of intelligent cruise
control on driving behavior, Report No. TM-1996-C-12. TNO Human Factors, Soesterberg, The Netherlands.
85. Van Der Horst, 1990. “A time-based analysis of road user behavior in normal and critical A. encounters,” Ph.D. Dissertation, Delft University of Technology, The Netherlands.