survey - california
TRANSCRIPT
California Water Boards
Item #2Board Meeting
January 19, 2021
COVID-19 Drinking Water Survey

California Water Boards
Board Actions
• Executive Order N-42-20: April 2020• Implementation of EO N-42-20: Guidelines and Best Practices for Water and
Wastewater Systems (April 30, 2020)• Shut Off/Repayment Website and Hotline
• File a report: COVID-19 Water Shutoff - State of California• Call hotline (language translation available): 844-903-2800
• Initial system impact survey: June 2020• Joint workshop with California Public Utilities Commission: October
2020• System and household impact survey: November 2020
2

California Water Boards
Shut Off/Repayment ReportsSlide 3
• 220 COVID-19 Reports Received since portal launch• December 2020
• 98 Reports Received • January 2021
• 26 Reports Received as of 1/12/21 • Staff follow up with water system for each report

California Water Boards
4
• Why did we administer the survey?• To understand financial impacts to drinking water systems• To understand household water bill debt• To inform the development of assistance options
Survey Background & Objectives
Small/Medium Water Systems Large Water Systems
450 systems received an email on 11/9
150 systems received an email with the survey on 11/9
Division of Drinking Water staff collected survey responses via phone calls
Workshop for large systems held 11/18

California Water Boards
Survey Questions5
Small/Medium System Questions Large System QuestionsSystem finances(Revenues, expenses, cash reserves, months before assistance needed)
Household debt(Delinquent accounts, debt levels, total water bill debt, drinking water debt, debt per billing cycle, debt levels per zip code)
Household debt distribution(Number of accounts with debt, total amount of debt, debt amount per zip code)
Fees and repayment options(Late fees charged, number of accounts on repayment plans)

California Water Boards
Survey Response
6
Large (>10,000 connections) systems
Number of large water systems 223
Number of large system survey responses 131 (151 systems)
Total population served by large systems 32.4 million
Large system sample population 24.2 million
Percent of large system population covered by survey responses 75%
Small/medium (<10,000 connections) systems
Number of small/medium water systems 2661
Number of small/medium system survey responses 406 (428 systems)
Total population served by small/medium systems 7.1 million
Small/medium system sample population 4.0 million
Percent of small/medium population covered by survey responses 56%

California Water Boards
Survey Design: Binning Small/Medium Systems

California Water Boards
Survey Completeness
(0 – 1009) (1010 – 3090) (3091 – 5868) (5869 – 10,000)Service Connection Breaks:
Survey Bins

California Water Boards
System Financial Vulnerability: Small/Medium Systems
9

California Water Boards
Vulnerable Systems: Months before financial assistance required
10
Months before assistance needed
Survey sample Survey % Statewide estimate
Statewide %
No assistance needed 249 60% 1474 62%
>12 months 79 19% 353 15%
9-12 months 14 3% 54 2%
6-9 months 11 3% 45 2%
3-6 months 18 4% 77 3%
0-3 months 12 3% 57 2%
Self-reported estimate of months before financial assistance required. "High-risk" indicators are denoted in red.
California Water Boards
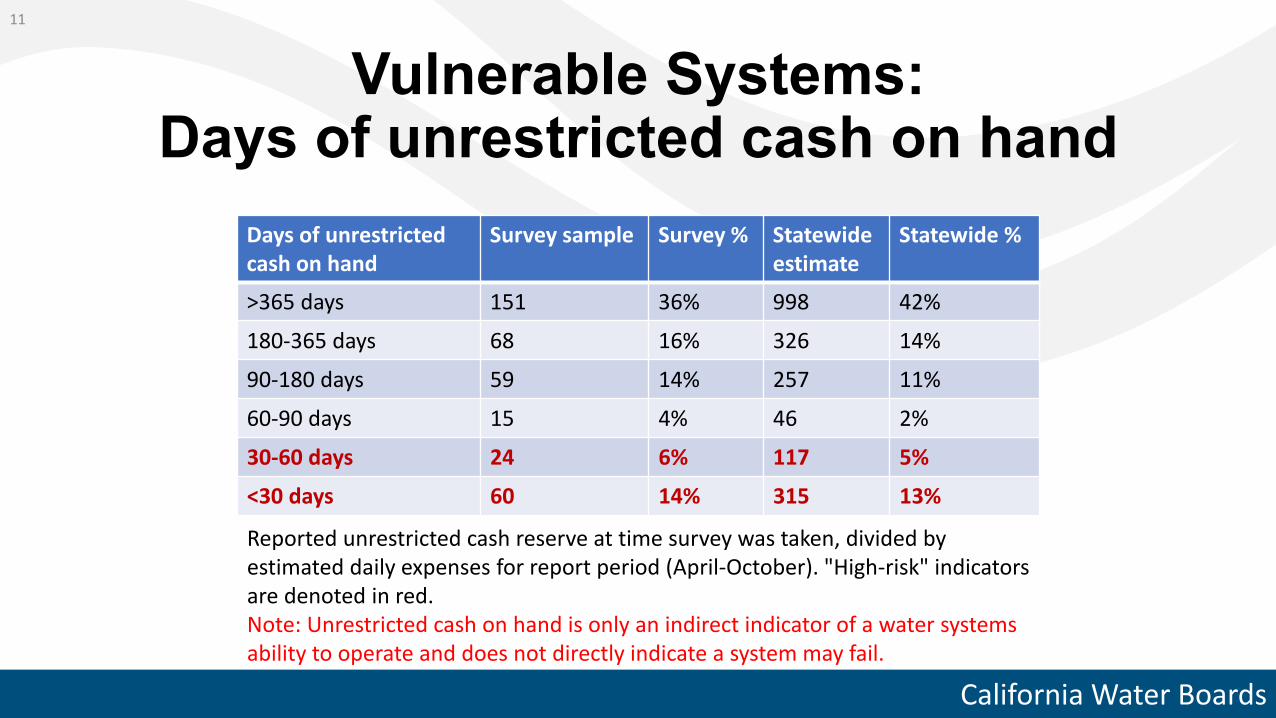
Vulnerable Systems: Days of unrestricted cash on hand
11
Days of unrestricted cash on hand
Survey sample Survey % Statewide estimate
Statewide %
>365 days 151 36% 998 42%
180-365 days 68 16% 326 14%
90-180 days 59 14% 257 11%
60-90 days 15 4% 46 2%
30-60 days 24 6% 117 5%
<30 days 60 14% 315 13%
Reported unrestricted cash reserve at time survey was taken, divided by estimated daily expenses for report period (April-October). "High-risk" indicators are denoted in red. Note: Unrestricted cash on hand is only an indirect indicator of a water systems ability to operate and does not directly indicate a system may fail.

California Water Boards
Vulnerable Systems: Revenue to expense ratio
12
Revenue to expense ratio
Survey sample Survey % Statewide estimate
Statewide %
>2 68 16% 414 17%
1.5-2 49 12% 250 10%
1.2-1.5 74 18% 358 15%
0.95-1.2 87 21% 395 17%
0.5-0.95 69 17% 403 17%
<0.5 30 7% 240 10%
Total reported revenue for the April-October reporting period, divided by total reported expenses for April-October. "High-risk" indicators are denoted in red.

California Water Boards
Vulnerability Scores and Statewide Estimates
13
Vulnerability Survey sample Survey % Statewide estimate
Statewide %
Low 218 52% 1172 49%
Medium 116 28% 592 25%
High 38 9% 270 11%
Extreme 5 1% 25 1%
Vulnerability scores were determined by the count of “high-risk” indicators per system (marked in red in the previous tables). • Systems with 0 out of 3 high-risk indicators have low financial vulnerability.• Systems with 1 out of 3 high-risk indicators have medium financial vulnerability• Systems with 2 out of 3 high-risk indicators have high financial vulnerability• Systems with 3 out of 3 high-risk indicators have extreme financial vulnerabilityNote: These scores are estimates only and should be used only as possibleindicators and do not indicate directly that systems are of have failed.

California Water Boards
Comments from Small/Medium Systems• Delays of capital improvement projects
• Planned new rate increases to recuperate lost revenue
• Postpone rate increases
• Increased costs due to COVID-19• Personal protective equipment and sanitation• Increased employee absences (social distancing or quarantine)• Equipment for staff to work remotely
14

California Water Boards
Household Debt Results
15

California Water Boards
Total Statewide Household Debt:March – October 2020
16
Data System size Survey Total Statewide Estimate
Total Debt ($USD)
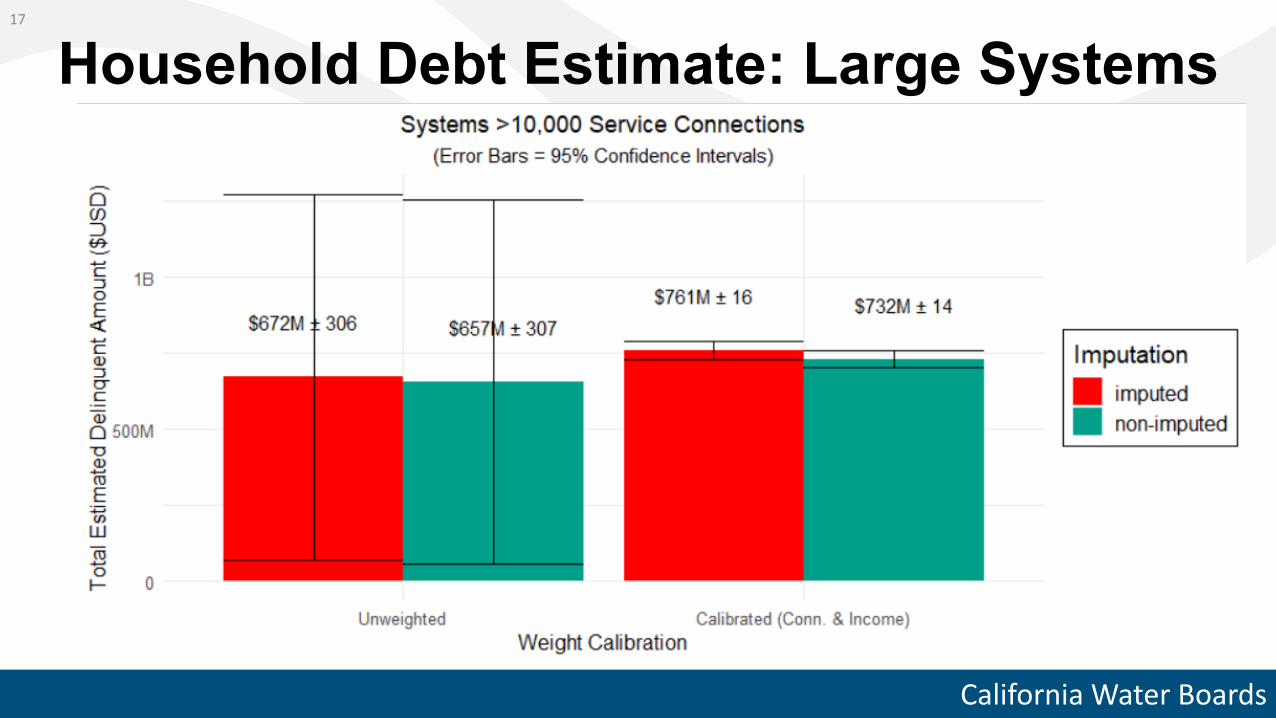
Large $671.8 million $731.7 million +/- $1.4 million
Small/Medium $33.0 million $57.6 million +/- $2.5 million
Total $704.8 million $789.3 million +/- $3.9 million
Number of delinquent accounts
with >$1000 debt
Small/Medium 11,222
Large 143,872 170,000 +/- 17,900
Total 155,094
California Water Boards
Household Debt Estimate: Large Systems17
California Water Boards
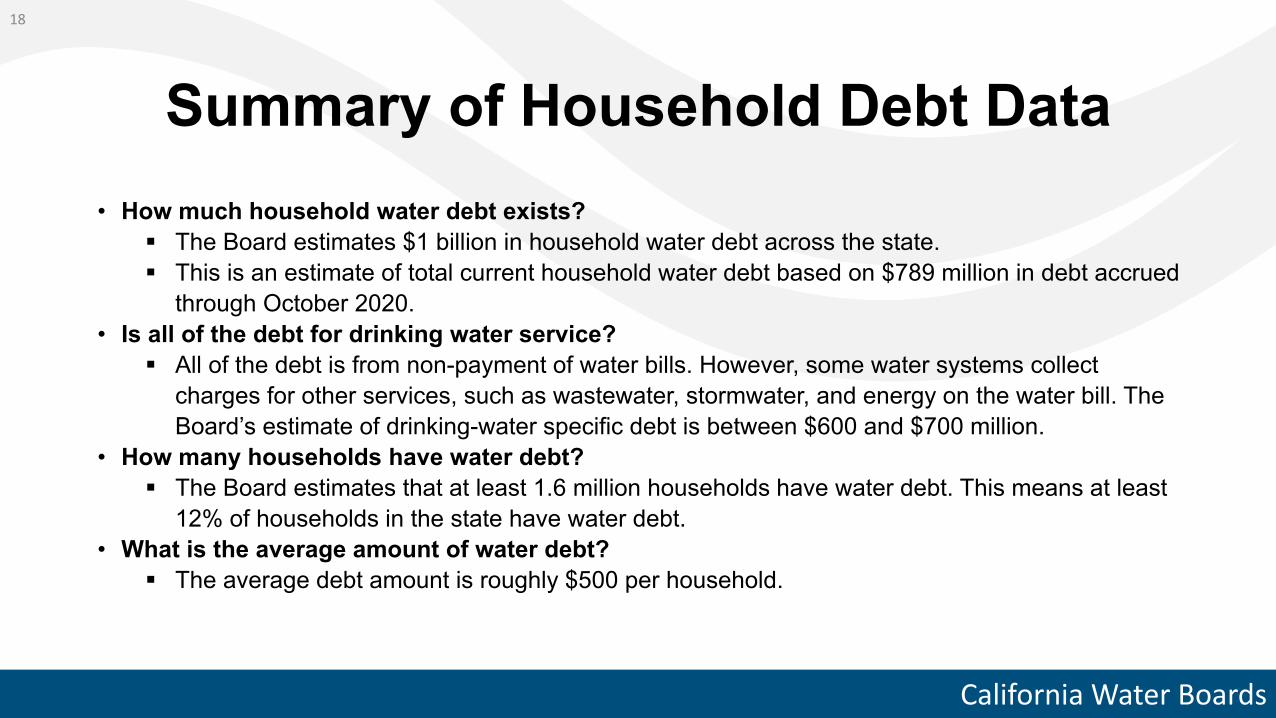
Summary of Household Debt Data• How much household water debt exists?
The Board estimates $1 billion in household water debt across the state. This is an estimate of total current household water debt based on $789 million in debt accrued
through October 2020.• Is all of the debt for drinking water service?
All of the debt is from non-payment of water bills. However, some water systems collect charges for other services, such as wastewater, stormwater, and energy on the water bill. The Board’s estimate of drinking-water specific debt is between $600 and $700 million.
• How many households have water debt? The Board estimates that at least 1.6 million households have water debt. This means at least
12% of households in the state have water debt.• What is the average amount of water debt?
The average debt amount is roughly $500 per household.
18

California Water Boards
19
0
50000
100000
150000
200000
250000
300000
350000
400000
Less than $100 $100 - $200 $200 - $300 $300 - $400 $400 - $500 $500 - $600 $600 - $700 $700 - $800 $800 - $900 $900 - $1000 Over $1000
Num
ber o
f Del
inqu
ent A
ccou
nts
Debt "Buckets"
Distribution of Delinquent Accounts
California Water Boards
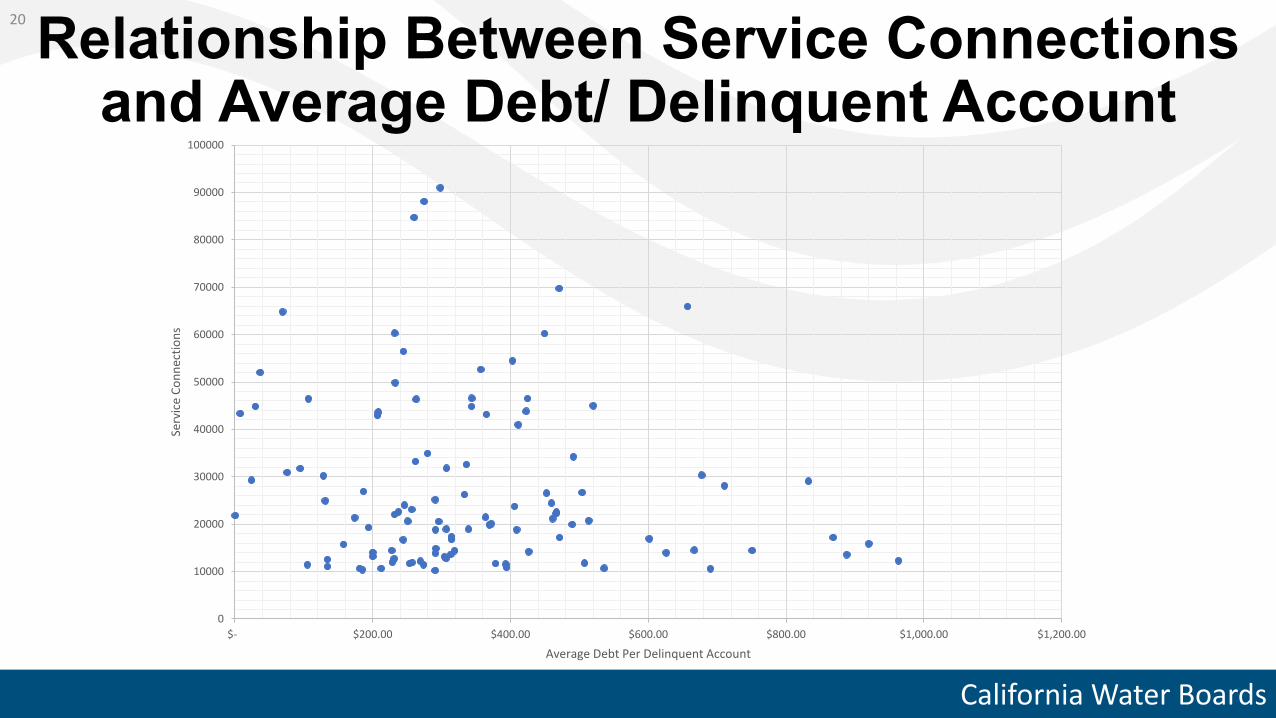
20
0
10000
20000
30000
40000
50000
60000
70000
80000
90000
100000
$- $200.00 $400.00 $600.00 $800.00 $1,000.00 $1,200.00
Serv
ice
Conn
ectio
ns
Average Debt Per Delinquent Account
Relationship Between Service Connections and Average Debt/ Delinquent Account

California Water Boards
Zip Code Analysis
21

California Water Boards
Debt ConcentrationZip codes with highest overallnumbers of delinquent accounts are concentrated in Los Angeles area, with other high numbers in Colton, Orcutt, and Rancho Cordova
22
Los Angeles
Orcutt
Colton
Rancho Cordova

California Water Boards
Debt Concentration
Zip codes with highest overall numbers of >$1,000 debt accounts are all located in the Los Angeles area
23

California Water Boards
Delinquency totals by zip code24
Zip Code TOTAL number of delinquent accounts
90001 14,902
90011 14,630
93455 13,942
90044 13,793
90003 13,669
92324 13,204
95670 12,807
90201 12,509
90650 11,645
90630 11,402
Zip Code Number of accounts with >$1000 debt
90011 3,502
90003 3,437
90044 3,165
91331 2,803
91342 2,672
91335 2,600
91304 2,509
91343 2,320
91402 2,236
90047 2,200
Zip codes 90003, 90004, and 90011 are in the top 10 zip codes for both total number of delinquent accounts and accounts with >$1,000 debt

California Water Boards
Debt ConcentrationZip codes with highest per capita number of delinquent accounts consisted of a mix of high- and low-population zip codesNorthern California: Clearlake, Port CostaSouthern California: Orcutt, Los Angeles, San Bernardino County
25
Orcutt
NorCal
Los Angeles
San Bernardino County

California Water Boards
Debt Concentration
Zip codes with highest per capita numbers of >$1,000 debt accounts are located in Los Angeles, San Bernardino County, and Kern County
26
Los Angeles San Bernardino County
Kern County

California Water Boards
Per Capita delinquency by zip code27
Zip Code Number of Delinquent Accounts
Total Population
94569 81 205
92397 1,775 4,571
95422 5,584 15,550
93455 13,942 45,116
92311 9,953 33,612
90028 8,352 30,734
90232 3,724 14,660
90001 14,902 58,975
90008 7,758 31,739
92378 63 263
Zip Code Number of accounts with >$1000 debt
Total Population
92341 28 203
93558 4 40
91307 1,416 26,595
91436 785 15,070
90003 3,437 72,741
91304 2,509 53,761
90047 2,200 48,883
91311 1,812 40,420
93528 6 138
91042 1,137 26,631
Zip codes 90001, 90003, 91304, and 93455 also had high numbers for total/$1,000 debt accounts
California Water Boards
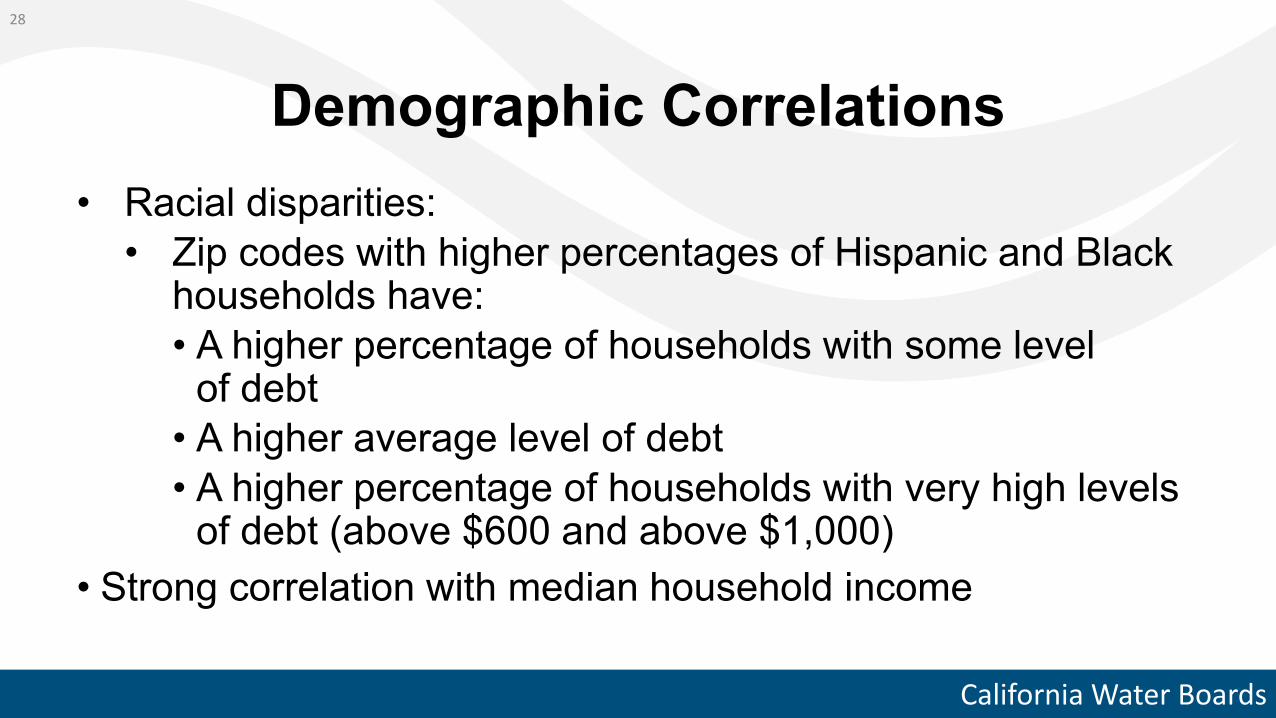
Demographic Correlations• Racial disparities:
• Zip codes with higher percentages of Hispanic and Black households have:• A higher percentage of households with some level
of debt• A higher average level of debt• A higher percentage of households with very high levels
of debt (above $600 and above $1,000)• Strong correlation with median household income
28

California Water Boards
Zip Code Debt per Delinquent Household: Predominantly Non-White Zip Codes
29
Non-Hispanic White
Hispanic Black Asian
Total Debt per Delinquent Household
$380.86 $377.76 $485.52 $249.27
Disadvantaged Community Debt per Delinquent Household
$292.12 $386.57 $496.99 $234.75

California Water Boards
Data Limitations
• Billing software limitations that resulted in incomplete survey responses
• 79 systems• Do not keep historic data• Difficulty sorting accounts by customer class• Difficulty with zip code extraction
• Some systems were unable to isolate drinking water portion of total debt
30
California Water Boards
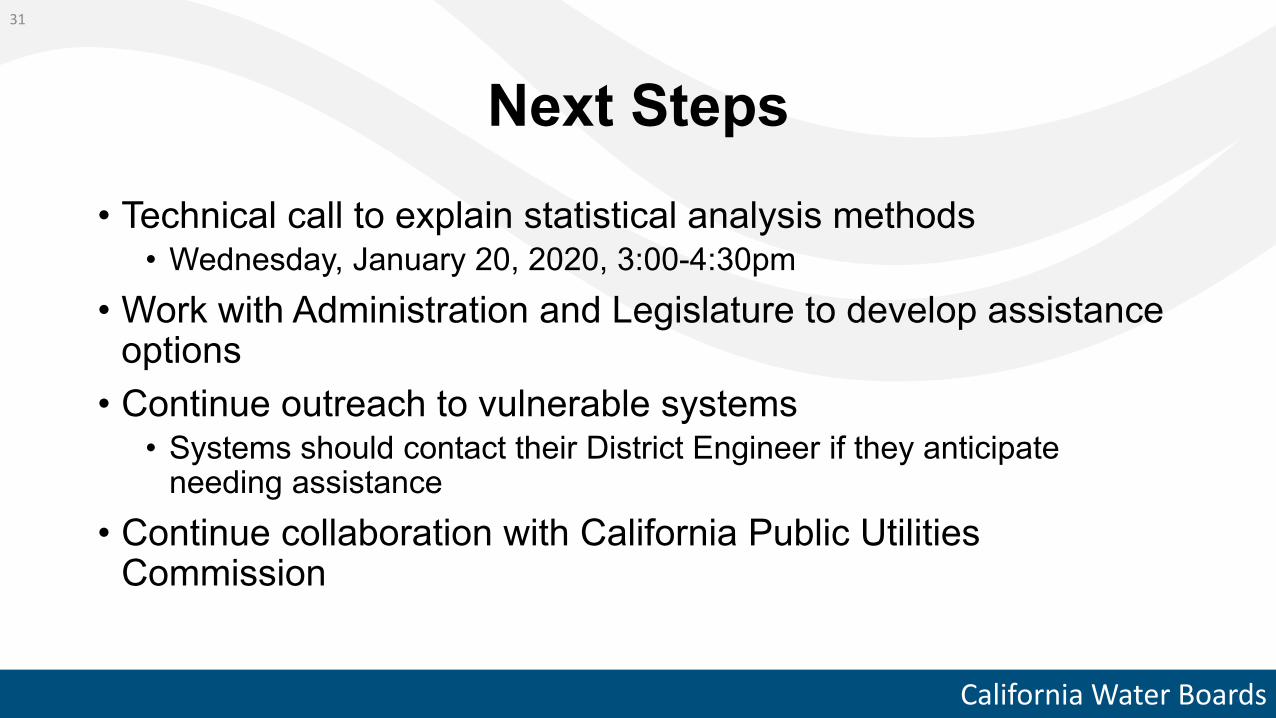
Next Steps• Technical call to explain statistical analysis methods
• Wednesday, January 20, 2020, 3:00-4:30pm• Work with Administration and Legislature to develop assistance
options• Continue outreach to vulnerable systems
• Systems should contact their District Engineer if they anticipate needing assistance
• Continue collaboration with California Public Utilities Commission
31