survey data regarding perceived air quality in australia
TRANSCRIPT
Data in Brief 32 (2020) 106169
Contents lists available at ScienceDirect
Data in Brief
journal homepage: www.elsevier.com/locate/dib
Data Article
Survey data regarding perceived air quality in
Australia, Brazil, China, Ghana, India, Iran,
Italy, Norway, South Africa, United States
before and during Covid-19 restrictions
✩ , ✩✩
Diego Maria Barbieri a , ∗, Baowen Lou
b , Marco Passavanti c , Cang Hui d , Daniela Antunes Lessa
e , Brij Maharaj f , Arunabha Banerjee
g , Fusong Wang
h , Kevin Chang
i , Bhaven Naik
j , Lei Yu
k , Zhuangzhuang Liu
l , Gaurav Sikka
m , Andrew Tucker n , Ali Foroutan Mirhosseini o , Sahra Naseri p , Yaning Qiao
q , Akshay Gupta
r , Montasir Abbas s , Kevin Fang
t , Navid Ghasemi u , Prince Peprah
v , Shubham Goswami w , Amir Hessami x , Nithin Agarwal y , Louisa Lam
z , Solomon Adomako
$
a Norwegian University of Science and Technology, Department of Civil and Environmental Engineering.
Høgskoleringen 7A, Trondheim, 7491, Trøndelag, Norway b Chang’an University, School of Highway, Nan Er Huan Road (Mid-section), Xi’an, 710064, Shaanxi, China c Italian Society of Cognitive Behavioural Therapy (CBT-Italy), Guastalla St. 2, Carpi 4012, Emilia-Romagna, Italy d Centre for Invasion Biology, Department of Mathematical Sciences, Stellenbosch University, Matieland, 7602, South
Africa. e Federal University of Ouro Preto, Department of Civil Engineering. Rua Nove, Bauxita, Ouro Preto, 3540 0-0 0 0,
Minas Gerais, Brazil f University of KwaZulu-Natal, Department of Geography. Howard College City, Durban, 40 0 0, KwaZulu, South Africa g Indian Institute of Technology Guwahati, Department of Civil Engineering. IIT Guwahati, Guwahati, 781039,
Assam, India h State Key Laboratory of Silicate Materials for Architectures, Wuhan University of Technology. Luoshi road 122,
Wuhan, 430070, Hubei, China i University of Idaho, Department of Civil and Environmental Engineering. 875 Perimeter Drive, Mailstop 1022,
Moscow, 83844, Idaho, United States j Ohio University, Department of Civil Engineering/Russ College of Engineering & Technology. 28 W. Green Drive,
Athens, 45701, Ohio, United States k Sun Yat-sen University, School of Civil Engineering. Xingang Xi Road 135, Guangzhou, 510275, Guangdong, China l Chang’an University, School of Highway. Nan Er Huan Road (Mid-section), Xi’an, 710064, Shaanxi, China m Lalit Narayan Mithila University, Department of Geography. Darbhanga, 846004, Bihar, India n University of Connecticut, Connecticut Transportation Safety Research Center. 270 Middle Turnpike, Unit 5202
Longley Building, Storrs, 06269, Connecticut, United States o Norwegian University of Science and Technology, Department of Civil and Environmental Engineering.
Høgskoleringen 7A, Trondheim, 7491, Trøndelag, Norway p Bam University of Medical Sciences, School of Medicine. Bam, 76615-336, Kerman, Iran
https://doi.org/10.1016/j.dib.2020.106169
2352-3409/© 2020 The Author(s). Published by Elsevier Inc. This is an open access article under the CC BY license.
( http://creativecommons.org/licenses/by/4.0/ )

2 D.M. Barbieri, B. Lou and M. Passavanti et al. / Data in Brief 32 (2020) 106169
q China University of Mining and Technology, School of Mechanics and Civil Engineering. Daxue Road 1, Xuzhou,
22116, Jiangsu, China r Indian Institute of Technology Roorkee, Department of Civil Engineering, Transportation Engineering Group,
321-A&B, Roorkee, 247667, Uttarakhand, India s Virginia Tech, Department of Civil and Environmental Engineering. 301-D3 Patton Hall, Blacksburg, 24061, Virginia,
United States t Sonoma State University, Department of Geography, Environment, and Planning, 1801 East Cotati Avenue, Rohnert
Park, 94928, California, United States u University of Bologna, Department of Civil Chemical Environmental and Materials Engineering. Viale del
Risorgimento, 2, Bologna, 40136, Emilia-Romagna, Italy v University of New South Wales, Department of Social Policy Research Centre, John Goodsell Building, Kensington,
Sydney, 2052, New South Wales, Australia w Indian Institute of Science Bangalore, Department of Civil Engineering, C V Raman Avenue, Bangalore, 560012,
Karnataka, India x Texas A&M University – Kingsville, Department of Civil and Architectural Engineering, 917 W. Ave B, Kingsville,
78363, Texas, United States y University of Florida, Department of Civil & Coastal Engineering, 2100 NE Waldo Rd., Sta 106, Gainesville, 32609,
Florida, United States z Federation University Australia, School of Nursing and Healthcare Professions, 72-100 Clyde Rd, Berwick, 3806,
Victoria, Australia $ University of Agder, Department of Engineering and Science, Jon Lilletuns vei 9, Grimstad, 4879, Agder, Norway
a r t i c l e i n f o
Article history:
Received 14 July 2020
Accepted 6 August 2020
Available online 13 August 2020
Keywords:
Survey data
COVID-19
Environmental pollution
Air quality
Psychometric perception
a b s t r a c t
The dataset deals with the air quality perceived by citizens
before and during the enforcement of COVID-19 restrictions
in ten countries around the world: Australia, Brazil, China,
Ghana, India, Iran, Italy, Norway, South Africa and the United
States. An online survey conveniently translated into Chinese,
English, Italian, Norwegian, Persian, Portuguese collected in-
formation regarding the perceived quality of air pollution ac-
cording to a Likert scale. The questionnaire was distributed
between 11-05-2020 and 31-05-2020 and 9 394 respondents
took part. Both the survey and the dataset (stored in a Mi-
crosoft Excel Worksheet) are available in a public repository.
The collected data offer the people’s subjective perspectives
related to the objective improvement in air quality occurred
during the COVID-19 restrictions. Furthermore, the dataset
can be used for research studies involving the reduction in
air pollution as experienced, to a different extent, by popula-
tions of all the ten countries.
© 2020 The Author(s). Published by Elsevier Inc.
This is an open access article under the CC BY license.
( http://creativecommons.org/licenses/by/4.0/ )
✩ Declarations of interest: none ✩✩ Initial submission date: 14/07/2020
∗ Corresponding author.
E-mail addresses: [email protected] (D.M. Barbieri), [email protected] (B. Lou),
[email protected] (M. Passavanti), [email protected] (C. Hui), [email protected] (D.A. Lessa),
[email protected] (B. Maharaj), [email protected] (F. Wang), [email protected] (K. Chang), [email protected]
(B. Naik), [email protected] (L. Yu), [email protected] (Z. Liu), [email protected] (A. Tucker),
[email protected] (A.F. Mirhosseini), [email protected] (Y. Qiao), [email protected] (A. Gupta),
[email protected] (M. Abbas), [email protected] (K. Fang), [email protected] (N. Ghasemi), [email protected] (S.
Goswami), [email protected] (A. Hessami), [email protected] (N. Agarwal), [email protected] (L. Lam),
[email protected] (S. Adomako).

D.M. Barbieri, B. Lou and M. Passavanti et al. / Data in Brief 32 (2020) 106169 3
Specification table
Subject Social Sciences
Specific subject area Health psychology, Perceived air pollution
Type of data Primary data, Table
How data were acquired The data were collected by an online survey hosted on two platforms:
Google Forms (English, Italian, Norwegian, Persian, Portuguese
versions) and WenJuanXing (Chinese version). An English copy is
available in the data repository. The survey was distributed by means
of professional and social networks
Data format Raw Analyzed
Parameters for data collection The survey data were obtained from 9 394 respondents older than 18
years old having internet access
Description of data collection The online survey was distributed using a combination of purposive
and snowball techniques
Data source location Countries: Australia, Brazil, China, Ghana, India, Iran, Italy, Norway,
South Africa and the United States
Data accessibility Dataset is uploaded on Mendeley Data
Repository name:
Perceived air pollution in Australia, Brazil, China, Ghana, India, Iran,
Italy, Norway, South Africa, USA before and during COVID-19
restrictions
Data identification number:
DOI: 10.17632/fb38h4tyzn.2
Direct URL to data: https://data.mendeley.com/datasets/fb38h4tyzn/2
Value of the data
• The data are related to the perception of air quality and air pollution during the COVID-
19 restrictions as experienced by a large pool comprising 9 394 respondents located in ten
countries on six continents
• The data can be useful for researchers dealing with the environmental and tropospheric
changes occurring during the COVID-19 restrictions
• The data can be used to assess the relationship between the perceived and the quantified
change in air quality and air pollution during the COVID-19 restrictions
• The data can be of interest to both citizens and policymakers to realise the tremendous les-
son learned during COVID-19, being air quality a key indicator for sustainable development
1. Data description
The dataset provides information regarding the quantity of air pollution perceived before
and during the restrictions enforced in ten countries around the world as a consequence of the
COVID-19 pandemic: Australia, Brazil, China, Ghana, India, Iran, Italy, Norway, South Africa and
the United States (also referred to as AU, BR, CH, GH, IN, IR, IT, NO, ZA and USA, respectively).
The dataset is stored in a public repository as Microsoft Excel Worksheet [1] . The total amount
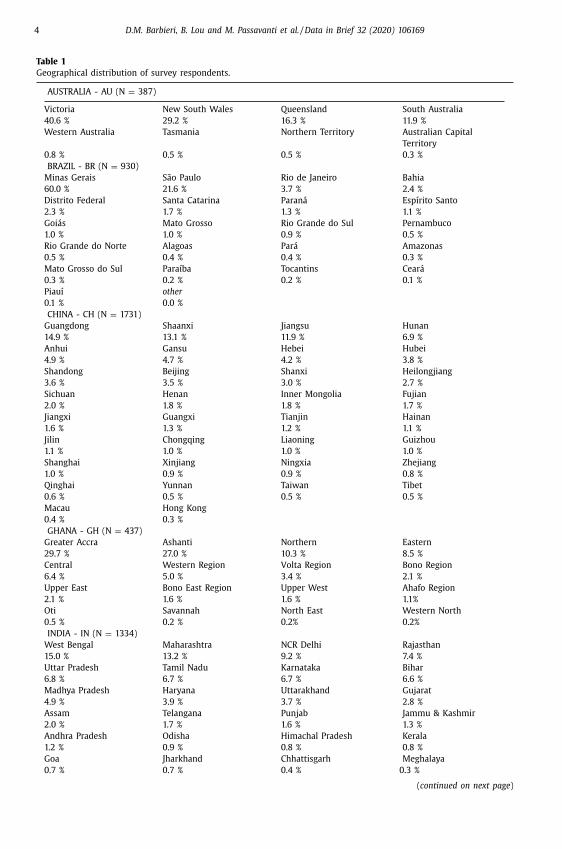
of the respondents who joined the survey is 9 394, their geographical distribution is reported
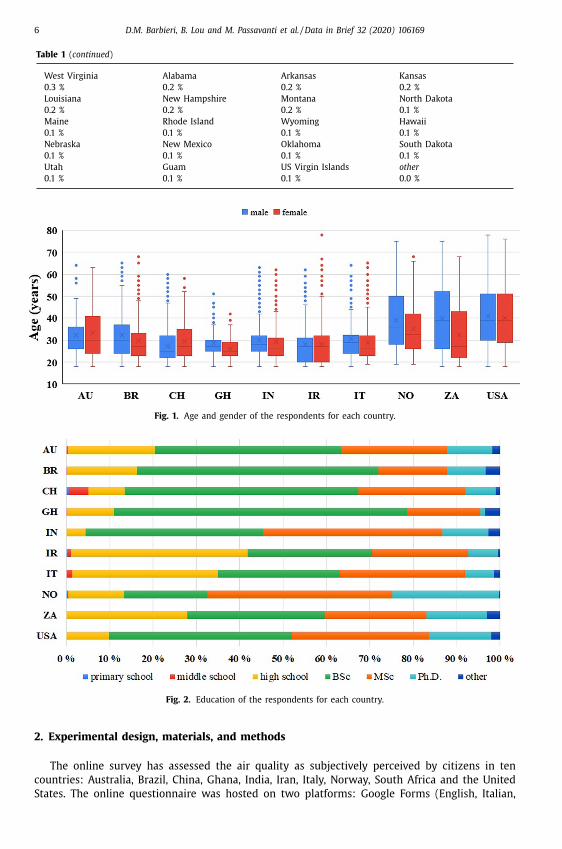
in Table 1 . Information regarding gender and age are reported in Fig. 1 with box-and-whisker
plots: overall, the largest portion of the surveyed population is composed of young and middle-
aged individuals. Furthermore, the participants have high education ( Fig. 2 ). The two questions
of the survey are “How do you regard the amount of air pollution before the epidemic?” and
“How do you regard the amount of air pollution during the restrictions?”: the respondents ex-
pressed their opinions according to a 7-point Likert scale varying from “extremely low/absent
air pollution” to “extremely high air pollution”. The responses pertaining to before and during
the applications of the COVID-19 restrictions are reported in Fig. 3 a and Fig. 3 b, respectively.
4 D.M. Barbieri, B. Lou and M. Passavanti et al. / Data in Brief 32 (2020) 106169
Table 1
Geographical distribution of survey respondents.
AUSTRALIA - AU (N = 387)
Victoria New South Wales Queensland South Australia
40.6 % 29.2 % 16.3 % 11.9 %
Western Australia Tasmania Northern Territory Australian Capital
Territory
0.8 % 0.5 % 0.5 % 0.3 %
BRAZIL - BR (N = 930)
Minas Gerais São Paulo Rio de Janeiro Bahia
60.0 % 21.6 % 3.7 % 2.4 %
Distrito Federal Santa Catarina Paraná Espírito Santo
2.3 % 1.7 % 1.3 % 1.1 %
Goiás Mato Grosso Rio Grande do Sul Pernambuco
1.0 % 1.0 % 0.9 % 0.5 %
Rio Grande do Norte Alagoas Pará Amazonas
0.5 % 0.4 % 0.4 % 0.3 %
Mato Grosso do Sul Paraíba Tocantins Ceará
0.3 % 0.2 % 0.2 % 0.1 %
Piauí other
0.1 % 0.0 %
CHINA - CH (N = 1731)
Guangdong Shaanxi Jiangsu Hunan
14.9 % 13.1 % 11.9 % 6.9 %
Anhui Gansu Hebei Hubei
4.9 % 4.7 % 4.2 % 3.8 %
Shandong Beijing Shanxi Heilongjiang
3.6 % 3.5 % 3.0 % 2.7 %
Sichuan Henan Inner Mongolia Fujian
2.0 % 1.8 % 1.8 % 1.7 %
Jiangxi Guangxi Tianjin Hainan
1.6 % 1.3 % 1.2 % 1.1 %
Jilin Chongqing Liaoning Guizhou
1.1 % 1.0 % 1.0 % 1.0 %
Shanghai Xinjiang Ningxia Zhejiang
1.0 % 0.9 % 0.9 % 0.8 %
Qinghai Yunnan Taiwan Tibet
0.6 % 0.5 % 0.5 % 0.5 %
Macau Hong Kong
0.4 % 0.3 %
GHANA - GH (N = 437)
Greater Accra Ashanti Northern Eastern
29.7 % 27.0 % 10.3 % 8.5 %
Central Western Region Volta Region Bono Region
6.4 % 5.0 % 3.4 % 2.1 %
Upper East Bono East Region Upper West Ahafo Region
2.1 % 1.6 % 1.6 % 1.1%
Oti Savannah North East Western North
0.5 % 0.2 % 0.2% 0.2%
INDIA - IN (N = 1334)
West Bengal Maharashtra NCR Delhi Rajasthan
15.0 % 13.2 % 9.2 % 7.4 %
Uttar Pradesh Tamil Nadu Karnataka Bihar
6.8 % 6.7 % 6.7 % 6.6 %
Madhya Pradesh Haryana Uttarakhand Gujarat
4.9 % 3.9 % 3.7 % 2.8 %
Assam Telangana Punjab Jammu & Kashmir
2.0 % 1.7 % 1.6 % 1.3 %
Andhra Pradesh Odisha Himachal Pradesh Kerala
1.2 % 0.9 % 0.8 % 0.8 %
Goa Jharkhand Chhattisgarh Meghalaya
0.7 % 0.7 % 0.4 % 0.3 %
( continued on next page )

D.M. Barbieri, B. Lou and M. Passavanti et al. / Data in Brief 32 (2020) 106169 5
Table 1 ( continued )
Chandigarh Ladakh Puducherry Tripura
0.1 % 0.1 % 0.1 % 0.1 %
other
0.0 %
IRAN - IR (N = 778)
Kerman Tehran Fars Razavi Khorasan
48.7 % 28.5 % 5.1 % 5.0 %
Isfahan Yazd Mazandaran East Azarbaijan
3.3 % 1.5 % 1.4 % 1.2 %
Alborz Hormozgan Hamedan West Azerbaijan
0.8 % 0.6% 0.6 % 0.5 %
Qazvin Sistan Baluchestan Kermanshah Kohg. B.-Ahmad
0.5 % 0.4 % 0.4 % 0.3%
Golestan Ilam Bushehr North Khorasan
0.3 % 0.1 % 0.1 % 0.1 %
South Khorasan Zanjan Semnan other
0.1 % 0.1 % 0.1 % 0.0 %
ITALY - IT (N = 604)
Emilia-Romagna Lombardiao Lazio Veneto
32.5 % 17.7 % 12.1 % 9.8 %
Piemonte Toscana Campania Puglia
8.8 % 3.6 % 2.5 % 2.3 %
Friuli-Venezia Giulia Sicilia Marche Calabria
2.2 % 1.7 % 1.3 % 1.2 %
Liguria Sardegna Trentino-Alto Adige Abruzzo
1.0 % 0.8 % 0.8 % 0.5 %
Molise Umbria Valle d’Aosta other
0.5 % 0.5% 0.3% 0.0 %
NORWAY - NO (N = 681)
Trøndelag Rogaland Oslo Viken
54.2 % 13.4 % 9.0% 5.9 %
Agder Innlandet Møre og Romsdal Vestland
5.4 % 5.0 % 2.8 % 1.9%
Troms og Finnmark Vestfold og Telemark other
1.6 % 0.9 % 0.0 %
SOUTH AFRICA - ZA (N = 582)
KwaZulu-Natal Gauteng Western Cape Eastern Cape
61.7 % 16.0% 10.5% 6.4 %
North West Mpumalanga Free State Limpopo
2.4 % 1.2 % 1.0% 0.9 %
other
0.0 %
UNITED STATES - USA (N = 1928)
Connecticut Ohio Texas California
13.9 % 13.6 % 12.7 % 11.3 %
Idaho Florida Virginia Washington
6.9 % 6.8 % 6.7 % 5.9 %
North Carolina Illinois Arizona New York
2.7 % 2.1 % 1.3 % 1.3 %
Colorado Oregon Pennsylvania Michigan
1.2 % 1.2 % 1.1 % 1.0 %
Massachusetts New Jersey Wisconsin Georgia
1.0 % 1.0 % 0.6 % 0.6 %
Maryland Vermont Indiana Iowa
0.5 % 0.5 % 0.4 % 0.4 %
Nevada South Carolina Minnesota Missouri
0.4 % 0.4 % 0.4 % 0.4 %
Tennessee Kentucky Washington D.C. Columbia Alaska
0.4 % 0.3 % 0.3 % 0.3 %
( continued on next page )
6 D.M. Barbieri, B. Lou and M. Passavanti et al. / Data in Brief 32 (2020) 106169
Table 1 ( continued )
West Virginia Alabama Arkansas Kansas
0.3 % 0.2 % 0.2 % 0.2 %
Louisiana New Hampshire Montana North Dakota
0.2 % 0.2 % 0.2 % 0.1 %
Maine Rhode Island Wyoming Hawaii
0.1 % 0.1 % 0.1 % 0.1 %
Nebraska New Mexico Oklahoma South Dakota
0.1 % 0.1 % 0.1 % 0.1 %
Utah Guam US Virgin Islands other
0.1 % 0.1 % 0.1 % 0.0 %
Fig. 1. Age and gender of the respondents for each country.
Fig. 2. Education of the respondents for each country.
2
c
S
. Experimental design, materials, and methods
The online survey has assessed the air quality as subjectively perceived by citizens in ten
ountries: Australia, Brazil, China, Ghana, India, Iran, Italy, Norway, South Africa and the United
tates. The online questionnaire was hosted on two platforms: Google Forms (English, Italian,

D.M. Barbieri, B. Lou and M. Passavanti et al. / Data in Brief 32 (2020) 106169 7
Fig. 3. Perceived amount of air pollution before (a) and during (b) the COVID-19 restrictions as experienced by the
survey respondents in each country.
Norwegian, Persian, Portuguese versions) and WenJuanXing (Chinese version) and promoted on
professional and social networks. The survey content was the same for each language; only the
question regarding the respondents’ geographical location was tailored for each country. A Likert
scale was employed to collect information about subjective perceptions [2] regarding both the
situation before and during the enforcement of the restrictions due to the COVID-19 pandemic
[ 3 , 4 ]. The online survey was distributed using a combination of purposive and snowball tech-
niques between 11-05-2020 and 31-05-2020. Previously, other opinion surveys at regional and
national scale also dealt with the perception of air quality [5–7] and examined the psychologi-
cal impacts on people’s subjective emotional state [8] . The created dataset can allow to explore
how air quality was experienced by the populations dealing with different levels of air pollution
before the COVID-19 outbreak [9–11] .
8 D.M. Barbieri, B. Lou and M. Passavanti et al. / Data in Brief 32 (2020) 106169
E
t
C
W
W
thics statement
All the survey respondents informed their consent before joining the survey consistent with
he Declaration of Helsinki.
redit Author Statement
Diego Maria Barbieri
Conceptualization, Methodology, Formal analysis, Investigation, Resources, Data curation,
riting - Original Draft, Visualization, Project administration
Baowen Lou
Conceptualization, Methodology, Formal analysis, Investigation, Resources, Data curation,
riting - Original Draft, Visualization
Marco Passavanti
Conceptualization, Methodology, Investigation, Writing - Original Draft, Visualization
Cang Hui
Investigation, Data curation, Writing - Review & Editing, Visualization, Supervision
Daniela Antunes Lessa
Investigation, Data curation
Brij Maharaj
Investigation, Data curation
Arunabha Banerjee
Investigation, Data curation
Fusong Wang
Investigation, Data curation
Kevin Chang
Investigation, Data curation
Bhaven Naik
Investigation, Data curation
Lei Yu
Investigation, Data curation
Zhuangzhuang Liu
Investigation, Data curation
Gaurav Sikka
Investigation, Data curation
Andrew Tucker
Investigation, Data curation
Ali Foroutan Mirhosseini
Investigation, Data curation
Sahra Naseri
Investigation, Data curation
Yaning Qiao
Investigation, Data curation
Akshay Gupta
Investigation, Data curation
Montasir Abbas
Investigation, Data curation
Kevin Fang
Investigation, Data curation
Navid Ghasemi
Investigation, Data curation
Prince Peprah
D.M. Barbieri, B. Lou and M. Passavanti et al. / Data in Brief 32 (2020) 106169 9
Investigation, Data curation
Shubham Goswami
Investigation, Data curation
Amir Hessami
Investigation, Data curation
Nithin Agarwal
Investigation, Data curation
Louisa Lam
Investigation, Data curation
Solomon Adomako
Investigation, Data curation
Declaration of competing interest
This research has not received any specific grant from funding agencies in the public, com-
mercial, or not-for-profit sectors.
Acknowledgments
The precious support kindly provided by the following academics, researchers and profes-
sionals has been greatly appreciated: Mr. Fabio Selva (Heilongjiang International University,
China), Mr. Marius Tangerås (Norwegian National Railway Administration Bane NOR, Norway),
Dr. Azadeh Lak (Shahid Beheshti University, Iran), Dr. Barbara Stolte Bezerra (Universidade Es-
tadual Paulista, Brazil), Dr. Xiaolong Sun (Guangdong University of Technology, China), Dr. Ka-
sun Wijayaratna (University of Technology Sydney, Australia), Dr. Abdul Rahaman (Bharathi-
dasan University, India), Dr. Dok Yen David Mbabil (Tamale Technical University, Ghana), Mr.
Smit Bharat Thakkar (Queensland University of Technology, Australia), Mr. Solomon Kwadwo
Achinah (University of Cape Coast, Ghana), Dr. Olaf Weyl (South African Institute for Aquatic
Biodiversity, South Africa), Mr. Ayush Dhankute (Atkins Ltd., India), Mr. Mohammadreza Zare
Reisabadi (University of Adelaide, Australia), Dr. Sachin Gunthe (Indian Institute of Technology
Madras, India), Dr. Issam Qamhia (University of Illinois at Urbana-Champaign, United States), Dr.
Parama Bannerji (West Bengal College, India), Mr. Amirhosein Mousavi (University of Southern
California, United States), Mr. Anshu Bamney (Rewa Engineering College, India), Dr. Yuefeng Zhu
(Shijiazhuang Tiedao University, China), Dr. Jorge Ubirajara Pedreira Junior (Federal University of
Bahia, Brazil), Dr. Andrea Colagrossi (Politenico di Milano, Italy) and Dr. Akhilesh Kumar Maurya
(Indian Institute of Technology Guwahati, India).
Supplementary materials
Supplementary material associated with this article can be found, in the online version, at
doi:10.1016/j.dib.2020.106169 .
References
[1] D.M. Barbieri, B. Lou, M. Passavanti, C. Hui, D.A. Lessa, B. Maharaj, A. Banerjee, F. Wang, K. Chang, B. Naik, L. Yu,
Z. Liu, G. Sikka, A. Tucker, A. Foroutan Mirhosseini, S. Naseri, Y. Qiao, A. Gupta, M. Abbas, K. Fang, N. Ghasemi,
P. Peprah, S. Goswami, A. Hessami, N. Agarwal, L. Lam, S. Adomako, Perceived air pollution in Australia, Brazil,China, Ghana, India, Iran, Italy, Norway, South Africa, USA before and during COVID-19 restrictions, (2020). http:
//dx.doi.org/10.17632/fb38h4tyzn.2 . [2] D. Stockemer, Quantitative Methods for the Social Sciences, Springer, Cham, 2019 https://doi.org/10.1007/
978- 3- 319- 99118- 4 .

10 D.M. Barbieri, B. Lou and M. Passavanti et al. / Data in Brief 32 (2020) 106169
[
[3] T. Acter, N. Uddin, J. Das, A. Akhter, T.R. Choudhury, S. Kim, Evolution of severe acute respiratory syndrome coro-
navirus 2 (SARS-CoV-2) as coronavirus disease 2019 (COVID-19) pandemic: A global health emergency, Sci. TotalEnviron. 730 (2020) 138996, doi: 10.1016/j.scitotenv.2020.138996 .
[4] Oxford University, Coronavirus government response tracker, (2020). https://www.bsg.ox.ac.uk/research/
research-projects/coronavirus-government-response-tracker (accessed June 30, 2020). [5] M. Nikolopoulou, J. Kleissl, P.F. Linden, S. Lykoudis, Pedestrians’ perception of environmental stimuli through field
surveys: Focus on particulate pollution, Sci. Total Environ. 409 (2011) 2493–2502, doi: 10.1016/j.scitotenv.2011.02.002 .
[6] T.G. Reames, M.A. Bravo, People, place and pollution: Investigating relationships between air quality perceptions,health concerns, exposure, and individual- and area-level characteristics, Environ. Int. 122 (2019) 244–255, doi: 10.
1016/j.envint.2018.11.013 .
[7] S. Pu, Z. Shao, M. Fang, L. Yang, R. Liu, J. Bi, Z. Ma, Spatial distribution of the public’s risk perception for air pollution:a nationwide study in China, Sci. Total Environ. 655 (2019) 454–462, doi: 10.1016/j.scitotenv.2018.11.232 .
[8] Y. Li, D. Guan, S. Tao, X. Wang, K. He, A review of air pollution impact on subjective well-being: Survey versusvisual psychophysics, J. Clean. Prod. 184 (2018) 959–968, doi: 10.1016/j.jclepro.2018.02.296 .
[9] P. Lal, A. Kumar, S. Kumar, S. Kumari, P. Saikia, A. Dayanandan, D. Adhikari, M.L. Khan, The dark cloud with a silverlining: Assessing the impact of the SARS COVID-19 pandemic on the global environment, Sci. Total Environ. 732
(2020) 139297, doi: 10.1016/j.scitotenv.2020.139297 . 10] S. Muhammad, X. Long, M. Salman, COVID-19 pandemic and environmental pollution: A blessing in disguise? Sci.
Total Environ. 728 (2020) 138820, doi: 10.1016/j.scitotenv.2020.138820 .
[11] A. Chauhan, R.P. Singh, Decline in PM2.5 concentrations over major cities around the world associated with COVID-19, Environ. Res. 187 (2020) 109634, doi: 10.1016/j.envres.2020.109634 .