survey design and analysis olawale awe lisa short course virginia tech april 1, 2014
TRANSCRIPT

Survey Design and Analysis
Olawale Awe
LISA Short Course
Virginia Tech
April 1, 2014

Laboratory for Interdisciplinary Statistical
Analysis
www.lisa.stat.vt.eduwww.lisa.stat.vt.edu
Our goal is to improve the quality of research and the use of statistics at Virginia Tech.

Laboratory for Interdisciplinary Statistical
Analysis
Collaboration From our website request a meeting for personalized statistical advice
Great advice right now:Meet with LISA before collecting your data
Short Courses Designed to help graduate students apply statistics in their research
Walk-In Consulting
Monday—Friday 1-3 pm GLC Video Conf. RoomMonday 3-5 pm Sandy Hall Room 312
Tuesday 11-1 pm PortWednesday 11-1 pm Old Security Building
for questions requiring <30 mins
All services are FREE for VT researchers. Note: We assist with research, not class projects or homework.
LISA helps VT researchers benefit
from the use of Statistics
www.lisa.stat.vt.edu
Designing Experiments • Analyzing Data • Interpreting ResultsGrant Proposals • Using Software (R, SAS, JMP, Minitab...)

Course Objective
The objective of this short course is to answer the following three broad questions:
1. What is a survey?
2. How can a good survey be prepared or designed?
3. What are the steps involved in analyzing a survey using SPSS/PASW?

Part One: What is a Survey?
• A measurement process that involves asking questions from respondents.
• A statistical method of collecting any new information that is expected to represent the views of the whole group or community in which a researcher is interested.
• Often the best way to get information and feedback for planning and improvement.

3 Categories of Surveys:
1. Case Study Survey– Collecting information from a part of a group
or community without trying to use them for overall representation of the larger population.
– Only provides specific information about the community studied.

2. Census Survey
• Carrying out a survey on every member of the population you want to learn about.
• Gives more accurate information.• Not very practical for large groups or
populations.

3. Sample Survey
• The type we’ll be focusing on today.• Involves asking a sampled portion of a
group to answer your research questions.• If done well, the results of the sample
survey will reflect the results we would get by surveying the entire group/population.
• More on this in the next slides.

Why Conduct a Survey?
• To collect information about the:– Behavior ̶ Opinion– Attitudes ̶ Perception– Reactions etc. of a population.
• To add credibility to your research.• A good source of primary information-
unlike written records.• Source of statistically valid information
about a large number of people.

Conducting a Survey: Why?
• To measure clients’ satisfaction and expectation.
• Are users/customers satisfied with the service you provide?

There are many ways to collect data besides surveys
• Direct measurements or observations: instead of asking someone how much water they use, install a water meter.
• Use existing data sources: collect data from the water utility board office (secondary data).
• The key concept of a survey is that one can draw conclusions about the overall population based on the results from a much smaller sample.

A survey should start with a research question
1. What are your questions?What do you want to know?
2. Do you need data to answer these questions? If so, what data do you need?
3. How will you collect these data?
Before carrying out a survey, ensure the information you need isn't readily available through other means!

PART TWO
DESIGNING SURVEYS

5 steps involved in designing a survey
1. Clearly define your research objectives (What do you want to know?).
2. Define the population to be sampled (Who or what do you want to know about?).
3. Develop a sampling plan.
4. Design a questionnaire to minimize errors and biases (How does each question relate to your research objectives?).
5. Pilot test and retest your survey (Fix errors and start again at Step 1).

Step 1: clearly define your research objectives
• State CLEARLY and CONCISELY your:– Overall research goals– Specific scientific questions
• Refer to these objectives constantly throughout the design of your survey to ensure your survey is answering the desired questions of interest.

Decide how to collect the survey data
• After we know what data we want to collect, who we want to survey, and how we ask the questions, we must determine the best instrument for collecting the survey data.
• Data collection options: Depends on the intended sample/population.– Personal Interviews (or Questionnaire)– Telephone Interviews– Mail Surveys– Email Surveys– Online Surveys (Qualtrics)

Step 2: Define the population to be sampled
• Subject: Any object we measurePlants, persons, pupils, etc.
• Sample: subset of the population to be measured (i.e., a group of subjects that represent the population)
• Population: representation of all the possible outcomes or measurements of interest.
Who will you interview to answer your research questions?Who has the answers to your questions?

Step 3: Develop a sampling plan• Once the target population has been identified, next the
sampling plan must be devised.• Goal: Randomly select a small percent of the population that
will in turn represent the ideas of the population as a whole.• The sampling plan involves:
– The technique used to select the subjects for your study.• Simple random sampling • Stratified random sampling• Cluster sampling • Systematic sample
– The number of people needed for your study.• Sample size calculations• Sample size chosen must be adequate

Simple random sampling• Subjects chosen by random mechanism.• Each subject has an equal chance of being in the study.• Easiest to summarize BUT most tedious to implement in
the field.
Hypothetical Example: Randomly select 10 students from the STAT 3005 class roster to ask a question.

Stratified random sampling• First divide population into strata (groups) based on
similarity.• Then randomly select subjects within each strata.
o Easier to implemento May result in more precise summary
Hypothetical Example: We can randomly select 5 males and 5 females from this present class to ask a question.

Cluster sampling• Population has many clusters.• First randomly select a number of clusters.• Then sample all the units within each cluster.
Hypothetical Example:Population: opinions of all students (attending class) at Virginia Tech.1. Randomly select a certain number
of classes.2. Ask all students in each class their
opinion.

Systematic sampling
• Select every kth subject from a list of all possible subjects.
Hypothetical Example:Telemarketers randomly sample every 10th phone number in the Yellow Book to make marketing calls.

Sample size calculations
• How many people do we interview on a survey?
Answer: It depends• Sample size calculations can be computed
using statistical software OR formulae (more on next slide).
• Sample size calculations revolves around some characteristics of the study:
Time, cost, precision required– The larger the sample size, the more
accurate a representative of the population your survey results would be.

Let n = sample sizeσ = standard deviationd = confidence interval
sizeα = significance level
Then, to obtain a 95% confidence interval, we need a sample size of:
Sample size calculation
2
1
2-1
2=n
d

Sample size calculation
For example, suppose we want an estimate for a 95% confidence interval with 0.2 margin of error. If we know from a pilot study that the standard deviation of the population is 1, then,
σ = 1d = 0.2α = 0.05ϕ depicts corresponding value read from Z-
table(1.96) Plugging these values into the previous equation, we get,
n = 384.15
Which means we need to sample 385 people.

Step 4: Minimize biases and errors when designing the questionnaire and
sampling planThree major types of biases and errors:1. Selection bias or coverage error:
Your sample is not representative of your population.- See a statistician for help or use sample size software .
2. Nonresponse bias:Those who respond to your survey are different in important ways from those who choose not to respond.Possible Solutions:– Provide incentives for completing survey.– Explain why the survey is important.– Keep the survey short and interesting.
3. Measurement error:- Survey responses are inaccurate.

Measurement error
• Definition:– Inaccurate answers to survey questions
(sometimes due to lack of clarity in writing).• Problems:
– Makes it difficult to judge if answers are accurate.– May lead to incorrect conclusions about target
population.• Possible Solutions:
– Write clear, concise questions.– Be aware of social factors that may influence
responses.– Explain why the survey is important.

Keep the questionnaireas short as possible
• Follow the “KISS” method meaning “Keep it simple and specific!”
• Categorize questions into 3 groups:– Must Know– Useful to Know– Nice to Know
• If the questionnaire seems too long, start omitting the “nice to know” questions.
• Don’t keep asking questions that are not pertinent.

Questions can be in 4 major forms:1. Open Ended• Designed to prompt the respondent to
provide you with more than just one or two word responses.
• These are often How or Why questions.• Drawback: It’s harder to compile their
results.
2. Closed Ended• Also known as forced-choice questions.• Specific questions that elicit YES or NO
responses.• e.g. Do you eat apples?• Easier to analyze.

Type of Questions Cont’d
3. Multiple Choice• Allow respondents to choose one or more answers from a
few possible choices.• Elicit more details than close-ended questions.• Results can be compiled more easily than in open-ended
questions.
4. Likert Scales• Respondents are asked to rate items on a response scale.• You might sum a respondent’s ratings for all of the items.• Can be done without a neutral category.
e.g. The police have done enough to prevent crime in Virginia.Strongly Agree() Agree() Strongly Disagree() Disagree()

More Tips on Questionnaire Design
• Always include preambles.– It should contain what you want to do and why.
• Address sensitive questions as discretely as possible.– e.g.: Are you infected with any STD?
• Avoid words that provoke bias or emotional response.– e.g.: Why do you believe in gay marriage?
• Place similar questions together logically.• Keep the survey goal in mind while formulating the
questions.• Avoid putting too much into a single page.

Save demographic questions forthe end of the survey
• The following demographic questions should be saved for the end of the questionnaire:
Age, education, income, martial status, etc. • Ensures that respondents will not feel that they are losing
their anonymity when answering the rest of the questions.• Choose the most important questions for your survey to be
asked at the beginning of the survey.• Ensure anonymity as much as possible.• Don’t ever make a questionnaire that you cannot analyze!

Avoid double-barreled questions
• Refrain from having two concepts embedded in one question.
Example:
“Do you have time to read the newspaper every day?” • Notice you are asking about “time” and “reading the newspaper every
day”.
Revision:
“Do you read the newspaper every day?”• If the answer is no, you can create a question to determine the reasons the
person does not read the newspaper.

Convert opinions and words into numbers using the Likert scale
• Gives you more information than yes/no responses.– Respondents are able to select a
number or category that represents their answer to the survey question.
– A Likert item is question or statement on a questionnaire where the respondent gives a rating for their response on a topic.
– The rating is usually the level of agreement the respondent has concerning the statement or question.
– A Likert item is balanced, meaning there is an equal number of positive and negative positions.
– More example in the handouts.
http://en.wikipedia.org/wiki/File:Example_Likert_Scale.jpg

Convert opinions and words into numbers using the Likert scale
• The 5-point and 7-point scale responses are the most common. • Make sure the visual middle option actually corresponds to the
middle value:
Example:
Revision:
• Likert items can be analyzed separately or the items may be summed and the sum can be analyzed. The sum of Likert items is called the Likert scale.
Disagree Neither agree or disagree Slightly Agree Agree Strongly Agree
v
Disagree Slightly Disagree Neither agree or disagree Slightly Agree Agree
v

Step 5: Pilot test (and retest)your survey
• You should pretest the survey on a smaller sample whenever possible!
• This pilot test can:
- Allow you to revise the questionnaire if needed.
- Allow you to create a closed question from the responses for an open question.
- Help you estimate the variability in the responses to your questions and determine the necessary sample size.

Let’s have a break for a few minutes!
37
ANALYZING AND REPORTING YOUR
SURVEYS
PART THREE

Survey data must be processed, analyzed, and reported
• Code or input your data onto a computer.• Clean your data—start with the most
important variables:
1. Ensure all data are in the correct format.
2. Decide what to do with missing data or outliers.
3. Detect outliers and coding errors by visual or graphical inspection.

The quickest statistical analysis is often just a plot or graph of your data • Summarize your data one variable (e.g. height) at a time.
Histograms show the distribution of the data points

Plot two quantitative variableson a scatter plot
• The relationship between two quantitative variables can be visualized in a scatter plot and quantified by correlation or regression.

Some Tips• Different statistical procedures are appropriate for different
types of data (more on next slides).• Questionnaire derived data are generally likely to require
non-parametric techniques (does not require normality assumption).
• Exceptions exists when you ask the respondents to fill in their height, weight, scores, or income (continuous variables).
• The mean of a categorical variable is meaningless!– Instead, use mode, frequency tables, and cross
tabulations to summarize categorical or ordinal variables.– You can also use bar charts or pie charts!

What kind of data do you have?Data Type Description Examples Summary
Statistics
Nominal Data with no intrinsic relative meaning behind labels
Black, White, Hispanic
Mode
Ordinal Data with an ordered structure
Small, Extra Large, Likert Scale*
Median and Percentiles
Interval (continuous or discrete)
Data with meaningful difference relations
Degrees in Celsius, Birthdates, GPS Coordinates
Mean, Standard Deviation, Correlation
Ratio (continuous or discrete)
Data with scale relations Weight, Income, Length
Mean, Standard Deviation, Correlation

What type of technique should you use?
Explanatory Variable(s)
Categorical Continuous Categorical & Continuous
Response
Variable
Categorical Contingency Table or Logistic Regression
Logistic Regression
Logistic Regression
Continuous ANOVA Regression ANCOVA orRegression with categorical variables
44
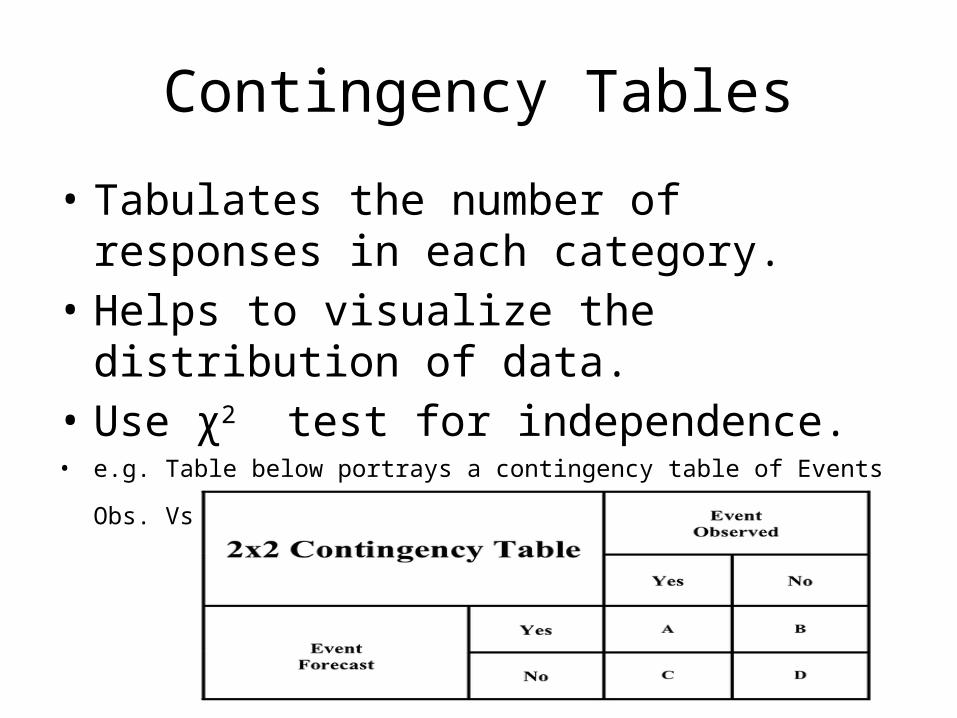
Contingency Tables
• Tabulates the number of responses in each category.
• Helps to visualize the distribution of data.• Use χ2 test for independence.• e.g. Table below portrays a contingency table of Events Obs. Vs Events
Forecast in a survey.

Analysis of Variance
• Technique used to test the differences between more than two groups.
• Always plot your data before doing analyses.

Regression
• Actually a generalization of ANOVA.– Possible types include multiple, logistic, binary regression etc.

Practical Illustrations
1. Qualtrics survey.
2. DEMO: Analyzing survey data on ‘‘Statistics Education in Nigeria’’ using SPSS/PASW.
• Note: It only takes SPSS a few seconds to do what might take you all day to sort out manually.
• Note: Don’t just copy and paste the results from SPSS. You might need to create a fresh table to input your output in a neater format while reporting your survey (See example in paper above).

References• Dillman, Don A., Jolene D. Smyth, and Leah Melani Christian.
Internet, Mail, and Mixed-Mode Surveys: The Tailored Design Method. 3rd ed. Hoboken, NJ: John Wiley & Sons, Inc, 2009.
• Lietz, P. (2010) Research into Questionnaire Design. International Journal of Market Research, 52, 2, pp. 249-272.
• Scheaffer, Richard L., William Mendenhall III, and R. Lyman Ott. Elementary Survey Sampling. 6th ed. Belmont, CA: Duxbury, 2006.
• http://en.wikipedia.org/wiki/Likert_scale• http://www.surveysystem.com/sdesign.htm• http://www.csudh.edu/dearhabermas/sampling01.htm • http://www.youtube.com/watch?v=53mASVzGRF4• LISA, http://www.lisa.stat.vt.edu/, Eric Vance short course.
